PATHWAYS FORWARD

December 2021 TURNING ENERGY VS. CLIMATE INTO ENERGY AND CLIMATE IN A POLARIZED WORLD THE PATHWAYS ALLIANCE: FORGING THE OIL SANDS PATH TO NET ZERO ALBERTA THERMAL OIL SANDS CAN ACHIEVE COST AND CARBON COMPETITIVENESS SAGD RESERVOIR CHARACTERIZATION CONSIDERATIONS– PART 2 OF 2 PAST, PRESENT, AND FUTURE APPLICATIONS OF GEOPHYSICS IN OIL SANDS - PART 1 OF 2
A MESSAGE FROM THE CHOA BOARD
WHAT mAKeS cHOA mATTer?
CHOA IS CELEBRATING 35 YEARS!
It’s my great pleasure to introduce you to the second issue of CHOA’s 35th Anniversary Journal. The first, in October, was met with widespread delight, a modicum of relief, and a massive increase in uptake and interest.
That’s great, of course, but what makes CHOA and its Journal even matter? Answer: Our shared vision for Canada to be the world’s most responsible and innovative oil producer.
OUR INDUSTRY’S FUTURE
We know our industry will play an essential role through the energy transition and beyond as a premier source of clean energy and raw materials that society will need for decades to come. All we have to do is transform. Completely. Across most of our value chain ...
That’s where CHOA makes its contribution: connecting, synergizing, amplifying the initiatives of our members and sponsors with stakeholders to begin to discern, define and drive down pathways to our prosperous future.
HOW CAN YOU MAKE A DIFFERENCE?
Share your knowledge – step up and provide engaging technical or contextual content to CHOA’s audience through an article, webinar, presentation, or podcast.
Contribute your energy – attend our technical and networking events and consider supercharging your impact through volunteering with us. After all, it’s really more about the people than the pipes.
Offer your financial support as an annual or event sponsor or advertiser. We especially thank those of you who are doing several or all of the above.
As we enter our sponsorship and membership renewal season, please take a moment to visit our website – learn about how you can become a member or sponsor to fully experience all that we have to offer.
And we know we can do this because one important thing we have learned through the challenges of the past 35 years is that we are always Stronger. Together.
AND WHY THE CHOA JOURNAL?
In this era that is often defined by short and shallow, the Journal is uniquely positioned to deliver calibrated depth, that right amount of time for comprehension and contemplation, and vital space for ideation leading to action. All delivered in an accessible digital format serving up bite-sized chunks.
We call it “Transforming our Industry’s Future” –and we invite you to join us.
CONNECT. SHARE. LEARN. LEAD.
Sometimes it probably seems too hard, the chances of failure too daunting, our creativity and drive insufficient.
“We know our industry will play an essential role through the energy transition and beyond”
“CHOA ... connecting, synergizing, amplifying the initiatives of our members and sponsors...”
cHOA JOUrNAL — December 2021 1
Gordon
Holden, CHOA Board Member


OCTOBER 2021 Table of Contents THE JOURNAL OF THE CANADIAN HEAVY OIL ASSOCIATION December 2021 /CANADIAN-HEAVY-OIL-ASSOCIATION /CANADIANHEAVYOILASSOCIATION @CDN_CHOA CHOA.AB.CA +1 403 269 1755 Statements and content herein are those of the authors and contributors, and do not necessarily reflect the views of CHOA, the editors, or organizations with which the authors or contributors may be affiliated. Dissemination of information by CHOA does not indicate CHOA’s endorsement of any product, technology, strategy or company presented herein. Many thanks to our volunteers on the Editorial Committee, the GLJ layout team, and the CHOA office team for their efforts and contributions to this Journal. 5 CELEBRATING CHOA 13 TURNING ENERGY VS. CLIMATE INTO ENERGY AND CLIMATE IN A POLARIZED WORLD 17 PROFILE - GLJ LTD 20 THE PATHWAYS ALLIANCE: FORGING THE OIL SANDS PATH TO NET ZERO 23 ALBERTA THERMAL OIL SANDS CANACHIEVE COST AND CARBON COMPETITIVENESS 30 SAGD RESERVOIR CHARACTERIZATION CONSIDERATIONS– PART 2 OF 2 37 PAST, PRESENT, AND FUTURE APPLICATIONS OF GEOPHYSICS IN OIL SANDS - PART 1 OF 2 cHOA JOUrNAL — December 2021 2
Responding to the energy transition

Championing a low carbon future.
For centuries, we’ve relied on fossil fuels. Today, the realities of climate change are transforming the global energy mix, and our world. Tackling climate change will require a major shift to less carbon intensive forms of energy and to a more sustainable future. As industrial enterprises are accelerating efforts to reduce their energy intensity and to decarbonize their processes through technologies such as carbon capture, we can help
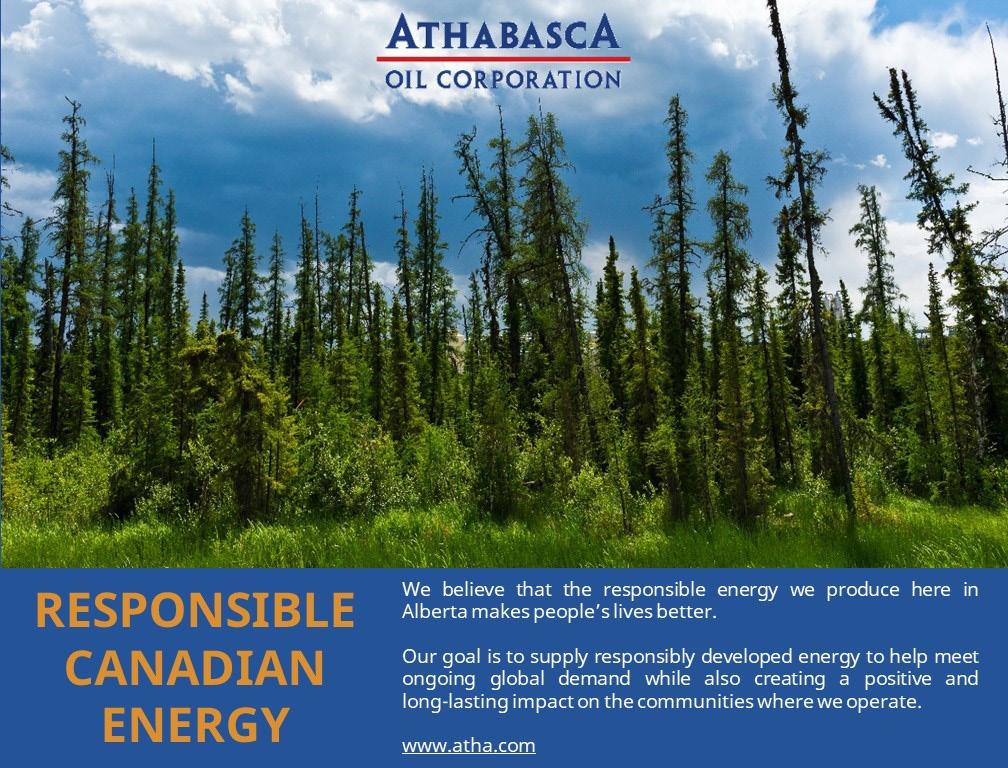
We’re responding to this profound transformation by providing our clients with responsible energy solutions that will shape a new energy landscape to achieve a low carbon future
We’re optimistic about the future. About reducing carbon emissions from oil and gas. About maximizing green technologies and about providing accessible and sustainable energy for all.
Contact us at hatch.com


one step ahead of the next big thing Learn how.albertainnovates.ca
BECOME A CHOA ANNUAL SPONSOR? Simply: EXCEPTIONAL VALUE Amplified corporate profile via CHOA publications and events. Exclusive CHOA memberships for your staff. Preferred access to CHOA content and activities. Flexcredits. And so much more. Contact us now at OFFICE@CHOA.AB.CA CONNECT. SHARE. LEARN. LEAD.
WHY
celebrating cHOA
along with our memberS, VOLUNTeerS and SPONSOrS
It’s a BIG DEAL We’re 35 and we wouldn’t be here without YOU! Here’s to our shared future. Transforming energy, making a difference. En route to Canada becoming the most responsible and innovative energy resource developer in the world. We are STRONGER, TOGETHER!


cHOA JOUrNAL — December 2021 5
cHOA JOUrNAL — December 2021 6

cHOA JOUrNAL — December 2021 7

cHOA JOUrNAL — December 2021 8
cHOA JOUrNAL — December 2021 9
Canada is home to some of the world’s most innovative energy developers. That innovation doesn’t happen in isolation – it’s due in part to the inventiveness and collaboration exemplified by the Canadian Heavy Oil Association and its members.
Innovation grows the economy, expands markets and creates new opportunities. The need to innovate has never been more important. Information and technology are changing every aspect of business and community life - from the digital oilfield to predicting outcomes in health, saving money and producing better results.
When CHOA first started, SAGD extraction was just a dream. Now, producers are looking to next-gen evolutions of that process, and beyond.
Alberta Innovates is here to do our part, with our applied research subsidiaries InnoTech Alberta and C-FER Technologies. We foster and fund the latest technology developers, we look for solutions that will open new markets and new opportunities for heavy oil. Together we can develop technologies and innovations that will enhance productivity; diversify energy products; add value to hydrocarbon resources; reduce carbon emissions; and improve ESG performance.
Congratulations on an impressive 35 years of innovation and service. We are here to collaborate and provide our best thinking for the next 35.
Laura Kilcrease Chief Executive Officer Alberta Innovates

cHOA JOUrNAL — December 2021 10


TURNKEY SOLUTIONS that add Power to your Portfolio and Streamline your Project. From HipVap and Orsico to PadHX Well Pad solutions, see how the Scovan Group is leading the future of energy. scovan.ca WE INSTANTANEOUSLY BREAK THE EMULSION See it in action with SAGD in this short 3 minute video: https://bit.ly/3g5wuqJ info@alfaluz.ca www.alfaluz.ca We're an innovative engineering and manufacturing company with a disruptive technology bringing economical and green solutions to the production and commercialization of bitumen and heavy oil. Our plug-and-play M-CRACK system is much faster, more economical, and more e ective at doing what other companies spend tens of millions of dollars trying to accomplish:
FUTURE THINKING.
For 50 years we have helped our clients navigate the emerging energy landscape. As we enter a New Year, we are optimistic about the future of global energy for both the planet and its people.
gljpc.com
Happy Holidays from GLJ, Your Global Energy Partners.
Turning energy vs. climate into energy AND climate in a Polarized World
BY DAVID L. MILIA, PRESIDENT & CEO, CANADIAN ENERGY & CLIMATE NEXUS
WHAT POLARIZATION IS, AND HOW IT DISPLAYS ITSELF IN CANADA

Are you polarized when it comes to looking at energy development and climate change? If you answered no, ask yourself if any of the following statements resonate with you:
• We need to transition away from fossil fuels towards renewable energy
• The world is addicted to fossil fuels, and while that is still the case, the best option is Canadian fossil fuels
• Scientists agree that we are in the 6th mass extinction event of life on earth
• Climate Change is just a myth
• That “boomer” generation is short-sighted and has no notion of the terrible legacy they are leaving to future generations
• Nothing is predictable or forecastable, so better not to do anything
If one or more resonate with you, there is a strong probability you have been exposed to information, factual or compelling, and have now adopted that ideation. Unfortunately, the complexity that surrounds balancing energy development and the challenges associated with climate change is too significant to allow for just one approach. The result? An environment where divergence towards being “right” has negated the ability to collaboratively tackle complexity and instead perpetuates polarized views amongst Canadians.
Figure 1: Angus Reid (iii)
Before continuing, let’s take a step back; what exactly is polarization? The Oxford dictionary defines polarization as: “The division into two sharply contrasting groups or sets of opinions or beliefs.” There was a time when many required this definition, but today there are few who have not seen polarization in action or are not active participants in a polarized position on a myriad of topics.
Naturally, polarization has evolved throughout the discussion of the future role of various energy ecosystems and how they relate to Climate Change. The clearest example of this in the public spectrum revolves around what the future energy mix should be comprised of, either fossil fuels or renewable energy sources, and creates positions pushing one option or the other rather than both. Given both positions have factual support that exemplifies their inherent advantages, proponents of each can point to truthful examples of why one is superior. A study conducted in 2019, just before a federal election in Canada, demonstrated that most Canadians placed a high value on renewable development. The same study also showed Canadians were more divided on the importance of oil and gas in the future, but most believed that this sector played a vital role in Canada’s economy. Not surprisingly, when another federal election was called two years later, climate change remained as one of three most important topics, as can be seen in Figure 1.
Suppose the assumption can be made that most Canadians enjoy energy security, that climate change needs to be addressed, and that we currently don’t have a fully functional replacement for fossil fuels. In that case, it seems likely that polarization will continue. Based on a study conducted by The University of California at Berkeley, there is mounting evidence from our neighbours to the south that polarization has a tangible negative cost should the same conditions be replicated in Canada. This study delimited 14 negative consequences to increased polarization, some which are notably alarming, such as how it affects the family unit, how it makes us less likely to help one another, how it impacts our personal health, how it leads to violence, but most importantly, how it makes problems harder to solve even when there is agreement in place. Put all this into context, and it becomes clear why our progress on energy and climate change, although significant, is suffering.
OPINION
cHOA JOUrNAL — December 2021 13
Astro-turfing:
the next great import from the United States
As the world technologically advances in big data, artificial intelligence (AI) and the internet of things (IoT), sophisticated digital tools have also evolved to exploit public opinion and manipulate or influence political outcomes. An example of this brought to light can be seen via the Cambridge Analytica Files piece done by The Guardian commencing in 2018 , where a link was made between social media and a group using such tools to manipulate political outcomes. Yet more concerning than this is the rise of what is now commonly known as “Astro-turfing,” which is: “The deceptive practice of presenting an orchestrated marketing or public relations campaign in the guise of unsolicited comments from members of the public.” It is no coincidence that Astro-turfing was born in the early 2000s with the rise of the millennial generation, social media, and the popularization of issues such as climate change and industrial regulation. This transition led to the establishment of multiple political lobbying pushes masquerading as grassroots efforts. There are examples of such groups on both sides of Canada’s energy/ climate change narrative, most notably seen through political campaigns. In politics, as in polarized topics, the evidence points to negativity being the driver in successfully pulling individuals into “camps.” This emotional draw may occur because the average individual has no interest in, nor has conducted research on, topics that can be simplified into a polarized position. If a polarized position is presented in a manner that incites fear or enrages the target audience, its outcome generally leads that audience into a polarized camp. When that message comes from what is perceived as a “grassroots” group, its influence increases, particularly where no obvious link exists between the party pushing for a specific outcome and the grassroots group created to push for it. This practice has become so commonplace, that when any link of potential Astro-turfing exists, it too
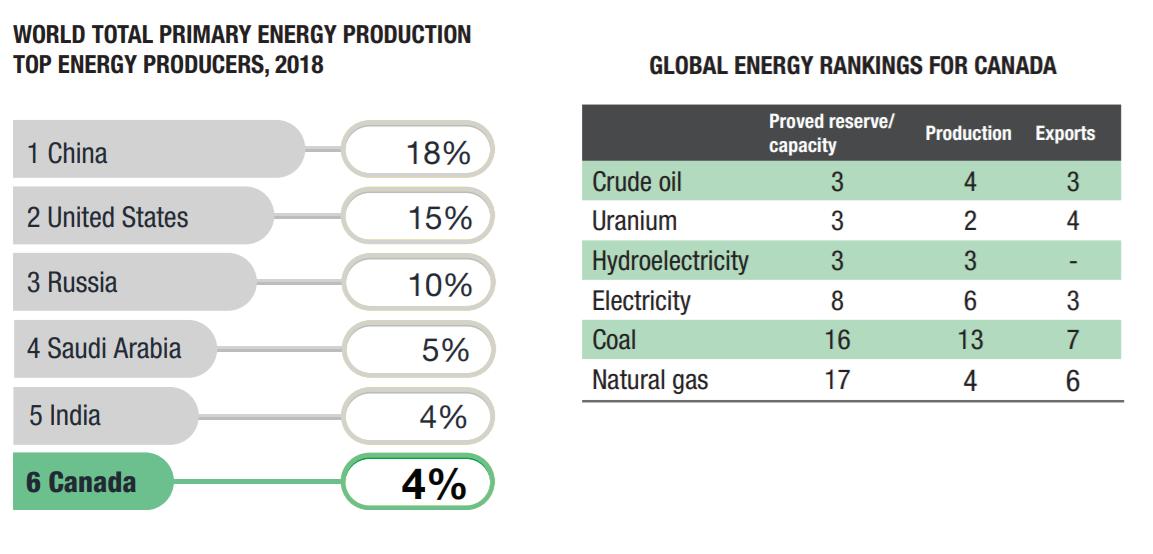
Figure 2: The Canadian Factbook (XI)
makes the headlines and becomes a point for public polarization via media stories. One such recent example can be seen via the financial support given to the Center for Technology and Civic Life (CTCL) and the Center for Election Innovation and Research (CEIR) using donations received from Mark Zuckerberg in the amount of $419M which was alluded to be linked to Democratic results in the 2020 United States Election.
Canada’s great resource and climate leadership potential
So, what exactly is at stake if polarization continues? Quite a lot as it turns out, as Canada currently provides about 4% of the worlds total primary energy production and ranks in the top 10 amongst various energy industries, shown by The Canadian Factbook in Figure 2.
Although we technically export energy to over 141 countries, when over 90% of those exports are earmarked for our neighbours to the south, it can be argued we are entirely dependant on the United States for much of the economic benefit of Canada’s current energy plays.
Given Canada is the second largest country in the world by land area and has a disproportionate amount of the world’s natural resources, it has a toolkit of options at its disposal as steward of those resources. Furthermore, there is a largely untapped opportunity to authentically engage the Indigenous peoples of Canada who have a long-lasting legacy of having an intricate, respectful, and protective relationship with Canada’s natural environment
.
“There is a largely untapped opportunity to authentically engage the Indigenous peoples of Canada who have a long-lasting legacy of having an intricate, respectful, and protective relationship with Canada’s natural environment.”
cHOA JOUrNAL — December 2021 14
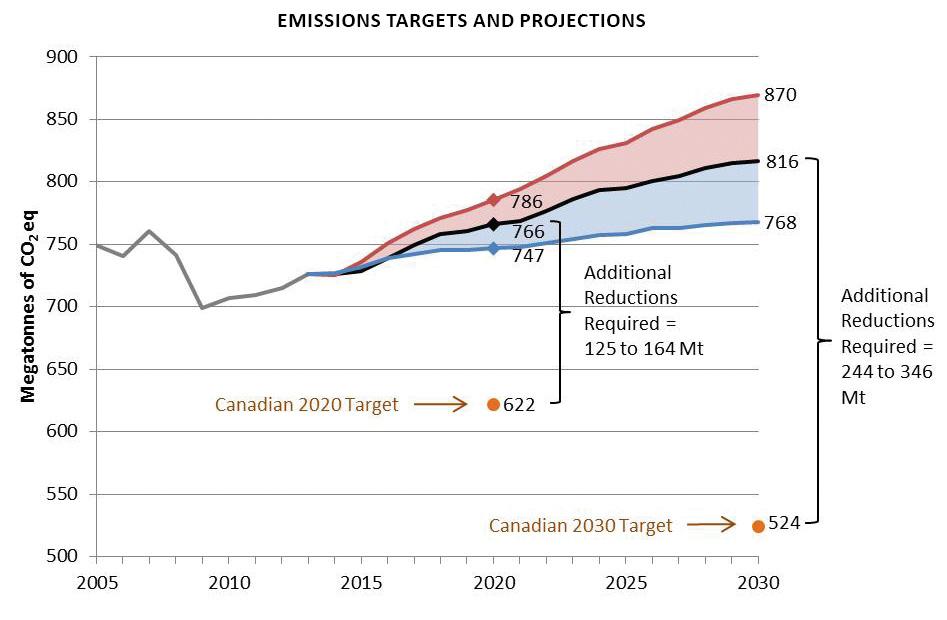
Canada’s greenhouse gas emissions projections when linked to federal reduction targets demonstrate a weakening relationship between economic and emission growth. Where although emissions are projected to decrease by 9% between 2005 and 2030, GDP is projected to increase by 54% over the same period. Projections by the Federal Government vary when comparing what they describe as “with current measures” with two alternative projections when different economic and energy pricing alternatives are put into place. Regardless of projection, to date, Canada is falling short of the 2020 and 2030 targets they have set for themselves as shown in Figure 3.
Breaking Polarization via Shared Values
Ongoing research conducted by The Canadian Energy and Climate Nexus in partnership with Dr. Lianne Lefsrud from the University of Alberta and others, indicates that emotions are likely to trump any type of data driven push when it is aimed at the overall public. These studies indicate that human judgement can be mostly estimated by applying computational models into two key emotions-based dimensions:
1. Valence: Whether a thing is good or bad (pleasure/ displeasure)
2. Arousal: How good or bad a thing is and its likelihood of motivating action
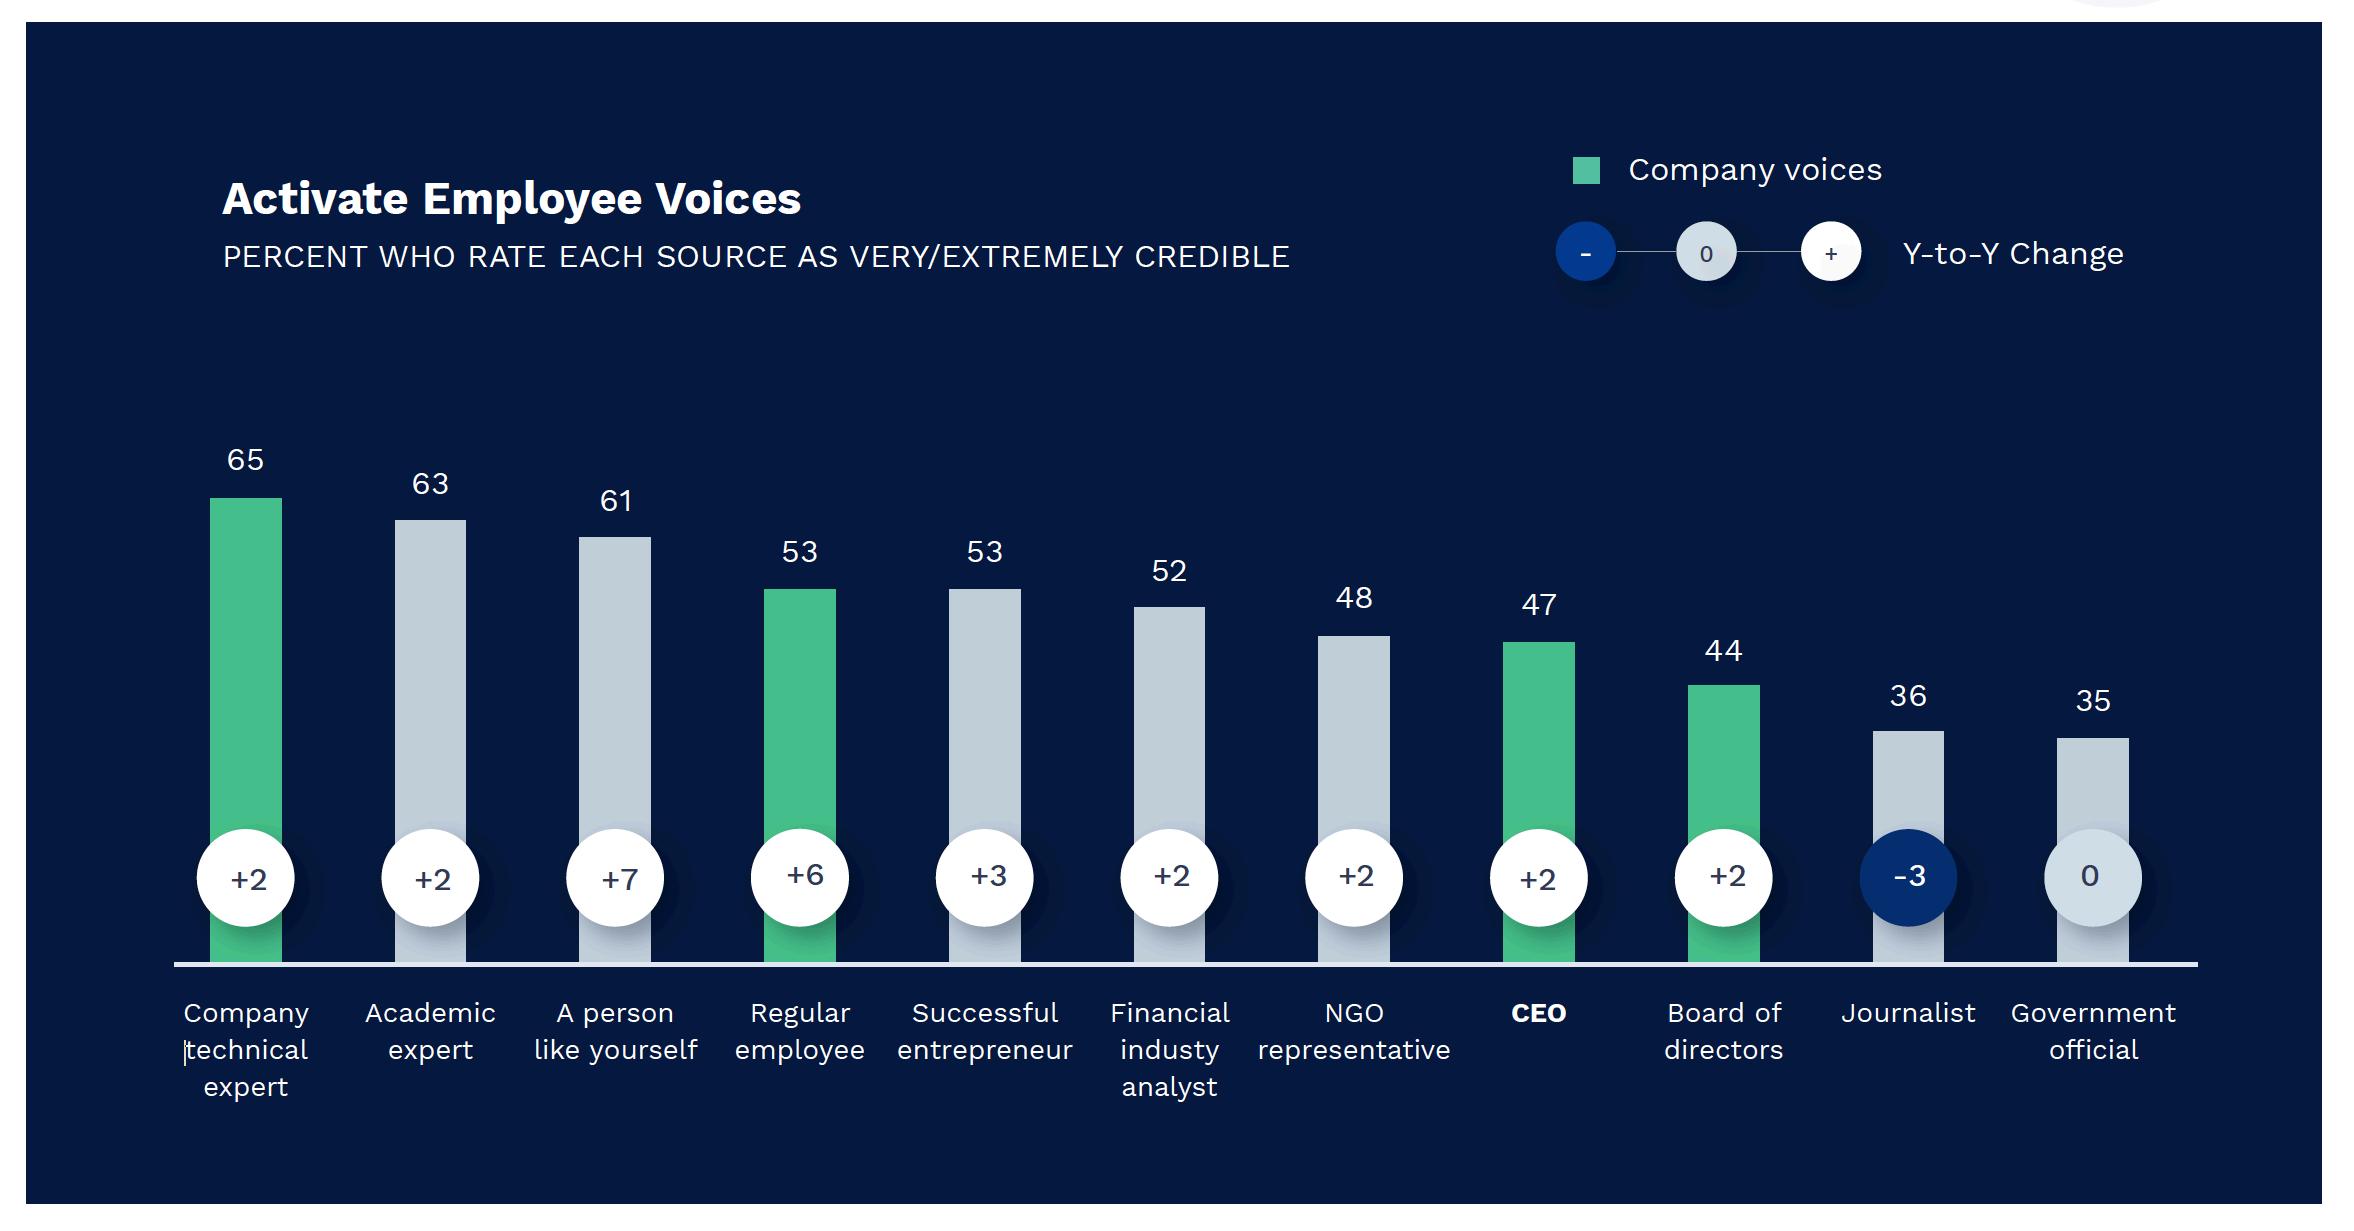
When applied to the various polarized narratives on energy and climate change, a clear picture emerges of where emotional parameters - not always being tied to facts, capabilities, or reality - often can influence action. It is important to note again, that these dimensions are linked to the public and not to an employee-based organization where a technical expert, academic expert, or those who share technical views are the most credible sources of information. This concept is exemplified by research put forward via the 2019 Edelman Trust Barometer, shown in Figure 4. One potential avenue to breaking polarization lies within the application of shared values. These values transcend where in Canada we live and what energy industry we believe is best suited to tackle the energy and climate challenges of the future.
Harvard’s Dr. Michael Porter described the challenge we face today in the following manner: “Capitalism is suffering from a crisis of trust. Today’s businesses take the blame for many of society’s economic, social, and environmental woes, despite the launch of countless corporate social responsibility initiatives in recent decades. Now more than ever—amid a global economic crisis that has strained the capacity of governments and NGOs to address complex societal challenges—it is time to restore public trust through a redefined vision of capitalism with the full potential to meet social needs.”
Figure 3: Government of Canada (XIII)
cHOA JOUrNAL — December 2021 15
Figure 4: Edelman Trust Barometer, 2019 Annual Global Study (XV)
Based on this, one potential solution to the energy and climate change challenges that Canada faces can potentially be addressed by consciously stepping over polarization to find common ground represented by one unifying shared value . That value will need to include economic drivers, value for society by addressing its needs and challenges, and addressing environmental and climate change imperatives . Today, this drive is commonly parked under Environmental, Social, and Governance (ESG) initiatives that incorporate many PostBrundtland Commission sustainability-based imperatives. One methodology to developing balanced ESG approaches gaining international support is “dynamic materiality” developed by Truvalue Labs (TVL). This approach recognizes the role of materiality in corporate reporting, how it is in a constant state of flux, and how it influences decision-making. As it pertains to the oil and gas sector, applying ESG norms to their business is becoming increasingly critical given the current investment atmosphere. BNN Bloomberg demonstrated this recently by comparing current $80 a barrel pricing to the last time such prices were the norm in 2014. Concluding that although barrel pricing is the same as in 2014, company stock valuations are currently 26% lower then they were in 2014. The reason? Back in 2014 there were fewer ESG institutional constraints from the market.
Conclusion - Your Role
So, what can we take away from all of this? Hopefully not just that we are becoming more entrenched and divisive, or that polarization can have strong negative consequences. As a CHOA stakeholder there is a high probability that in reading this you have a strong technical expertise from the industry you are a part of but have your considered the following:
• Are you able to consider the views of others when not linked to some form of empirical data that makes their proposition “right”?
• Are you aware that you too are governed, either consciously or unconsciously, by your emotions?
• Do you realize just how valuable the work you do is if it could be shared with other industries who currently would not collaborate with you or your industry?
The solution to Canada’s polarization challenge that is impeding our future potential can be simply into two key mandates that everyone can decide for themselves:
1. Consciously park whatever polarized position you have, regardless of empirical proof, and first find a shared value with the groups who currently you are un-aligned with in order to gain goodwill and trust to have the tough conversations.

2. To actively be aware of how your emotions, particularly those in the negative realm such as anger, frustration, and anxiousness, push you to further engrain yourself within your position, and fight them so they don’t hinder your ability to work on a complex problem with others.
At The Canadian Energy and Climate Nexus, we believe that a climate friendly energy system for Canada is possible and essential and are working with and for people from all sectors to create an energy and climate future for Canada. Polarization has largely robbed us of being able to leverage our advantages amongst the many energy systems, many stakeholders, and many approaches available to us. The answer is to combine the joint expertise of our energy industries and jointly and authentically look to address, adapt, and evolve them. In essence, we need to imperfectly achieve something together, rather than be perfectly “right” and have no progress on energy and climate in Canada . This means we must stop arguing for one form of energy OR another and instead pursue shared values that create one form of energy AND another AND another AND another.
In concluding, you may naturally be asking yourself who has done this successfully before? Are there any case studies from which to draw some lessons learned? The answer is yes, so please stay tuned for the next issue of The Journal where we will follow up this article with some examples from which any practitioner can draw from.
REFERENCES
Comprehensive references for this article are located online.
David is the President and Chief Executive Officer of the Canadian Energy and Climate Nexus. David has worked as a specialist and advisor for engineering firms, and large energy corporations. His academic experience includes: the Academic Chair for the B. Sc. in Construction Project Management at SAIT, the Chairman of the Canadian Coalition for Green Finance, and the Director of Strategic Centre Initiatives at the Haskayne School of Business at the University of Calgary which included leading the Hunter Centre for Entrepreneurship and Innovation, the Centre for Corporate Sustainability and Energy and Environment Initiatives. David is also an MBA sessional Instructor for “Business of Oil & Gas” and “The Business of Cleantech”.
“We must stop arguing for one form of energy OR another and instead pursue shared values that create one form of energy AND another AND another AND another.”
David L. Milia
cHOA JOUrNAL — December 2021 16
PrOFILe ArTIcLe Profile - GLJ Ltd cHOA JOUrNAL — December 2021 17
Engineering a net-zero world.


will
here to learn about SCORE - our industry leading decarbonization project methodology
THE JOURNAL?
TO HELP PUBLISH THE JOURNAL?
like
•
• graphics
• marketing and
OFFICE@CHOA.AB.CA
SHARE. LEARN. LEAD.
Wood believes a net-zero world is possible We are on a quest to unlock solutions to the world’s most critical challenges – working with our clients through an energy transition, discovering answers that
create a cleaner, more efficient future Click
LIKE
LIKE
Contact us if you’d
to be part of
project managing
or layout • writing/bringing in content
advertising Contact us now at
CONNECT.

INDUSTrY
Image courtesy of Athabasca Oil Corporation cHOA JOUrNAL — December 2021 19
A NEW SECTION OF THE CHOA JOURNAL. Shorter, newsier content. Business and technical. CONNECT. SHARE. LEARN. LEAD.
brIeFS TecH FLASHeS
The Pathways Alliance: Forging
Oil Sands Path to Net Zero
 BY THE PATHWAYS ALLIANCE
In June, the Oil Sands Pathways to Net Zero initiative was launched to chart real, workable solutions to the critical challenge of climate change. The Pathways Alliance is now comprised of six companies (in alphabetical order): Canadian Natural Resources, Cenovus Energy, ConocoPhillips Canada, Imperial, MEG Energy and Suncor Energy, operating facilities representing approximately 95 per cent of Canada’s oil sands production.
The Pathways Alliance has a phased approach that includes continuing our efforts to reduce emissions today, while deploying existing and ground-breaking new carbon reduction solutions on an unprecedented scope and scale. The implementation of our vision will be a significant step in helping Canada meet its Paris Agreement commitments and 2050 net zero aspirations.
While great advancements are being made in the development of renewable and other energies, all internationally recognized forecasts indicate that oil will continue to be an essential part of the global energy mix to 2050 and beyond. Given Canada’s global leadership on all other environmental, social and governance measures, our vision is that Canadian oil sands production with net zero emissions should be the globally preferred source of this continued demand. Our energy will provide long-term security for
Canada and our trading partners and will continue to support jobs, create new clean-tech industries and spur economic growth for our country.
The objective of reaching net zero emissions will rely heavily on technology and innovation and requires significant investment from both industry and the federal and provincial governments. As there is no single solution to get us there, our initiative will include several parallel pathways to address GHG emissions.
INDUSTrY brIeF
the
“The Pathways Alliance is continuing our efforts to reduce emissions today, while deploying existing and ground-breaking new carbon reduction solutions on an unprecedented scope and scale”
cHOA JOUrNAL — December 2021 20
“Our vision is that Canadian oil sands production with net zero emissions should be the globally preferred source”
The foundation of the Pathways vision is the development of a major carbon capture network. This includes a carbon capture utilization and storage (CCUS) transportation line connecting oil sands facilities in the Fort McMurray, Christina Lake and Cold Lake regions of Alberta to a carbon sequestration hub near Cold Lake. The transportation line will be scalable to gather captured CO2 from more than 20 oil sands facilities and transport it safely to the sequestration hub for storage. The carbon capture network will also be available to other producers and industries interested in capturing and sequestering their own emissions.

The Pathways CCUS project is similar to other projects already in service or under development elsewhere such as the Longship/Northern Lights project in Norway and the Porthos project in the Netherlands. CCUS projects are also in service in the U.K., the U.S. and here in Canada. In fact, Alberta is already a global leader in this technology. The Pathways carbon capture network represents the largest project of its kind announced to date.

CCUS is one of a handful of technologies envisioned by the Pathways Alliance. We are also exploring other opportunities to increase efficiency and reduce or eliminate emissions from processes that are not well suited for carbon capture, including fuel substitution and electrification. The Pathways initiative is also working to accelerate the development of potential emerging emissions-reducing technologies such as direct air capture.
Net zero emissions from Canadian oil sands operations is a major opportunity for our country. As companies representing almost all of Canada’s major oil sands facilities, we are committed to the ambitious Pathways vision. We’re working collaboratively with governments, as well as local and indigenous communities, to achieve a phased and orderly reduction in emissions from our operations. We are helping Canada achieve its climate goals, including its net zero by 2050 ambitions. Transitioning to a low-carbon future can and should include responsiblyproduced, net zero Canadian oil.
Click the image below to watch our video.


“The Pathways carbon capture network represents the largest project of its kind announced to date”
cHOA JOUrNAL — December 2021 21
“We are helping Canada achieve its climate goals, including its net zero by 2050 ambitions”
SUSTAINABILITY IS EMBEDDED IN THE WAY WE DO BUSINESS
We are a resilient integrated energy leader with an unwavering focus on safety, asset integrity, and delivering leading and transparent environmental, social and governance performance. We are committed to our ambition to achieve net zero greenhouse gas emissions by 2050 and are taking bold action to address climate challenges through operational excellence, technology and innovation.
CENOVUS.COM
Alberta Thermal Oil Sands can Achieve cost and carbon competitiveness
BY JANE CAVANAGH P.ENG. VP, PRODUCT INNOVATION, SCOVAN
IMPROVED STEAM GENERATION IS NEEDED
The oil sands deliver major economic benefits to Canada, and have a pivotal role in providing a secure and reliable long-term energy supply and raw material feedstock for the world. It’s an understatement to say that, along with this economic and security discussion, a great deal of attention is being paid to oil sands environmental impact. GHGs, tailings ponds, biodiversity, water use, land disturbance, and the boreal forest — virtually everything about oil sands development has an environmental dimension and represents an opportunity for innovative solution integration. Today’s uncertainties in longer-term bitumen prices and GHG emissions costs make it challenging for operating companies to sanction proceeding with thermal oil sands developments – and a key enabler, particularly for small thermal oil sands project sanctions, would be commercialization of
significantly more cost-effective and less GHG-intensive water treatment and steam generation technologies.
Enter HipVap. Oil sands production using SAGD (Steam Assisted Gravity Drainage) or CSS (Cyclic Steam Stimulation) technologies requires large quantities of water to generate steam. This steam, after condensing into water in the oil sands reservoir and returning to the surface with bitumen, has many impurities. Current technologies used to recycle and treat produced water for steam generation use – Lime Softening/Once Through Steam Generators (OTSG) or Evaporators/Drum Boilers –account for a large percentage of SAGD surface facilities capital and operating costs at projects where water recycling is employed, and contribute to a severe cost competitiveness issue for Canadian oil sands producers.

TecH FLASH
cHOA JOUrNAL — December 2021 23
“The HipVap Indirect Fired Steam Generator (IFSG) has been conceived as an alternative to currently commercialized steam generation technologies which require extensive – and expensive – water treatment.”
Figure 1: HipVap IFSG Process Schematic
The HipVap Indirect Fired Steam Generator (IFSG) has been conceived as an alternative to currently available steam generation technologies which require extensive – and expensive - water treatment. Instead, HipVap generates steam using minimally treated produced water. The HipVap name comes from its concept of high pressure vapourization.
HipVap circulates produced water in a loop, where 20% quality steam is generated and circulated to a steam separator, based on the steam generation concept of the Forced Circulation Once Through Steam Generator (FC-OSSG) that has been proven in SAGD operation (but is fed with evaporator water).
Key is that that boiler tube heat flux is maintained at relatively low levels, temperatures are relatively low, chelants are added to keep calcium and magnesium in suspension, and the process is operated at a pH where silica remains dissolved. Any scale that forms is mechanically removed on line by a brush system that has been proven on produced water coolers. The circuit is operated on a net basis up to 98% steam quality.
Cost Reduction via Technology Integration
The HipVap IFSG process integrates a combination of technologies to address the SAGD industry’s cost challenge with respect to boiler feedwater treatment and steam generation.

In conventional OTSG operations, 900°C flame is in direct contact with the steel tubes containing the boiler feedwater. In this environment, foulants and scale create an insulating layer on the inside (produced water side) of the boiler tube that impedes heat transfer, leading to hot spots where temperatures can exceed the 600°C maximum allowable temperature of the boiler tube and cause its failure and rupture. These risks with OTSGs are mitigated by intensive water processing to reduce or remove levels of oil, silica, calcium, and magnesium in the boiler feedwater.
In contrast, the indirect heating design of the HipVap IFSG ensures the tube heat transfer surfaces do not exceed 325°C, virtually eliminating the incidence of tube failures. A clean heat transfer fluid is heated to 325°C in a fired heater and flowed to tube-in-tube heat exchangers that contain the produced water fed directly from the primary oil/water separator (Free Water Knockout or FWKO) without any additional cooling or contaminant removal treatment. Chemicals are added to maintain scale and foulants to a minimum level on the produced water side, and the process includes a physical tube cleaning system to ensure clean tubes.
cHOA JOUrNAL — December 2021 24
Figure 2: HipVap Pilot Module Isometric, 100 tonnes per day steam capacity
HipVap is designed to effectively maintain clean boiler tubes through the combination of these methods, eliminating the costly components in conventional systems required for produced water cooling and boiler feedwater treatment. The HipVap technology also is resistant to the types of upsets (oil and calcium/magnesium hardness in the feed water) that exacerbate the risk of tube failures in OTSGs. As these systems are maintenance intensive, their removal allows HipVap to deliver operational cost sav-ings, capital costs savings and important improvements to process unit up-time.
• The IFSG generates steam in an unfired heat exchanger.
ׇ
The IFSG operates at 20% quality steam per unit to keep its tubes well wetted, and hot oil use mitigates against “hot spots”.
ׇ
This eliminates the potential for the catastrophic tube failure, which is a risk for OTSGs.
• The IFSG heat transfer tubes can be brushed while online or pigged if required.
ׇ
The IFSG design incorporates an on-line deposit control system (tube brushes).
ׇ
Although this is a novel deployment of the on-line deposit control system, it’s a proven system that has been successfully operated in other heat exchange applications.
• The heat transfer oil is heated in a fired furnace.
ׇ
Operation of the hot oil heater does not require a First-Class Steam Ticketed Operator.
ׇ
The ability to operate the HipVap process with Third-Class Steam operators can provide significant labour flexibility and labour cost savings at sites that don’t otherwise require a FirstClass Steam Operator.
• The IFSG is completely modular and can be installed on piles in a significantly reduced timeframe when compared to existing SAGD systems.
Key Process Elements
• HipVap eliminates the need for produced water de-oiling and pre-treatment equipment commonly required for current boiler feedwater processing methods, including induced gas flotation units, oil removal filters, after filters, and ion exchange units.
ׇ
All of these components of current processes normally operate at a temperature of 90°C, requiring coolers to drop the temperature of produced water flowing from the FWKO primary oil separation that normally operates in the range of 110°C to 160°C. These produced water coolers are one of the most maintenance-intensive systems in a SAGD plant.
• HipVap’s overall greatly simplified produced water treatment and steam generation process makes it suitable for deployment at small CPFs and potentially at wellpads.
ׇ
Wellpad deployments would eliminate the need for surface gathering systems and the large transfer pumps required to circulate fluids between the wellpads and the CPF.
ׇ
Steam generation located at wellpads also benefits from lower hydraulic losses and a higher overall system efficiency.
ׇ
The IFSG can accept feedwater at any of these temperatures, eliminating the produced water coolers.
• Hipvap eliminates the requirement for produced water treatment after de-oiling.
ׇ
The primary water treatment equipment in typical lime softening/OTSG and evaporator/drum boiler schemes is a major contributor to the capital cost of central processing facilities, is operator intensive, and is a significant source of plant downtime.
ׇ Current systems are primarily designed and manufactured outside Canada, introducing potential supply chain and foreign exchange risks. HipVap is being built in Canada.
 Figure 3: HipVap Pilot Module Fabrication, November 2021
cHOA JOUrNAL — December 2021 25
“HipVap is designed to effectively maintain clean boiler tubes ... eliminating the costly components in conventional systems required for produced water cooling and boiler feedwater treatment.”
Bottom Lines
Based on a typical 33,000 b/d SAGD CPF with a warm lime softener design, current estimates indicate that implementation of the HipVap process will
• Reduce CPF capital costs by 24% and non-energy operating costs by 30%
• Reduce CPF GHG emissions by 70%
• Reduce CPF water consumption and disposal by 35%
• Enable alternative pad-based steam generation deployment that further reduces overall project surface footprints (34% reduction in overall land disturbance)
• Provide an overall significantly more cost-effective and less GHGintensive water treatment and steam generation technology.
Pathway to Commercialization
To advance the HipVap process to commercialization, a commercial field pilot project is currently being conducted at a Strathcona Resources Ltd.-operated SAGD facility near Bonnyville, Alberta. This pilot project is to be commissioned in early 2022, with plans to operate and optimize the HipVap technology during the 2022 calendar year.
The pilot has a design capacity of 100 tonnes per day steam. Key pilot elements include:
• Increasing HipVap tube size: the commercial pilot tube size is nominal 3” diameter, compared to the bench-scale tube size of 0.75” diameter.
• Moving to actual commercial operating environment: the pilot is being fully integrated into an operating SAGD facility. One important aspect will be the continuous processing of produced water from a live operating SAGD facility, compared with batch-processed trucked-in fluids that were used for the bench-scale testing
• Proving the on-line brushing system: the pilot will confirm practical on-line cleaning in SAGD produced water operating conditions.
The commercial pilot project will also be used to validate other HipVap design parameters, GHG and water usage benefits, and capital cost and operating expense reductions.
Recent TIER funding from Alberta Innovates has allowed HipVap to proceed from bench-scale level to full field piloting. Successful operation of the current HipVap pilot is intended to lead to final optimizations, and rapid deployment of the transformative HipVap technology by the oil sands industry.
HipVap’s contributing partners for the execution phase of this project include Scovan, Gemini Fabrication, Strathcona Resources, Drishya AI Labs, and Orsico. We thank Alberta Innovates for providing TIer (Technology Innovation and emissions reduction) funding on this project. Alberta Innovates’ TIER Economic Recovery Program (Program) consists of a set of “shovel-ready” projects that will accelerate innovation in support of GHG emissions reduction, increase long-term economic competitiveness and stimulate growth in critically important sectors of Alberta’s economy.
Jane Cavanagh P.Eng.
Ms. Cavanagh holds both B.Sc. and M.Sc. degrees in Mechanical Engineering from the University of Saskatchewan. She has 15+ years of experience as an engineer, project manager and new technology champion in Western Canada’s energy industry. In her current role, VP Product Innovation, Scovan Engineering, she oversees the team working to commercialize the HipVap technology.
“To advance the HipVap process to commercialization, a commercial field pilot project is currently being conducted at a Strathcona Resources Ltd.-operated SAGD facility near Bonnyville, Alberta.”
cHOA JOUrNAL — December 2021 26
CHOA Platinum Sponsors


CHOA Gold Sponsors

cHOA JOUrNAL — December 2021 27
CHOA Silver Sponsors


CHOA Bronze Sponsors


cHOA JOUrNAL — December 2021 28
TecHNIcAL ArTIcLeS
THE CORE OF THE CHOA JOURNAL.

Impactful technical and business insight. Deep. Or broad. Solid. Peer-reviewed.
CONNECT. SHARE. LEARN. LEAD.
cHOA JOUrNAL — December 2021 29
SAGD reservoir characterization considerations– Part 2 of 2
BY MARK SAVAGE, P.L.GEO.
INTRODUCTION
This article is Part Two of a two-part paper and addresses the petrophysical and geomodel stages of the reservoir characterization process (the process). Part One, published in the October 2021 issue of the CHOA Journal (https:// issuu.com/choajournal/docs/choa_journal_ edition_1_-_full), addressed the data collection and geoscience analysis stages of the process.
The process is the foundation for subsurface deliverables. The extent of the detail and focus areas required for the process are influenced by the overall project scope, schedule, and budget. The process should incorporate cross-functional (finance, facilities, etc.) and multidisciplinary (geoscience, reservoir engineering, etc.) input .
By following this process, a thorough understanding of the steamassisted gravity drainage (SAGD) asset potential and uncertainty can be gained. With some minor modifications, the workflow and considerations could be used across different asset types.
Figure 1: Simplified Decision Gate Example (Source: Savage, M., 2020)
This process has been used for a range of project decisions, up to significant decision gate (DG) milestones, DG1 (concept), DG3 (sanction), Figure 1, and resource and reserve determination and validation.

A vital component of the process is multidisciplinary collaboration . As a minimum, the following disciplines should be involved: geology, geophysics, petrophysics, geomodelling, and reservoir/production engineering. Depending on the project specifics, other cross-functional disciplines may be required: field operations, facilities, project engineering, drilling and completion engineering, risk analyst, and finance.
There are three stages to the process workflow: data collection and geoscience analysis, petrophysical analysis and geomodel development, Figure 2. The 3-D geomodel and simulations are dynamic and may need updates from new learnings and information.

TecHNIcAL ArTIcLe
Figure 2: Reservoir Characterization Workflow (Source: Savage, M., 2020)
[reservoir characterization] process
incorporate crossfunctional (finance, facilities, etc.) and multidisciplinary (geoscience, reservoir engineering, etc.) input.” cHOA JOUrNAL — December 2021 30
“The
should
Each stage of this workflow will influence the degree of uncertainty captured in the reservoir performance predictions. These predictions are used to assess volumetrics, greenfield or brownfield optimal facility design capacity, number of wells required for a field or pad start-up, and the schedule for production rate sustaining pads. The schedule should incorporate performance learnings and required modifications from the producing pads, e.g., updated 3-D geomodels, type curves, and simulations.
Petrophysical Analysis
Petrophysical analysis is fundamental to reservoir evaluation and assessment. This analysis provides input data for mapping, geomodelling and volumetric calculations.
Well data including, geophysical wireline logs and core, are significant data contributors to the process. Well and core data is collected at different sample sizes, and from micro to macro scale. There are three key petrophysical parameters: porosity (Phi), saturation (water Sw and oil So), and permeability (vertical Kv and horizontal Kh). The complexity of a reservoir may require additional data and analysis to complete the characterization process. Data such as wettability, clay mineralogy, capillary pressure, geochemistry, and fluid properties will highlight reservoir complexities. It is important to determine the impact of this data on permeability, saturation, and porosity.
mud dominated portions of reservoirs, the Archie equation will result in overestimating Sw due to the influence of mud beds on conductivity.
For muddy reservoirs there are several equations useful for deriving Sw, e.g. Simandoux1 or Indonesian1. If using an equation with cementation (m) and saturation (n) exponents, then use electrical properties3 from core analysis to derive m and n. When defining the project scope, it is appropriate to determine which equation to use in the characterization process.
An early decision to make is which water saturation (Sw) equation to use. The most common formula used for clastic reservoirs is Archie equation1, Figure 3, but this may not represent your reservoir. The Archie equation was developed for reservoirs with intergranular2 porosity, Figure 4, minimal clay volume and mud beds, and non-potable formation water. It is necessary to understand the equation’s limitations when a reservoir departs from these specific parameters. For example, in

and-gas/petrography/petrographic-analysis)

Two data sources provide information to obtain Sw: overburden (OB) core plugs and geophysical wireline logs. Log data has a higher frequency of data and measures a large rock volume. In contrast, core plug measurements are collected at a lower frequency of data and measure a small rock volume. To improve petrophysical input to geomodels, use core data to calibrate the wireline data.
For oil sands core, some bitumen rich, massive sandstone intervals tend to expand when the core is brought to surface. Core expansion disturbs the sand original in-situ grain-to-grain contact, increasing the apparent porosity and permeability measurements from these intervals.
The neutron-density logging tool can be used to acquire reliable density porosity values in oil sands. Running sonic logs in several wells can aid in seismic processing and geophysical interpretation.
Permeability is a determining parameter for reservoir performance. The nuclear magnetic resonance (NMR) log4 can measure total and effective porosity, permeability, oil viscosity and hydrocarbon pore volume, even in thin beds. The value of NMR data is increased in heterogeneous reservoirs and for reservoirs where core derived permeability is of low reliability . To optimize cost savings when running the NMR, it is recommended to cut a core from the zone of interest in a few wells and calibrate the NMR data to core data. Using NMR data calibrated to a few cores will enable the operator to minimize the total number of cores taken.
Figure 3: Archie Equation (Source: Geoloil Petrophysics www.geoloil. com/computingSW.php)
Figure 4: Thin Section showing intergranular porosity (blue colour fill) (Source: https://www.alsglobal.com/en-ca/services-and-products/oil-
cHOA JOUrNAL — December 2021 31
“Data such as wettability, clay mineralogy, capillary pressure, geochemistry, and fluid properties will highlight reservoir complexities.”
The primary source of permeability data will be individual horizontal and vertical OB core plugs and/or stacked plugs. Consider using stacked core plugs to measure vertical permeability for the geomodel. Use OB plug permeability data representing various reservoir facies, and which is free of impediments that can distort results, e.g., small fractures or mud laminae that span the full width of the plug. Pre-screening the plugs using CT-scan can aid in the sample selection for permeability testing. Improved representative test results can be achieved through a multidisciplinary review of sample selection. Consider upscaling the Kv and Kh data from core to geomodel grid cell scale. The University of Alberta, CCG5 group continues to develop this upscaling methodology.
Another key geomodel parameter is reservoir facies, both pay and nonpay intervals, Figure 5.
performance can increase confidence in the range of numerical simulation forecasts.
Ensuring a holistic representation of uncertainty requires incorporating multidisciplinary input and feedback during the petrophysical analysis workflow. Implementing this type of workflow requires open communication, collaboration, and integration to ensure the project objective is achieved.
Geomodel
The process of building multiple realizations of a geological model (geomodel) is a collaborative effort and requires multidisciplinary input throughout the geomodel development and its multiple uses including production forecast, well planning, and financial analysis. A 2-D or 3-D geomodel is an essential component of the process. Geomodels provide input parameters for simulation and analysis of static and dynamic uncertainty, Figure 6. The geomodel can also provide volumetric probabilistic assessments for the area of interest, well, pad or field.

Below are a few discussion points regarding the development of a geomodel. Most companies have their own workflow. This is a discussion regarding the components for consideration in a modelling process.
The interpretation of the reservoir facies is conducted by the geologist using core and wireline logs, including borehole resistivity image logs. Collaboration between the petrophysicist and geologist enables consistency of facies identification and any potential outliers. Facies derived from wireline log analysis, termed electrofacies, may be necessary to fill gaps in the data set. If electrofacies are necessary, then understanding the limitations of this data source is required, e.g., distinguishing mud clast breccia from inclined heterolithic stratification (IHS).
Petrophysical analysis is a dynamic process and aids in identifying uncertainties in reservoir parameters. Uncertainty attributed to saturation and porosity parameters can broaden the calculated range of reservoir volumetrics. A software tool such as @Risk or Spotfire can be used to capture ranges of uncertainty. Using an uncertainty range is beneficial in the simulation stage. It can provide reservoir engineers with direction to tune numerical simulations.
Consideration of data ranges and associated uncertainty in geologic parameters, thermal dynamic properties and in historic field

“Erroneous outcomes can result when using a geomodel for purposes it was not designed to address ...”
Figure 5: SAGD Facies Scheme (Source: AER D54 2019 8668)
cHOA JOUrNAL — December 2021 32
Figure 6: Simplified Geomodel Workflow (Source: Savage, M., 2020)
When defining the project scope, a critical step is to determine the purpose for the geomodel realizations. This can include well placement, volumetrics, recovery potential, production and injection rates, and impact of the aquifer pressure transient. Multidisciplinary confirmation of geomodel purpose will ensure that the geomodel is constructed to meet the project objectives. Erroneous outcomes can result when using a geomodel for purposes it was not designed to address; for example, attempting to use a large-scale grid cell volumetric geomodel for field performance forecasts. Using a large-scale grid cell geomodel could accent dominant low-quality reservoir parameters in a production simulation and can underestimate the production forecast. In contrast, using a small-scale grid cell geomodel will incorporate the higher-quality reservoir parameters and provide a more representative production forecast with higher volumes.
The geomodel area of interest should be confirmed early in the project scope, i.e., a single subsurface drainage area, a full pad, or an entire field. The area of interest and the geomodel grid cell size will influence the project timeline.
A third early decision is to confirm the number of geomodel realizations to generate. My recommendation is that a minimum of fifty realizations be generated, with more realizations if time and computing capability allow. Fifty or more can deliver a wide range of probabilistic (P) realizations to select the P10, P50 and P90 cases for the simulation stage.
Analogous outcrop data (riverbank and/or mine face) Figure 7, can assist in establishing the appropriate grid cell dimensions for the purpose intended, i.e., using outcrop facies dimensions as a guide for grid cell size. The degree of reservoir heterogeneity is a factor which influences grid cell size. To capture the appropriate complexities of a heterogeneous reservoir a smaller grid cell size may be required.
Whether to build a deterministic or stochastic geomodel is typically driven by corporate geomodel guidelines. I have used realizations generated from each type of model and from a hybrid version. My preference for a SAGD reservoir is a hybrid model. Hybrid models incorporate a structure grid with several object-based zones limited by key definable surfaces, obtained from integrated interpretation of the 3-D seismic and wells. The object-based portion of the hybrid model can provide an improved geological representation in heterogeneous and complicated depositional and facies environments, such as multiple and stacked incised and abandonment channels.
If generating an object-based geobody, use 3-D seismic, outcrop and modern analogue data to influence these object-based features. When considering such data, it should not be done as an absolute. An analogue, modern or outcrop, may not represent the spectrum of the reservoir’s depositional environment. Outcrop data can assist in deriving the value range used in the surface uncertainty process.
 Figure 7: IHS at Syncrude Mildred Lake Mine Face (Source: GeoConvention 2014, Findlay, D., Nardin, T., Wright, A., Mojarad, R.S., Modeling Lateral Accretion in McMurray Formation Fluvial-Estuarine Channel Systems: Grizzly Oil Sands’ May River SAGD Project, Athabasca)
cHOA JOUrNAL — December 2021 33
“The main end-products of a geomodel are performance simulations (resource, reserve, and daily fluid rate) and uncertainty”
The main end-products of a geomodel are performance simulations (resource, reserve, and daily fluid rate) and uncertainty. To derive and capture the uncertainty range of reservoir parameters from core and wireline data, use software such as @Risk or Spotfire. Another key uncertainty to be incorporated is elevations of key inter-well surfaces, such as oil-water contacts, base and/or top of pay, and basement. Well spacing and 3-D seismic quality can reduce uncertainty, but it is still present and needs to be incorporated in the geomodels. The use of Cohiba6 software incorporates surface structure uncertainty into the geomodel.
Facies variance is populated across a geomodel region using a vertical proportion curve (VPC). Complex reservoirs can benefit from applying multiple VPC regions within the overall geomodel area of interest. Each region will have a distinct VPC, allowing the geomodel to reflect the reservoir’s variable heterogeneity influenced by spatial position in the depositional environment, i.e., proximal or distal location in an estuarine environment.
Reservoir facies petrophysical parameters are distributed using discrete 3-D facies parameters. The facies proportions for every zone of the geomodel are statistically derived from the wells that populate each geomodel zone. The geomodel can be conditioned using 3-D seismic attributes, coupled with geologically distinct reservoir characteristics, to derive a soft trend of facies propagation into inter-well regions.
This article has highlighted key decisions and considerations that can be discussed with multidisciplinary team members to ensure the geomodelling workflow achieves project objectives. There are several resources available to assist in developing an appropriate geomodel workflow that best fits individual reservoir and corporate geomodelling philosophies.
The two key messages of this article are that:
1. A geomodel is integral to any reservoir evaluation process.
2. When defining the project scope, the appropriate level of geomodel detail should be discussed and confirmed with the multidisciplinary team members.
Conclusion
Petrophysical and geomodel stages of the reservoir characterization process are essential to the overall evaluation and directly influence simulation outcomes. These stages ensure key reservoir parameters and uncertainties are integrated into the numerical simulations. Incorporating uncertainty from key reservoir parameters and surface structure will aid in ensuring the geomodel is geotechnically representative of the reservoir and that a robust uncertainty analysis can be produced .
Early in the project scope defining the geomodel workflow should include contributions from multidisciplinary and if warranted, crossfunctional groups. Integration of different data sources, petrophysical analysis and uncertainty, and geomodel realizations will improve the representative range of simulation results, including both opportunity and risk.
Acknowledgement
Input provided by Gordon T. Stabb, P. Geol., towards writing this article is greatly appreciated.
References
1. Geoloil Petrophysics. http://www.geoloil.com/computingSW.php.
2. AAPG WIKI. http:// www.wiki.aapg.org/Porosity.
3. Lasswell, P.M., Laboratory Analysis of Electrical Rock Properties and Capillary Pressure in Full Diameter Core Samples, International Symposium of the Society of Core Analysis, 2005.
4. Schlumberger MR Scanner Brochure. http:// www.slb.com/-/media/ files/fe/brochure/mr-scanner-br.ashx.
5. Boisvert, J., Manchuk, J., Neufeld, C., Niven, E., and Deutsch, C., Micro-Modeling for Enhanced Porosity-Permeability Relationships, Paper 211, CCG Annual Report 14, 2012.
6. Norsk Regnesentral, Norwegian Computing Center. https://www. nr.no/nb/COHIBA
Mark Savage, APEGA P.L.Geo
Mark has been in the oil sands industry since 2000. Mark started his oil sands career with Petro-Canada working on the Lewis, MacKay River and Fort Hills projects. Since leaving Petro-Canada in 2008, he has been actively engaged in various in situ oil sands assets with Ivanhoe Energy Ltd., Statoil Canada Ltd. and Athabasca OilCorporation. He has collaborated on and led in situ geoscience, operations and development teams.

cHOA JOUrNAL — December 2021 34


© 2021 Fluor Corporation. All Rights Reserved Fluor is a registered service mark of Fluor Corporation. ADCA211421 Industry leaders turn to Fluor to provide professional and technical solutions on the world’s toughest projects. In response, we provide solutions that deliver safe, well-executed, and capital-efficient projects to clients across Canada and around the world. Working with our clients, we consistently deliver results with the safety and quality they expect. www.fluor.com Design. Construct. Deliver. CHOA is now accepting content proposals for 2022 issues of the Journal. • Full Technical Articles (peer reviewed) • Business Articles • Opinion Pieces • Tech Flashes • Industry Briefs Contact us now at CHOA.AB.CA or OFFICE@CHOA.AB.CA LIKE THE JOURNAL? LIKE TO PUBLISH SOMETHING IN THE JOURNAL? CONNECT. SHARE. LEARN. LEAD.
Ideas that make a

Registered
of
the
and
difference. Helping clients build a better future. Find out what we can do for you. bmocm.com ®
trademark
Bank of Montreal in
United States, Canada
elsewhere. ™ Trademark of Bank of Montreal in the United States and Canada.
Past, Present, and Future Applications of Geophysics in Oil Sands - Part 1 of 2
BY DRAGA TALINGA, DAVID GRAY, HONG FENG, DON C. LAWTON, AND BRIAN WM. SCHULTE
This paper is dedicated to Dr. Larry Lines (1949-2019), who was involved with seismic imaging and inversion, reservoir characterization, conventional oil and gas exploration, geophysical studies of heavy oil, oil sands, and monitoring effectiveness of steam assisted gravity drainage (SAGD), and who mentored us all. We also acknowledge the graduate students who worked on theses over the years with the University of Calgary Consortium for Research in Elastic Wave Exploration Seismology (CREWES) and Consortium for Heavy Oil Research by University Scientists (CHORUS), both groups researched the application of geophysics in heavy oil.
This paper will be published in two parts, with this being the first part, and the second part to be published in February 2022.
INTRODUCTION
In honour of the Canadian Heavy Oil Association 35th anniversary, we have authored this article on the past, present, and future applications of geophysics in the oil sands. It celebrates the early use of reflective seismic (2D, 3D, and 4D), inversion, 3C-4D seismic to identify liquid bitumen outside the steam chambers, high density seismic, and Distributed Acoustic Sensing.
Seismic data has been used extensively in the development of SAGD plays to determine the extent of wormholes in CHOPS (Cold Heavy Oil Production with Sand) (Embleton et al, 2008), and it will be a key tool for identification of where the CO2 resides in the subsurface in CCS (Carbon Capture and Sequestration).
Oil sands can be divided into three different types:
1. Surface mining which accounts for about 20% of Canada’s oil sands deposits, typically within 70 m of the surface;
2. SAGD (Figure 1), typically for oil sands deposits greater than 70 m but less than 400 m in depth, using well pairs with one being the injection well and the second being the production well. SAGD wells are referred to as “in situ,” and they create much less surface land disturbance.
3. CHOPS is applied at depths greater than 400 m, and where the thickness of the reservoir is low.
The oil sands were pioneers in using 4D because produced oil sands tend to be a Class 3 (bright spot) or Class 4 AVO, which are sensitive to fluids, especially gas – in this case, steam. The 4D seismic was used to understand the fluid flow, especially with SAGD wells, since the steam injection creates a heat front, reducing the oil viscosity and allowing it to flow. Because the viscosity is dramatically reduced, oil can flow under the force of gravity into the production well.
Historically, for oil sands, viscosity reduction has been made with steam generated using natural gas. This has resulted in large CO2 emissions. Therefore, they have been a significant source accounting for 25% of Alberta’s GHG emissions and have become an international symbol for GHG. Recognizing this, some Canadian oil sands companies announced the Oil Sands Pathways to Net Zero Initiative to reach net-zero emissions by 2050. CCS is a practical solution that deals with GHGs emissions and has the potential to reduce opposition to oil and gas development. There is even the possibility of oil companies becoming carbon negative, e.g., https://www.cbc.ca/news/business/bakx-ccs-enhance-whitecapdavid-keith-1.5884107

TecHNIcAL ArTIcLe
cHOA JOUrNAL — December 2021 37
Figure 1: Conceptual SAGD well image
History of 2D, 3D and 4D Seismic Applications in the Oil Sands
Canada’s oil sands and heavy oil deposits are large accumulations of bitumen covering extensive areas in Alberta and Saskatchewan (Figure 2). The reservoirs are high porosity sandstones of the McMurray Formation (Athabasca Oil Sands), Clearwater Formation (Cold Lake Oil Sands), Wabiskaw Formation (Wabasca Oil Sands), Bluesky-Gething Formation (Peace River Oil Sands), and several formations like Grand Rapids, Sparky, Cummings, etc., in the Heavy Oil Belt. In Alberta, heavy oil deposits also exist in fractured limestones and dolomites of the Carbonate Triangle (Dusseault, 2002).
The Carbonate Triangle refers to a region delimited by the current trend of the three carbonate-hosted bitumen deposits beneath the region’s surface, forming a triangle and it is the third-largest crude reserve in the world according to the ERCB (Alberta Energy Resources Conservation Board) (Seeking Alpha, 2013a).
In Alberta, most of the bitumen deposits are contained in the unconsolidated sands of the McMurray Formation, which were deposited in a dynamic fluvial and shallow marine environment during the Lower Cretaceous. A combination of intricate channel systems, alternations of cross-bedded sands, inclined heterolithic strata (interbeds of sand and mud), massive sand sequences, and occasional concretions (calcite cemented sands) means constant changes in all reservoir properties – porosity, permeability, mineralogy, and fluid type, chemistry, and saturation (Fustic et al, 2006).
In this highly complex play, understanding the reservoir with enough accuracy and detail – rocks, fluids, and their interactions and spatial variability – is essential for the optimum reservoir development planning and, consequently, to improve recovery and profitability. Integrated quantitative interpretation studies have a significant role in this planning, as they:
1. provide a more accurate, detailed, and complete model of the reservoir properties;
2. help to map the 3D distribution of lithology and bitumen;
3. define the reservoir’s small-scale architecture;
4. resolve facies and fluid ambiguities;
5. identify small-scale heterogeneities that are critical in the predictions and simulations of fluid flow;
6. use all available well, seismic data and geological information; and
7. can be updated during the life of the reservoir when time-lapse data become available.
Routine processes in these studies are techniques based on the amplitude variation with offset (AVO) or, more precisely, incidence angle (AVA). The basis of these methodologies is that the observed variation of reflectivity with angle is due to the sensitivity of seismic velocities to the rock properties such as porosity, lithology, density, fluid type and saturation, pore pressure, and textural characteristics.
Figure 2: Canada’s oil sands are found in Athabasca, Cold Lake and Peace River areas showing the Carbonate Triangle (from seeking Alpha, 2013b))

“Detailed characterization ... is required to better understand the interrelationship of components within the reservoir and the overall reservoir behaviour and reactivity at production conditions, for optimization of exploitation methods and the development of new technologies.”
cHOA JOUrNAL — December 2021 38
AVO Analysis
The high porosity and permeability of the oil sands can cause low impedance intervals on the well logs. These low impedance intervals correlate to bright amplitudes on processed seismic data composed of a strong trough from the top of the sand and a strong peak from the base of the sand. They are clearly visible in the full offset stacks (Figure 3).
Initially, bright spots were observed across the Pliocene/Miocene trend in the shallow waters of the Louisiana shelf in the late 1960’s and were used by Shell to de-risk plays. They were seen on 2D lines on the stacked data (Forrest, 2002). Bright spots became the basis for Amplitude versus Offset which led Ostrander (1982) to write his paper which described how the P-wave reflection coefficient at an interface separating two media is known to vary with angle of incidence, and the way it varies is strongly affected by the relative values of Poisson’s ratio of the two media (Ostrander, 1982; Castagna and Backus, 1993).
Figure 3: Example of a class 3 AVO or bright spot on the gathers where the Near offsets are very bright, and the Far offsets are even brighter. Notice there is a slight difference between the Nears and the Fars, and if there was to be subtraction of the Nears and Fars, it will be close to zero. Our AVO/amplitude technology is designed around the class 3 AVO. The bright spot/class 3-AVO sand has become synonymous with what most consider as AVO.
When working with bright spots, it was recognized that there were certain features in the seismic data that were related to bright spots, such as a change in phase, drop in frequency and increase in amplitude across the reservoir zone (Figure 4). This led to the development of seismic attributes to find changes in lithology, porosity, and fluid content.


2D data is used as reconnaissance, while 3D is used where we know hydrocarbons exist and is used to achieve greater resolution and imaging. One of the first 3D surveys acquired in Alberta was the Erskine 3D survey in 1978, acquired near Calgary (Galbraith, 2001).
4D seismic monitors seismic over time over a known reservoir to map changes in production and fluid flow. When acquiring a 4D survey, we begin with a base survey, and then each subsequent survey that is repeated is known as a monitor survey.
One of the first 3D 4D seismic surveys was acquired in April 1985 at the Athabasca Tar Sands Thermal Pilot. It was determined that a high-resolution 3D seismic survey was required as a base survey to locate and monitor the progress of in-situ heat fronts in a 50 m thick section of McMurray oil sands, resting on a Devonian unconformity surface, 240 m deep (Matthew et al, 1987; Zhang and Lines, 2004).
Figure 4: Conceptual flat spot in seismic data which illustrates the phase reversal due to the change in fluid from water to oil. This phase reversal is caused by changes in the acoustic impedance. With this decrease in acoustic impedance, there is a development of a flat spot across the change in fluids within a stacked section. Flat spots are regarded as one of the Direct Hydrocarbon Indicators in seismic. As shown the phase reversal and flat spot are due to transitioning from water which has a high Acoustic Impedance compared to hydrocarbons which has a lower Acoustic Impedance.
cHOA JOUrNAL — December 2021 39
The survey area was 168 m by 196 m with 4 m by 4 m CMP bins. The seismic acquisition utilized buried seismometers at a depth of 13 m cemented in place and very light charges buried at 18 m depth. Both depths were beneath the muskeg. The seismic acquisition resulted in a minimum of 12-fold coverage except near the perimeter of the pilot area with a recording offset of 50 – 150 m (Zhang and Lines, 2004).
A monitor survey was acquired in January 1987 after a four-week steam and soak period at the three production wells. Another monitor survey was acquired in April 1987 after the central injection well underwent a brief period of hot water injection before being converted to steam. A third monitor survey was recorded in November 1987 after another period of continuous steam injection in the central well (Zhang and Lines, 2004). When the first injector well was drilled, it encountered a 4 m sand aquifer directly above the erosional surface. It was assumed that this basal wet zone would influence the performance of the steam-based recovery process. Later, when drilling another well in the area, the aquifer was absent (Matthew et al, 1987). This indicated a potential problem with the proposed heating method, and the 3-D seismic then became used to accurately image the Devonian unconformity surface, which is a contrast from the soft sandstones of the McMurray formation to the hard carbonate-dominated geology of the Devonian, defining the distribution of this sand (Matthew et al, 1987).
Early interpretation of the 4D seismic utilized three seismic attributes (Eastwood, 1996; Sun, 2001; Zhang and Lines, 2004):
1. Delay time (sag) is generated by mapping the relative time difference of reflections from horizons above and below the reservoir between repeated (time-lapse) surveys.
2. Amplitudes of horizons above, below and within the reservoir between repeated (time-lapse) surveys were also used for the monitoring.
3. Frequency attenuation within the reservoir.
It was also discovered that the acoustic velocities (VP) were most affected by changes in fluid properties due to temperature. The temperature increase due to steam lowers the seismic velocity near injector wells, so the seismic velocity model can be used to delineate the effects of steam injection (Zhang and Lines, 2004).
Heating decreases velocities which cause horizons below the reservoir to be delayed, and with the change in velocity, we also have a change in the seismic amplitude.
CHOPS
The high porosity and permeability of the oil sands can cause low impedance intervals on the well logs. These low impedance intervals correlate to bright amplitudes on processed seismic data composed of a strong trough from the top of the sand and a strong peak from the base of the sand. They are clearly visible in the full offset stacks (Figure 3).
There are also limitations to injecting steam into the heavy oil reservoirs, especially when the reservoir is located at a depth greater than 400 m and the thickness of the reservoir is low.
“3D seismic then became used to accurately image the Devonian unconformity surface, which is a contrast from the soft sandstones of the McMurray formation to the hard carbonatedominated geology of the Devonian, defining the distribution of this sand.”
cHOA JOUrNAL — December 2021 40
“The temperature increase due to steam lowers the seismic velocity near injector wells, so the seismic velocity model can be used to delineate the effects of steam injection.”
In these cases, CHOPS can be used. CHOPS will fail under certain reservoir conditions, causing the loss of the well (Daniels and Schulte, 2015):
1. Wormholes that plug, collapse, or stop growing;
2. Water out;
3. Gas breakthrough; and
4. Permeability reduction from fines, formation debris, wax precipitation, and wasted solution gas.
We can utilize seismic to predict the gas breakthrough and avoid it by placing the CHOPS well at least 200 m (the theoretical maximum wormhole length) from the gas cap. The oil-gas contact is located and observed in a small number of the available wells. Using high-resolution 3D seismic data with a sample rate of 1 ms, the extent of the gas pool was defined (Daniels and Schulte, 2015).
The structure was defined by a depth conversion of the seismic time structure, cross-validated with the wells. The gas cap was mapped seismically and avoided through AVO analysis (Daniels and Schulte, 2015).
Seismic Inversion
With the improvement in seismic data quality from the continuous development of acquisition and processing technologies, seismic inversion has become a routine process in extracting additional information from seismic data to characterize oil sands reservoirs. Inversion replaces an interface property, the reflectivity data, which is the contrast between the properties at the interface, into a quantitative internal rock property, such as density or elastic impedance.
The transformation of reflectivity into rock properties is possible as the amplitude variation with offset (or angle) is a function of the Vp/Vs (monotonically equivalent to Poisson’s ratio) and P-wave, S-wave, and density contrast across the interface. These elastic properties are broad-band and usually higher resolution than the conventional seismic data. They can be used to obtain:
• other elastic properties such as LambdaRho, MuRho, Lambda/Mu, density, Young’s modulus, bulk modulus, compressibility, and Poisson’s Ratio;
• estimates of petrophysical properties such as porosity, clay content, fluid saturation and lithology (e.g., Pendrel, 2001); and
• pore pressure and magnitude of principal stresses.
The inversion methods can be post- or prestack and either deterministic or stochastic. Poststack inversion has simpler assumptions and uses the amplitude of seismic stacked data to estimate the acoustic impedance. The prestack form uses the analysis of AVO effects on angle gathers or range limited angle stacks (PP and sometimes converted PS, in the case of joint inversion) to invert for P-impedance, S-impedance and density simultaneously. It is also the most common form of inversion currently used, as gathers contain additional information about the rock properties. The main steps in a prestack inversion workflow are:
1. Quality control/editing of well data and pre-conditioning of input seismic data;
2. Wavelet extraction and well-to-seismic correlation;
3. Initial earth model building (P- and S-wave velocities and densities), using wells and seismic mapped horizons; and
4. Prestack inversion to generate the elastic impedances and density attributes (Figure 5).
“Inversion replaces an interface property, the reflectivity data, which is the contrast between the properties at the interface, into a quantitative internal rock property, such as density or elastic impedance.”
cHOA JOUrNAL — December 2021 41
“We can utilize seismic to predict the gas breakthrough and avoid it by placing the CHOPS well at least 200 m from the gas cap.”
Figure 5: General workflow for prestack (simultaneous) deterministic and stochastic inversions. Depending on the algorithm, both methods can use only PP or PP and PS data (joint inversions). The output properties depend on the implementation algorithm and the quality of seismic data.

In practice, density prediction is challenging in the oil sands because of the shallowness of the data, which causes:
1. Velocity sensitivity due to a significant unconformity that exists at the base of many oil sands reservoirs in the Athabasca region (Gray et al, 2012).
2. Vertical Transverse Isotropy (VTI), which appears as an event (peak or trough) turning upwards in the far-offsets of a gather (hockey sticking), as shown in Figure 6.
3. Horizontal Transverse Isotropy (HTI) appears as an azimuthal wobble (Gray et al, 2012; Schulte and Manthei, 2014).
To deal with VTI, we can use a Curved Ray Prestack Time Migration or Prestack Depth Migration and higher-order moveout (Figure 7), which will use the anisotropic parameter h to flatten the hockey stick effect in far-offsets (Schulte and Manthei, 2014).
HTI or azimuthal wobble can be corrected using azimuthal moveout to flatten the wobble, which will calculate a Vslow, which is perpendicular to open fractures or the maximum horizontal stress field and a VFast that is parallel to them.
Another way to deal with these problems is to use a joint PP-PS deterministic inversion. With PS data, the density is calculated using the mid offsets where there is less noise, no hockey sticking or azimuthal wobble.
Figure 6: Diagram showing the problems with shallow seismic data. It is difficult to pick velocities in the shallow section due to the high moveout or being more hyperbolic shape on the unmoved out gathers. However, as the reflectors become deeper, the moveout becomes less or the moveout on the unmoved out gathers becomes flatter, the velocities are not as sensitive.

Figure 7: Gather showing the hockey sticking, h, and the 3rd term or 4th order moveout equation.

cHOA JOUrNAL — December 2021 42
Using PP and PP-PS Data
When a conventional seismic pressure (P) wave encounters an interface, some of that energy is reflected. If it encounters the interface at an angle, some of that seismic wave induces shear on that interface, and therefore some of that energy reflects as a shear (S) wave). We call these conversions from P-to-S or PS reflections. Using converted PS seismic data, density and shear-wave impedance can be better predicted as they affect amplitudes at even small incidence angles (Zhang et al, 2018).
Figure 8 compares the relative contributions of P-, S-, and density reflectivity to the angle-dependent PP and PS reflection amplitudes modelled based on Fatti’s 3-term equation (Fatti et al, 1994). The two models involve a single boundary separating sand and shaly materials with their physical properties listed in the figure. These reflectivity components are fractional changes in density, and P- and S-impedance across the interface, divided by the average values of the two layers. Note that no shear or density response is induced until the seismic wave hits the interface at an angle.
The upper layer in both cases has the same P-wave velocities and densities, but the lower layer in the second model has a lower S-wave velocity. Analysis of these reflection amplitudes helps us understand their sensitivity to changes in the rocks’ physical properties and how well we can discriminate these properties from PP and PS data in the prestack domain. For example:
• in both models, the density and S-impedance contribute more to the PS amplitudes than for the PP amplitudes;
• the density contribution is several times higher for PS, even at small incidence angles, and it can even be dominant as in the second model; and
• in some cases, the density contrast could be more important in the PS AVO signature, as shown in model two.
Interestingly, the PP amplitudes can be insensitive to changes in S-impedance across an interface, as shown by the second model, suggesting that the shear impedance could be challenging to resolve unless converted PS data are used.
Figure 8: Contribution of reflectivity components to the PP (left) and PS (right) amplitudes, as a function of the angle of incidence, for a boundary separating two sand and shaly materials with the indicated properties. In the second model (bottom), the S-wave velocity of the lower layer is decreased to suggest an increase in the Vp/Vs ratio. The relative contributions of P-wave, S-wave, and density reflectivity are calculated by dividing each reflectivity component to the PP and PS reflectivity.

cHOA JOUrNAL — December 2021 43
The main advantages of using prestack inversion are:
1. increased resolution (better separation of interfering reflections through the removal of wavelet; reduced tuning due to the attenuation of the wavelet sidelobes (Pendrel, 2001));
2. constraints from starting low-frequency models improve the bandwidth and signal-to-noise ratio; using these a priori information from well data and seismic interpretation also involves integration with geology as a separate source;
3. improved interpretation when using elastic properties, compared to conventional seismic interpretation of seismic reflections;
4. substantially better quantitative predictions and separation of reservoir properties; and
5. possibility to quantify uncertainties.
The deterministic pre-stack inversion uses the perturbation of an initial model with P- and S-impedance and density components to compute a synthetic trace using the extracted seismic wavelet. This method iteratively evaluates the error between the input seismic trace and the computed synthetic trace until the error meets a threshold. The solution represents the model generating a minimal difference between the calculated synthetic and real seismic trace (Veeken and Da Silva, 2004). The initial model is built by interpolating well data and has a structural frame given by the shape of the mapped time horizons and known stratigraphic relationships. The role of the model is to provide the lowfrequency depth trends which are below the seismic bandwidth.
The P-waves are affected by the rock matrix and the fluid filling the pore space, emphasizing fluid content, while the S-waves interact with the rock frame, emphasizing lithology. (Unless the fluid is bitumen, which has been described as a “quasi-solid” (Han and Batzle, 2008), because it has some rigidity, like Jello. The joint inversion of PP and converted PS data is more robust and stable, and it is often used because of its improved ability to characterize the lithology and fluid distribution within the reservoir. With the improved estimation of the S-impedance and density, we can have a better delineation of the hydrocarbon distribution.
Both simultaneous and joint inversion include some form of coupling between variables, representing the regional background trends, such as relationships between logarithms of P and S impedances and between logarithms of density and P impedance (Russell and Hampson, 2006).
The band-limited nature of seismic data means that the inversion produces a non-unique solution. The inversion resolution is highly dependable on the seismic bandwidth, which in general lacks low and high frequencies. The inversion results and their derivatives are often used as external attributes in multi-attribute regression and neural network predictions to improve the resolution.
Among others, Reine (2020) showed how the inversion of PP prestack data could assist with the interpretation of a single reflection event, which can be produced by different geological elements, as for example, a sand channel, or point bar, or mud plug. He showed that the resulting density obtained from the simultaneous inversion was consistent with the well data and noted that a significant density difference between two wells B and C could produce similar amplitudes of stack data at the two locations (Figure 9).
For the oil sands reservoirs, density is critical to discriminate between facies types with varying amounts of clay content because higher clay content corresponds to higher density. For the case shown in Figure 9, using a crossplot of MuRho -Vs2*ρ vs density allowed the interpretation of well facies on the equivalent seismic properties obtained from simultaneous inversion (Figure 10). Interesting to note is that the facies interpretation from well and seismic data produces a clearer geologic picture than the amplitudes.
The spatial heterogeneity of the heavy oil deposits and the thin, intraformational shale layers can be challenging as their thickness is finer than the deterministic inversion’s vertical resolution. An alternative approach is a stochastic or geostatistical inversion, which removes some of these limitations by simulating multiple scenarios (realizations) having the same result at the wells but with vertical and lateral variability beyond seismic resolution. The vertical and horizontal variability is constrained by mathematical functions called variograms, which are spatially varying statistics obtained from well data, and in the case of these inversions, the seismic data too.
“With the improved estimation of the S-impedance and density from pre-stack or joint inversion, we can have a better delineation of the hydrocarbon distribution.”
cHOA JOUrNAL — December 2021 44
“The inversion results and their derivatives are often used as external attributes in neural network predictions to improve the resolution.”
Figure 9: Seismic stacked section (top) and corresponding inverted density (bottom). Inserted Vshale logs on the seismic section indicate higher shale content at Well C than wells A and B. On the density section, the densities estimated at the well locations correlate very well with inserted variable density logs (Reine, 2020, published with permission). The interpreted discontinuity is shown in red. (From Reine et al., 2020).

cHOA JOUrNAL — December 2021 45
Figure 10:
voir base through the classified seismic volume. C) Amplitude map extracted 20 ms above the reservoir base. Note the difference between features on the amplitude map shown in c) and the corresponding lithology in b). (From Reine et al., 2020).

The geostatistical method reduces the non-uniqueness of the inversion process because all realizations satisfy the observed seismic data and therefore are equally possible. The process only constrains the high frequencies. Averaging all realizations will result in a similar result as that of the more commonly used deterministic inversion (Delbecq and Moyen, 2010). The number of high-frequency realizations is determined by the variograms and the number of layers in the initial model (the stratigraphic grid). The stochastic realizations can be combined, based on various statistical geometric criteria such as sand or shale thickness or lateral extent, to estimate probability cubes, which can be selected to interpret different scenarios.
Figure 11 shows a schematic representation of the frequency spectra of the deterministic and stochastic results:
• in deterministic inversion, the frequency spectrum includes a lowfrequency component obtained from the well’s depth trends. A seismic bandwidth component shows layering patterns close to the upper frequency limit of the seismic data; and
• in stochastic inversion, the statistical well information generates a higher frequency component beyond the upper seismic frequency, but constrained by variograms determined from seismic and wells, in the form of micro-layering at a sub-seismic scale.
a) Crossplot of MuRho vs. Density with seismic points coloured by facies, showing that these attributes permit the separation of facies types based on the clay content (small-size points are from wells, and super-imposed larger points are from seismic). B) Horizon slice 20 ms above the reser-
cHOA JOUrNAL — December 2021 46
Figure 11: Comparison of frequency spectra for deterministic and stochastic inversions. While the deterministic inversion has a vertical resolution limited by the seismic bandwidth, the bandwidth of the stochastic inversion is larger and suggests that its vertical resolution is similar to that of well logs. Combined and modified from Delbecq and Moyen, 2010, and Pendrel and Van Riel, 2000.

Each inversion scheme has its advantages and limitations, with deterministic inversions being robust even in the presence of poor data, and stochastic inversion having increased resolution and quantified uncertainties. The increased vertical resolution of the stochastic inversion could provide a more accurate distribution of the reservoir elastic properties. In turn, it will produce a more detailed facies distribution and better estimation of reservoir connectivity. Detection of small-scale elements such as thin shale layers within the inclined heterolithic strata (IHS) is critical. They can constitute barriers in reservoir development and are more challenging to resolve. The seismic bandwidth and their thickness and seismic velocity control their detectability (Zhang et al, 2012).
Usually, the inversion is performed in conjunction with the quantitative interpretation of reservoir properties and lithology classification. This step connects the inverted elastic properties to more understandable reservoir properties such as porosity, saturation, clay content, and lithology.
However, one of the challenges of extracting the reservoir properties from the AVO signatures is that the relationship between the reservoir physical properties and elastic properties obtained from inversion is non-unique. Ambiguity can occur between various lithologies, porosity, and fluids. For example, shales could mimic the seismic signatures of uncemented sands, or heavy oil with dissolved gas could have similar properties as freshwater sands (Reine, 2017). In contrast, clean and slightly cemented sands can have a distinct seismic response different than clean oilsaturated uncemented sands, even when they have comparable porosities and composition (Avseth et al, 2013). One option to resolve these types of sedimentological variations is to combine inversion with rock physics modelling. The rock physics model of the reservoir will add constraints from the known petrophysical properties and their local expected change.
cHOA JOUrNAL — December 2021 47
“Usually, the inversion is performed in conjunction with the quantitative interpretation of reservoir properties and lithology classification. This step connects the inverted elastic properties to more understandable reservoir properties such as porosity, saturation, clay content, and lithology.”
AVO techniques have a tremendous utility in the characterization of the oil sands reservoirs, despite the myriad complications affecting the seismic amplitudes (some of them discussed here). Experience has shown that one of the most robust strategies is integrating the seismic reflection data with AVO inversion and rock physics modelling. The key properties in the facies analysis are the density and Vp/Vs. They are
Draga Talinga
lithology-dependent, with bitumen sands having higher densities and lower Vp/Vs and shales having lower densities and higher Vp/Vs. These properties, determined from seismic data, have proven to be very useful in delineating oil sands reservoirs.
REFERENCES
Comprehensive references for this article are located online.
Draga Talinga is a Senior Geophysicist at Sound QI Solutions, focusing on reservoir characterization. With over 20 years in research, oil and gas and consulting, Draga has extensive experience in a wide range of projects in basins around the world. Draga holds a B.Sc. and an M.Sc. from the University of Bucharest, a Ph.D. from the University of Calgary, and a Postdoctoral Fellowship from Simon Fraser University, all in Geophysics. Her current professional interests include using integrated quantitative analysis for subsurface geological, geomechanical and petrophysical characterization.

David Gray
David Gray frequently lectures on geophysics and has presented over 100 papers at technical conferences and luncheons. His career has included positions at Veritas, CGG and Nexen, and he has made notable contributions to quantitative seismic interpretation, seismic geomechanics, and seismic fracture characterization. He holds numerous patents. David received a Bachelor of Science degree in Honors Geophysics from the University of Western Ontario and a Masters of Mathematics degree in Statistics from the University of Waterloo. David is a consultant, and currently a member of SPE, SEG, CSEG and APEGA.
Hong Feng

Hong Feng obtained his B.Sc. in Geophysics from Yangtze University and an M.Sc. in Geophysics from each of the China University of Petroleum and the University of Calgary. Hong has worked for PetroChina, Sinopec, Sproule Associates and Husky Energy. Currently at Cenovus Energy Inc., he is working as a reservoir geophysicist on SAGD reservoir characterization and 4D time-lapse steam chamber imaging. He has authored/ co-authored several papers at SEG, EAGE, and GeoConvention on AVO analysis, Full Waveform Inversion (FWI), and Distributed Acoustic Sensing (DAS). Hong is a member of the SEG, CSEG and EAGE.
Don C. Lawton
Don Lawton is Director of the Containment and Monitoring Institute at Carbon Management Canada and is Professor Emeritus of Geophysics at the University of Calgary. His research activities include acquisition, processing and interpretation of seismic data, advancing monitoring methods for geological storage of CO2 and integrated geophysical and geological studies in complex geological settings. He was co-recipient of an NSERC and the Conference Board of Canada University/Industry Synergy Award (2000), was awarded the Canadian Society of Exploration Geophysicists Medal (2000) and received Honorary Membership in the Society (2014).
Brian Wm. Schulte

Brian Wm. Schulte graduated from the University of Calgary with a Bachelor of Science in Geology (Geophysics Minor). Brian has worked in seismic processing, acquisition, interpretation, rock physics, and petrophysics. He has worked for companies including Gale-Horizon, Schlumberger, Vastar (division of Arco), BP, Explora Seismic Processing, Geokinetics, Talisman, and Repsol. Brian is a consultant who also volunteers to train graduate students studying Geoscience, Engineering, and Public Policy in soft skills not taught at university, with an emphasis on projects involving low carbon energy, integration and thinking out of the box.
Conclusions for Part 1
cHOA JOUrNAL — December 2021 48
CONNECT. SHARE. LEARN. LEAD.
STAY TUNED FOR THE NEXT ISSUE OF THE CHOA JOURNAL, COMING TO YOU IN FEBRUARY 2022


December 2021

