2 minute read
People in Poverty


People in Poverty
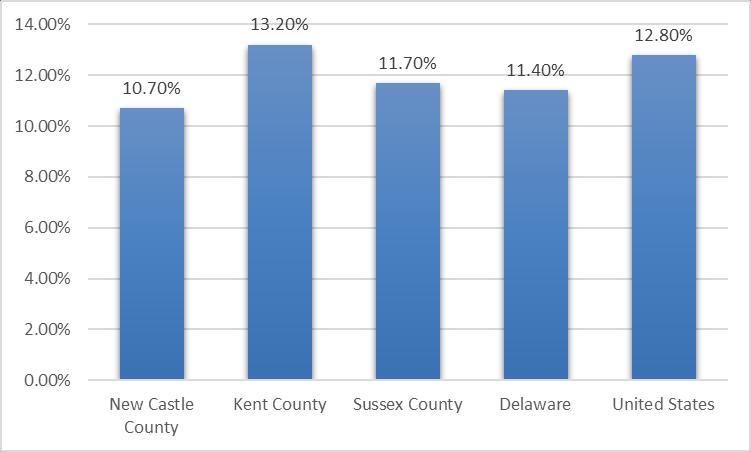
Exhibit 12: Percent of People in Poverty, 2016-2020
Source: U.S. Census, ACS 5-Year Estimates, 2020.
Description Exhibit 12 portrays poverty rates in New Castle County, Kent County, Sussex County, Delaware, and the United States. Observations
• In 2016-2020, the poverty rate in New Castle County was below all Delaware counties and United States averages.
Exhibit 13: Poverty Rates by Race and Ethnicity, 2016-2020
Hispanic Area White Black Asian (or Latino) All Races/ Ethnicities
New Castle County 7.9% 16.7% 10.8% 16.3% 10.7% Kent County 10.2% 18.9% 12.2% 17.6% 13.2% Sussex County 9.7% 20.2% 16.0% 24.6% 11.7% Delaware 18.4% 17.6% 11.4% 18.4% 11.4% United States 10.6% 22.1% 10.6% 18.3% 12.8%
Source: U.S. Census, ACS 5-Year Estimates, 2020.
Description Exhibit 13 portrays poverty rates by race and ethnicity. Light grey shading indicates rates above the U.S average for all races/ethnicities combined (12.8 percent) and dark grey shading indicates rates more than 50 percent above the U.S. average for all races/ethnicities combined. Observations
• In 2016-2020, New Castle County poverty rates were above the U.S. average for
Black and Hispanic (or Latino) populations than for both White population and all races/ethnicities combined.
Exhibit 14: Low Income Census Tracts, 2019

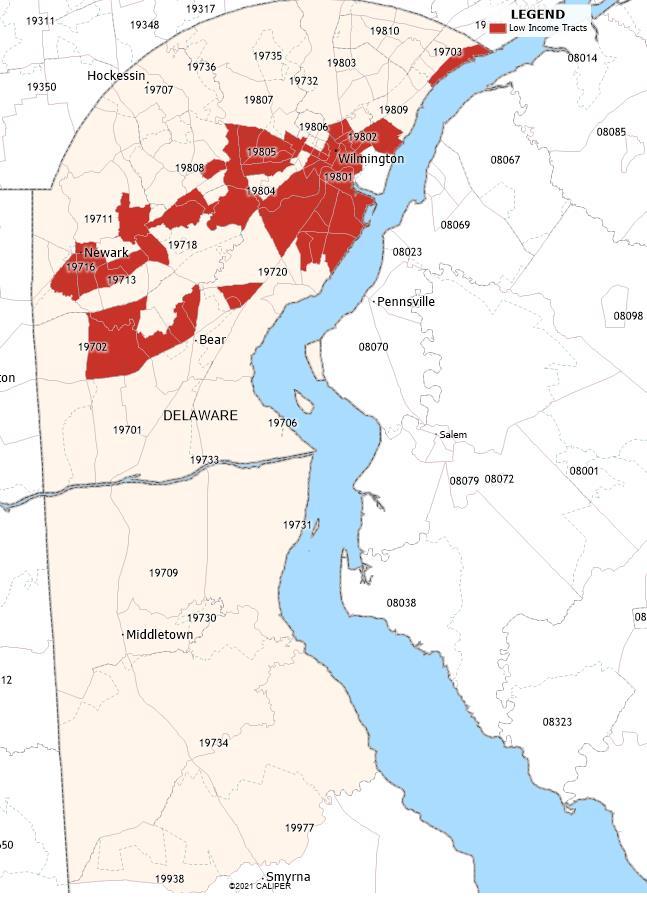
Source: U.S. Department of Agriculture, Economic Research Service, 2019 and Maptitude, 2021.
Description Exhibit 14 portrays the location of federally designated low-income census tracts. Observations
• In 2019, low-income census tracts were located primarily in Newark and
Wilmington and Community 1.
Exhibit 15: Select Socioeconomic Characteristics, Community 1 versus Community 2, 20152019
Indicator New Castle
Community 1 Community 2 County
Total Population Living in Poverty Low Income(<200% of FPL) Percent Racial/Ethnic Minority Percent Hispanic Percent Black Uninsured Limited English Less than High School Diploma 204,004 347,490 551,494 16.8% 8.3% 11.2% 35.2% 17.5% 24.0% 59.5% 33.2% 42.0% 14.4% 7.5% 9.7% 40.7% 16.2% 25.0% 6.7% 4.5% 5.2%
3.1% 12.5% 2.0% 5.7% 2.4% 8.4%
Source: Health Resources and Services Administration. UDS Mapper, 2019.
Description Exhibit 15 illustrates the substantial disparity in socioeconomic indicators between Community 1, Community 2, and New Castle County as a whole. Observations
• Community 1 had more than double the population living in poverty compared to
Community 2 (16.8 percent compared to 8.3 percent) • Community 1 had a significantly higher percentage of residents who identified as a racial/ethnic minority.
• Community 1 residents were more likely to be uninsured, have limited English proficiency and were less likely to have a high school diploma than Community 2 residents.
Exhibit 16: Select Socioeconomic Characteristics, Delaware, LGBT versus Straight, 2019
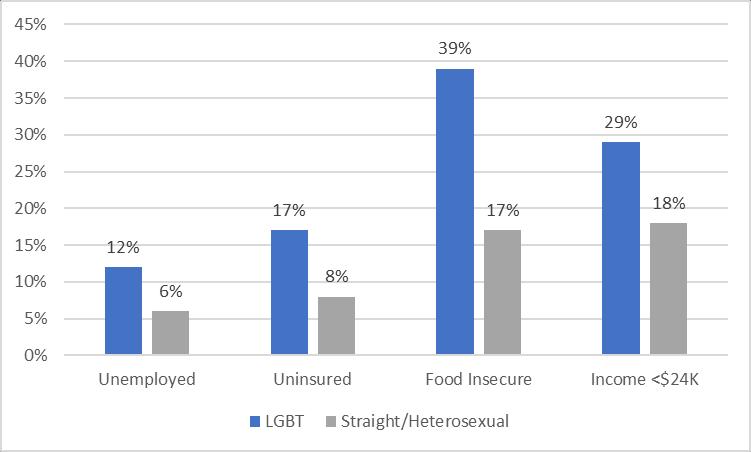
LGBT Demographic Data Interactive, January 2019, Los Angeles, CA: The Williams Institute, UCLA School of Law.
Description Exhibit 16 illustrates the significant disparity in socioeconomic indicators between the LGBT community in Delaware versus the straight community in Delaware. Observations
• LGBT individuals are more likely to be unemployed, uninsured, food insecure and have low-income than those who identify as straight/heterosexual.


