
2 minute read
Centers for Disease Control and Prevention Social Vulnerability Index (SVI


Exhibits 24 through 27 show the Centers for Disease Control and Prevention’s Social Vulnerability Index (SVI) scores for census tracts throughout the community. Red highlighted census tracts are in the bottom quartile nationally for different indicators on which the SVI is based.
The overall SVI is based on 15 variables derived from U.S. census data. Variables are grouped into four themes, including:
• Socioeconomic status; • Household composition; • Race, ethnicity, and language; and • Housing and transportation. Exhibits 24 through 27 highlight SVI scores for each of these themes.
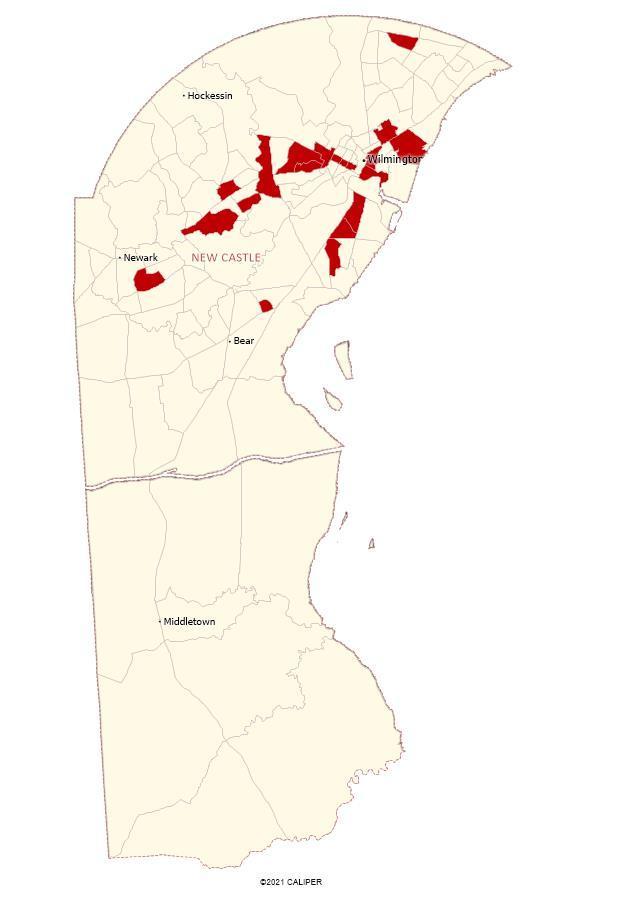
Exhibit 24: Socioeconomic Status Index – Bottom Quartile Census Tracts

Source: Centers for Disease Control and Prevention, 2018, and Caliper Maptitude, 2021.
Description Exhibit 24 identifies census tracts in the bottom quartile nationally for socioeconomic vulnerability. Observations
• Census tracts with the highest levels of socioeconomic vulnerability were Wilmington and Newark. • Most of these census tracts were located within Community 1 ZIP Codes. • About 20 percent of the community’s total population lived in census tracts with the highest socioeconomic vulnerability. Exhibit 25: Household Composition and Disability Index – Bottom Quartile Census Tracts

Source: Centers for Disease Control and Prevention, 2018, and Caliper Maptitude, 2021.
Description Exhibit 25 identifies census tracts in the bottom quartile nationally for household composition and disability vulnerability. Observations
• Census tracts with the highest household composition and disability index were in
Wilmington and Newark. • Most of these census tracts were located within Community 1 ZIP Codes • About 12 percent of the community’s total population lived in the highlighted census tracts.
Exhibit 26: Minority Status and Language Index

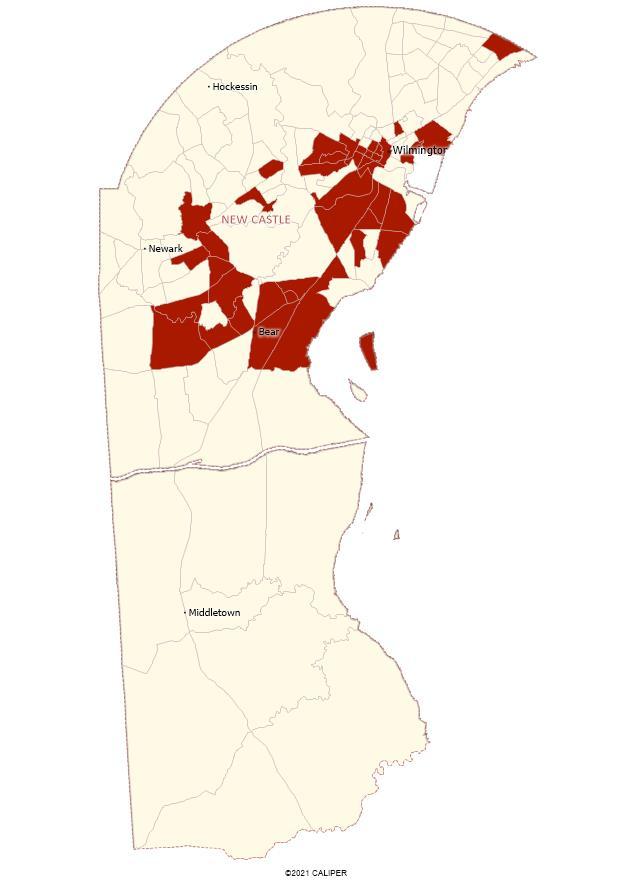
Source: Centers for Disease Control and Prevention, 2018, and Caliper Maptitude, 2021.
Description Exhibit 26 portrays minority status and language vulnerability by census tract. Observations
• The highest percentage of population with minority status and language vulnerability were in Wilmington, Newark, and Bear.
• Many of these census tracts were located within Community 1 ZIP Codes. • About 29 percent of the community’s total population lived in tracts with the highest minority status and language vulnerability. Exhibit 27: Housing Type and Transportation Index – Bottom Quartile Census Tracts


Source: Centers for Disease Control and Prevention, 2018, and Caliper Maptitude, 2021.
Description Exhibit 27 identifies census tracts in the bottom quartile nationally for housing type and transportation vulnerability. Observations
• The highest percentage of population with housing type and transportation vulnerability were in New Castle, Newark, Claymont and Wilmington. • About 23 percent of the community’s total population lived in tracts with the highest housing type and transportation vulnerability.


