Quality Safety &


REPORT 2023
Building on what we do best, ChristianaCare will achieve breakthrough outcomes by creating a boundless organization to…

2 | ChristianaCare Quality & Safety Report 2023
Table of Contents Quality & Safety Awards and Recognition 4 Clinical Effectiveness Structure . . . . . . . . . . . . . . . . . . . . . . . . . . . . . . . . . . . . . . . . . . . . . . . . 10 Strengthen the Core . . . . . . . . . . . . . . . . . . . . . . . . . . . . . . . . . . . . . . . . . . . . . . . . . . . . . . . . . . . 12 End Disparities . . . . . . . . . . . . . . . . . . . . . . . . . . . . . . . . . . . . . . . . . . . . . . . . . . . . . . . . . . . . . . . 98 Keep People Healthy at Home . . . . . . . . . . . . . . . . . . . . . . . . . . . . . . . . . . . . . . . . . . . . . . . . 112 Enable Every Caregiver to Thrive . . . . . . . . . . . . . . . . . . . . . . . . . . . . . . . . . . . . . . . . . . . . . . 133 Accelerate Growth & Transformation . . . . . . . . . . . . . . . . . . . . . . . . . . . . . . . . . . . . . . . . . . . 145 Radically Simplify Access 150 ChristianaCare Way Awards . . . . . . . . . . . . . . . . . . . . . . . . . . . . . . . . . . . . . . . . . . . . . . . . . . . 162
Fiscal Year 2023 Achievements and Recognitions in Quality & Safety
1% TOP
Healthgrades names ChristianaCare one of America’s 50 Best Hospitals for third consecutive year
For the third consecutive year, ChristianaCare has earned Healthgrades America’s 50 Best Hospitals Award™ and is among the top 1% of more than 4,500 hospitals assessed nationwide for consistent, year-over-year superior clinical performance. ChristianaCare also received the following distinctions from Healthgrades:
• America’s 100 Best Hospitals for Cardiac Care Award™ for two years in a row (2022-2023).
• America’s 100 Best Hospitals for Coronary Intervention Award™ in 2023.
• America’s 100 Best Hospitals for Gastrointestinal Surgery Award™ for 12 years in a row (2012-2023).
• America’s 100 Best Hospitals for Spine Surgery Award™ for 10 years in a row (2014-2023).
• America’s 100 Best Hospitals for Joint Replacement Award™ for eight years in a row (2016-2023).
• America’s 50 Best Hospitals for Surgical Care for two years in a row (2022-2023).
4 | ChristianaCare Quality & Safety Report 2023
Healthgrades evaluated patient mortality and complication rates for 31 of the most common conditions and procedures at nearly 4,500 hospitals across the country to identify the topperforming hospitals. This year’s analysis revealed significant variation between America’s Best 50 Hospitals and hospitals that did not receive the distinction. In fact, if all hospitals performed similarly to America’s 50 Best, more than 150,000 lives could potentially have been saved. Patients treated for heart failure at ChristianaCare and other 2023 America’s 50 Best Hospitals have, on average, a 22.8% lower risk of dying than if they were treated at a hospital that did not receive the award.*
* Statistics are based on Healthgrades analysis of MEDPAR data for years 2019 through 2021 and represent threeyear estimates for Medicare patients only.
Outstanding clinical outcomes
ChristianaCare was also named by Healthgrades as one of America’s 50 Best Hospitals for Surgical Care and achieved the 2023 America’s 100 Best Hospitals Award™ for outstanding clinical outcomes in five service lines, including:
• Cardiac care.
• Coronary intervention.
• Joint replacement.
• Spine surgery.
• Gastrointestinal surgery.
“Achieving the prestigious Healthgrades recognition year after year after year only occurs when you have a workforce whose standard is care that is safe and of the highest quality. This recognition belongs to all the members of our clinical team, who hold themselves to the highest professional standards.”
Achievements and Recognitions | 5
Kert Anzilotti, M .D , MBA, Chief Medical Officer
Aetna Institutes of Excellence Award to the Bone Marrow Transplant Program at the Helen F. Graham Cancer Center & Research Institute.

American College of Cardiology NCDR 2023 Chest Pain – MI Registry Platinum Performance Achievement Award, fourth consecutive year; HeartCARE Center National Distinction of Excellence, third consecutive year; and Cardiology Chest Pain Center with Primary Percutaneous Coronary Intervention and Resuscitation accreditation.
American College of Surgeons Commission on Cancer three-year reaccreditation to the cancer program at ChristianaCare’s Helen F. Graham Cancer Center & Research Institute for meeting 34 quality care standards with zero deficiencies. The Commission on Cancer praised the Graham Cancer Center’s leadership that has built a “culture of continual process improvement across all areas from prevention, screening, treatment and support for the patient.”
American College of Surgeons National Surgical Quality Improvement Program Surgical Quality Awards 10th consecutive year with meritorious outcomes.
6 | ChristianaCare Quality & Safety Report 2023
Association of Community Cancer Centers (ACCC) 2022 Innovator Award to the Helen F. Graham Cancer Center & Research Institute for its person-centered model of care that embeds a primary care provider in the cancer center for patients undergoing treatment who do not have a primary care provider. The Graham Cancer Center is among the first cancer programs in the nation to offer a program of this kind to its patients.
American Heart Association Get with the Guidelines
Coronary Artery Disease
• Mission Lifeline STEMI Receiving GOLD PLUS award.
• Mission Lifeline NSTEMI GOLD award.
Heart Failure
• GOLD PLUS with Target Type 2 Diabetes Honor Roll.
Stroke
• Gold Plus/Target Stroke Elite Plus Honor Roll.

• Target Stroke Advanced Therapy.
• Target Diabetes Honor Roll.
2018 Achievements and Recognitions | 7
College of Healthcare Information Management Executives (CHIME) seventh consecutive “Most Wired” designation and Transformational Leadership Award.
Forbes Magazine #2 employer for diversity and inclusion in the health care industry (2022); #40 employer in the nation overall.
Foundation for the Accreditation of Cellular Therapy (FACT) three-year reaccreditation to the Bone Marrow and Stem Cell Transplant Program at the Helen F. Graham Cancer Center & Research Institute.
Healthgrades Patient Safety Excellence Award™ (2023) to Union Hospital of Cecil County.
Immunization Action Coalition Hepatitis fifth consecutive honor roll distinction.
Modern Healthcare Top 25 Women Leaders List – Janice Nevin, M.D., MPH.
Mogul Top 100 Companies with Inclusive Benefits for both diverse hiring practices and progressive workplace resources.

Newsweek World’s Best Hospitals fifth consecutive year.
8 | ChristianaCare Quality & Safety Report 2023
Optum Center of Excellence for Bariatric Surgery. The Wilmington Hospital program was also recognized by:
• Aetna Institutes of Quality.®
• Blue Distinction Center® for Bariatric Surgery.
• Cigna Three-Star Quality Center for Bariatric Surgery.
• Metabolic and Bariatric Surgery Accreditation and Quality Improvement Program accreditation through 2024.
Society of Thoracic Surgeons three stars for patient-centered care and outcomes in isolated coronary artery bypass grafting (CABG) procedures (two stars for overall morbidity).
U.S. News & World Report No. 1 hospital in Delaware; No. 4 hospital in the Philadelphia region:
• No. 42 in the nation in obstetrics and gynecology.
• Best Hospitals for maternity care.
• High performing in orthopedics.
Achievements and Recognitions | 9
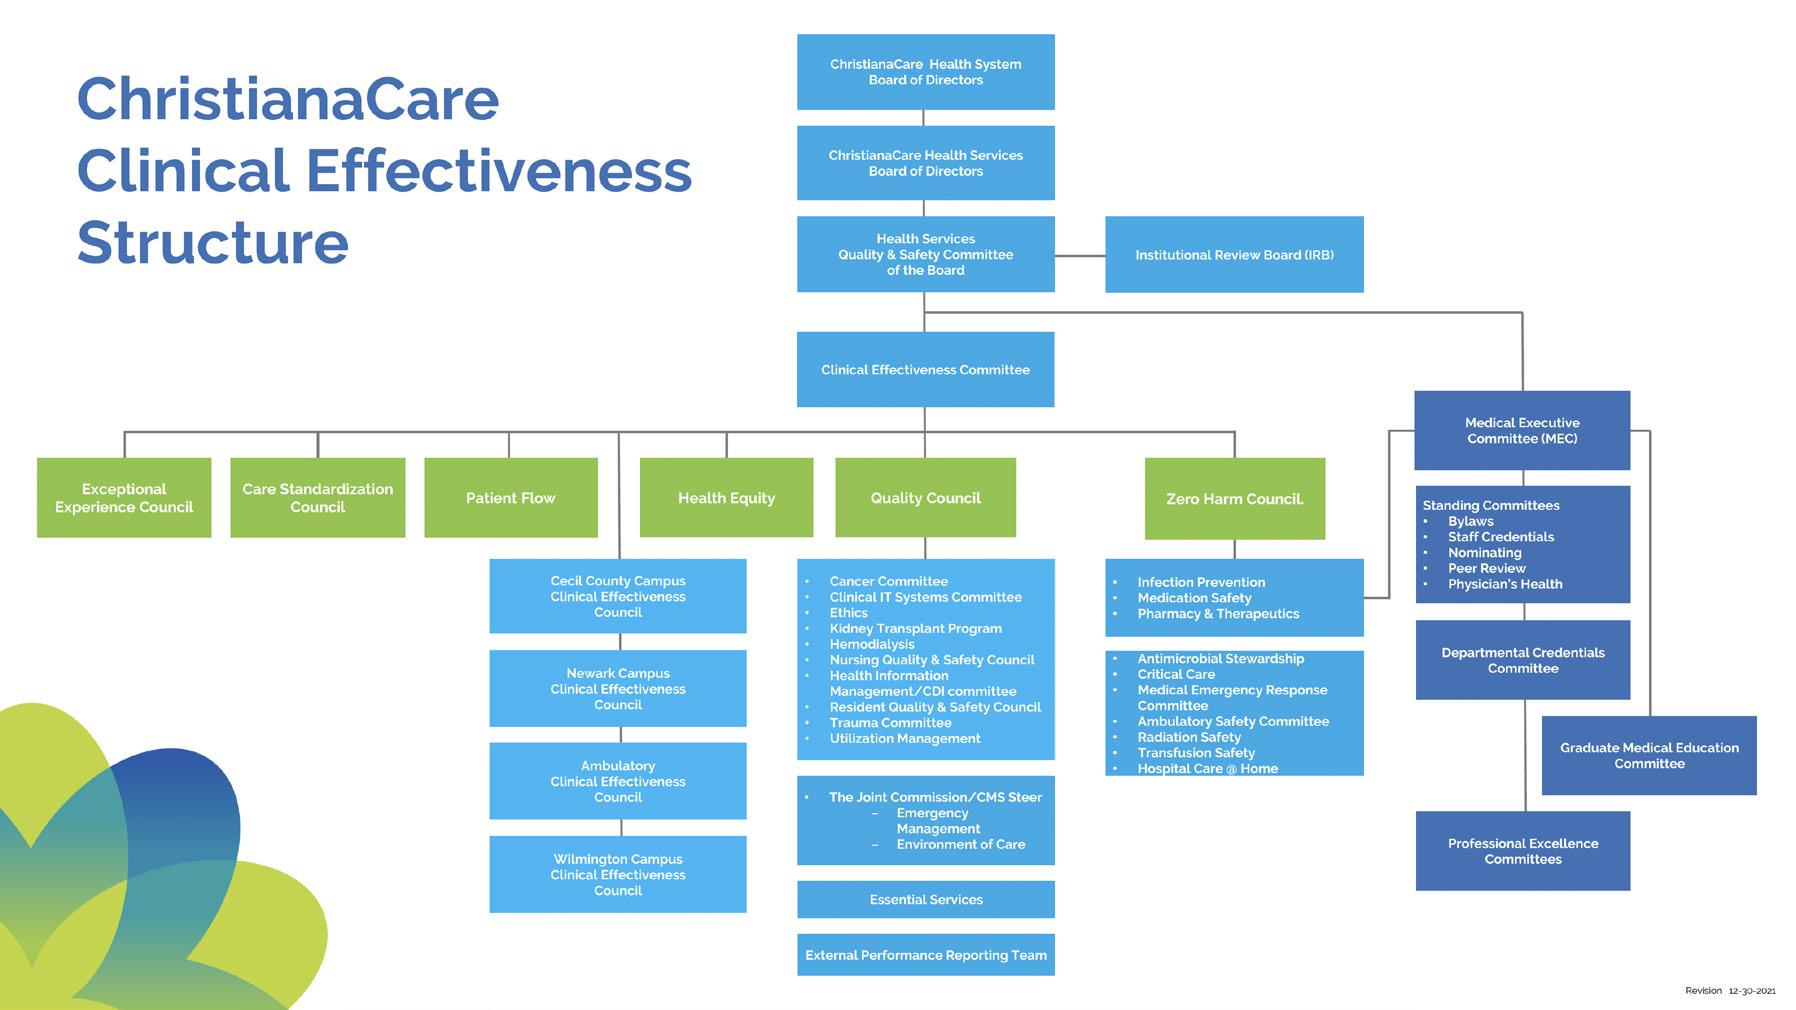
Clinical Effectiveness Structure
Clinical Effectiveness structure guides work toward strategic aims
The Quality & Safety Committee of the ChristianaCare Health Services Board of Directors monitors and oversees the quality, safety, care standardization and patient experience, which we aggregate under the title Clinical Effectiveness. The organization’s Aspirations guide us and serve as the ultimate end point for delivering the highest quality of care to our community.
The Clinical Effectiveness structure was established with the organization-wide commitment to positively impact the quality and safety of care delivered within our organization. The Clinical Effectiveness Committee, which reports to the Quality & Safety Committee, serves as the interdisciplinary forum to lead the design, governance and implementation of initiatives used to meet our organization’s goals. This committee promotes being exceptional today and even better tomorrow and, since inception, has worked not only to improve the outcomes associated with our pursuit, but also to evolve to best utilize the time of our participants and stakeholders.
The pillars of Clinical Effectiveness, which are Zero Harm, Care Standardization, Quality, Exceptional Patient Experience, Equity and Patient Flow, help leaders and stakeholders organize the work being completed. This year, committee meetings are designed and facilitated specifically to solicit feedback and discuss barriers within every pillar.
In the past year, the organization embarked on an effort to be ranked among the top 25 in our Vizient peer group by 2025 (see page 62). By focusing on measures included within Vizient’s ranking system, we are able to impact a multitude of other external grading entities such as the Centers for Medicare & Medicaid Services (CMS), Healthgrades and Leapfrog.
10 | ChristianaCare Quality & Safety Report 2023
Clinical Effectiveness Structure | 11
Strengthen the Core
5-YEAR GOALS
• Create highly effective care transitions.
• Meet annual clinical effectiveness targets across Optimal Health & Flow, Exceptional Experience and Health Equity domains.
• Redesign our work to support our caregivers, achieve organizational efficiencies and eliminate waste.
IMPERATIVES
• Streamline inpatient flow, including highly effective transitions of care.
• Enhance care coordination and clinical collaboration capabilities.
• Drive clinical standardization.
• Fully understand, capture and act on each patient’s clinical disease burden.
• Meet workforce effectiveness targets leveraging technology where appropriate.
12 | ChristianaCare Quality & Safety Report 2023
PREVENTABLE HARM
ChristianaCare among top-performing academic medical centers for constant focus on eliminating preventable patient harm
ChristianaCare’s constant focus on eliminating preventable patient harm places us among top-performing academic medical centers. In 2022, Vizient ranked us 8th among more than 100 of our peers.
This fiscal year, for the first time in several years, ChristianaCare saw an increase in preventable harm due to lasting impacts of the COVID-19 pandemic. Similar trends have been reported nationally. Our strong risk-adjusted performance during this difficult time reflects our commitment to providing high-quality and safe care to the communities we serve, as well as continuous improvement through application of high reliability concepts.
ChristianaCare tracks 22 measures of harm across all three campuses and our ambulatory practices, encompassing hospital-acquired infections, complications of care, and potentially preventable admissions for ambulatory sensitive conditions.
Fiscal year 2023 to date, through March 2023, the overall preventable harm rate increased to 2.04 from 1.86 for the same period in fiscal year 2022. A sizable portion of the rise is related to increases in the number of patients with diabetes or hypertension admitted to the hospital for exacerbation of their conditions (reflecting pandemic-related increased severity of illness and decreased access to care). Excluding these ambulatory practice measures, the harm rate rose only 2% to 1.40 from 1.37.
Even with the difficulties over the past few years, progress toward zero harm over the past seven years remains noteworthy. Since fiscal year 2017, the preventable harm rate has decreased 20% to 2.04 from 2.54 patients harmed per 1,000 patient days — with almost 1,200 fewer patients experiencing harm. continued
page 14 Strengthen the Core: Preventable Harm | 13
on
Preventable Harm Rate
The preventable harm rate, including all 22 measures of harm, increased 10% in FY 2023 to date, to 2.04 from 1.86. Excluding the newer ambulatory practice measures, the harm rate increased 2.0% to 1.40 from 1.37.
Preventable Harm Rate: Annual Trend
Preventable harm rate increased slightly this fiscal year, but remains below historical performance even with the expansion of sites and measures.
14 | ChristianaCare Quality & Safety Report 2023
DESIRED DIRECTION
DESIRED DIRECTION
0. 0 0. 5 1. 0 1. 5 2. 0 2. 5 3. 0 Jul-20Sep-20Nov-20Jan-21Mar-21May-21Jul-21Sep-21Nov-21Jan-22Mar-22May-22Jul-22Sep-22Nov-22Jan-23Mar-23 Harm per 1000 patient days Prev entable Harm Rate Ha rm Rat e 2.54 2.17 1.72 2.06 1.98 1.89 2.04 0. 0 0. 5 1. 0 1. 5 2. 0 2. 5 3. 0 F Y17 F Y18 F Y19 F Y20 F Y21 F Y22 F Y23 Harm per 1000 patient days Cecil County added Apr 2019 Ambulatory Practices added Jan 2020 (excludes Ambulatory)
Preventable harm efforts drive decrease in overall number of harm cases based on Patient Safety Indicator metrics
ChristianaCare measures 11 Agency for Healthcare Research and Quality (AHRQ) patient safety indicators (PSI) as part of preventable patient harm in our journey to zero harm. We continue to see improvement in many metrics, with the overall number of cases down 52% to 110 from 161 since fiscal year 2021.
Patient Safety Indicators
Hosp Acquired Pressure Injuries (PSI 3)
Iatrogenic Pneumothorax PSI 6)
In Hospital Fall w Hip Fracture (PSI 8)
Postop Hemorrhage/Hematoma (PSI 9)
Postop Acute Kidney Injury (PSI10)
Postop Respiratory Failure (PSI11)
Periop PE/DVT (PSI12)
Postop Sepsis (PSI13)
Postop Wound Dehiscence (PSI14)
Accidental Puncture/Laceration (PSI15)
Death in Surgical Pts w Complications (PSI4)
Three fewer patients were harmed through PSI complications in FY 2023 compared to FY 2022, and 51 fewer compared to FY 2021.
continued on page 16
DESIRED DIRECTION
Number of Cases FY 2021 FY 2022 FY 2023 0 20 40 60
Strengthen the Core: Preventable Harm | 15
The Patient Safety Indicator Composite (PSI 90) is a weighted composite of 10 individual PSI metrics, largely associated with post-surgical complications. The Centers for Medicare & Medicaid Services (CMS) uses the PSI 90 in its pay for performance programs and star ratings. Leapfrog and other national hospital ratings systems also employ the measure to rank hospital performance. In fiscal year 2020, ChristianaCare’s PSI 90 composite rate was 40% above the national rate of 1.0 for Medicare patients, and even higher for all patients.
PSI 90 Composite
There has been incremental improvement in the PSI 90 composite each year, with the rate decreasing 39% for Medicare patients and 46% for all patients since FY 2020. It is now below national levels.
16 | ChristianaCare Quality & Safety Report 2023
DESIRED DIRECTION 0.00 0.20 0.40 0.60 0.80 1.00 1.20 1.40 1.60 1.80 FY2020 FY2021 FY2022 FY2023 YTD Risk-Adjusted Rate Medicare All Inpatients National 1.00
Prevention
strategies
drive
continued improvement in PSI 03 HAPI rate
Systemwide efforts to sustain improvement in the hospital-acquired pressure injury (HAPI) rate have led to a decrease of 85% since 2019.
Hospital-Acquired Pressure Injuries, Stage 3+ (PSI 03) Rate Per 1,000 Cases
Systemwide efforts led to sustained improvement in the HAPI rate, which decreased 88% since 2019, to 0.47 from 3.81.
Initial improvement efforts focused on PSI 03, HAPI stage 3 and greater. These initiatives, which began in 2019, included wound ostomy continence (WOC) nurse review of all suspected HAPI; Cerner Camera Capture to support appropriate identification of pressure injuries, present-on-admission determination and staging; changes to patient mattress support surfaces and prevention products and practices; and modifications to securement devices such as nasal-gastric tubing to prevent skin damage. Since 2019, the HAPI rate has decreased 88% to 0.47 events per 1,000 patients from 3.81.
The systemwide interprofessional HAPI team continues to implement strategies in the journey to zero harm through pressure injury prevention, including:
• The replacement of 624 mattresses based upon warranty guidelines.
• Improved identification of patients at high risk for pressure injuries through enhanced machine learning.
continued on page 18
0. 0 1. 0 2. 0 3. 0 4. 0 5. 0 6. 0 7. 0 Oct-18Dec-18Feb-19Apr-19Jun-19Aug-19Oct-19Dec-19Feb-20Apr-20Jun-20Aug-20Oct-20Dec-20Feb-21Apr-21Jun-21Aug-21Oct-21Dec-21Feb-22Apr-22Jun-22Aug-22Oct-22Dec-22Feb-23 PSI Rate (number per 1000 cases) HAPI Prevention Team DESIRED DIRECTION
Strengthen the Core: Preventable Harm | 17
• Product trials to evaluate incontinence pads, incontinence wipes and male external catheters to find the best product for patient care.
• Creation of job aids and educational materials for pressure injury prevention. The team has shared successful HAPI improvement strategies with several external organizations, and has been invited to present at an upcoming ECRI meeting on ChristianaCare’s work to create a culture of safety around pressure injury prevention.
As part of its standard content for all users, Cerner has now adopted ChristianaCare’s pressure injury documentation and workflow using Cerner Capture, iView for nursing and Dynamic Documentation for WOC patients and providers.
In collaboration with Organizational Excellence, members of ChristianaCare’s HAPI team shared findings and prevention strategies in three articles, two published in the International Journal of Environmental Research and Public Health and one in the Journal of Diagnostics.
INTERNATIONAL JOURNAL OF ENVIRONMENTAL RESEARCH AND PUBLIC HEALTH:
• Machine Learning Techniques, Applications, and Potential Future Opportunities in Pressure Injuries (Bedsores) Management: A Systematic Review
• An Integrated System of Multifaceted Machine Learning Models to Predict If and When Hospital-Acquired Pressure Injuries (Bedsores) Occur
JOURNAL OF DIAGNOSTICS:
• A Hybrid System of Braden Scale and Machine Learning to Predict Hospital-Acquired Pressure Injuries (Bedsores): A Retrospective Observational Cohort Study
18 | ChristianaCare Quality & Safety Report 2023
PSI 90 Steer drives sustained documentation and capture improvement
The sustained improvement in HAPI had a significant impact on the PSI 90 composite rate, but alone could not help us reach the national rate. PSI 90 reflects the safety climate of the hospital by providing a marker of patient safety—or avoidance of harm—during the delivery of health care. In 2021, ChristianaCare’s Clinical Documentation Integrity (CDI) team began a pre-bill review of all potential PSI cases to ensure appropriate documentation and capture –particularly of the complex exclusion criteria.
A process was established with CDI for an improved and more focused review of PSI cases for clinical opportunity – leading to the creation of the PSI 90 steer.
PSI Case Review Process
Pre-bill review of cases meeting PSI criteria by CDI for accuracy and completeness of documentation and coding.
Review cases using standard form to identify system clinical opportunities or potential peer review concerns.
Charter multidisciplinary teams led by appropriate clinical service to drive improvement related to priority areas.
Based on review of ChristianaCare and a peer comparison group (Vizient, all academic medical centers), PSI data for September 2021 – October 2022, the PSI Steer identified two PSI 90 component metrics as priorities:
• PSI 10 – Postoperative Acute Kidney Injury Requiring Dialysis (O/E 2.94, Peer 1.09).
• PSI 11 – Postoperative Respiratory Failure Rate.
1
2
3
STEP
STEP
STEP
Strengthen the Core: Preventable Harm | 19
Newly chartered PSI 10 team addresses complications of acute postoperative acute kidney injury
Postoperative acute kidney injury (AKI) is a complication of major surgery that is strongly associated with short-term surgical complications and long-term adverse outcomes, including increased risk of chronic kidney disease, cardiovascular events and death. PSI 10 includes these complications if dialysis is required after an elective surgery.
A PSI 10 Improvement Team was chartered in November 2022 with a goal to decrease the observed to expected (O/E) ratio to <= 1.0 by December 2023. The team is diligently working to establish standardized processes for early identification of high-risk patients, as well as mitigation of risk across the surgical continuum.
1 2 3 4
Risk Identification
A Guideline for Identification of High-Risk Patients was developed based on clinical review of evidence-based models, including SPARK (simple postoperative AKI risk) classification, and PostopMAKE (Major Adverse Kidney Event).
Preoperative Phase
Documentation of exclusion criteria, such as diagnosis of acute kidney failure on admission; nephrology consult for chronic kidney disease (CKD) stage 3b or higher; notification of anesthesia if patient is unstable, high risk or having complex procedure; minimize contrast studies and stop nephrotoxic agents pre-operatively; consider prophylactic dialysis for CKD 3b or higher.
Intraoperative Phase
Goal-directed fluid management, intraoperative dialysis.
Postoperative Phase
Initiation of dialysis within <24 hours; goals of care discussion; consult Supportive & Palliative Care prior to dialysis; minimize contrast studies and nephrotoxic agents.
Initial results are promising. The number of PSI 10 cases has decreased 50% fiscal year 2023 to date (through January), compared to the same period in fiscal year 2022. PSI, and the observed to risk-adjusted expected rate, has decreased 57% from baseline, to 1.25 from 2.94, and is now similar to the academic medical center (AMC) rate.
20 | ChristianaCare Quality & Safety Report 2023
PSI 10-Postop AKI: Observed to Risk-Adjusted Expected Ratio Comparison
The PSA 10 O/E ratio has improved 57% to 1.25 from 2.94, and is approaching the AMC peer group and 1.0 target.
The PSI 90 steer is now using the learnings from the PSI 10 work to improve PSI 11 PostOp Respiratory Failure, focusing on the surgical continuum stages from preoperative to intraoperative to postoperative, and expanding appropriate processes to cover these types of cases.
Postoperative respiratory failure is caused by delays in weaning from mechanical ventilation or unplanned intubation/reintubation after surgery. The complication is associated with increased costs, length of stay and mortality. Cases of PSI 11 increased by five in fiscal year 2023 to date compared to fiscal year 2022, and the O/E ratio remains above the AMC compare group.
Case review identified opportunities for improvement related to disposition after surgery to intensive care; stepdown or floor level of care appropriate to clinical presentation and comorbid conditions; and recognition and treatment of earliest signs of decompensation. Next steps include an escalation policy related to level of care disposition, and rounding cadence for patients boarding outside the intensive care unit; sharing cases studies at Mortality & Morbidity conferences; and reviewing cases in which patients are upgraded to a higher level of care after a Rapid Response Team event.
DESIRED DIRECTION
2.94 1.08 1.71 1.17 1.25 1.22 0.0 0.5 1.0 1.5 2.0 2.5 3.0 3.5
ChristianaCare
O/E Rati o Sep21-Aug22 Jan22-Dec22 Nov22-Jan23 Strengthen the Core: Preventable Harm | 21
Academic Medical Centers
Interdisciplinary review of hospital-acquired infections drives improvement
Standardized Infection Ratios remain stable; interdisciplinary teams focus on improvements
Hospital-acquired infections (HAI) are a focus of our journey to zero harm and account for 25% of harm cases measured by ChristianaCare. HAI increase patients’ risk for mortality and morbidity, and contribute to higher health care costs. Nationally, rates of most HAI increased during the COVID-19 pandemic, related to changes in hospital practices, longer patient lengths of stay, higher acuity, and more frequent use of medical devices.
ChristianaCare experienced an increase of 13 HAI cases in the six measures tracked as preventable harm during fiscal year 2023 through March, but HAI severity-adjusted rates, called Standardized Infection Ratios (SIRs), remained relatively stable. During the summer of 2022, we convened teams of interdisciplinary caregivers—including physicians, nurses, pharmacists, Infection Prevention, Environmental Services and others—to focus on the factors driving increases in central line-associated bloodstream infection (CLABSI), catheterassociated urinary tract infections (CAUTI), and Clostridioides difficile (C-difficile), specifically. Our Organizational Excellence colleagues are working with Information Technology and others to identify systemwide issues and implement solutions.
Hospital-Acquired Infections
C-difficile cases decreased 8% FY 2023 to date through March, while incidence of CLABSI and CAUTI increased by 13% and 32%, respectively.
22 | ChristianaCare Quality & Safety Report 2023
DESIRED DIRECTION 0. 0 0. 2 0. 4 0. 6 0. 8 1. 0 1. 2 1. 4 1. 6 0 10 20 30 40 50 60 C-di fficile C LABSI CA UTI HAI Rat e Number of Cases Ca ses- FY 2022 Ca ses- FY 2023 Ra te-F Y 2022 Ra te-F Y 2023
Key improvements to prevent HAIs include:
• Clostridioides difficile (C-difficile): piloted and ultimately implemented a new SmartZone alert, which notifies providers of patients entering the health system with significant diarrhea so that they can be identified earlier in their hospitalization. This allows for more rapid treatment and decreases the risk of spread to others.
• Catheter-associated urinary tract infection (CAUTI): implemented a new care management guideline for urinary catheter management and CAUTI prevention, which promotes alternatives to catheterization; allows for better bladder retraining while minimizing risk of infection; and optimizes care of the catheters for those who continue to require them. The Transitional Medical Unit conducted a successful pilot of breaks from Foley catheter use (attempted removal of catheters with steps to avoid re-insertion), with plans to spread systemwide in 2023 (see page 25). PREP (Post Retention Elimination Protocol) went live whole-house/all campuses May 31, 2023.
• Central line-associated bloodstream infections (CLABSI): launched a new care management guideline for central line management and CLABSI prevention, emphasizing optimal use and care for different types of central venous access. The team provided additional strategies for Nursing staff regarding chlorhexidine bathing – an important tool to reduce skin contamination (which can lead to central line infections), to help them manage patients who may refuse this critical intervention.
• Hand hygiene: renewed energy around conducting hand hygiene observations on all inpatient units using CipherRounds™, which provide real-time actionable data to managers. Each unit designates a number of hand hygiene observers among their staff, and Infection Prevention conducts validation rounds on each unit (see story, page 24).
• Water management plan: Infection Prevention worked closely with Facilities to develop and implement a comprehensive water management plan to reduce risks of health careacquired infections from waterborne pathogens, such as Legionella.
• Candida auris: Infection Prevention is working collaboratively with the Delaware Division of Public Health, frontline caregivers, the Microbiology Laboratory and Environmental Services, Information Technology and Nursing to minimize transmission of Candida auris, an emerging drug-resistant yeast first identified in Delaware in 2022. Enhanced environmental cleaning, as well as period and on-admission screening of high-risk patients, have helped to minimize transmission of this organism within the hospital.
continued on page 24 Strengthen the Core: Preventable Harm | 23
Hand Hygiene Trends
92% of the more than 58,000 hand hygiene observations completed during FY 2023 were fully compliant.
Hand Hygiene Contributing Factors
Choice
Hands
Improper
The primary identified factor contributing to the 27% of missed hand hygiene observations is distractions/forgetting.
24 | ChristianaCare Quality & Safety Report 2023
DESIRED DIRECTION 0% 20% 40% 60% 80% 100% Ju l-22 Aug-22 Sep-22 Oc t-22 No v-22 De c-22 J an-23 F eb-23 Ma r-23 Hand Hygiene Compliance Dispenser (path/obstruct/empty) 3% Other 2%
use of gloves
13%
full
equipment, meds)
nothing touched, not necessary
(supplies,
16% Perception-
16%
not to wash 23% Distractions/ 27% Forgetting
Transitional Medical Unit pilot PREPs patients for Foley removal; reduces CAUTI incidence
Between January and September 2022, usage of Foley catheters increased significantly on the 40-bed Transitional Medical Unit, which cares for chronic, critically ill patients. A PostRetention Elimination Protocol (PREP) pilot to introduce breaks from Foley catheter use decreased device days on the unit by 65% to 75 in April 2023 from 216 in May 2022, and the CAUTI rate dropped to zero from 4.0 during that same period.
Transitional Medical Unit: Foley Utilization
Foley catheter utilization decreased 29% to 0.17 from 0.25 Foley days per patient day, with zero cases of CAUTI after implementation of breaks from Foley catheter use.
Breaks from Foley catheter use through PREP are clinical guideline-directed attempts to prevent CAUTI by standardizing the removal of Foley catheters for patients with urinary retention. Steps involve identifying appropriate patients, educating them on bladder-retraining alternatives to catheterization to minimize the risk of infection, and securing patient and family buy-in. Caregivers are educated on the benefits of catheter removal; trained on catheter alternatives including toileting, bladder scans and bladder re-training to avoid the need for re-insertion; and learn steps to optimize care for patients who continue to require catheters.
The program will be rolled out systemwide before the end of fiscal year 2023.
DESIRED DIRECTION
Strengthen the Core: Preventable Harm | 25 0 1 2 3 0. 00 0. 05 0. 10 0. 15 0. 20 0. 25 0. 30 0. 35 Jan-22Feb-22Mar-22Apr-22May-22Jun-22Jul-22Aug-22Sep-22Oct-22Nov-22Dec-22Jan-23Feb-23Mar-23 Number of Infections Foley days /pateint days
Number of CAUTI Foley Utilization CUSP team Reboot Foley Pilot
below Magnet benchmark
Fall Prevention and Mobility team focuses on standardized risk-specific interventions Acute
ChristianaCare’s fall rate is consistently below the Magnet benchmark.
ChristianaCare’s acute care fall rate remains consistently below the American Nurses Credentialing Center Magnet Recognition Program benchmark, and falls with major injury are down 16% in fiscal year 2023 to date from fiscal year 2022.
26 | ChristianaCare Quality & Safety Report 2023
Falls with major injury decline, acute care fall rate remains
Care Fall Rate (Newark and Wilmington Campuses)
DESIRED DIRECTION
1.37 1.37 1.50 1.61 2.02 2.23 2.13 2.13 0. 0 0. 5 1. 0 1. 5 2. 0 2. 5 F Y20 F Y21 F Y22 FY TD 23 (Mar) Fall Rate (Falls per 1000 patient days) Ac ute Care Fall Rat e NDNQ I Magnet Bench mark
Falls with Major Injury
Number of Falls
Falls with major injury have declined slightly FY 2023 to date compared to FY 2022.
ChristianaCare’s systemwide Fall Prevention and Mobility team continues to work to prevent risk for falls with injuries and reduce all patient falls. This past year, the team focused on redesigning the nurses’ workflow in the electronic medical record (EMR) to standardize assessing for fall risk after a procedure and evaluate appropriate interventions. The workflow was also redesigned in the EMR to launch nurses’ orders to standardize risk-specific interventions when a patient is at high risk for injury related to a fall.
This past summer, the unit-based Nursing professional development specialists verified that all staff were competent in bed exit alarm engagement, as well as bed functionality. Fall prevention education was also developed for contract staff to ensure awareness of ChristianaCare’s fall prevention standards.
The team has also developed and implemented a standardized operating procedure outlining steps needed to open a unit to support capacity from a patient surge, using fall prevention best practices consistent with those used across the system. New technology on the market to reduce falls was evaluated based on an ECRI Safe table.
Finally, the team is converting the post fall huddle tool from paper to the online Report2Learn (R2L) event reporting system.
DESIRED DIRECTION
0 2 4 6 8 10 12 14 F Y20 F Y21 F Y22 FY TD 23 (Mar)
Ac ute Care Em ergency Department continued on page 28 Strengthen the Core: Preventable Harm | 27
Fall Prevention Strategies for High-Risk Patients
High Risk for an Injury
• Toilet patient q 2 hours
• Stay with patient while toileting
• Stay with patient while sitting on the edge of the bed
• Utilize bed/chair exit alarm
• Use gait belt with ambulation and transfer
PATIENTS SCORES A 1 IN ANY OF THE 5 CATEGORIES BELOW:
Mobility
• Stay with patient while toileting
• Utilize bed and/or chair exit alarm
• Use gait belt with ambulation & transfer
Mentation
• Stay with patient while toileting
• Utilize bed and/or chair exit alarm
• Initiate Delirium Interdisciplinary Plan of Care (IPOC)
Elimination
• Bladder scan
• Utilize bed and/or chair exit alarm
Prior Fall History
• Check orthostatic vital signs
• Utilize bed and/or chair exit alarm
• Use gait belt with ambulation & transfer
Current Meds
• Check orthostatic vital signs
• Utilize bed and/or chair exit alarm
• Educate patient and family about fall risk associated with listed medications
28 | ChristianaCare Quality & Safety Report 2023
Safe table event focuses on patient falls and safety
A virtual Safe Table event focused on patient falls and patient safety was facilitated in December 2022 by ECRI and the Institute for Safe Medication Practices Patient Safety Organization Program. The safe table method offers a structured approach to learn, share and foster discussion of safety events/ concerns within an organization in a collaborative, safe and protected environment. Session objectives included identification and discussion of:
• Common themes of contributing factors and root causes related to falls.
• Action plans being implemented within the organization.
• Action items that may need strengthening or require consideration of additional resources.
• Measures of success and accomplishing improved accountability of action items.
More than 90 leaders and caregivers attended the interactive session.
Strengthen the Core: Preventable Harm | 29
Cecil County interventions kickstart decrease in falls
During post-fall reviews, the Cecil County Falls Subcommittee identified variability in fall risk assessment using the Morse Fall Scale. An initiative was launched in January 2023 to assume that all inpatients were at high risk for falls, requiring:
• All patients to have a bed alarm activated.
• Staff assistance with mobility, including the use of gait belts.
• Direct supervision of patients when sitting on side of bed and/or using restroom.
In the three months since go-live (January – March), the number of inpatient falls decreased 53% to 7 from 15 for the prior quarter.
After going live with Cerner in March, all inpatient units on the campus, except the Maternal Infant Care unit, have transitioned from Morse to the Schmid Fall Risk Assessment Tool.
Cecil County – Falls Trend
Inpatient falls decreased 53% to 7 from 15 in the first quarter after the go-live of falls subcommittee interventions in January 2023.
30 | ChristianaCare Quality & Safety Report 2023
DESIRED DIRECTION 0 2 4 6 8 10 12 Ju l-22 Aug-22 Sep-22 Oc t-22 No v-22 De c-22 J an-23 F eb-23 Ma r-23 Number of Non-Intentional Falls I npatient Falls Outp atient Falls Intervention GoLive
Ambulatory falls now included in preventable patient harm count
Interventions support 7% decrease in number of falls
Beginning this fiscal year, ambulatory patient falls, including those in medical offices, clinics and hospital outpatient departments, are entered in R2L and tracked in the preventable patient harm count. The falls count now includes all falls, regardless of injury level; although falls with major injury are also tracked separately specific to acute care.
Because little has been done to date in terms of research on ambulatory fall prevention, and there are no consistent ambulatory protocols or validated ambulatory assessment, the industry offers little in terms of evidence-based strategies and tactics for the prevention of falls. However, we do know that while there is no definitive predictor for falls in the ambulatory setting, fall risk is based on a combination of factors. The more risk factors a patient has, the greater the risk of a fall. We also know that the greatest predictor of a future fall is a patient’s prior fall history.
With this knowledge, the ambulatory falls subcommittee has put the following interventions in place:
• Mandatory web education to ensure that all clinical caregivers understand who should be screened for fall risk (all patients 65 years and older); how to know when a patient is due for a fall risk screen (annually or with change in condition); how to locate the fall risk screen tool in PowerChart (or paper for non-Cerner practices); and steps to take when a patient screens positive for fall risk.
• Best practice guidelines for fall prevention when using scales and exam tables or caring for patients who have difficulty walking.
Through interdisciplinary collaboration with Information Technology, the ambulatory falls subcommittee is now working to implement front-facing notification for providers when patients screen positive for fall risk; automated patient education on home fall-prevention strategies; and a process to automatically refer patients to the Safe Steps/Strong Bones fall prevention programs.
continued on page 32
Strengthen the Core: Preventable Harm | 31
Ambulatory Practices – Falls Trend
The number of falls has decreased 14% to 31 from 36, FY 2023 to date (through March) compared to the same period in FY 2022.

32 | ChristianaCare Quality & Safety Report 2023
DESIRED DIRECTION 0 1 2 3 4 5 6 7 8 Jul-2 1 Aug-21 Sep-21 Oct-2 1 Nov-2 1 Dec-2 1 Jan-22 Feb-22 Mar-2 2 Apr-2 2 May-2 2 Jun-22 Jul-2 2 Aug-22 Sep-22 Oct-2 2 Nov-2 2 Dec-2 2 Jan-23 Feb-23 Mar-2 3 Number of Falls
Cecil County reduces non-ICU code blue events
After experiencing an increase in code blue events outside the intensive care unit, Cecil County implemented an improvement plan that included:
• Post-huddle debriefs of all Rapid Response Team (RRT) events for lessons learned.
• Critical Care Committee review of all events for opportunities.
• Enhanced policies related to RRT and code blue to ensure algorithms align with current evidence-based practice standards.
• Structured orientation and competencies developed for RRT/code blue team members.
• Initiation of mock emergency situations for caregivers on inpatient floors.
• Improved transitions of care, including a leveling grid for appropriate bed placement based on care needs, standardized emergency department assessment of patients prior to admission; and standardized goals of care discussions with the Delaware campuses.
Although there was little change in the number of non-ICU codes in fiscal year 2022, the codes per 1,000 patient days decreased 33% to 0.74 from 1.12, reflecting the increase in patient days. Significant improvement has been seen in fiscal year 2023, with only 7 non-ICU codes through March 2023.
Cecil County Non-ICU Codes
The non-ICU code rate decreased by 77% to 0.25 FY 2023 to date from 1.12 in FY 2021, after implementation of action plans.
DESIRED DIRECTION
29 27 7 1.12 0.74 0.25 0. 0 0. 2 0. 4 0. 6 0. 8 1. 0 1. 2 0 5 10 15 20 25 30 35 F Y21 F Y22 F Y23 ytd Codes per 1000 patient days Number of Codes Nu mber o f Codes C ode Rate Strengthen the Core: Preventable Harm | 33
ChristianaCare optimizes adoption of Bar Code Medication Administration scans to prevent patient harm
ChristianaCare has committed to optimizing the adoption of bar code medication administration (BCMA) technology—which scans bar codes to compare the drug in the caregiver’s hand with the provider order in the medication administration record—to further decrease medication errors and reduce patient harm. With the intensified push toward the industry gold standard in patient and medication verification, by February 2023, the BCMA scan rate dramatically improved to 98% on the Wilmington campus and 94% on the Christiana campus, up from just below 95% and 92%, respectively, at the start of the fiscal year.
Scan rates increased to 98% on the Wilmington campus and to 94% at Newark, approaching the 99% goal.
The goal is now to achieve a systemwide scan rate > 99% 4% higher than the Leapfrog Patient Safety Score top scan rate of > 95%. Success will represent an additional 320,000 doses scanned per year, with the potential to prevent harm to 1,568 patients.
34 | ChristianaCare Quality & Safety Report 2023
BCMA Scan Rate
DESIRED DIRECTION
0% 20% 40% 60% 80% 100% Ju l-22 Aug-22 Sep-22 Oc t-22 No v-22 De c-22 J an-23 F eb-23 % Medication doses scanned Ne wark Wilm ingt on Goal
Bar code technology is a proven strategy that decreases patient harm by reducing administration errors by as much as 75%, according to a 2016 article published in the Canadian Journal of Hospital Pharmacy.* The technology scans two unique bar codes: the first printed by ChristianaCare on the patient’s wristband; the second placed on the drug by the manufacturer. Handheld bar code scanners integrated with the electronic medical record alert the caregiver to stop administration when any one of the “5 rights” does not automatically match up exactly:
ChristianaCare’s Medication Safety officer has designated three process metrics with systemwide goals for assessment of BCMA adoption and use. Two of the three metrics— scan rate (%) and use of the Medication Administration Wizard (MAW) in PowerChart— measure consistent use of BCMA technology by caregivers, essential for high reliability to prevent patient harm. The third metric—underdose—measures the accuracy of correct dose administration/documentation.
Measured as a percentage, scan rate reflects the proportion of doses administered using BMCA versus bypassing the medication scan. Based on billed dose data, each 1% change (+/-) in scan rate equals an increase or decrease in scanning ~80,000 doses per year. It is estimated that 7% of administered doses are an error, and 7% of the errors result in unrecognized patient harm from a medication error.
The MAW documents doses administered in an emergency when no order exists in the medication administration record. Scans of the patient and medication bar codes are bypassed, and the MAW lacks the BCMA’s ability to prevent inappropriate doses in real-time. Because the MAW can neither detect nor prevent errors, monitoring its use and providing feedback to caregivers will be essential in maintaining high reliability. Use of the MAW is calculated into the overall scan rate, while also measured separately.
With the push to optimize use of BCMA technology, MAW use has decreased by 82% between the two campuses this fiscal year to date, and is heading toward a goal of zero, as well.
Right drug & form (e.g. tablet, capsule, patch, injection concentration) Right route (e.g., by mouth, IV push, topical) Right dose Right time Right patient continued on page 36 Strengthen the Core: Preventable Harm | 35
Medication Administration Wizard (MAW) Use
MAW use decreased by 80% to 3,573 in February 2023 from an average of almost 17,300 per month from July – November 2022.
The underdose metric measures the number of doses documented and administered where the dose charted is less than the dose ordered. In some cases, this is only a documentation and scan error (two tablets were needed, but only one was scanned); but many are actual incorrect doses administered, which could cause therapeutic failures, or patient harm. Improving the underdose metric is proving more challenging, and will continue to be addressed. These doses have dramatically increased by 55% combined between the two campuses and will continue to be addressed.

36 | ChristianaCare Quality & Safety Report 2023
DESIRED DIRECTION
0 5000 10000 15000 20000 25000 Ju l-22 Aug-22 Sep-22 Oc t-22 No v-22 De c-22 J an-23 F eb-23 Number of MAW Ne
wark Wilm ingt on
The number of underdoses increased 55%.
*Shah K, Lo C, Babich M, Tsao N, Bansback N. Bar Code Medication Administration Technology: A Systematic Review of Impact on Patient Safety When Used with Computerized Prescriber Order Entry and Automated Dispensing Devices. CJHP. 2016; 69(05):394-402.
What causes patient harm?
continued on page 38
Underdose
DESIRED DIRECTION
0 500 1000 1500 2000 2500 3000 3500 4000 Ju l-22 Aug-22 Sep-22 Oc t-22 No v-22 De c-22 J an-23 F eb-23 Ne wark Wilm ingt on
Strengthen the Core: Preventable Harm | 37 Number of Underdoses
The four phases of the medication-use process where medication errors originate are prescribing, transcribing, dispensing and administration. While most medication errors originate during prescribing, the administration phase accounts for the most patient harm. Why? Earlier in the process there are more opportunities to catch errors before they reach the patient. In Medication Safety, the administration phase is truly the tip-of-the-sword, and many errorprevention strategies target this complex phase to support Nursing and Respiratory Therapy caregivers.
Sources of Harm in Medication-Use Process
Chart adapted from Effective Approaches to Standardization and Implementation of Smart Pump Technology, ISMP 2007. ISMP website accessed June 20, 2011.
SmartZone alerts caregivers when patients refuse or restrict transfusion
ChristianaCare adopted a streamlined computerized process in February 2023 to improve documentation in cases where a patient elects to refuse or restrict blood and blood product transfusion. An initial audit following implementation of the new process increased the percentage of patients identified as refusing/restricting blood or blood products to 25% from 7%, improving our ability to provide care aligned with patients’ wishes.
38 | ChristianaCare Quality & Safety Report 2023
% of Errors Occurring % of Errors Resulting in Harm 28% 11% 10% 51% 39% 12% 11% 38% Dispensing Prescribing Administering Transcribing
Blood Refusal/Restriction Process Compliance
Post implementation, the percentage of patients identified as refusing/restricting blood or blood products for whom the complete process was followed increased to 25% from 7%.
Most patients who refuse or restrict blood or blood product transfusion do so based on religious beliefs. All patients are asked upon intake whether they have a strong objection that causes them to restrict or absolutely refuse transfusion, even if needed to save their life.
The improved, computerized process creates a SmartZone that displays clinical restrictions on the PowerChart banner bar as pop-ups to alert providers of the patient’s wishes regarding refusal or restriction of traditional blood products; pharmaceutical-grade blood products that may be derived from and/or contain human plasma; or blood-related procedures in which blood leaves the body. The Blood Bank and Pharmacy also receive electronic notification of the refusal or restrictions. Patients receive and are asked to sign a printed copy of the completed form to confirm refusal/restriction specifics.
Previously, refusals or specific restrictions for transfusion were documented on a paper form and then manually entered into the electronic orders. While an alert was created, documentation was not always completed appropriately, leaving opportunity to better ensure compliance with the patient’s wishes.
The policy containing guidelines for patient refusal or restriction of blood and/or blood products has been updated and a job aid and reference document has been created to assist caregivers in more appropriately meeting patients’ wishes. Next steps will include sharing of initial results, additional provider education, and identification of additional interventions to increase performance.
DESIRED DIRECTION
0% 5% 10% 15% 20% 25% 30% % of audited records Baseline Post Strengthen the Core: Preventable Harm | 39
Enhanced infection prevention data management helps HomeHealth achieve four consecutive months without CAUTI
ChristianaCare HomeHealth nurses reduced the incidence of catheter-associated urinary tract infections (CAUTI) by 38% in fiscal year 2022. A revised process that both improves identification in the electronic medical record of patients with indwelling catheters, and enhances surveillance of early signs of infection, not only helped them meet the 2022 goal, but also led to zero incidence of CAUTI through four consecutive months in fiscal year 2023.
CAUTI is a leading reason for unplanned acute-care hospitalizations in patients with indwelling catheters. Following evidence-based practice review, in addition to electronic alerts of catheter use, the direct care nurse now consults proactively with our HomeHealth Certified Infection Control nurse, who also makes home visits for infection surveillance. The team collaborates with the nurse manager to ensure optimal care.
CAUTI Incidence
of Cases
HomeHealth CAUTI incidence decreased 38% following implementation of the improved identification and surveillance process in May 2022 to 10 cases from 16. In the first four months of FY 2023, the CAUTI incidence was 0.
40 | ChristianaCare Quality & Safety Report 2023
DESIRED DIRECTION 0 2 4 6 8 10 12 14 16 18 FY 2022 FY 2023 Number
Sustained efforts decrease number of HomeHealth patients with new or worsening pressure injuries
A sustained effort that includes annual skills training, a new defined plan of care in the electronic medical record, and shared lessons from past events and clinical conferences have jointly contributed to an 82% decrease in the percentage of HomeHealth patients with new or worsening pressure injuries.
Key to the initiative is working with patients and their family members to understand pressure and effective pressure relieving interventions, such as safe repositioning. Additionally this past year, all HomeHealth clinicians have demonstrated competency with the industrystandard Braden Scale during annual skills training.
Incidence of New or Worsening Pressure Injuries
The percentage of HomeHealth patients with new or worsening pressure injuries decreased 82% between February 2022 and January 2023.
DESIRED DIRECTION
0. 0 0. 5 1. 0 1. 5 Feb-22 Mar-22 Apr-22May-22 Jun-22 Jul-22 Aug-22Sep-22 Oct-22 Nov-22 Dec-22 Jan-23 Feb-23 Percent of patient s Strengthen the Core: Preventable Harm | 41
Zero Harm Awards
ChristianaCare’s Zero Harm Awards recognize patient care units or HomeHealth teams that have maintained zero cases of preventable harm in one of 10 harm categories for at least 12 consecutive months. This year, the program was expanded to recognize ambulatory practices with zero hypertension or short-term complications of diabetes admissions. Perioperative Services is also now being awarded for zero surgical errors, zero patient burns and zero retained foreign objects. From July 2022 through March 2023, 148 awards were earned, including 10 awards for nine years (108 months) with zero harm. Since January 2017, 994 awards have been given.
Catheter-Associated Urinary Tract Infections (CAUTI)
12 MONTHS
4E Cardiovascular Stepdown, Newark
5E Heart Failure, Newark
Surgical Services, Cecil County
Medical Surgical, Cecil County
New Castle Team 4, HomeHealth
5N Medical, Wilmington
5B Medical, Newark
24 MONTHS
New Castle Team 3, HomeHealth
6B Medical, Newark
Cardiac Care, Wilmington
36 MONTHS
Express Admissions, Newark
48 MONTHS
Intensive Care, Wilmington
6W Center for Rehabilitation, Wilmington
Medical Intensive Care, Newark
Transitional Neuro, Newark
Intensive Care, Cecil County
Progressive Care, Cecil County
60 MONTHS
3M Medical, Wilmington
72 MONTHS
3A Stroke Treatment and Recovery, Newark
6S Stepdown, Wilmington
96 MONTHS
Bone Marrow Transplant, Newark
4N/5W Medical, Wilmington
108 MONTHS
7S Center for Advanced Joint Replacement, Wilmington
Central Line-Associated Bloodstream Infections (CLABSI)
12 MONTHS
8S Acute Care of the Elderly, Wilmington
5E Heart Failure, Newark
24 MONTHS
6MS Medical Surgical, Newark
Cardiac Care, Wilmington
36 MONTHS
Transitional Neuro, Newark
6W, Center for Rehabilitation, Wilmington
Express Admissions, Newark
42 | ChristianaCare Quality & Safety Report 2023
48 MONTHS
New Castle Team 6, HomeHealth
Progressive Care, Cecil County
60 MONTHS
Intensive Care, Wilmington
3M Medical, Wilmington
Transitional Surgical, Wilmington
96 MONTHS
2C Ortho/Neuro/Trauma Surgery, Newark
7E Spine/Joint Replacement, Newark
7S Center for Advanced Joint Replacement, Wilmington
Methicillin-Resistant Staphylococcus Aureus (MRSA)
12 MONTHS
Intensive Care, Wilmington
6S Stepdown, Wilmington
5E Heart Failure, Newark
Medical Surgical, Cecil County
24 MONTHS
6A Acute Care of the Elderly, Newark
5N Medical, Wilmington
4W Medical, Wilmington
6MS Medical Surgical, Newark
Cardiac Care, Wilmington
36 MONTHS
5D Medical, Newark
6B Medical, Newark
Surgical Critical Care, Newark
Express Admissions, Newark
48 MONTHS
Bone Marrow Transplant, Newark
Surgical Services, Cecil County
72 MONTHS
4D Surgery Stepdown, Newark
3M Medical, Wilmington
Transitional Neuro, Newark
108 MONTHS
7S Center for Advanced Joint Replacement, Wilmington
6W Center for Rehabilitation, Wilmington
Clostridioides difficile (C. difficile)
12 MONTHS
Cardiovascular Critical Care, Newark
Neuro Critical Care, Newark
6MS Medical Surgical, Newark
24 MONTHS
Cardiac Care, Wilmington
Clinical Decision, Cecil County
36 MONTHS
7N Behavioral Health, Inpatient, Wilmington
Medical Intensive Care, Newark
Express Admissions, Newark
PatientSafetyAward Z EROHA RM Together WE ARE Patient Safety Strengthen the Core: Preventable Harm | 43
48 MONTHS
Transitional Neuro, Newark
Intensive Care, Wilmington
Intensive Care, Cecil County
72 MONTHS
Center for Rehabilitation, Wilmington
108 MONTHS
7S Center for Advanced Joint Replacement, Wilmington
Falls with Major Injury
12 MONTHS
5D Medical, Newark
Emergency Department, Newark
7S Center for Advanced Joint Replacement, Wilmington
4B Surgery/Gynecology, Newark
3B Medical, Newark
Emergency Department Observation, Newark
24 MONTHS
Cardiovascular Critical Care, Newark
7N Behavioral Health, Inpatient, Wilmington
Surgical Services, Cecil County
6E Oncology, Newark
4N/5W Medical, Wilmington
Cardiac Care, Wilmington
Clinical Decision, Cecil County
36 MONTHS
Emergency Department, Cecil County
6W Center for Rehabilitation, Wilmington
5E Heart Failure, Newark
Express Admissions, Newark
Progressive Care, Cecil County
Medical Surgical, Cecil County
48 MONTHS
Neuro Critical Care, Newark
2C Surgical, Newark
Intensive Care, Cecil County
Maternal Infant Care, Cecil County
60 MONTHS
6C Medical Observation, Newark
P6M Pediatrics, Newark
6S Stepdown, Wilmington
72 MONTHS
5A/4C Medical, Newark
4W Medical, Wilmington
6B Medical, Newark
Surgical Critical Care, Newark
3M Medical, Wilmington
108 MONTHS
4D Surgical Stepdown, Newark
Cardiac Short Stay, Newark
Middletown Emergency Department
Medical Intensive Care, Newark
2M Postpartum, Newark
Intensive Care, Wilmington
All Falls
12 MONTHS
P6M Pediatrics, Newark
Surgical Critical Care, Newark
Maternal Infant Care, Cecil County
24 MONTHS
OB Triage, Newark
84 MONTHS
Neonatal Intensive Care, Newark
Antenatal Steroids
12 MONTHS
OB Triage, Newark
44 | ChristianaCare Quality & Safety Report 2023
Hypertension Admissions
12 MONTHS
Primary Care at Home
Primary Care, Greenville
Primary Care, Center for Hope & Healing
Primary Care, Linden Hill
Primary Care, Middletown West
Primary Care, Woodstown
Cardiology Consultants, New Jersey
Primary Care, Smyrna
Primary Care, Kirkwood
Primary Care, Springside
Primary Care, Hockessin
Primary Care, Whitehall
24 MONTHS
Primary Care, Lantana
Center for Special Health Care Needs
Primary Care, Center for Hope & Healing
Primary Care, Woodstown
Primary Care, Middletown West
36 MONTHS
Primary Care, Carney’s Point
Short-Term Complications of Diabetes
12 MONTHS
Primary Care, Smyrna
Primary Care, Kirkwood
Primary Care, Whitehall
Primary Care, Middletown West
Primary Care, Kennett
Primary Care, Newark
24 MONTHS
Primary Care, Greenville
36 MONTHS
Primary Care, Woodstown
Primary Care, Smyrna
Perioperative Services / Surgical Complications
12 MONTHS
Operating Room, Wilmington
Christiana Surgicenter, Newark
24 MONTHS
Gastrointestinal Lab, Newark
Gastrointestinal Lab, Wilmington
Post-Anesthesia Care, Newark
Post-Anesthesia Care, Wilmington
Wound Care Center
Strengthen the Core: Preventable Harm | 45
Zero Hero Awards recognize heroes for preventing harm at point of care
The Zero Hero caregiver recognition program promotes the importance of “good catches” by caregivers in preventing harm at the point of care. A good catch is either an unsafe condition, which increases risk to a patient or caregiver if not corrected, or a near miss, which is a patient safety risk caught prior to reaching the patient.
Reporting good catches allows for increased learning at the system level and allows caregivers to take proactive action in preventing future harm. Reporting and learning are vital components in our journey to zero harm and in advancing a culture of safety.
Each month, a submission nominating an important system improvement reducing preventable harm is selected for the Zero Hero Award. The awardee is acknowledged by Clinical Effectiveness leaders in the System Support & Resolution Huddle and through other internal platforms. Each monthly winner is eligible to receive the overall Zero Hero Award presented during the annual ChristianaCare Way Awards ceremony (see page 164).
Zero Heroes 2022
May 2022
Daniel Zirolli, RN, Hospital Care at Home
Good Catch: Incorrect medications delivered to patient’s home.
As a result: The process for medications delivered to patient homes has improved. Couriers now call the Hospital Care at Home command center directly with questions and Pharmacy is notified when a patient is being discharged and no longer needs medication fill/delivery.
Daniel was the Zero Harm Award 2022 Honoree at the ChristianaCare Way Awards.
46 | ChristianaCare Quality & Safety Report 2023
June 2022
Ijaz Anwar, M.D., Smyrna Health & Wellness Center
Good Catch: Lack of alert or means of notification that a patient has been discharged from the practice.
As a result: A flag (reminder) has been added to patient charts notifying caregivers when a patient has been discharged from the practice. A reminder has also been added to Revenue Cycle.
July 2022
Shannon Wilton, D.O., ChristianaCare Hospitalist Partners
Good Catch: Unclear process for a pediatric patient needing a Rapid Response Team.
As a result: ChristianaCare Hospitalist Partners, the Medical Emergency Response Committee and the Medical Intensive Care team collaborated to develop a process to treat pediatric patients needing a Rapid Response Team.
August 2022
Caragh Clayton, Pharm.D., and Emily Salter, Pharm.D., Clinical Pharmacy
Good Catch: Discrepancies on weight-based dosing noticed on new pediatrics order in PowerChart.
As a result: Information Technology immediately fixed orders for hydromorphone mg/kg instead of a fixed dose in mg for >50 kg.
September 2022
Megan Davidson, RN, Medical Intensive Care Unit
Good Catch: Missing blood glucose results in electronic medical record.
As a result: Point-of-care test lab personnel adjusted glucometer system and the machine now uploads patient information appropriately.
Strengthen the Core: Preventable Harm | 47
October 2022
Erin Snook, RN, Pediatric Center
Good Catch: Medications not scanning in the new Pediatric Center.
As a result: Code set changes were made that allowed medications to scan properly.
November 2022
Stacy Lourie, FNP, iLEAD
Good Catch: Lack of clear guidelines or policy on safe medication preparation and labeling for ambulatory sites.
As a result: A section with labeling information specific to ambulatory sites was added to the Policy for Medication – Preparation and Labeling of Medications Outside of Pharmacy for review by Pharmacy & Therapeutics.
December 2022
Anonymous
Good Catch: The transfer medication reconciliation process for Hospital Care at Home involved reconciling home medications rather than all medications.
As a result: The Hospital Care at Home provider who writes the transfer orders now reviews all medications, including those listed on the medical administration record at the time of transfer. The rounding provider on the following day also performs the usual process for in-home medication reconciliation.
January 2023
Sara Davis, RN, Labor & Delivery
Good Catch: Elevators and automatic doors continued to open and function during a code yellow (infant abduction), allowing visitors to enter and leave the building while staff were actively searching for the missing baby. The baby’s security band, which would have triggered shut down of these areas, had been slipped off.
As a result: The event review team is investigating a process to lock down the elevators and secure areas during a code yellow when no alarm sensor is in place.
48 | ChristianaCare Quality & Safety Report 2023
February 2023
Carly Timney, RN, Pediatric Center
Good Catch: Keflex, which is a pink liquid medication, was ordered for a patient with a listed red and blue dye allergy. Prior to administering the medication, the RN verified with the Pharmacy that it did contain red dye and the order was changed.
As a result: The Medication Safety officer and Pharmacy team are exploring expanded scope of a rule to alert staff to dye allergies, mirroring a custom manual check alert created for gluten allergies as excipients and dyes are not tracked/recorded in a database.
March 2023
Whitney Lane, RN, Labor & Delivery
Good Catch: Insulin drip premix bags scan in Accudose as concentration of 1 unit to 0.1 ml instead of 1 unit to 1 ml. It is not possible to make the rate accurate even with the scan override function as medication administration record (MAR) only allows “either/or” options. If 1 unit per hour is entered; it changes the rate to 100ml/hr. If the rate is changed to 1ml/hr., the MAR changes the unit per hour rate to 0.1.
As a result: Medication Safety, Pharmacy Informatics and Clinical Informatics escalated the issue and worked with Cerner to determine the root cause and correct a mismatch in mapping the adult product concentration (1 unit/mL) to a NICU product with a 0.1 unit/mL concentration.
April 2023
Jennifer Gasper, RN, Medical Intensive Care Unit
Good Catch: A patient admitted to the medical intensive care unit waited on a stretcher, unable to be turned for more than 24 hours, until a needed bariatric bed was available, posing a safety risk to both the patient and caregivers.
As a result: The event escalated to Systemwide huddle, from which the Equipment Room supervisor worked with the PEEPS safe patient handling team and the bed supplier to ensure onsite availability of bariatric equipment for future needs. Staff from the bed supply company are now educated on the proper process for bariatric bed delivery to ChristianaCare, and that company’s manager has even provided a direct cell phone number for assistance with future needs.
Strengthen the Core: Preventable Harm | 49
Teamwork continues to outscore national benchmarks on patient safety culture surveys
Work pressure/pace, staffing and support for patient safety are greatest opportunities for improvement
ChristianaCare evaluates progress related to achieving a culture of safety every two years using Agency for Healthcare Research and Quality (AHRQ) validated survey tools; the Hospital Survey on Patient Safety Culture and the Medical Office Survey on Patient Safety Culture. The surveys help us understand caregivers’ perception of progress toward advancing a culture of safety and enable us to look for ways to improve safety of patients and caregivers.
The Hospital Survey is administered every two years to all direct caregivers, employed physicians and a sampling of non-direct caregivers and non-employed physicians. The Medical Office Survey is administered to 100% of all caregivers whose primary work setting is a medical office.
Safety Favorability: Hospital
Favorable
Te amwo rk
Supervisor Support for Pt Safety
Communication Openness
Reporting Patient Safety Events
Ju st Culture
Communication about Error
Org Learning-Continuous Imp
Workplace Aggression
Response to Error
Patient Safety Rating
Handoffs and Information Exchange
Hospital Mgmt Support for Pt Safety
Unfavorable
The Teamwork domain had the strongest performance on the hospital survey, with an 82.8% favorable response rate.
50 | ChristianaCare Quality & Safety Report 2023
DESIRED DIRECTION 0% 50% 100%
Percent of Responses Neutral
Staffing and Work Pace
Overall, the Fall 2022 Hospital Survey on Patient Safety Culture showed the strongest performance in the domain of Teamwork in comparison to both the national benchmark and our previous results in 2020. For the survey items associated with Teamwork, caregivers responded favorably to questions pertaining to working as an effective team, helping each other during busy times, and having respect for team members. Survey respondent perceptions of survey items related to Work Pressure/Pace, Staffing, and Support for Patient Safety showed the greatest opportunity consistently across both surveys.
For the 2022 survey administration, ChristianaCare utilized a new electronic insight platform hosted by Perceptyx. An application, Caregiver Voice Reporting, located on the system portal page provides leaders and managers access to their cost center results. The expectation is for cost center leaders and managers to review, share and discuss results with caregivers. The recommendation is for leaders and managers to identify at least one area of opportunity for improvement based on the unit/department level results, and implement an action plan for improvement.
Safety Favorability: Medical Office
Te amwo rk
Organizational Learning
Ju st Culture
Communication about Error
Overall Perception-Pt Safety & Quality
Communication Openness
Staff Training
Workplace Aggression
Overall Ratings-Quality & Patient Safety
Patient Safety Rating
Patient Care Tracking/follow-up Office Processes & Standardization
Leadership Support-Patient Safety
Work Pressure and Pace
Percent of Responses
The Patient Care Tracking/follow-up domain had the strongest performance on the medical office survey, with an 82% favorable response rate. Greatest opportunity is in Work Pressure and Pace, with 29% favorable.
DESIRED DIRECTION Strengthen the Core: Preventable Harm | 51 0% 50% 100%
Favorable Neutral Unfavorable
Key actions to address Staffing and Management Support for Patient Safety include:
Multifaceted organizational approach to staffing with increased transparency around aggressive recruitment and retention efforts.
A standardized system and campuslevel huddle process with assigned accountable leader to escalate supply and resource concerns from local units.
Monthly town halls (CEO/executive leader, all-caregiver and campus) to share information and respond to caregiver questions.
Leader rounding to support teamidentified concerns and remove barriers to problem-solving.
Making Tomorrow Happen leader rounding, revised huddle structure, Behavior of the Month toolkit including Go Sees for Safety and Advancing Just Culture.
Caregiver recognition of good catch reporting.
Psychological safety supporting Culture of Safety and nonpunitive response to reporting and speaking up for safety.
Optimized R2L submitter experience to increase caregiver reporting and system learning from safety events.
The following strategies are helping to drive improvement in the domains of Work Pressure and Office Processes & Standardization: Create quick reference manuals with checklists for each practice for floating or new staff.
Create “buddy system” for each practice. Increase staff awareness of the BRAVO program for recognition and positive feedback.
Develop an interim survey tool to monitor progress and recognize need for improvement.
52 | ChristianaCare Quality & Safety Report 2023
ChristianaCare below national average for recordable and lost time injury rates
While recordable injuries remain consistent, increased man-hours lead to drop in injury rate
Overall, recordable injuries (days away from work, working restricted, medical treatment) remain fairly consistent, rising just slightly to 308 in fiscal year 2023 from 303 for the same time period (July through February) in fiscal year 2022. However, man-hours worked for the same time period have increased by 996,105 hours in fiscal year 2023, which results in a lower injury rate. ChristianaCare is also below national average for medical/surgical hospitals, according to the U.S. Bureau of Labor Statistics (the most current published year is 2021).
Total Recordable & Lost Time Injury Rates
Total Recordable and Lost Time Injury Rates improved slightly in FY 2023 to date (through February) and are below national averages for medical/surgical hospitals.
CAREGIVER SAFETY
DESIRED DIRECTION 4.3 1.8 4.1 1.7 0. 0 1. 0 2. 0 3. 0 4. 0 5. 0 6. 0 7. 0 Injuries per 200,000 worked hour s FY 2022 Y TD FY 2023 Y TD Na tional OSHA Recordable Injuries Lost Time Injuries continued on page 54 Strengthen the Core: Caregiver Safety | 53
Needlesticks/sharps injuries have decreased 6.4% in fiscal year 2023 to date, to 146 from 156 a year ago. The slight decrease in needlestick/sharps injuries is related to various initiatives. Resolving supply chain issues has resulted in a more consistent, standardized supply of safety needle devices.
Prevention initiatives, such as sharps safety rounds, systemwide safety communications, and focused, hands-on safe sharps handling education, have supported a 37.5% decrease in Nursing-specific needlesticks/sharps injuries. This year, the previously offered Safe Sharps Handling Workshop provided to each cohort of nurse residents was redesigned to include all new Nursing hires. As part of the Nursing Orientation Optimal Health program, all new nurses now participate in a hands-on sharps safety workshop. Participants practice with various needles commonly used systemwide, learn best practices related to safe sharps handling, and are provided with lessons learned (obtained through the injury follow-up process).
Most Frequent Recordable Injuries
Needlestick Injuries are the most frequently reported caregiver injury and have improved more than 6% compared to the same period last fiscal year (July-February).
54 | ChristianaCare Quality & Safety Report 2023
DESIRED DIRECTION 9 12 31 25 29 25 37 146 7 11 21 17 19 26 41 156 100 150 Exposure-Communicable Disease Lift-Move Material Patient Handling Struck By-Caught Between Physical Demands Slips, Trips, Falls Cut-Puncture Needlestick/Sharp Number of Injuries FY 2022 Y TD FY 2023 Y TD 0 50 Patient Assault
Prevention, education on workplace civility key to stemming rise in workplace violence events
Steer aligns ChristianaCare efforts with leading practices to support caregivers
Workplace violence continues to be an area of concern and focus for ChristianaCare, as it is for hospitals and health systems across the nation. In just the five months between September 2022 and January 2023, the number of reported workplace violence events increased by 42% to 108 from 76, with a high of 117 events reported in November. This number appears to be up from the monthly average of 72 workplace events a year ago, but may also be a combined result of enhanced communication and education regarding workplace violence, and the consolidation of workplace violence events in the R2L event reporting system beginning in September 2022, which may have captured more information about violence experienced by caregivers.
Total Workplace Violence Events Reported in R2L
Reported workplace violence events increased 10% from Q4 2022 to Q1 2023 (consistent workplace violence data not available prior to Sept. 6, 2022 when event types were consolidated into one icon).
continued on page 56
DESIRED DIRECTION 0 20 40 60 80 100 120 140 Sep-22 Oc t-22 No v-22 De c-22 J an-23 F eb-23 Ma r-23 Number of Event s
Strengthen the Core: Caregiver Safety | 55
Physical assault was, by far, the top-reported workplace violence event type in that same reported time period from September 2022 through January 2023. Caregivers also reported experiencing disorderly/disruptive behavior, verbal assaults, verbal abuse and verbal threats.
Workplace Violence – Top 5 Event Types
September 6, 2022 - February 28, 2023
Verbal Abuse, 61, 13%
Assault, Verbal, 84, 18%
Threat, Verbal, 22, 5%
Assault, Physical, 212, 44% Disorderly, Disruptive Behavior, 96, 20%
continued on page 57
56 | ChristianaCare Quality & Safety Report 2023
44% of workplace violence events were physical assaults, with 94% committed by patients.
Delaware’s new Hospital Violence Prevention law, which went into effect June 30, 2022, expands the offense of assault in the second degree to include all health care treatment providers and employees.
A systemwide interprofessional steer is leading efforts to prevent workplace violence and improve a sense of security and safety among caregivers. The team’s focus is on the alignment of ChristianaCare efforts with leading practices in workplace violence prevention, including establishing a foundation for zero tolerance; focusing on prevention and risk mitigation; expanding education and training for all caregivers; responding and learning from events; and providing support for our caregivers. The steer conducts an annual proactive risk analysis, and has created an action plan to build a more comprehensive workplace violence prevention program.
Key accomplishments over the past year include:
• Implemented Zero Tolerance for Workplace Violence signage.
• Expanded education and training, including the development of a new nonviolent crisis intervention class and de-escalation job aids.
• Standardized the process for pressing legal charges after a caregiver is assaulted.
• Implemented a staff duress alert process, with plans to spread more broadly.
• Created a workplace violence dashboard.
• Consolidated R2L event reporting into a single workplace violence icon.
• Implemented an Aggression Risk Plan of Care (IPOC).
• Advocated for Delaware Hospital Violence Prevention Bill (HB 324).
• Measured staff perception of workplace violence in the Culture of Safety survey.
Current work focuses on learning from events and building a comprehensive plan, tools and resources for interdisciplinary teams to address disruptive patients and visitors.
Workplace violence is defined as an act or threat occurring at the workplace that can include any of the following:
• Verbal, nonverbal, written or physical aggression; threatening, intimidating, harassing, discriminatory or humiliating words or actions; bullying; sabotage, sexual harassment; physical assaults or other behaviors of concern.
• Involving staff, licensed practitioners, patients or visitors.
Strengthen the Core: Caregiver Safety | 57
HONESTY IS THE BEST POLICY CANDOR volume reflects deepening commitment to culture of safety
As a recognized national leader in quality and safety, ChristianaCare is now in its eighth year of advancing its culture of patient safety through the Communication and Optimal Resolution (CANDOR) program. Developed in collaboration with the Agency for Healthcare Research and Quality (AHRQ), the CANDOR program supports patients and families through the key tenets of communication — focusing on the importance of transparency in disclosure — and event reporting, review, and analysis. When the analysis of an event review confirms an unexpected harm, the CANDOR program also addresses resolution with patients and their families.
ChristianaCare was one of three health systems—along with Dignity Health in San Francisco and MedStar Health in the Baltimore/Washington, D.C., metropolitan area—to participate in an AHRQ-funded, two-year demonstration project beginning in 2015 to test the effectiveness of the CANDOR process, now embraced by more than 800 hospitals and health systems nationwide. We have, to date, used CANDOR to guide us through reporting, reviewing, debriefing and resolving 494 cases of unexpected patient harm.
58 | ChristianaCare Quality & Safety Report 2023
CANDOR Volume
2023,
494 CANDOR
65% were related to unexpected death. Sep-Dec 2015 2016 2017 2018 2019 2020 2021 2022 Jan-Mar 2023 0 100 200 300 400 500 Number of CANDOR Cases
From September 2015 through March
there were
cases.
Steady increase in R2 L reporting
The CANDOR process is activated when an event classified as high harm is identified in the R2L platform. Submissions have increased steadily since 2017, reflecting a deepening culture of safety with caregivers focused on transparency and learning from safety events. Reviewing only known or obvious errors limits opportunities to identify system factors which could potentially lead to future harm. Creating an environment where caregivers feel safe to report near misses and good catches, as well as report unintended harm, allows the earliest possible intervention and is the first step toward implementing preventive solutions.
Risk File Reporting – R2L
The number of High Harm R2L risk annual submissions has increased steadily since 2017 and accounted for almost 5% of total submissions in 2022.
While the ultimate goal is a journey toward Zero Harm from medical events, increased reporting of events that do occur is an essential step toward improving patient safety. It also promotes a psychologically safe environment focused on ways to identify and support second victims—the caregivers impacted by serious adverse events—and supports systems-based learning and continuous improvement (see page 135).
continued on page 60
DESIRED DIRECTION
Strengthen the Core: Caregiver Safety | 59 200 568 633 716 711 874 0 100 200 300 400 500 600 700 800 900 1000 0 2000 4000 6000 8000 10000 12000 14000 16000 18000 20000 2017 2018 2019 2020 2021 2022 Nu mber o f Submi tted Hi gh Ha rm E vent s (F-I ) R2Ls Total Risk R 2 L Submitted High Harm (F-I) R 2 L Submitted
Post-event debriefs, typically held soon after a potential harm event, allow caregivers to maintain focus on transparency and learn from safety events. The CANDOR toolkit includes a post-event debrief checklist to guide leaders and participants through a collaborative, non-judgmental discussion to learn about the facts of the case and to identify potential contributory system factors, all within an environment of psychological safety. The majority of surveyed respondents agreed that both leaders and fellow participants engaged in post-event debriefs with good intentions.
Debrief Participants Assumed Good Intentions
Agree, 22%
Neutral, 5%
Disagree, 1%
Strongly Agree, 71%
Of 234 respondents to a post-event debrief survey, 93% agreed that participants assumed good intentions.
Strongly Disagree, 0%
60 | ChristianaCare Quality & Safety Report 2023
Caregivers do not come to work with the intent to harm.
Debrief Leader Listened Actively with Good Intentions
Agree, 14% Neutral, 2% Disagree, 1%
Strongly Disagree, 0%
Strongly Agree, 82%
95% of respondents agreed that the leader listened actively with good intentions.
ChristianaCare continues to seek new knowledge and look for ways to innovate its CANDOR program. One such advancement includes recently participating as a leader in the Pathway to Accountability, Compassion, and Transparency (PACT) Collaborative. This nationwide learning community is committed to improving the way healthcare organizations respond to and learn from harm events. PACT provides innovative tools, robust measurement strategies and shared learning among peers to help member organizations implement highly reliable processes for responding to patient harm that support the needs of all involved – patient, family and caregivers alike.

Strengthen the Core: Caregiver Safety | 61
QUALITY
TOP 25 BY ’25
ChristianaCare progresses to top performer level in quality and safety ranking
Vizient, the health care services organization that supports our comparative risk-adjusted data analyses to drive quality and safety improvements, provides a comprehensive annual Quality & Accountability (Q&A) Performance Scorecard that ranks us among our peers – a group of about 110 comprehensive academic medical centers. In 2020, ChristianaCare was ranked 83rd. At that point, we set an audacious goal to reach the top 25 by 2025.
Scores in three of the domains—Equity, Safety and Mortality—have improved since 2020, and are better than the Vizient median. ChristianaCare ranks 1st with a number of other hospitals in the Equity domain, and our rank in the Safety domain—worth 25% of the overall score— improved to 17th from 72nd among 115 peer hospitals.
Domain Score Trend
Scores in three of the domains have improved since 2020—Equity, Mortality and Safety— and are better than the Vizient median. Opportunity remains in all but Equity to reach the Top Performer level.
The Q&A rankings and scorecard are updated annually, based on 12 months of data. On a quarterly basis, calculators are provided to support more timely tracking of progress. ChristianaCare began work in earnest to reach the Top 25 in 2022. Actions included
62 | ChristianaCare Quality & Safety Report 2023
DESIRED DIRECTION
0% 20% 40% 60% 80% 100% Mortality Efficiency Safety Effectiveness Patient Centeredness Equity Scor e 2020 2022 2023 Q 2 Vizient Median Vizient Top Performer
collaborating with Vizient experts to better understand the scorecard and our opportunities; working with the Center for Strategic Information Management, the Laboratory and Data
Informatics & Analytics to add lab data to Vizient – allowing scoring in the Equity domain and Safety lab-based measures; building a dashboard to support drilldown analyses by ChristianaCare-defined service lines, diagnosis-related group (DRG) and procedure; and sharing findings with service line leaders. In addition, numerous ongoing systemwide efforts, such as Zero Harm, health equity, flow and patient experience, have direct impact on the scorecard.
Specific opportunities related to malnutrition were identified, leading to a consideration as a fiscal year 2024 collaboration with Care Standardization (see page 76).
Improvements to date include:
• Safety ranking improved to 17 from 72: Decrease in PSI 03, HAPI and ongoing improvements in other patient safety indicators through Clinical Documentation Integrity and PSI 90 steer (see page 19); strong comparative performance of hospital-acquired infections.
• Mortality ranking improved to 18 from 72: Significant improvement in coding and documentation contributing to overall lower observed-to-expected index.
• Length of Stay: improvements due to success of multidisciplinary rounds are expected to be evident with the next quarterly calculator.
• Planned addition of Sepsis Lactate, Warfarin and Transfusion metrics to Clinical Effectiveness dashboard to increase awareness and support ongoing monitoring.
Rank Trend
Safety domain, worth 25% of the overall score, has improved to 17th from 72nd among 115 peer hospitals. With the addition of lab data in Vizient, ChristianaCare ranks 1st with a number of other hospitals in the Equity domain.
DESIRED DIRECTION continued on page 64 Strengthen the Core: Quality | 63 Ov erall Mo rtalit y Ef fici ency Safe ty Ef fectiv eness Pati ent Cnt r Equit y Rank 2020 2022 2023 Q 2 0 10 20 30 40 50 60 70 80 90 100 110
Vizient Quality & Accountability Domains
Mortality, Safety and Effectiveness are the most heavily weighted domains.
64 | ChristianaCare Quality & Safety Report 2023
Mortality
Safety
Effectiveness 20% Patient Centeredness 15% Efficiency 10% Equity 5%
25%
25%
DOMAIN MEASURES SCORING
Mortality Mortality Observed to RiskAdjusted Expected (O/E) Ratio
Safety Hospital-Acquired Infections Standardized Infection Ratio (SIR)
AHRQ Patient Safety Indicators
13 Vizient-defined service lines
CLABSI, CAUTI, C-difficile, SSI-Colon, SSI-Hysterectomy
PSI-03 Pressure Injuries, PSI 06 Iatrogenic Pneumothorax, PSI 09 Postop Hemorrhage/Hematoma, PSI 11 Postop Respiratory Failure, PSI 13 Postop Sepsis
Total Hip/Knee Complications
Hypoglycemia and insulin use based on lab data
Warfarin-elevated INR based on lab data
Effectiveness 30-Day Readmission Rate
Excess Days Rate
Returns to ED or inpatient after ambulatory procedure
13 Vizient-defined service lines
13 Vizient-defined service lines
Colonoscopy, Biliary, Urological, Arthroscopy
Lactate within 12 hrs. of Sepsis admit labs based on lab data
Transfusion for hemoglobin
based on lab data
Patient Centeredness
Differences in Race, Gender, Socioeconomic status
Strengthen the Core: Quality | 65
HCAHPS 12 questions in 8 domains
Length of Stay O/E Ratio 18 Vizient-defined service lines Direct Cost O/E Ratio
≥ 9 prior to first red blood cell transfusion Vizient-defined service lines
Efficiency
18
Equity Lab measure process and outcomes for Sepsis, Heart Failure, NSTEMI, Obstetrics
The Q&A ranking and detailed scorecard allow member health systems to compare year-over-year performance with like hospitals and target opportunities for improvement. Based on the Institute of Medicine’s six domains of care, the scorecard is structured in six weighted domains: mortality, safety, effectiveness, efficiency, equity and patient centeredness to determine rankings. Each domain includes multiple metrics, with many reported by Vizient-defined service lines.
Advance care planning steer helps inform high-value, patient-centered care
Top improvements include Goals of Care completion and discharge to hospice in accordance with patient wishes
Patient, family, and caregiver experience at the end of life can be suboptimal, and the associated health care expenditures considerable. Analysis of readmissions and nonICU code blues demonstrate a high frequency of insufficient advanced care planning. ChristianaCare has historically shown an over-reliance on the palliative care team for advance care planning, while the process is within scope of practice of other clinical disciplines. In addition, there has been poor coordination of advance care planning between the inpatient and ambulatory settings.
A newly chartered Advance Care Planning steer has developed a standardized, coordinated, advance care planning (ACP) effort across all settings to institute high-quality conversations and ensure that documentation is updated in a timely fashion to accurately reflect patients’ values and preferences. To date in fiscal year 2023 compared to fiscal year 2022, Goals of Care completion has increased 8% and the percent of patients discharged to hospice increased 20%.

66 | ChristianaCare Quality & Safety Report 2023
Goals of Care Completion
Goals of Care completion increased 8% from FY 2022, to 73.5% from 68.3%.
Hospice Discharges
The percent of patients discharged to hospice increased 20% in FY 2023, to 23% from 19.2%.
continued on page 68
DESIRED DIRECTION DESIRED DIRECTION
Strengthen the Core: Quality | 67 68.3% 73.50% 0. 0% 10.0 % 20.0 % 30.0 % 40.0 % 50.0 % 60.0 % 70.0 % 80.0 % F Y2022 F Y2023 YTD 19.2% 23.0% 0 0. 05 0. 1 0. 15 0. 2 0. 25 F Y2022 F Y2023 YTD
To optimize patient, family and caregiver experience at the end of life, the steer established six subcommittees focused on the key aspects of advance care planning. The following accomplishments were achieved:
1. The Ambulatory Workflow subcommittee modified the Annual Wellness Visit workflow to include asking patients to bring or upload advance care planning documents via email or portal. Opportunities continue to exist to assess internal processes versus external collaboration.
2. The Acute Workflow subcommittee developed nursing and provider workflows; confirmed the process for surrogate decision-maker updates; and increased education around 5 Wishes workflow to streamline the transition to hospice.
3. The Documentation subcommittee centralized advance care planning / goals of care forms into one section of Cerner, enabling all providers and caregivers to easily access patient goals and advance care planning needs – and edit, as necessary, to better capture conversations with seriously ill patients.

4. The Education subcommittee developed an external website with External Affairs. The site includes frequently asked questions and enables patients to upload advance directives and related documents for inclusion in their medical record.
5. The Electronic Triggers subcommittee assessing used of the Johns Hopkins screening/ triggers tools and piloted triggers for team communication with CareVio.
6. The Data subcommittee developed a dashboard to track key process and outcome metrics related to advance care planning. The dashboard includes the ability to assess health care disparities.
Scan the QR code to visit ChristianaCare’s newly redesigned Advance Care Planning webpage.
68 | ChristianaCare Quality & Safety Report 2023
Multidisciplinary approach to improve documentation and coding reduces PSI complications, improves case mix index
A multidisciplinary approach to enhance the accuracy and completeness of documentation of a patient’s hospitalization in the electronic health record (EHR)—severity of illness, clinical specificity, data quality and accurate reimbursement—has helped reduce the incidence of patient safety indicator complications. It has also had substantial impact on the case mix index (CMI), which indicates the complexity and resource-intensity of patients served by the hospital. Over the past three years, improved documentation and coding has led to a 4.5% increase in the CMI, to 1.883 from 1.802, which translates to an annual increase in revenue of almost $26.7 million.
Case Mix Index
Improvement in documentation and coding led to a 4.5% increase in case mix, to 1.883 from 1.802. The annualized incremental revenue is almost $26.7 million.
DESIRED DIRECTION 1. 70 1. 75 1. 80 1. 85 1. 90 1. 95 Jun-Aug20192020Q12020Q22020Q32020Q42021Q12021Q22021Q32021Q42022Q12022Q22022Q32022Q4Dec22-Feb23 Case Mix Index continued on page 70 Strengthen the Core: Quality | 69
The CDI process involves concurrent or pre-bill medical record review for selected patient populations to optimize diagnosis and procedure coding. Provider queries are used to obtain additional clarification or specificity around patient conditions or procedures. The CDI team’s pre-bill review of potential PSI cases helps identify exclusions such as present on admission status. The model incorporates medical records coding from HIMS, Finance, and CDI clinical staff and physician advisor. The physician advisor and coding supervisor participate in PSI 90 steer meetings, and provide quarterly education sessions with clinicians. Ensuring accuracy of the PSI data enables the PSI 90 steer to focus on clinical improvement initiatives (see page 19).
Improving efficiency and impact with AI
In March 2023, CDI implemented Iodine, an artificial-intelligence system that combs the EHR to more accurately identify records that could most benefit from CDI review – greatly improving the team’s efficiency and impact. Since go-live, the query rate has increased 43% to 28.6% from the annual team average of 20%. More than 63% of query responses are agreed and documented; fewer than 10% disagree with the CDI suggestion and fewer than 4% do not respond.
70 | ChristianaCare Quality & Safety Report 2023
CDI Team Query Rate
The query rate increased to 28.6% after Iodine go-live; 43% above the annual team average of 20%.
Query Response
More than 63% of query responses were agreed & documented, 9.7% disagreed, and fewer than 4% did not respond.
DESIRED DIRECTION Agreed & documented,
Pending, 12.8% Disagreed,
Unable to Determine/ Unknown,
No Response,
Alternative Diagnosis/ Response,
Answered in Chart,
19.0% 24.2% 26.2% 28.6% 0% 5% 10% 15% 20% 25% 30% 35% Feb-23 Mar-23 Apr-23 May-23 Percent of Review s Iodine Go-Live Annual average: 20% Strengthen the Core: Quality | 71
63.2%
9.7%
4.6%
3.7%
3.1%
2.8%
7N Wilmington exceeds national performance on quality measures for care of patients with psychiatric disorders
Wilmington’s 7 North patient care unit is an inpatient psychiatric facility annually providing intensive short-term treatment to more than 900 community members in emotional and behavioral health crisis. In August 2021, the unit began accepting involuntary patients and expanded services to support treatment of patients’ medical conditions, as well as psychiatric disorders.
Limiting use of physical restraints and seclusion is a fundamental priority – and publicly reported by CMS. Per CMS, both increase a patient’s risk of physical and psychological harm and should be used only if the patient is an imminent danger to her/himself or others, and if less restrictive interventions have failed. One of those interventions, a sensory room run by 7N occupational therapy, was implemented in August 2021. A sensory room combines a range of stimuli, such as lights, colors, aromas or sensory soft-play resources, to help patients emotionally regulate and reduce distress. In addition, all caregivers received non-violent crisis intervention training and diagnosis specific trainings.
Seclusion use decreased to 0.04 hours per 1,000 patient hours (6 patients for 8.45 hours) in the year after implementation from 0.28 hours per 1,000 patient hours (6 patients for 61.4 hours) in 2021. Comparatively, the national seclusion rate is 0.36. Restraint use remains an opportunity, due in part to multiple interventions for a small number of medically complex patients. 7N will continue to review the need for restraints and seclusion based on patient and caregiver safety.
Seclusion Use
Seclusion use decreased to 0.04 from 0.28 hours per 1,000 patient hours after implementation of the sensory room and other interventions.
72 | ChristianaCare Quality & Safety Report 2023
DESIRED DIRECTION 0 1 2 3 0 5 10 15 20 25 30 J an-21 F eb-21 Ma r21 Apr-2 1 Ma y21 J un-21 Ju l-2 1 Aug-21 Sep-21 Oc t21 No v21 De c21 J an-22 F eb-22 Ma r22 Apr-2 2 Ma y22 J un-22 Ju l-2 2 Aug-22 Sep-22 Oc t22 No v22 De c22 J an-23 F eb-23 Ma r23 Patients in Seclusion (# ) Seclusion Rate Patients in Seclusion Sensory Room Seclusion Rate
As part of CMS’s Inpatient Psychiatric Facility Quality Reporting, numerous metrics are reported on an annual basis for public reporting. Improvement efforts driven through multidisciplinary monthly meetings have led to compliance rates exceeding national averages in most metrics. Recent action plans, include adjusting the workflow of the form used for tobacco use treatment (which reached 98% FY 2023 through April), and improving screening of patients discharged on antipsychotic medications for metabolic disorders by 37% to 84% from 62%. An opportunity area is the Transition Record, which much include 11 elements. 7N’s Transition Record did not include advance directives or documented surrogate decision maker because it is not required by the state. A form has been developed and is going through the final review and approval process.
Inpatient Psychiatric Facility Quality Reporting
7N exceeds national performance on a number of quality measures, and improved screening for metabolic disorders by 37% to 84% from 62% of patients discharged on antipsychotic medications.
Strengthen the Core: Quality | 73
DESIRED DIRECTION 100% 100% 98% 84% 0% 62% 75% 72% 77% 67% 0% 50% 100% Multiple Antipsychotic Medications at Discharge with Appropriate Justification Alcohol/Other Drug Use Treatment Provided or Offered at Discharge Tobacco Use Treatment Provided or Offered Screening for Metabolic Disorders Complete Transition Record Percent of Patients FY2022 FY2023 YTD National
Increased capture of spiritual histories advances culturally appropriate, patient-centered care
Research suggests that industry-wide, more than 75% of very seriously ill patients with the possibility of dying would welcome spiritual discussion. Yet, just over half of surveyed patients who wished to discuss religious/spiritual concerns while hospitalized report actually having such a discussion with a member of their care team.
Complete Spiritual History
Overall, completion of spiritual histories increased 26% to 49% from 39% with the modified documentation workflow.
At just 37%, the completion rate for spiritual histories by supportive and palliative care providers during an initial consultation at ChristianaCare was far short of Joint Commission and National Consensus Project guidelines requiring that patients’ spiritual needs are assessed and addressed in the plan of care. A key reason – providers viewed spiritual history discussion as something to be initiated exclusively by hospital chaplains, and not part of the part of the primary spiritual care in which all members of the care team participate contributing to a provider-directed, patient-centered care plan.
An interdisciplinary team (of chaplains, nurses and nurse practitioners) from Pastoral Services and the Supportive and Palliative Care team took a two-step approach to improving our compliance rate for this culturally appropriate documentation. First, they modified the spiritual history documentation process, instituting the use of a PowerForm template to more efficiently document a patient’s wishes within the palliative care workflow. They also educated caregivers on the importance of spiritual discussion for many patients, and guided caregivers through use of the updated form, which prompts them through the improved process of capturing spiritual histories.
74 | ChristianaCare Quality & Safety Report 2023
DESIRED DIRECTION
39% 40% 39% 47% 55% 49% 0% 10% 20% 30% 40% 50% 60% % of Reviewed Charts Bas eline Pos t-In terv ention Inpatient Outpatient Total
Spiritual history documentation completion increased by 32% to 49% from 37%; provider knowledge increased anecdotally, and the percentage of surveyed caregivers who reported initiating conversations with patients regarding their wish for spiritual discussion increased by 173% to 60% from 22%.
More work is needed toward full compliance, but the efforts to improve the completion rate of spiritual histories aligns with ChristianaCare’s value of patient-centered care, and also contributes toward the annual operating plan goal of National Committee on Quality Assurance (NCQA) accreditation, which focuses on culturally and linguistically appropriate services.
Survey Responses: Supportive & Palliative Care Team
I prov ide sp iritual care during my vis its
I kn ow h ow to docume nt my sp iritual h isto ry
I kn ow what c haplains do
I kn ow where to docume nt my sp iritual h isto ry
I kn ow when to refer to a chaplain
I kn ow h ow to make a r eferral to a chaplain
I’m comfortable completing a spiritual history with my patients
Post-intervention, the Supportive & Palliative Care team respondents who provide spiritual care more than tripled, to 60% from 22%.
DESIRED DIRECTION Strengthen the Core: Quality | 75 22% 55% 83% 64% 90% 100% 78% 60% 75% 100% 73% 100% 100% 73% 0% 20% 40% 60% 80% 100%
Base line Post-I nterv ention
Percent of respondents
CARE STANDARDIZATION
To advance the annual operating plan goal to Strengthen the Core through care standardization, teams throughout the health system are developing new clinical standards to standardize elements of complex care processes toward the delivery of safe, high-quality, efficient, and equitable, patient-centered care.
Restructured steer standardizes complex care processes
The Care Standardization Steer was restructured, and a centralized Care Standardization Execution and Deployment Team was formed near the end of fiscal year 2022 to help ChristianaCare standardize complex care processes that most closely align to system goals and, therefore, Strengthen the Core.
ChristianaCare has been on a quest to do care standardization since 2016. Previous attempts were successful in pockets, yet variations and gaps in the execution processes and varied availability of resources to oversee the care standardization strategy led to inconsistencies. A new care standardization strategy was launched starting with Learn and Share sessions. The sessions were meetings with external healthcare partners that do care standardization well, to help us identify components needed to close gaps of the past. This strategy involved:
• Embracing a common definition for care standardization.
• Establishing a centralized execution and deployment team.
• Re-establishing a care standardization governance team.
• Developing a new care standardization framework to provide development and execution consistency.
• Testing the new framework against existing clinical standards that need improvement with implementation and sustainment.
This year, the Care Standardization Steer has identified three new clinical standards for development: Sepsis in non-critical care areas, Anticoagulation pre and post procedure, and Mobility as it relates to length of stay. The execution and deployment team will guide clinical experts through the new care standardization framework, which includes an early assessment of readiness to ensure a successful engagement through to sustainment and monitoring.
76 | ChristianaCare Quality & Safety Report 2023
Components Addressed in Care Standardization Strategy

In the spring of 2022, ChristianaCare set out on a learning journey to discover how to be successful doing care standardization, understand the gaps of the past, and determine how to restructure the future. Two-to-three new clinical standards are expected to be developed in 2023, with more to follow in coming years.
ChristianaCare defines care standardization as the delivery of processes and interventions, aimed to reduce unnecessary variation in patient care and improve outcomes. It includes the development and monitoring of processes that provide guidance on prevention and screening, diagnosis and treatment, management and prevention of disease complications, palliative and end-of-life care, and the systems and operations to support its delivery.
Governance Approval/ Accountability Methods CMG, Lipp., JH, EVP., process measures, and outcomes Source of Truth Location Framework Promotion Communication/ Support Implementation/ Shared Resources Execution/Sustainment
Strengthen the Core: Care Standardization | 77
Twiage smartphone app streamlines critical information exchange in cardiac emergencies
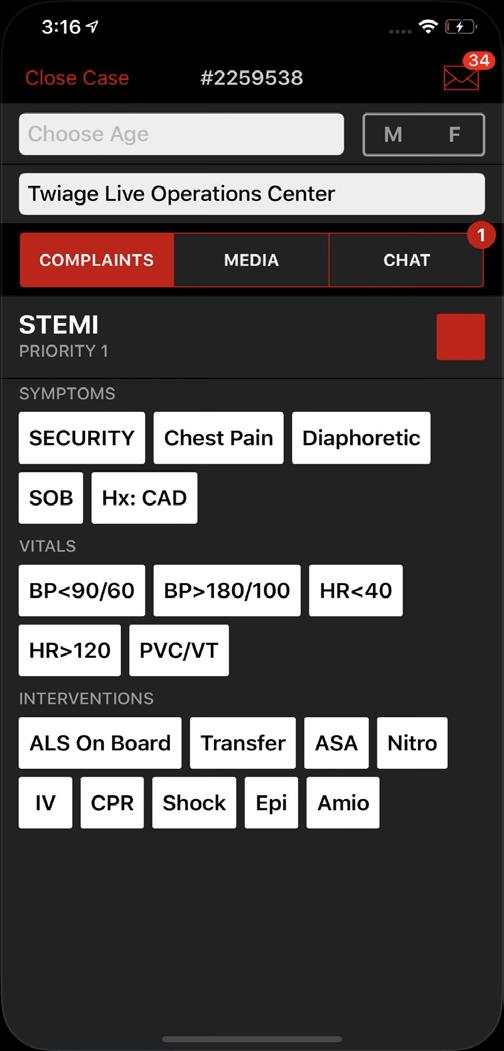
Standardized workflow expedites care, accelerates time to treatment

Emergency medical providers historically used radio technology to communicate with ChristianaCare from the field regarding critical incoming patients. Implementation of Twiage, a smartphone application to support electronic communication—including demographics, vital signs, pictures and electrocardiogram (ECG) images—now allows for immediate activation of the Cardiac Catheterization Lab team for ST-segment elevation myocardial infarctions.
Twiage decreased the first medical contact time by 14 minutes, door-to-balloon time* by 13 minutes, and alert-to-code time for ST Elevation Myocardial Infarction (STEMI)—a heart attack with completely blocked artery—by eight minutes, which is critical, as the faster a heart attack is stopped, the less cardiac muscle is lost and the more patient outcomes are improved.
78 | ChristianaCare Quality & Safety Report 2023
Time to Balloon
Door to Balloon time decreased 24% to 39.4 minutes from 52 minutes with Twiage. First Medical Contact to Balloon time decreased 17% to 70 from 84 minutes.
STEMI Alert to Code Time
Twiage reduced the average time from STEMI Alert to Code by 44% to 10 minutes from 18 minutes.
DESIRED DIRECTION DESIRED DIRECTION Strengthen the Core: Care Standardization | 79 52.0 84.0 39.4 70.0 0 10 20 30 40 50 60 70 80 90 Door to Balloon First Medical Contact to Balloon Time (minutes) 2021 With Twiage 18 10 0 5 10 15 20 Without Twiage With Twiage Time (minutes)
New protocols reduce CT scan radiation dose, preserve image quality for pediatric patients
Reducing radiation dose from CT scans while maintaining superior image quality is a fundamental aspect of excellence in patient care, especially in terms of reducing lifetime risk for pediatric patients. Through care standardization of dose and image quality protocols, a team approach to staff education, and continued monitoring, Imaging achieved substantial reduction of radiation dose for scans to the head, abdomen and pelvis for all pediatric age groups—and improved or met the 50th and 75th percentile national average dose compared to other institutions who participate in the national Leapfrog survey—while preserving image quality.
A new protocol for pediatric CT imaging lowers the dose without sacrificing image quality based on the patient’s age. The protocol has decreased the accumulative radiation dose by 34% for CT scans to the head and by 26% for scans to the abdomen and pelvis. 100% of scans to the head met the median of 50th (and 75th) percentile national average dose for 2022. Of scans to the abdomen and pelvis, 80% met the median of 50th percentile national average, and 100% met the median of 75th percentile national average dose for 2022.
Imaging will continue to monitor radiation dose and image quality for all pediatric CT scans of the head, abdomen and pelvis and annually evaluate radiation dose comparisons to other institutions through the Leapfrog survey.
Pediatric median CT head radiation dose for all age groups decreased to better than the national benchmark 50th percentile.
80 | ChristianaCare Quality & Safety Report 2023
Dose Reduction: CT Head
DESIRED DIRECTION 0 100 200 300 400 500 600 700 800 900 0 100 200 300 400 500 600 700 800 900 < 11 -4 5-9 10-14 15-17 50th Percentile Median Dose (mGycm ) Age Group 2020 2021 2022 50th Percentile
Standardized patient education materials better prepare patients to navigate chemotherapy treatments
A newly created Oncology Patient Education Committee created 166 standardized patient education templates and 61 adverse drug event summaries, helping to improve patient safety through accurate and applicable standardized information, side effect descriptions, and self-management tips for those receiving specific chemotherapy treatment regimens.
Team members identified the need to create standardized education materials, noting that many existing documents previously shared with patients lacked crucial information — and in some cases contained erroneous information and grammatical errors; were written at an inappropriate health literacy level; and failed to effectively counsel patients at a time when they most needed valuable and accurate information and self-care guidance.
Each new guideline is reviewed by Pharmacy & Therapeutics for clinical accuracy, and by the Health Literacy team to ensure content is at an industry-accepted 7th grade reading level. Many are translated to Spanish. The new and approved patient education materials are now easily accessible by caregivers, patients and family members via portal.
Health Literacy: Median Grade Level
Health literacy improved dramatically — to a median grade level of 7 from 29. DESIRED DIRECTION 0 5 10 15 20 25 30 Grade Level Pre Post Strengthen the Core: Care Standardization | 81
PATIENT EXPERIENCE
Transitions of care, multidisciplinary rounds positively impact HCAHPS scores
Transitions of care and multidisciplinary rounds appear to be having a positive impact on Hospital Consumer Assessment of Healthcare Providers and Systems (HCAHPS) scores — responses to questions pertaining to discharge processes exceed 85%. In fiscal year 2023 to date, the top box scores for “Received information on symptoms to look for” and “Talked about help you would need” are 89.5% and 85.1%, respectively.
The emphasis on courtesy and respect is paying off. Top box scores for “Treated with courtesy and respect” are 82.7% for nurses and 81.7% for doctors.
HCAHPS FY 2023 YTD July 2022 - March 2023
Overall Rating of Hospital
Communication with Nurses
Communication with Doctors
Communication About Meds
Responsiveness of Hospital Staff Discharge Information
Ca re Transit ions
Cleanliness / Quietness
Would Recommend Hospital
Top Box Score
Top Box scores for Discharge Information, Communication with Nurses and Communication with Doctors exceed 70%.
82 | ChristianaCare Quality & Safety Report 2023
DESIRED DIRECTION 62.6% 74.2% 73.5% 53.7% 57.6% 87.2% 49.1% 51.0% 65.7% 0% 20% 40% 60% 80% 100%
How to Achieve Patient Experience Goals
Teach-Back
Emphasize Communication
Bedside Shift Report & Manage Expectations
Emphasize the fundamentals
Courtesy & Respect
Share the facts with your team
As we continue to advance our work to achieve Patient Experience goals, our focus remains on four progressive steps, including sharing facts with the team; emphasizing the fundamentals of Courtesy & Respect; emphasizing communication through bedside shift reports; and practicing teach-back.
HCAHPS data and comments provide important launching points for unit- and department-level conversations in huddles and team meetings. Teams reflect on how the unit or department’s data compares to national benchmarks; review what patients are saying the unit or department does well and which aspects could be improved; and caregivers are encouraged to consider and identify barriers to improvement.
Particular emphasis is placed on communication best practices. This is accomplished by:

• Providers: Managing Expectations.
• Nurses: Conducting Bedside Shift Reports.
• Patient Care Technicians: Ensuring Purposeful Hourly Rounding.
• Operations: Facilitating Timely Service Recovery.
Strengthen the Core: Patient Experience | 83
Intensive interdisciplinary approach improves patient experience
Nursing Bundle focus on bedside shift reports, teach-back and purposeful hourly rounding key to raising NRC composite scores
A three-tiered intensive intervention, which builds upon a collaboration between Nursing and Patient Experience to improve inpatient National Research Corporation (NRC Health) composite scores in the journey to Magnet redesignation, is demonstrating an immediate and measurable impact on improving patient experience scores in all metrics. The broadened interdisciplinary collaboration focuses on service recovery, leadership and experience rounding, evidence-based best practices in communication and data review from qualitative and quantitative patient feedback.
Patient experience scores improved in all metrics on the six units whose clinical leaders were part of the first cohort, compared to units not involved in the intensive intervention. Teachback scores increased by an average of 19 points; Quiet at Night scores increased by an average of 11 points; purposeful hourly rounding scores increased by an average of 10 points; and courtesy and respect increased by an average of 6 points.
Change in Scores: Pre v Post Intervention by Group July - October 2022 v December 2022 - March 2023
Nurses listened carefully
Confidence/trust in nurses
Nurses courtesy/respect
Staff eased discomfort
Comfort talking w/ nurses
Nurses explained things
Had input/say in care
Courtesy/respect
Likelihood to Recommend Taught
Cohort 1 scores improved by an average of 8.5 points after the intensive intervention, while average scores for other units changed by less than ½ point. The greatest increase was in teach-back, with an average 19 point improvement.
84 | ChristianaCare Quality & Safety Report 2023
DESIRED DIRECTION
care
Purposeful Hourly Rounding Teach Back Quiet at night Worse . . . No Change . . . Better C ohort 1 Av g Me d/Surg 0 10 -10 -20 20
at home
Magnet redesignation requires units to place above the 50th percentile on NRC composite scores for patient experience. Recognizing a need to drive improved results for underperforming units, a core team tiered inpatient nursing units into three cohorts, based on their Magnet scores for NRC percentile ranking as of summer 2022, and prioritized the order for—and intensity level of—intervention support:
• Tier 1 units ranked < 25th percentile.
• Tier 2 units ranked between the 25th – 50th percentiles.
• Tier 3 units ranked > 50th percentile (required for Magnet redesignation).
Six units in Tier 1 identified as needing the most immediate and intensive level of support formed the first cohort for intensive support. A Patient Experience program manager coached nursing leadership on each unit over the course of six weeks, providing rounding support based on the Nursing Bundle, which emphasizes bedside shift reports and purposeful hourly rounding as key drivers of improved patient experience. Unit-based nurse practice councils were engaged, and the Patient & Family Health Education team provided training on the teach-back method to improve patient understanding of health information and instructions.
While started with a Nursing-focus because of its roots in Magnet, the approach has since broadened to involve providers and inpatient medical directors in intensive efforts to define, design and contribute to the delivery of measurable improvements for their respective units and service lines. Medical directors from more than 50 units on the Newark, Wilmington and Cecil campuses have now received education and coaching around service recovery; leadership and experience rounding; evidence-based best practices in communication; and data review from qualitative and quantitative patient feedback. Over the course of a month, the clinical leaders spent a cumulative 8-12 hours exploring individual and systemlevel strengths and opportunities in patient and caregiver experience, as well as the role of a physician in championing improvement in human experience. A communications toolkit linked to NRC videos now guides discussion in unit and group-wide spaces.
Leader Rounding
Leadership rounding doubled after the post-intensive unitbased medical director efforts, to 54% from 27%.
DESIRED DIRECTION 27% 54% 0% 10% 20% 30% 40% 50% 60% Percent of Responses Pre-Intensive Post-Intensive continued on page 86 Strengthen the Core: Patient Experience | 85
Following the initial six-weeks of intensive support from Patient Experience, cohorts transition to ongoing work with Organizational Excellence to ensure sustainability of improvement.
• Cohort 1 has now completed both the Patient Experience and Organizational Excellence components with measurable improvements, and continues work toward sustainability.
• Cohort 2 has completed both components, with preliminary data indicating positive improvements similar to those seen with Cohort 1.
• Cohort 3 has completed the Patient Experience component and is now transitioning to Organizational Excellence.
A similar method of intensive coaching intervention was delivered to five ambulatory clinical leads at the MAP 2 primary care practice (see page 88). Key metrics related to communication with patients increased post intervention, with Consistent Information increasing by 34 points and Care Providers Listened increasing by 24 points, and learnings from this work are now being shared with other core primary care practices.
This intensive work to improve patient experience scores across all metrics builds upon the six key patient experience components of the Nursing Bundle:
1. Purposeful hourly rounding.
2. Bedside shift report.
3. Exceptional experience leadership rounds.
4. Patient education and teach-back.
5. Quiet environment.
6. Service recovery.
86 | ChristianaCare Quality & Safety Report 2023
Understanding the data
Updated on the 15th of every month, the Clinical Effectiveness dashboard is an important tool to assess unit-specific trends. Leadership checks NRC weekly for positive comments and flagged alerts, and performs service recovery within seven days. High-level themes from data-driven narratives are discussed in partnership with Nursing leadership and monthly improvement plans are created and shared with unit staff/providers. Leaders use the dashboard to model best practices, build healthy and productive working relationships toward shared goals in improving patient experience, and develop a culture of experience that engages teams in feedback and solution-driven communication around patient experience.
“Leadership connection to our purpose and aspirations drives a culture of love and excellence. We’re encouraged to think about human experience as an ‘add in’ to daily practice, not an ‘add on’.”
Himani Divatia, D O , FACP, FAAP, Medical Director, Patient Experience
Strengthen the Core: Patient Experience | 87
Intensive ambulatory project helps raise patient experience scores for Primary Care at MAP 2 patients
Greatest improvements reported in delivery of consistent information and caregivers listening
An interdepartmental patient experience intensive project to engage and empower providers and frontline caregivers to envision and shape the patient experience had an immediate positive impact on National Research Corporation (NRC Health) survey scores in five key areas for the Primary Care at MAP 2 practice in the third quarter of fiscal year 2023.
Improvement in Patient Experience
Pre v. Post Intervention
C onsis tent Informa tion
Ca re prov iders listened
H ad enough i nput/say in care
Likelihood
Key metrics related to communication with patients increased post intervention –Consistent information by 27 points, Care providers listened by 24 points and Nurses listened by 33 points.
DESIRED DIRECTION
R2L data for fiscal year 2022 showed that the majority of grievances expressed by patients receiving primary care at MAP 2 were related to communication, attitude/courtesy, accessibility and care/treatment — all consistent with NRC qualitative feedback revealing patient concerns about care continuity and receiving timely follow-ups to phone calls, portal messages, prescription refills, etc.
88 | ChristianaCare Quality & Safety Report 2023
Good com munic ation b/w staf f Percentile Rank Ju l-Sep 2022 F eb-Mar 2023 0 10 20 30 40 50
to Re commend
Based on a series of meetings with and observations with the Contact Center, where initial patient contact is made; interviews, focus groups and observations of caregivers and providers at the practice; and regular meetings with both Medical Group and iLEAD leaders, top-priority improvements were identified and implemented.
The Patient Experience team provided direct observation and feedback around communication opportunities specific to caregivers at the ambulatory practice, with emphasis on AIDET, teach-back, and managing expectations. Key metrics related to communication with patients increased post intervention, with Consistent Information increasing by 27 points, Care Providers Listened increasing by 24 points and Nurses Listened by 33 points.
Through April, compared to the three-month period from July to September 2022, NRC survey scores had, indeed, increased in five key areas:
• Net Promoter Score (NPS) increased by 5 percentile rank points to the 22nd percentile from the 17th percentile.
• Had enough input/say in care increased by 19 percentile rank points to the 36th percentile from the 17th.
• Good communication between staff scores increased by 4 percentile rank points to the 25th percentile from the 21st percentile.
• Consistent information scores rose by 34 percentile ranks points, to the 49th percentile from the 15th percentile.
• Care providers listened rose 24 percentile rank points, to the 44th percentile from the 20th percentile.
Aligned with Making Tomorrow Happen, this intensive project was spearheaded by iLEAD, engaging the Contact Center, External Affairs, Patient & Family Health Education and the Medical Group Analytics, core primary leadership, engagement and optimization teams and the Primary Care at MAP 2 team. Based on the success of this MAP 2 initiative, the team is now developing a sustainability plan and evaluating and identifying lessons learned to implement in other ambulatory practices. Learnings from this work are now being shared with other core primary care practices. In all, more than 100 physicians and advanced practice clinicians will benefit from information shared in longitudinal discussions at a hospitalist group meeting.
A series of eight focus groups conducted with registered nurses, office assistants, medical assistants and providers at Primary Care MAP 2 were highlighted by leaders as “hugely successful,” with caregivers openly and honestly sharing their experiences and ideas for improvement. Leaders also noted that the caregivers’ commitment to patient care was clearly displayed.
continued on page 90
8
Strengthen the Core: Patient Experience | 89
The opportunity
NRC quantitative data indicated the practice’s need to increase top box scores for key metrics to achieve targets for fiscal year 2023:
• Providers listening
• Providers explaining things in a way patients understand
• Staff members demonstrating courtesy/respect
• Likelihood to recommend practice
How they accomplished it
The following top-priority improvements were identified as part of this initial intensive project:
1. Medical assistants (MA) closing out visits by inquiring about refill needs, scheduling follow-up visits (or engaging office assistants (OA) in doing so); ensuring patient understanding of how/when they will receive lab/test results; and addressing care gaps in order to minimize the amount of phone calls and portal messages between appointments.
Themes Addressed: Message Management/Timely Refill of Prescriptions/ Appointment Access/Care Continuity
2. Caregivers now managing expectations with patients regarding turnaround time for refill requests and notification of lab/test results.
Themes Addressed: Message Management/Timely Refill of Prescriptions
3. Caregivers taking refill requests from patients now consistently asking patient how many pills are left and sending messages to Refill Pool flagged as high priority, as warranted.
Theme Addressed: Timely Refill of Prescriptions
4. Practice hosting team-building session to help caregivers identify opportunities to better collaborate at work and get to know each other as individuals.
Theme Addressed: Serving Together
90 | ChristianaCare Quality & Safety Report 2023
Systemwide multidisciplinary rounds drive down length of stay
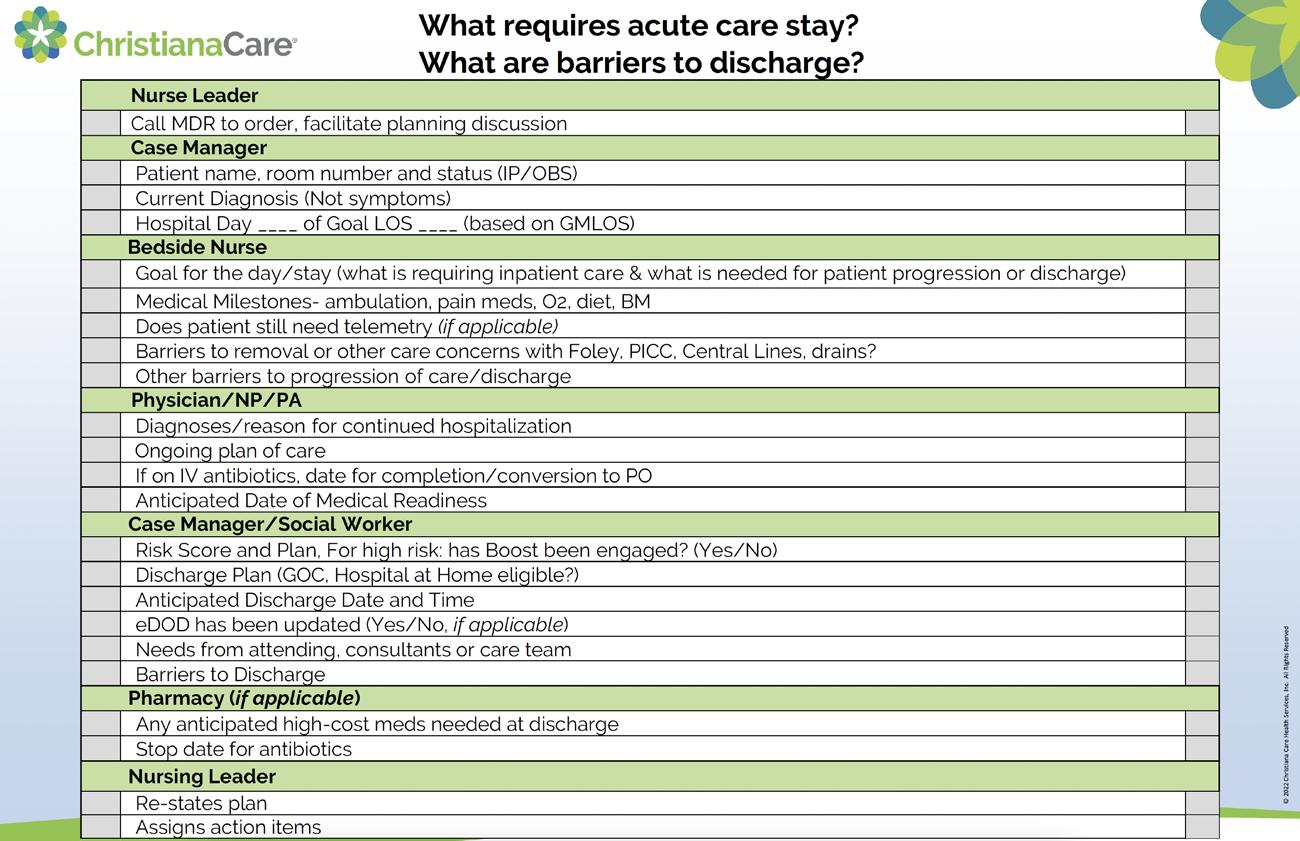
Multidisciplinary rounds (MDR)—focused on optimizing care transitions and addressing discharge barriers—were implemented with the first group of Newark campus units in October 2022, and expanded to Cecil County in January 2023 and to Wilmington in February 2023.
Unlike past rounds, the MDRs are standardized and emphasize efficiency. The scripted process designates specific topics for each member of MDR team.
To facilitate the rounds and discharge plan discussions, an expected day of discharge (eDOD) based on anticipated diagnosis related group assignment was added to the PowerChart banner bar. In addition, an escalation procedure was developed to assist teams in addressing barriers to discharge.
MDRs are observed and scored for logistics and discussion quality on an ongoing basis to support continuous process improvement. Meeting logistics outperforms Discussion quality with scores of 1.73 and 1.69 out of 2.0, respectively. Strengths include active leadership of MDRs, timely start and end of rounds, and completeness of discussion. Top opportunities are related to patient/family concerns and notification of patient/family at least one day prior to discharge, and discussion of possible outpatient options for planned procedures or tests.
continued on page 92
FLOW
Strengthen the Core: Flow | 91
Meeting Logistics
Meeting Logistics overall score was 1.73 out of 2.0. Highest scoring was MDRs were actively led.
Discussion Quality
Discussion Quality overall score was 1.65 out of 2.0. Strength was that all items were discussed (admission date, current diagnosis, expected length of stay, why inpatient care needed).
92 | ChristianaCare Quality & Safety Report 2023
DESIRED DIRECTION DESIRED DIRECTION 1.9 1.8 1.7 1.7 1.5 1.5 All items discussed Speak to Plan of care/ Barriers Estimated date of discharge Pt/Family Concerns Outpatient options Quality Review Score 0.0 0.2 0.4 0.6 0.8 1.0 1.2 1.4 1.6 1.8 2.0 Assigned accountability 1.9 1.8 1.8 1.7 1.7 MDRs a ctively
Began & ended o n ti me R ounds focu sed; flow managed Succinct action steps/ follow -up Wh at needs to happen for discharge? Quality Review Score 0.0 0.5 1.0 1.5 2.0
led
The MDRs appear to be having a positive impact on overall inpatient length of stay, which has been relatively high since the first COVID-19 pandemic wave. Based on an analysis by Kaufman-Hall, comparing the length of stay month-by-month from October 2022 – February 2023 to October 2021 – February 2022, there was a total savings of 1,561 days, for an estimated benefit of $1.4 million.
Overall, length of stay shows a declining trend in recent months. Comparing the period from October 2022 – April 2023 to the same period last year, length of stay decreased 3.8% to 6.68 from 6.95 days. Excluding long-stay patients with stays of 30 days or more, average length of stay decreased to 5.50 days from 5.56 days.
Average Length of Stay Trend
Length of stay decreased 3.8% to 6.68 from 6.95 days. Excluding long-stay patients with a stay of 30 days or more, average length of stay decreased to 5.50 days from 5.56 days.
DESIRED DIRECTION Strengthen the Core: Flow | 93 0 1 2 3 4 5 6 7 8 9 Jul-21Aug-21Sep-21Oct-21Nov-21Dec-21Jan-22Feb-22Mar-22Apr-22May-22Jun-22Jul-22Aug-22Sep-22Oct-22Nov-22Dec-22Jan-23Feb-23Mar-23Apr-23 Length of Stay (days)
Implementation
Length of St ay Lengt h of Sta y (<30 day s) MDR
Observation length of stay approaches 24-hour target
As part of systemwide initiatives to improve efficiencies and patient flow, this year’s annual operating plan included a goal to reduce observation patient length of stay (LOS) on two dedicated units on the Newark campus—ED Observation (ED-Obs) and 6C Medical Observation—to 24 hours.
Multidisciplinary rounds were implemented on the units, with modifications to better address observation status; discussions focused on hours in observation and targeted discharge time. To expedite flow, in addition to MDR, unit leadership—including a newly designated unitbased medical director—increased communication with providers for timely decision-making and discharge orders. Other efforts to drive down length of stay on 6C, include use of the discharge lounge; a 6C-dedicated environmental services caregiver from 1300 to 2130; and partnerships with MRI and ECHO to decrease turnaround times.
The combined LOS for the units reached 24.4 hours in April; just above the 24-hour target. Observation LOS on 6C decreased more than five hours, to 28.4 from 33.9 hours. ED-Obs LOS remained relatively flat at 23 hours. Unit fidelity—the percentage of patients on the unit in observation status—increased to 98%.
To improve coordinated care between the two units, provider and nurse staffing will be combined under one leadership structure and cost center in July 2023, and renamed the Medical Observation Unit. The combined structure will support implementation of observation care management and discharge processes. Construction on a new observation unit on Newark’s first floor is slated to begin at the end of fiscal year 2023.
Observation Length of Stay
ED-Obs length of stay is relatively flat at 23 hours v. target 24 hours. Length of stay on 6C Medical Observation decreased more than 5 hours, to 28.4 from 33.9 hours.
94 | ChristianaCare Quality & Safety Report 2023
DESIRED DIRECTION 0. 0 8. 0 16. 0 24. 0 32. 0 40. 0 Jul-2 1 Aug-21 Sep-21 Oct-2 1 Nov-21 Dec-21 Jan-22 Feb-22 Mar-2 2 Apr-2 2 May-2 2 Jun-22 Jul-2 2 Aug-22 Sep-22 Oct-2 2 Nov-22 Dec-22 Jan-23 Feb-23 Mar-2 3 Apr-2 3 Average Length of Stay (hours) 6C ED Obs Target: 24
Front End Redesign increases Christiana ED efficiency
As one of the busiest emergency departments (ED) nationwide with more than 95,000 visits annually, the Christiana ED was experiencing overcrowding, excessively long waits, and an increasing number of patients leaving without being seen by a provider – left without treatment, or LWOT. An analysis by the Institute on Research on Equity and Community Health (iREACH) identified that the time from arrival until a patient is seen by a provider— door-to-doc time—is a key driver of LWOTs.
Multiple pilots to address wait times were conducted:
• “Check in Vitals” involved positioning an emergency care technician (paramedic) with a nurse at the ambulance bay entrance to take vital signs for all patients upon check-in at the registration window.
• VERT FAST – based on successful models in other EDs, vertical flow replaces beds in an area of the ED with multiple chairs that allow for assessment and medical management of middle-acuity patients in a sitting position. Patients in VERT were seen in 30 minutes versus the average 2.5 hours.
• Provider-in-Triage (PIT) – a physician or advance practice provider was stationed at triage to complete an initial screening exam and initiate testing and treatment. This strategy reduces door-to-doc times, and allows for quick interaction with a physician to start orders. In one snapshot, the time from seeing the doctor to leaving the ED dropped to three hours. This initiative was expanded to the Wilmington ED.
The front-end redesign work has had a positive impact on the key metrics. Median door-to-doc times decreased 55% to 0.72 hours in April 2023 from 1.6 hours in the first quarter of fiscal year 2023. LWOT rates decreased to 4.3% from more than 10% during the same time period.
continued on page 96 Vertical ESI 2, ESI 3, Unknown FT ESI 4 Vertical ESI 2,3,4 ESI 1, Horizontal ESI 2 Horizontal ESI 3 Fast Track ESI 4 Known Fast Track ESI 4, ESI 5 Provider in Triage (PIT) VERT Evaluation Acute Fast Track Results Pending Disposition Check In Strengthen the Core: Flow | 95
Door to Doctor Time
Median time from patient arrival to seeing a provider decreased 55% to 0.72 from 1.6 hours.
Left Without Treatment
The percentage of patients who left the ED without seeing a provider decreased to 4.3% in April from over 10% in the first quarter of FY 2023.
96 | ChristianaCare Quality & Safety Report 2023
DESIRED DIRECTION DESIRED DIRECTION 0. 0 0. 5 1. 0 1. 5 2. 0 Ju l-22 Aug-22 Sep-22 Oc t-22 No v-22 De c-22 J an-23 F eb-23 Ma r-23 Apr-23 Median Hour s 0 2 4 6 8 10 12 14 Ju l-22 Aug-22 Sep-22 Oc t-22 No v-22 De c-22 J an-23 F eb-23 Ma r-23 Apr-23 Percent of ED Patient s
During fiscal year 2023, restraints, including capacity, high census, boarding volumes and staffing vacancies, limited the ED’s ability to continue the redesign efforts. Plans are underway to combine all three in a split-low future state — pending additional staffing and space reconfiguration. In the meantime, work to improve efficiencies related to radiology and lab testing, environmental services and escort continues.

Strengthen the Core: Flow | 97
End Disparities
5-YEAR GOALS
• Drive to zero disparities in access, experience, care delivery, and health outcomes.
• Promote a future where all in our communities are protected from environmental health hazards.
IMPERATIVES
• Embed equity throughout operations and culture.
• Identify, report on and reduce health disparities in quality, process, and outcomes.
• Provide culturally and linguistically responsive health services and education.
• Expand health and social care interventions delivered to priority underserved communities.
• Deliver integrated behavioral health and social care services.
• Drive equity outcomes via investments in technology platforms, data, and analytics.
• Develop and deliver environmental health reporting, advocacy, and clinical expertise.
98 | ChristianaCare Quality & Safety Report 2023
ChristianaCare’s Community Health Department has developed effective, accessible models of care delivery serving patients in clinical spaces, in the community, and at home. This work aims to improve the health and well-being of any patient who may be vulnerable to health disparities. This includes Community Health Worker (CHW) projects in a number of ambulatory spaces; and CHWs working in partnership with community organizations and schools. In addition, Community Health oversees programs that provide connection to education and resources. This includes work to address social determinants of health through home delivery of diet-compliant healthy food kits for those with chronic conditions; referral to the social care connector platform Unite Delaware; and partnership with RoundTrip, a ride-share company that supports patient access appointments by removing barriers to transportation.
Delaware Food Farmacy improves health outcomes by providing food as medicine Program significantly decreases food insecurity, body mass index and HbA1c among graduates
The Delaware Food Farmacy, in partnership with Lutheran Community Services, is helping to keep Medicaid participants with poorly controlled diabetes, hypertension and congestive heart failure healthy at home and out of the hospital through home delivery of healthy foods and support for their social needs from ChristianaCare Community Health workers.
continued on page 100
End Disparities | 99
Social & Clinical Drivers of Health
Percent of Food Farmacy Patients
60% of patients enrolled in Food Farmacy are female, 66% are Black or African American. 77% of patients reported food insecurity; 73% live in high-risk ZIP codes, and most have multiple chronic conditions, including 87% who are hypertensive.
100 | ChristianaCare Quality & Safety Report 2023
DESIRED DIRECTION 60% 66% 18% 87% 73% 77% 87% 76% 0% 20% 40% 60% 80% 100% Fe male Blac k/Afric an Ame rican Hi spanic/Lati no
erweight /Obese
Code F ood Insec ure Hyperte nsiv e Di abetic
Ov
Hi gh Ri sk Zip
Health & Social Needs Outcomes at 6 Months
At six months, hemoglobin A1c and body mass index (BMI) improved. The greatest improvements were seen in the percentage of patients experiencing food insecurity decreasing to 51% from 77%, and in the “treat or eat” dilemma–having to choose between spending money on medical needs or basic needs such as food or housing—which decreased to 4% from 32%.
Upon enrollment in the six-month nutrition-based Community Health Worker program, participants receive the necessary cooking equipment, cooking videos and Dietary Approaches to Stopping Hypertension (DASH)-compliant recipes to prepare healthy meals. They interact with community health workers weekly for help with developing patientcentered goals, support through chronic disease self-monitoring, and improved dietary knowledge and culinary skills. Patients can also opt-in to additional clinical services with pharmacists, registered dieticians and behavioral health consultants. Lutheran Community Services delivers patient-selected, DASH-compliant groceries to participants’ homes weekly — enough food for 10 meals per person, per household.
Of the program’s first 63 graduates, 93% identified as having one or more social needs, with the average number of social needs being 3.66. Social needs were met through Unite Delaware and community referrals. On average, participants developed, two-to-three health goals and 77% of those goals were completed upon graduation. All were satisfied or very satisfied with the program.
continued on page 102
DESIRED DIRECTION
9.2 38.8 77 41 34 32 8.6 35.1 51 23 23 4 0 10 20 30 40 50 60 70 80 90 Measur e
Base line 6 Mont hs
End Disparities | 101
HbA1c BMI Food Insecurity Anxiety Depression “Treat or Eat” Dilemma
Based on key-informant interviews with 14 Hispanic ChristianaCare caregivers (community health workers and medical interpreters), Delaware Food Farmacy is prepared to implement culturally responsive adaptations for Hispanic patients within the next fiscal year. Adaptations include culturally relevant foods, recipes and cooking equipment; family member inclusion in intervention activities; changes to the program name and messaging and partnership with faith leaders and promotores (Spanish for community health workers) to build trust with the health system and promote the program.

102 | ChristianaCare Quality & Safety Report 2023
Roundtrip bookings up nearly 160% Use of online platform reduces travel barriers to needed care
Since July 2022, ChristianaCare’s has provided 9,041 rides through the online Rideshare booking platform for 1,196 patients who otherwise lack transportation to health care appointments. While the program was initially used primarily to reduce appointment noshows and cancellations among patients with a history of missed appointments, its use increased exponentially in the last year—up nearly 160% from only 3,490 bookings in the program’s first two years combined—with the promotion of rides to and from rehabilitation appointments, and those coordinated by Community Health and CareVio to ensure that patients reach needed services.
Roundtrip transportation is via medical sedan, rideshare, taxi, wheelchair or basic life-support ambulance.
RoundTrip Bookings
More than 9,000 RoundTrip bookings for transportation have been provided FY 2023 to date, through April; since 2021, 86% of them from Rehab and Community Health.
DESIRED DIRECTION Rehab, 3992 Community Health, 3884 CareVio, 577 Discharge, 248 Other, 340 0 1000 2000 3000 4000 5000 6000 7000 8000 9000 10000 Number of Bookings End Disparities | 103
Unite Delaware helps community partners improve health, address social needs
ChristianaCare adds shared technology platform to electronic health record
ChristianaCare continues to invest in and utilize Unite Delaware to support patients in social needs ranging from housing, shelter, utilities and food assistance, transportation and services to address substance abuse. The coordinated care network expanded this year to 527 organizations throughout Delaware and Maryland—up from 140 organizations in fiscal year 2022—who work through electronic referrals to address social needs and improve health across communities. The expanded network has served 657 clients to date this fiscal year, for a total of 1,836 cases (average 2.795 cases per client), meeting a 55% increase in case volume for housing and shelter services (572 cases in FY 2023 to date, up from 368 in FY 2022); a 117% increase in the number of requests for food assistance (353 cases in FY 2023 to date, up from 162 in FY 2022); and a 210% increase in help needed with the cost of utilities (347 cases in FY 2023 to date, up from 112 in FY 2022).
Through April 2023, 923 referrals for clients in high-risk ZIP codes were acted upon, surpassing the Annual Operating Plan (AOP) goal by 88%.
Unite DE Referrals from High-Risk ZIP Codes
FY 2023 through April, 923 referrals for clients in high-risk ZIP codes were acted upon, surpassing the AOP goal by 88%.
104 | ChristianaCare Quality & Safety Report 2023
DESIRED DIRECTION 0 20 40 60 80 100 120 140 160 Jul-22 Aug-22 Sep-22 Oct-22 Nov-22 Feb-23 Mar-23 Apr-23 Number of Referrals
Referrals Sent # Referrals Acted On Dec-22 Jan-23
#
In 2022, the platform was integrated into ChristianaCare’s electronic health record, creating an easier pathway to make referrals. Of the 657 clients served to-date this fiscal year for a total of 1,836 cases (average 2.795 cases per client), 56% of the referrals were accepted and 47% of cases were resolved.
Unite Delaware’s robust digital infrastructure allows ChristianaCare to:
• Securely send and receive referrals.
• Improve workflows.
• Track accurate and structured outcome data.
• Make informed decisions to address gaps in service.
*Unite Delaware is HIPAA compliant, HTRUST certified and fully aligns with the strictest federal privacy regulations, including 42 CFR Part 2 and FERPA.
Those being served by Unite Delaware:
• 80% are adults between the ages of 18 and 64.
• 14% are seniors (65+).
• 6% are children (0-17).
• 63% are female.
Unite DE Cases by Social Needs
Cases increased 55% in FY 2023, to 1,836 from 1,188. Housing & Shelter and Food Assistance are the top needs.
DESIRED DIRECTION 0 100 200 300 400 500 600 Housing & Shelter Food Assistance Utilities Clothing & Household Goods Income Support Employment Individual & Family Support Benefits Navigation Transportation Physical Health Mental/Behavioral Health Legal Education Wellness Money Management Substance Use Social Enrichment Number of Cases FY 2022 FY 2023 End Disparities | 105
Eliminating race from estimation of kidney function mitigates disparities, improves care
Implementation of a revised equation that no longer includes race as a co-efficient in estimating the glomerular filtration rate (GFR) to measure kidney function has led to a statistically significant increase in the percentage of Black patients identified as having low kidney function, and reduced the difference compared to non-Black patients.
Low Kidney Function by Test and Race
The percentage of Black patients with low kidney function is higher when GFR is calculated with the new 2021 CKD-EPI equation compared to the MDRD equation, 20.1% v 16.1%, while percentages for non-Black patients decreased.
GFR provides a snapshot of kidney function, and is useful in the screening and treatment of kidney disease, as well as drug dosing. Including race as a coefficient led to overestimation of the GFR for Black patients compared to non-Black patients, exacerbating health care disparities.
Over the years, several equations to estimate GFR using serum creatinine have been developed, with the Modification of Diet in Renal Disease (MDRD) and the Chronic Kidney Disease Epidemiology Collaboration (CKD-EPI) being the most widely adopted in clinical settings. The CKD-EPI and MDRD equations both use a race coefficient in the calculation of eGFR, overestimating the GFR for Black compared to non-Black individuals. Since race is a social rather than a biological construct, experts have argued that removing race from the
106 | ChristianaCare Quality & Safety Report 2023
16.1% 20.9% 20.1% 16.0% 0% 5% 10% 15% 20% 25% Black Non-Black Percent GFR < 6 0 MDRD
2021 CKD-EPI
equation would lead to better health equity by mitigating disparities. This is particularly true for Black patients who experience faster progression to kidney failure and lower rates of transplantation.
In 2021, the National Kidney Foundation and American Society of Nephrology Taskforce recommended to immediately implement a new equation, which was developed without the use of race. ChristianaCare replaced the MDRD equation with the new equation systemwide in April 2022.
The revised GFR equation alerts clinicians to kidney function degradation among Black patients earlier than previous practice, and enables earlier application of guidelines for referral to nephrologists, resulting in health equity improvement. It also allows severe kidney disease (GFR<30) to be more frequently detected among Black patients undergoing contrast-based imaging, leading to an increase in hydration orders and reducing the risk of acute kidney injury.
Contrast-Based Radiologic Exam Alert
The percentage of Black patients whose physicians would need to be alerted prior to a contrast-based exam is higher when GFR is calculated with the new 2021 CKD-EPI equation compared to the MDRD equation ( 9.0 % vs 7.6%)
continued on page 108 End Disparities | 107 5.0% N on-Black 7.6% 5.6% 9.0% 0% 1% 2% 3% 4% 5% 6% 7% 8% 9% 10% Blac k Percent GFR < 3 0 MDRD
2021 CKD-EPI
Eligibility for Referral to Nephrologist
The percentage of Black patients eligible for referral to a nephrologist is higher when GFR is calculated with the new 2021 CKD-EPI equation (4.3%) compared to the MDRD equation (3.6%).
The multidisciplinary implementation team will continue to evaluate the impact of the change in the GFR calculation in the settings of population health management, referral to specialty care and patient safety. The team includes members of the Department of Pathology & Laboratory Medicine, the Office of Health Equity, Pharmacy, iREACH, nephrologists and internists.
108 | ChristianaCare Quality & Safety Report 2023
3.6% 2.0% 4.3% 1.8% 0% 1% 2% 3% 4% 5% Percent GFR < 3 0 MDRD 2021 CKD -EPI Black Non-Black
LITTLE DROPS OF LOVE
NICU implements oral care best practices to eliminate
breastmilk feedings in the neonatal intensive care unit (NICU) are helping to eliminate racial disparities in maternal milk usage in for very low birth weight (VLBW) infants.
Maternal breast milk feedings for all babies in the NICU increased nearly 14% in the six months post implementation, to 48.4% from 42.5%. The use of maternal breastmilk milk over formula by Black or African American mothers increased by 32% over the course of 15 months to 45% of total feedings compared to 34% at baseline. This increases the ratio of maternal milk to formula use by Black or African American mothers to 1.62.
continued on page 110

End Disparities | 109
Ratio of Maternal Milk to Formula <1500 grams birthweight
The ratio of maternal milk to formula for Black or African American mother increased from 0.69 (34% of total feedings) to 1.62 (45% of total feedings)
Maternal breast milk is associated with decreased risk of infection, enhanced protective immune mechanisms, improved maternal/infant health outcomes and reduced hospital costs for the care of very low birthweight babies (>1,500 grams). Key drivers for disparities in use among Black or African American mothers versus all mothers may include difficulty obtaining a breast pump and equipment; difficulties acquiring a pump despite Medicaid eligibility; difficulty visiting the baby either due to the need to return to work or transportation challenges.
Standardized best practices to support the increased use of maternal breast milk by mothers of all VLBW babies in the NICU include:
• Counseling during pregnancy on the benefits of breast milk and pumping during pregnancy by an obstetrician or lactation specialist.
• Dedicated lactation support, nutrition education and counseling in the NICU.
• Family centered couplet care — keeping mom and baby together for immediate bonding to increase success rates for breastfeeding.
• Virtual peer support.
• Community Health Worker support.
110 | ChristianaCare Quality & Safety Report 2023 DESIRED DIRECTION
0. 0 0. 5 1. 0 1. 5 2. 0 2. 5 3. 0 3. 5 4. 0 Base line (Oct 2021) Period 1 (J ul 2022) Period 2 (J an 2023) All Wh
ite Blac k/Afric an Ame rican Maternal breast
milk/formula
Key strategies leading to the improvement include pilot of an oral care dropper product to support oropharyngeal administration of colostrum; modification of the NICU admission order set in PowerChart to prompt breastfeeding; development of a care management guideline; and provider education.
While the initiative’s impact on infection remains unclear due to data collection challenges, initial results indicate a positive trend toward decreased ventilator-associated events and pneumonias with secondary bloodstream infections corresponding to increased use of maternal breastmilk during this time period.
The subsequent 8% decreased use of formula (to 46.9% from 51.1%) and the 26.5% decreased use of banked breast milk (to 4.7% from 6.4%) resulted in a cost savings of $17,400.
NICU Feeding Diet & Volume –VLBW
Maternal breast milk use for very low birth weight (VLBW) babies (<1,500 grams) increased 28% in the six months after implementation, while formula use decreased 20%.
DESIRED DIRECTION 45.4% 58.1% 13.9% 9.1% 40.8% 32.8% 0% 10% 20% 30% 40% 50% 60% 70% Pre (Oct 2021-Ma r 2022) Post ( May -Oct 2022) Percent of Feeding Volume % Mom Breast + /- O ther % Banked Breast +/- Ot her % Formul a Only End Disparities | 111
Keep People Healthy at Home
5-YEAR GOALS
• Become a national leader in population health outcomes.
• Reduce total cost of care by 5%.
• Ensure every person receives the right care in the right setting (hospital, home, virtual, community).
IMPERATIVES
Drive population health outcomes via investments in data, analytics, and patient engagement.
Build and mature a highly engaged clinically integrated network. Expand care continuum with a focus on post-acute and home-based care partnerships.
Rapidly digitize clinical processes.
Ensure the right care is delivered by partnering with patients in decisionmaking to support their health-related goals.
112 | ChristianaCare Quality & Safety Report 2023
SUPERCHARGING VIRTUAL HEALTH
Hospital Care at Home transforms where—and way— care is delivered
ChristianaCare is leveraging virtual and digitally enabled technology to deliver an inpatient level of care in the comfort of a patient’s home. The ChristianaCare Hospital Care at Home program (HCH)—a CMS individual waiver program*—admitted its first patient on December 14, 2021. 523 patients who otherwise would have been admitted to an inpatient unit have since received acute care services in the home.
523 patients have received acute care services in their home through the Hospital at Home program.
Hospital Care at Home Admissions
DESIRED DIRECTION continued on page 114 Keep People Healthy at Home | 113 0 10 20 30 40 50 60 Dec-21Jan-22Feb-22Mar-22Apr-22May-22Jun-22Jul-22Aug-22Sep-22Oct-22Nov-22Dec-22Jan-23Feb-23Mar-23Apr-23May-23 Number of Admissions
Focused on a robust quality and patient safety infrastructure, the program achieved exceptional patient outcomes in less than a year. Lower hospital-acquired infections, lower readmission rates, and exceptional patient satisfaction scores (83.3% likely to recommend) that outperform the brick-and-mortar hospital, are leading indicators of early success. The acuity level of Medicare beneficiaries in the HCH program is comparable to the brick-andmortar hospital at a case mix index (CMI) of 1.20, and 1.37 for patients escalated back to the brick-and-mortar setting.
Hospital Care at Home Patient Safety
Hospital at Home’s safety metrics compare favorably to the ChristianaCare medical rates, including an HAI 0.25 rate per 1,000 patient days compared to 1.1 and a 11.2% readmission rate compared to 15.1%.
The Hospital Care at Home Program is staffed with hospitalists, nurses, paramedics and patient digital ambassadors and leverages externally contracted providers for other providers such as therapists, laboratory, and imaging as necessary. In fall 2022, the program evolved to a Mobile Integrated Healthcare model, working with the State Office of Emergency Medical Services to incorporate paramedics in the program as the primary in-home clinicians. The program will continue to focus on health equity and monitor the total cost of care analysis, and is exploring potential for offering hemodialysis to the list of offered services.
114 | ChristianaCare Quality & Safety Report 2023
DESIRED DIRECTION 0.25 11.2 6.9 7.3 10.00 0.00 1.1 15.1 6.9 0. 00 5. 00 10. 00 15. 00 20. 00 30-Day Inpatient Readmissions Average Length of Stay (days) 30-Day Return to Emergency Room Escalation Rate Unanticipated Mortality Rate Rate/Percent Ch risti anaCare N/A N/A N/A Hospital Care at Home Hospital-acquired infections rate
Goals of the Hospital Care at Home program include:
• Transforming the way care is delivered, including leveraging the home as the new venue of care.
• Reducing readmissions as compared to brick-and-mortar hospitals.
• Reducing hospital-acquired infections as compared to brick-and-mortar hospitals.
• Improving the overall patient hospital experience as compared to brick-and-mortar hospitals.
• Reducing the overall cost of care.
• Helping to create capacity to ensure the availability of beds for patients needing to be admitted to a brick-and-mortar hospital.
Key elements of Hospital Care at Home
24/7 Medical Command Center – ChristianaCare physicians, advance practice providers and RNs manage patients telemedically. Paramedics and our Patient Digital Ambassadors are key caregivers in hospital care at home.
Technology Platform – in-home installation of reliable and easy-to-use biometrics and safety-related technology enables the delivery of virtual care and ensures integration with the longitudinal electronic health record
Acute Rapid Response services – everything the patient needs is brought to the home, including, but not limited to:
• Infusion.
• Supplemental O2
• Durable medical equipment.
• Oral medications and prescription services.
• Phlebotomy and lab work.
• Physical, occupation and speech therapy.
• Meals.
• Medical Supplies.
• Transportation.
* The Consolidated Appropriations Act, 2023 extended the AHCaH waiver program through December 31, 2024.
Keep People Healthy at Home | 115
READMISSIONS
Readmission rate holds stable, with opportunities compared to Vizient peers
Hospital readmissions are a standard outcome measure that may reflect the complex processes of care across the continuum – including appropriate discharge planning, patient education, medication management and transitions of care. Driving improvement in readmission rates requires pushing multiple levers, from understanding the factors causing unplanned hospital returns, to consistent application of best practices, provider communication, continuity of care and access to care.
ChristianaCare’s hospital-wide 30-day readmission rate has been stable at 10.9% over the past two years, but there are opportunities compared to our peers in Vizient. Numerous efforts across the system are addressing the key drivers and best practices to help drive the rate down and keep our patients in the community.
Hospitalwide 30-Day Readmission Rate
Hospital 30-day readmission rates show common cause variation around mean of 10.9% in FY 2022 and FY 2023, with rate ranging from 10.0% to 11.8%.
116 | ChristianaCare Quality & Safety Report 2023
DESIRED DIRECTION 0. 00% 2. 00% 4. 00% 6. 00% 8. 00% 10. 00% 12. 00% 14. 00% Ju l-2 1 Aug-21 Sep-21 Oc t21 No v21 De c21 J an-22 F eb-22 Ma r22 Apr-2 2 Ma y22 J un-22 Ju l-2 2 Aug-22 Sep-22 Oc t22 No v22 De c22 J an-23 F eb-23 Ma r23 Percent of discharges
HELPING PATIENTS STAY HEALTHY AT HOME
Follow-up appointments scheduled before patients leave the hospital safeguard continuity of care, lessen risk for unplanned readmissions
More than 60% of acute-care readmissions occur within the first two weeks after a patient is discharged from the hospital. While timely follow-up with primary care or specialist providers following an acute-care stay is known to lessen the risk for unplanned hospital readmissions, until recently, the burden to schedule those appointments fell on the patient.
Now, an iterative, collaborative process—which shifts responsibility for booking follow-up visits to caregivers before the patient leaves the hospital — has improved the compliance rate of post-discharge follow-up by 16% to 87% in April 2023 from the fiscal year 2022 baseline of 75%. Opened access by the Medical Group and calls by Transition of Care nurses were both key to this improvement (see page 116).
• AOP Goal: Increase the percent of patients attributed to Medical Group primary care physicians and discharged to home or home health who have a follow-up appointment scheduled within 14 days of discharge.
14-Day Post Discharge Follow-Up Appointment
The percent of inpatients with a Medical Group primary care provider who had a 14-day follow-up appointment scheduled prior to discharge reached 87% in April, exceeding the 82% target.
DESIRED DIRECTION Keep People Healthy at Home: Readmissions | 117 75% 78% 81% 79% 78% 81% 76% 81% 85% 82% 87% 0% 20% 40% 60% 80% 100% FY 2022 Jul-2 2 Aug-22 Sep-22 Oct-2 2 Nov-2 2 Dec-2 2 Jan-23 Feb-23 Mar-2 3 Apr-2 3 Percent of discharges
Virtual program boosts safe transitions to primary from acute care
Increased post-hospital follow up helps decrease need for readmissions
The Center for Virtual Health’s (CVH) Boost program, part of the Acute pillar, provides seamless transitions of care of acute care patients back to their primary care providers, with support from community to help decrease hospital readmission rates.
The team comprises virtual hospitalists, virtual RN case managers and Patient Digital Ambassadors with support from a pharmacist and social worker. Referrals are placed through the electronic health record, either for Referral for Post-Discharge Appointment (PDA) for patients discharged to home, or Referral to Acute Boost for all other post-discharge follow-up. Due to the volume of requests—70 to 100 each day—and to reduce overlap of services, referrals for patients followed by CareVio or Medical Group providers are automatically directed for follow-up support to CareVio nurses or the Medical Group.
Transition of Care (TOC) Support Volumes
Since October 2021, more than 6,800 Transition of Care calls have been made and almost 3,500 post-discharge appointments have been scheduled.
118 | ChristianaCare Quality & Safety Report 2023
DESIRED DIRECTION 0 100 200 300 400 500 600 700 Oct-21Nov-21Dec-21Jan-22Feb-22Mar-22Apr-22May-22Jun-22Jul-22Aug-22Sep-22Oct-22Nov-22Dec-22Jan-23Feb-23 Number PDA Di scharge Appt s Sc hedule d RN TOC Cal ls
The transition of care process includes a review of the acute care hospital stay – such as plan of care, discharge summary and instructions, medication reconciliation, follow-up needed and barriers to outpatient care. Patient Digital Ambassadors schedule primary care and specialty appointments based on the referral order. When a primary care provider is not available within the required timeframe, a Boost physician conducts a virtual post-discharge visit. The nurse completes the transition of care assessment, including patient education, medication review, and referrals to community resources such as drug/alcohol abuse support, social work and palliative care. Since October 2021, more than 6,800 transition of care (TOC) calls have been made and almost 3,500 post-discharge appointments scheduled. Boost physicians saw more than 700 patients in virtual office visits. The average time to visit was less than nine days — well below the 14-day goal.
Boost Virtual Office Visits: Volume & Days to Visit
Over the past 12 months, Boost physicians conducted over 700 virtual visits, with 8.8 days from referral to visit.
DESIRED DIRECTION FOR VISITS
DESIRED DIRECTION FOR DAYS 0. 0 2. 0 4. 0 6. 0 8. 0 10.0 12.0 14.0 0 20 40 60 80 100 120 Mar-22 Apr-22May-22 Jun-22 Jul-22Aug-22Sep-22Oct-22Nov-22Dec-22 Jan-23Feb-23 Average Days from Referral to Visit Number of Visits
page 120 Keep People Healthy at Home: Readmissions | 119
Of fice Visi ts Re ferral to Visit Da ys
continued on
To further impact readmissions, the Boost clinic provides a virtual 30-day program. The readmission rate for high-risk patients completing the program is 11.0% fiscal year 2023 to date, through February.
Acute Boost Readmission Rate
FY 2023 to date, the 30-day readmission rate was 11.0%
Standardized readmission reviews identify contributing factors
ChristianaCare was penalized $2.8 million for excess readmissions under the CMS Hospital Readmission Reduction Program for federal fiscal years 2017-2019, creating an impetus to reduce readmission rates. In addition, in 2019, the eBrightHealth Accountable Care Organization (ACO) goals included a 5% decrease in 30-day readmissions. At the request of the ACO Acute Care Optimization Work Group, a systemwide readmission reduction team, including representatives from all service lines, case management and data analytics, was formed to standardize the process of readmission reviews, identify contributing factors, and enable best practice solutions.
120 | ChristianaCare Quality & Safety Report 2023
DESIRED DIRECTION
0. 0% 2. 0% 4. 0% 6. 0% 8. 0% 10.0 % 12.0 % 14.0 % 16.0 % 18.0 % Oct-21Nov-21Dec-21Jan-22Feb-22Mar-22Apr-22May-22Jun-22Jul-22Aug-22Sep-22Oct-22Nov-22Dec-22Jan-23Feb-23 Percent of Patient s
At that time, the team learned that existing readmission reviews were siloed and duplicative. The group collated all existing service line tools and reviewed literature to develop a standard set of review questions covering 52 factors in six categories: Diagnosis and Therapeutic Problems, Medication Error, End of Life and Advance Care Planning, Continuity of Care, Social and Community Support, and Self-Management Instructions.
Since go-live in December 2020, 1,370 standardized readmission reviews have been completed by all service lines and the CareVio post-acute team to better understand and address system and patient factors leading to 30-day readmissions. More than 5,200 contributing factors have been identified. Self-Management Instruction accounts for 24% of factors, followed by Social and Community Support at 21% and Diagnostic and Therapeutic Problems with 20%. Top factors include uncontrolled comorbidities, comorbidities exceeding community resources, change in functional status and side effects or adverse reaction to medications.
Top Contributing Factors
Patient
Palliative care / hospice needs not addressed
Patient non-compliant with discharge instructions
Patient readmitted before PCP or Specialist appointment Follow-up appointment not scheduled before discharge
Patient has socio-economic issues
Number of Patients
The top 12 factors account for 73% of total factors - the top three are uncontrolled comorbidities, comorbidities exceeding community resource, and change in functional status.
continued on page 122
Keep People Healthy at Home: Readmissions | 121 0 200 400 600 800 Uncontrolled Comorbidities
comorbidities exceed community resources Change in functional status Side effects / adverse reaction to medications
directive document in record Drug/Drug
Drug/Disease
Patient's
No advanced
or
interaction
has mental or behavioral health conditions
To help drive improvement in readmissions, the team shared findings with the Advance Care Planning team and implemented aggressive goals of care discussions in both inpatient and outpatient settings (see page 66); reinvigorated the hospitalists’ follow-up appointment process (see page 117); collaborated with Patient Experience to emphasize teach-back training to increase clarity of discharge instructions (see page 82); and provided education about improving the discharge instruction process.
Specific service line-level findings and interventions include:
• Neurosciences – reviews focus on stroke and seizures. Top factors for these populations include no primary care physician post-discharge appointment or not seen prior to readmission; medication side effects; and discharge instructions or goals of care/end of life care not addressed. Interventions include increased focus on patient education related to medications, particularly related to hypotension through an outpatient neuropharmacist; use of Twistle to increase monitoring of patients with epilepsy; and increased support for psychogenic neuro-epileptic events.
• Heart & Vascular – reviews focus on acute myocardial infarction (AMI) readmissions and found that 81% were readmitted for different diagnoses – all patients had multiple comorbidities. Top factors include no post discharge appointment (prior to COVID-19, more than 75% of patients were discharged with an appointment); discharge instructions and affordability of medications. Interventions include assessing current resources for patient navigator role; revitalizing Meds2Beds and nursing education related to Stoplight Tool; and documentation of AMI-specific education.
• CareVio Post- Acute Care – reviews focus on readmissions from skilled nursing facilities (SNF). Top factors include delays in goals of care discussion; medication history –particularly related to hypertensives, anticoagulation and diuretics; communication with HomeHealth; and transferring patients from the emergency department back to a skilled nursing facility. Interventions include CareVio palliative care workflows and collaboration with Accent Hospice; coordinating transition of patients with ChristianaCare Hospitalist Partners; and leveraging Vocera and inpatient case management to move appropriate patients back to SNF without admission.
Virtual COPD Bridge Clinic addresses readmission risk through symptom management, medication/oxygen regimen and needed referrals
ChristianaCare received penalties under the Centers for Medicare & Medicaid Services (CMS) Hospital Readmission Reduction Program for excess chronic obstructive pulmonary disease (COPD) in five of the past six federal fiscal years — most recently for about $117,000 for the period ending June 2021.
122 | ChristianaCare Quality & Safety Report 2023
To mitigate our risk for additional penalties, and to reduce readmissions for this high-risk population, in January 2022 ChristianaCare Pulmonary Associates and the Acute Medicine service line developed a business plan for a COPD Bridge Clinic based on the success of the Heart Failure Bridge Clinic. In addition to reducing readmissions, the clinic sought to enable access to timely follow-up care and improve health outcomes for COPD patients, including:
• Improved respiratory status.
• Improved understanding of disease process and symptoms/symptom management.
• Improved adherence to medication regimen through increased understanding of proper use and rationale for prescriptions.
The outpatient Bridge Clinic opened in October 2022 and is staffed one day per week by ChristianaCare Pulmonary Associates. The goal is to provide four virtual visits for each patient within one week following inpatient discharge. The care process involves reviewing COPD severity and associated symptoms: medication usage, technique and cost, and oxygen and non-invasive ventilation. As needed, exacerbations are treated, pulmonary function tests and new medications are ordered, and referrals are made to smoking cessation, pulmonary rehabilitation or palliative care.
Since October, 27 patients have completed 32 clinic series (five patients had two clinic series due to readmissions while enrolled). Of them, 48% were seen within one week of discharge, and 87% were seen within two weeks. Initial results are promising — of the 32 patient encounters, half were at high risk of readmission. Seven had readmissions for a readmit rate of 21.9%.
Next steps include working with ChristianaCare Hospitalist Partners to increase referrals, and identify action steps to improve medication reconciliation and affordability of medications.
Half of the patients are at high risk of readmission. Seven patients were readmitted, for a rate of 21.9%.
Readmission Risk and Readmission
DESIRED DIRECTION 0% 5% 10% 15% 20% 25% 30% 35% 40% 0 5 10 15 20 25 30 35 Readmission (% ) Number of Patient s Nu mber of Patients % Re admission High Low Total Moderate Keep People Healthy at Home: Readmissions | 123
POPULATION HEALTH
CareVio shift to highly specialized case management helps reduce readmission rates, improve patient engagement for Medicare Advantage members
A shift in program year 2022 from generalized to highly specialized case management led by subject matter experts allowed CareVio to improve patient engagement and activation efforts and reduce readmission rates among patients in the Medicare Advantage line of business.
Between January and December 2022, 15% of patients in one of our Medicare Advantage populations were identified as having case management needs. Of them, 82% were engaged by CareVio, exceeding a target of 80%. Outreach efforts were 46% more successful than the established target, and patient enrollment into longitudinal programing was 8% over target. Contributing to this success were the use of motivational training, along with extended hours of operation and the introduction of a texting platform.
Motivational interviewing skills allow the case manager to work with the patient to create realistic goals based on the patient’s readiness for change.
Care Management Engagement
CareVio’s engagement of beneficiaries with care management needs in one Medicare Advantage plan reached 82% in FY 2023 to date, exceeding the target of 80%.
124 | ChristianaCare Quality & Safety Report 2023
DESIRED DIRECTION 0% 20% 40% 60% 80% 100% J an-22 F eb-22 Ma r22 Apr-2 2 M ay -2 2 J un-22 Ju l-2 2 Aug-22 Sep-22 Oc t22 No v22 De c22 J an-23 F eb-23 Ma r23 Apr-2 3 Percent of outreached member s
CareVio is currently seeing a 9% readmission rate in the transitions of care programming for the Highmark Medicare Advantage population.
COVID-19 continued to impact patient engagement in CareVio programing, as well as ED and inpatient utilization in early 2022. In response to claims data which reflected that COVID-19 was the first or second most common diagnosis for ED and inpatient utilization among all lines of business, CareVio implemented COVID-19 diagnosis and immunization-related questions into assessments to provide better pandemic control and assess/manage the co-morbidity impact. By partnering with virtual health and the Access Center, patients were directed to the right level of care, at the right time, in the right setting to help prevent the spread of COVID-19 and keep people healthy at home.

Keep People Healthy at Home: Population Health | 125
Medicaid ACO focus on whole person care helps primary care and specialty care engagement; reduction in ED visits and inpatient admissions
$1.6M in net savings achieved since 2021 launch
ChristianaCare anticipates $1.1M in net savings across both Medicaid managed care organizations for performance year 2022. The Medicaid ACO has had $1.6M in net savings across both MCOs since its launch in 2021. Medicaid upside/downside risk has yielded $4.6M in net savings across both MCOs since 2019.
*Results through Q3, final settlement pending
The Medicaid ACO has had $1.6M net savings since its launch in 2021. Medicaid upside/ downside risk has yielded $4.6M in net savings across both organizations since 2019.
126 | ChristianaCare Quality & Safety Report 2023
Medicaid ACO Performance
DESIRED DIRECTION -$3,000 -$2,000 -$1,000 $0 $1,000 $2,000 $3,000 $4,000 $5,000 $6,000 2019 2020 2021 2022* Savings ($ thousands ) AmeriHealth Highmark Health Options Net Medicaid ACO
ED utilization shows slight downward trend
Emergency department (ED) utilization rates (average visits/1000) trend slightly down over time, with variations during COVID-19 surges. Average ED visits were down nearly 11% in the 4th quarter of program year 2022 compared the same quarter in PY 2021 to 559.2 from 625.8.
ED visits by Highmark Health Options members were down nearly 11% in fourth quarter of 2022 compared to the fourth quarter in 2021, to 559.2 from 625.8.
Emergency Department Utilization
DESIRED DIRECTION 625.8 475.9 510.2 480.8 559.2 0 100 200 300 400 500 600 700 2021 Q 4 2022 Q 1 2022 Q 2 2022 Q 3 2022 Q 4 (Oct) ED Visits per 1000 member s
Keep People Healthy at Home: Population Health | 127
continued on page 128
Trendline also down for inpatient admissions
Similar to ED visits, inpatient admissions continue to reflect a slight downward trend in utilization rates over time, also with notable spikes during the year. Average visits per 1,000 were down 26.7% to 97.6 in the fourth quarter of PY 2022 from 133.3 the same period the previous program year.
Inpatient Hospital Utilization
Inpatient admissions for Highmark Health Options members decreased 27% in the fourth quarter of 2022 compared to the fourth quarter of 2021, to 97.6 from 133.3.
In addition to case management, key to these improvements is an emphasis on social care, leveraging Community Health Workers to increase Medicaid ACO patient engagement with primary and specialty care services. The Community Health workers help the ACO members set personal health and wellness goals and develop a care plan. Use of an innovative motivational interview technique has resulted in a:
• 7% increase in primary care and specialty care engagement 6 months post-intervention; and a 2% increase at 9 months post-intervention.
• 35% reduction in ED utilization 6 months post intervention; a 28% reduction 9 months post-intervention; and then 69% at 12 months post-intervention.
• 15% reduction in inpatient utilization at 6 months post intervention; 2% at 5 months post intervention and 5% at 12 months post intervention.
The Community Health workers are also using outreach methods to engage newly assigned members and those disengaged from health care. As a result, the successful engagement rate among the ACO’s most challenging members is now nearly 33%.
128 | ChristianaCare Quality & Safety Report 2023
DESIRED DIRECTION
133.3 92 76.9 71.9 97.6 0 20 40 60 80 100 120 140 2021 Q 4 2022 Q 1 2022 Q 2 2022 Q 3 2022 Q 4 (Oct) IP Admissions per 1000 member s
Medicare ACO reduces health care spending by $7 million, exceeds quality score standard
Shared savings achieved for second consecutive year
The eBrightHealth Accountable Care Organization (ACO) reduced health care spending by $7 million in performance year 2021* and, with new reporting requirements, earned a quality score of 82.1% according to the most recent performance data released by the U.S. Centers for Medicare & Medicaid Services.
Reduced Medicare Spending
Since 2016, eBrightHealth ACO has reduced Medicare spending by $44.5 million.
With these favorable results, the ACO has earned approximately $3.5 million in shared savings. This is the second consecutive year shared savings have been achieved. This marks the sixth consecutive year that eBrightHealth ACO has reduced health care costs for its attributed beneficiaries, bringing the cumulative amount saved during the ACO’s participation in the program to more than $44.5 million.
For the 2021 performance year, CMS made significant changes to the quality score measure and reporting requirements. The ACO’s quality score of 82.1% exceeded the program year 2021 quality performance standard that allowed for participation in shared savings.
DESIRED DIRECTION
$0 $5 $10 $15 $20 $25 2016 2017 2018 2019 2020 2021 Reduced Spend ($ millions) Keep People Healthy at Home: Population Health | 129
Newly launched clinically integrated network partners hospitals, clinicians to optimize health outcomes, reduce overall cost of care

In January, ChristianaCare launched the ChristianaCare Clinical Alliance, a formal partnership of clinicians across the continuum who work collaboratively to deliver well-coordinated, evidence-based care to improve quality, efficiency and health outcomes.
As payment models shift from fee-for-service to value-based models that reward excellent clinical outcomes, clinically integrated networks (CINs) provide members with tools, analytic insights, efficiencies and economies of scale to thrive in delivering population health.
Participants in the ChristianaCare Clinical Alliance will have access to new value-based care arrangements with payors that provide financial rewards for improving quality and reducing unnecessary utilization; access to innovative CareVio® care management programs, and expert support for quality, reporting and practice optimization.
ChristianaCare’s CIN touches nearly every component of the care continuum, including primary care, specialty care, behavioral health, hospitals, post-acute care and community organizations which help address the social determinants of health.
130 | ChristianaCare Quality & Safety Report 2023
Community Health Worker programs bridge gap between health and social needs to improve outcomes
Initially launched in the Wilmington Primary Care practices in 2019, Community Health Worker programs have expanded to include additional primary care practices, as well as programs in Women’s Health, Behavioral Health, the emergency department, and two targeted programs – Delaware Food Farmacy (see page 99) and Empowering Victims of Lived Violence. Community Health Workers are also utilized in school-based health centers, the social care connection center and the acute care program. Though the programs vary in population and focus, a consistent factor is identifying and addressing patients’ social needs to improve health outcomes.
Patients’ social care needs are identified through a social determinants of health screening. This 11-item tool seeks to identify patient needs across nine domains, among them: financial insecurity, health literacy, food insecurity, interpersonal safety and utility insecurity. Across the various CHW programs, 492 patients were screened in 2022 and, of those, 79% or 388, were identified as having social care needs. The top needs identified across the programs include financial insecurity, food insecurity and issues with transportation.
When a need is identified, Community Health Workers make referrals to community organizations through the social care platform Unite DE (see page 104). Referrals can be made directly through the patient’s medical chart or via the web application. Both referral mechanisms feature a closed loop process in which updates are sent to the Community Health Worker for real-time monitoring to address the patient’s needs quickly.
As experts in their communities, Community Health Workers are uniquely able to understand the impact of social care needs on health outcomes and overall well-being.
Community Health Workers – Screenings for Social Drivers of Health
492 patients were screened for social drivers of health by Community Health Workers; 388 (79%) were identified as having social care needs.
DESIRED DIRECTION 388 492 0 100 200 300 400 500 Number of Patient s Soci al Care N eeds No Soc ial Ca re N eeds Keep People Healthy at Home: Population Health | 131
Expanded statewide outreach increases flu vaccination rate for Delawareans with HIV
For the second consecutive season, the William J. Holloway Community Program sustained near- or better-than-goal flu vaccination rates for Delawareans with HIV. Vaccines are critical for those with HIV, as the virus damages cells in the body’s immune system, making it harder to fight germs.
Vaccination rates in New Castle County have topped 85% since the 2020-2021 flu season, surpassing a goal of 80%. In the 2021-2022 season, outreach expanded to include Kent and Sussex counties, where rates nearly reached 90% and 79%, respectively. By broadening the program statewide, Holloway was able to vaccinate an additional 872 patients in the 20212022 season.
The Holloway Program cares for 70% of adults with HIV in Delaware. A bundle of interventions included flexible scheduling at the six Holloway program locations, real-time data capture and sharing among clinicians, portal enrollment, Twistle messaging, culturally competent messaging and targeted handouts.
Influenza Vaccination Rates by County
Using bundle interventions, vaccination rates remained above 85% for New Castle county patients with HIV; the program successfully expanded to Kent and Sussex counties with rates of almost 90% and 79%, respectively. An additional 872 patients received the flu vaccine in the 2021-22 flu season.
132 | ChristianaCare Quality & Safety Report 2023
DESIRED DIRECTION 85.5% 85.5% 84.9% 85.7% 89.7% 79.1% 75% 80% 85% 90% 95% Ov erall Vaccinat ion Ra te New Castl e Kent S usse x Percent of Patient s 2020-21 2021-2022 N/A N/A
Enable Every Caregiver to Thrive
5-YEAR GOALS
• Be the best place to work in health care.
• Create a work environment that allows each caregiver to flourish.
• Create a diverse workforce at all levels and an inclusive workplace that fosters creativity, innovation, and connection to our communities.
IMPERATIVES
• Caregiver Healing: Reenergize our culture, support caregivers in their healing, and reconnect them to their joy and meaning in their work.
• Top Talent: Increase the velocity in which we identify and move candidates into roles that match their capabilities and aspirations.
• Career Enablement: Place career planning and learning into the hands of our caregivers with guided choices and integrated learning opportunities.
• Inclusive Culture: Create a culture of leadership accountability in building and leveraging a diverse and inclusive workforce and workplace by establishing and measuring against talent and inclusion metrics.
• Future of Work: Create and implement new ways of working that leverage existing and new technologies, automation, robotics, and virtual platforms to ensure caregivers practice in the most progressive, frictionless environment.
• Leadership Experience: Provide meaningful, timely, and sustainable support for leaders that enables them to engage caregivers and unlock significant performance across the organization.
Enable Every Caregiver to Thrive | 133
ChristianaCare’s Center for WorkLife Wellbeing collaborates with caregivers and leaders across the system in a multifaceted approach, allowing us to remain responsive to the needs of our caregivers, and create and maintain a culture of wellbeing. We foster efficiency at work and support personal wellbeing by partnering, advocating and providing support services to all caregivers through a well-established peer support program and a robust wellbeing ambassador network.
Individual and organizational initiatives to advocate and support caregivers foster worklife meaning, efficiency connection and joy include:
• Care for the Caregiver peer support program integrated with R2L event submission.
• Debrief checklist and post-event debriefs.
• Psychological first aid training.
• Psychological safety toolkit.
• OASIS relaxation rooms.
• Rejuvenation stations.
• VITAL WorkLife Employee Assistance Program.
• Vocera on-demand peer support.
• Wellbeing ambassador network.
134 | ChristianaCare Quality & Safety Report 2023
Peer support encounters climb steadily, reflecting increasing trust in program
Care for the Caregiver, a network of more than 50 trained peer supporters, ensures that everyone who needs one has access to a sympathetic listener. Through December 2022, Care for the Caregiver has provided peer support in almost 2,500 encounters.
Peer Support Encounters
Through December 2022, Care for the Caregiver has provided peer support in almost 2500 encounters.
continued on page 136
“Supporting a healthy workplace matters for everyone. When we care for ourselves, we are better able to care for others, resulting in decreased medical errors, increased patient experience scores and improved efficiencies.”
Heather Farley, M .D Chief Wellness Officer
DESIRED DIRECTION 0 100 200 300 400 500 600 2015 2016 2017 2018 2019 2020 2021 2022 Number of Encounter s
Enable Every Caregiver to Thrive | 135
Utilization of ChristianaCare’s peer support encounters has increased steadily while other organizations have seen a decline in requests for their peer support programs. Encounters peaked in 2020-2021 but are now returning to pre-pandemic levels, indicating that the program is adaptive and responsive to caregiver needs and testament to increasing trust in the program.
Peer Support Encounters Trend
Encounters increased 144% from April to June 2020 in the first wave of the pandemic, and again in the second wave.
Not surprisingly, nurses and physicians are highest utilizers of Care for the Caregiver services. Nurses account for nearly half of all peer support encounters. The highest use is among those who work on inpatient floors or in the emergency department.
A culture of silence pervasive in medicine has traditionally kept caregivers from acknowledging that they are struggling with job-related pressures, as evidenced by the majority of referrals coming from supervisors or colleagues in the program’s early years. However, the culture has started to change and self-referrals are now the second highest referral source. This uptick in self-referrals is considered a marker of success.
136 | ChristianaCare Quality & Safety Report 2023
DESIRED DIRECTION
0 10 20 30 40 50 60 70 80 90 J an-19 Ma r19 M ay -1 9 Ju l-1 9 Sep-19 No v19 J an-20 Ma r20 M ay -2 0 Ju l-2 0 Sep-20 No v20 J an-21 Ma r21 M ay -2 1 Ju l-2 1 Sep-21 No v21 J an-22 Ma r22 M ay -2 2 Ju l-2 2 Sep-22 No v22 Number of Encounter s Start of COVID-19
Reason for Referral
Patient code/death accounts for 36 of the referral reasons; workplace violence accounts for 17% of referrals.
Protecting confidentiality in the referral process and during peer support encounters is an important distinction and key to the success of our program. We understand that some peer support programs only allow self-referrals, but at ChristianaCare, colleagues and other key sources can make referrals in support of fellow caregivers who they believe would benefit from peer support. In fact, Care for the Caregiver activation is now hard-wired into our debrief checklists and workplace violence reporting system.
Confidentiality is strictly protected for both the caregiver receiving support and the referral source. Once a team or caregiver is receiving support, no information—even whether the caregiver accepted or declined support—is shared. Nor is the identity of a referral source identified, even to a manager.
Enable Every Caregiver to Thrive | 137 Patient code/death 36% Workplace Violence 17% Other 16% Patient harm/trauma 6% Staff Death 4% Staff Concern (anxiety/ depression) 15% COVID-19 related 6%
Nearly half of all leaders now trained in psychological first aid
Psychological first aid is an evidence-informed, self-care, leadership, and peer support model developed for those in high-risk occupations such as military, fire and rescue, and health care. The aim is to provide a safe space in the moment for caregivers who are experiencing stress, listen actively and compassionately, and connect them with resources.
ChristianaCare included psychological first aid training in the fiscal year 2023 annual operating plan, establishing a stretch goal to provide training to half of the 1,100 leaders. Through April, more than 540 leaders had received training — reaching 49% and approaching the 50% stretch goal.
Psychological First Aid Training
Stretch: 50%
Target: 30%
Threshold: 25%
Through April 2023, 541 leaders (49%) had received PFA training, approaching the 50% target
5 components of Psychological First Aid:
• Create a sense of safety.
• Create calm.
• Create self and collective efficacy.
• Create connection.
• Create hope.
138 | ChristianaCare Quality & Safety Report 2023
DESIRED DIRECTION
0% 10% 20% 30% 40% 50% 60% Sep-22 Oc t-22 No v-22 De c-22 J an-23 F eb-23 Ma r-23 Apr-23 Percent of Leader s
TAKING CARE OF OUR OWN
Rejuvenation stations help caregivers find meaning, joy and connection in work

Pop-up rejuvenation stations give caregivers a chance to de-stress and decompress through art and reflective therapy, mindfulness meditation, chair massages, pet therapy and a treat of free coffee and chocolate. They are a simple, yet effective way to thank our caregivers for their unwavering dedication to serving our neighbors with Excellence and Love. More than 500 caregivers participated in eight rejuvenation stations across five campuses this year.

Enable Every Caregiver to Thrive | 139
Caregiver Health establishes formalized process to manage communicable disease exposure compliance

More effective communication yields 100% compliance in identifying those exposed, implementing standards of care
Caregiver Health Services is building upon lessons learned in risk assessment and contact tracing from the COVID-19 pandemic to formalize a process to monitor and track caregiver exposure, assess individual risks, and increase compliance rates with recommended standards of care for a number of other communicable diseases, as well. To date in fiscal year 2023, 280 caregivers had been exposed to patients or visitors determined to have—or to have been exposed to— tuberculosis, varicella, monkey pox or scabies. None of the caregiver exposures has converted to infection, and, thanks to more effective communication with caregivers and their leaders, compliance with the formalized process has improved by more than 60%.
140 | ChristianaCare Quality & Safety Report 2023
Communicable Disease Exposure Compliance
Compliance with the communicable disease exposure process improved from 40-60% in Jul-Dec 2022 to 100% in the first quarter of 2023.
Key to the success of this formalized process was a change in communication strategy to more formally communicate with leaders in the case of a known exposure. Unit and department leaders are now engaged as soon as Infection Prevention learns of a possible exposure to an infected patient or visitor to help determine which caregivers had direct contact. Their completion of a new department head form with the names of caregivers who may have been exposed to the identified source on determined dates starts the formalized risk assessment process. This allows Caregiver Health to promptly assess each caregiver’s individual level of potential exposure, monitor for the development of symptoms, and provide appropriate postexposure prophylaxis or work restrictions and recommendations for personal protective equipment to prevent future exposures. Leader response has been immediate and thorough, with compliance rates more than doubled in the three months between January and March, up to 60% from 40% in the first six months of fiscal year 2023.
In addition to the email notification and online response form, the formalized process also leverages technology through use of a dashboard to log calls into Employee Health, track responses from leaders and monitor caregiver compliance to standards of care.
ChristianaCare is now sharing lessons learned in successfully implementing a formalized plan to engage leaders in tracking possible caregiver exposure with the Delaware Division of Public Health.
DESIRED DIRECTION (COMPLIANCE)
Enable Every Caregiver to Thrive | 141 0% 20% 40% 60% 80% 100% 0 50 100 150 200 250 Jul-Dec 2022 Jan-Mar 2023 Process Complianc e Caregivers Exposed Tuberculosis Varicella Monkey Pox Scabies All others Compliance 213 67
OPTIMIZING EFFICIENCY
Greater familiarity with EHR helps residents spend less time navigating chart, more time caring for patients
An iLead program to help second- and third-year residents gain greater familiarity with key features and helpful tips for the use of the electronic health record (EHR) is optimizing efficiency, allowing residents to spend less time in the chart, per patient, and see more patients each month.
After the optimization sessions, second-year residents spent four minutes less per patients while seeing 75
142 | ChristianaCare Quality & Safety Report 2023
2nd Year Emergency Medicine/Family Medicine Resident Trend
0 20 40 60 80 100 120 0 50 100 150 200 250 300 350 400 May-21 Jun-21 Jul-21 Aug-21 Sep-21 Oct-21 Nov-21 Dec-21 Jan-22 Time per Patient (minutes ) Number of Patient s Pati ents Seen Ti me per Pati ent Optimization Sessions
additional patients.
3rd Year EM/FM Resident Trend
After the optimization sessions, third-year residents maintained average time spent in the EMR while seeing an average of over 121 additional patients monthly.
Data shows that the 1:1 Cerner Advance optimization sessions helped second-year Family Medicine and Emergency Medicine/Family Medicine residents spend four minutes less in the chart per patient and see an additional 75 patients, while third-year residents decreased time in chart by six minutes and saw 145 additional patients per month. This surpassed the initial efficiency goal to reduce time spent in the chart by three minutes.
The optimization adds specialty-specific Resident Provider PowerChart checklist-guided sessions to highlight relevant, important topics and helpful features as residents start evaluating more outpatient visits per month mid-way through their second year of training. Prior to the program, second-year residents spent an average of 43 minutes in the EHR per patient, and averaged 205 patient visits per month. Third year residents spent an average of 30 minutes in the EHR, averaging 425 patients per month.
Plans are to expand the program’s reach to include first-year residents in multiple specialty programs starting with the June 2023 resident class based on participant feedback indicating that they felt residents would benefit most from optimization within the first six months of residency training.
Enable Every Caregiver to Thrive | 143 0 10 20 30 40 50 60 70 80 0 100 200 300 400 500 600 700 800 May-21 Jun-21 Jul-21 Aug-21 Sep-21 Oct-21 Nov-21 Dec-21 Jan-22 Time per Patient (minutes)
of Patient s
Number
Pati ents Seen Ti me per Pat ient
Optimization Sessions
Certified nursing assistant recruitment and residency program addresses post-pandemic shortages, fills need for homemaker care
The innovative recruitment and training strategy No Experience Needed! helped ChristianaCare HomeHealth exceed its goal to hire six new certified nursing assistants (CNA), addressing staffing needs during post-pandemic nursing assistant shortages, and increasing homemaker billable hours by 85%.
Homemaker Billable Hours
After trending down in the pre-program period, homemaker billable hours increased by 83% after the six new CNAs completed the program and began providing care in the community.
No Experience Needed! offered tuition and salary during training for CNA candidates through funding provided by HomeHealth. The coordination of the program was successful with our system partners—ChristianaCare departments of Recruitment and Professional Development—and our community partnership with Delaware Skills Center. Candidates completed a six-week paid CNA training program, followed by a two-to-three-week paid orientation to support the transition of student to novice CNA in the home care setting upon hire in the caregiver role.
Next steps include partnership with adult education and polytechnical schools in Kent and Sussex counties, Delaware, where the need for CNAs is particularly strong.
144 | ChristianaCare Quality & Safety Report 2023
DESIRED DIRECTION
0 1000 2000 3000 4000 5000 6000 7000 8000 Ju l-21 Aug-21 Sep-21 Oc t-21 Number of Hour s Pre Post Program Implemented Apr-22 May-22 Jun-22 Jul-22
Accelerate Growth & Transformation
5-YEAR GOALS
• Double the number of people engaged with our system.
• Diversify revenue earned outside of direct patient care.
• Sustain an operating margin to invest in our mission and vision.
• Drive towards a net-neutral carbon footprint to promote environmental sustainability.
IMPERATIVES
• Become a regional leader by expanding and developing our exceptional clinical programs.
• Grow ambulatory, community, and virtual offerings.
• Pursue care delivery partnerships, prioritizing contiguous geographies.
• Develop and monetize innovative solutions and services through technology advancements, strategic investments, and partnerships.
• Launch new insurance products and payment models.
• Implement environmental sustainability initiatives with the largest impact.
Accelerate Growth & Transformation | 145
Caregiver-driven Making Tomorrow Happen improvements reduce risks, improve satisfaction, capture new sources of revenue and eliminate waste
Nearly $13 million in waste eliminated since spring 2021
Making Tomorrow Happen supports caregivers in identifying opportunities to drive improvements within their work environment. Improvements may reduce costs, improve efficiencies or increase satisfaction. Cumulatively, they advance our ability to enable every caregiver to thrive, strengthen the core, radically simplify access and accelerate growth and transformation. Since the spring of 2021, our ability to use problem-solving methodology to see, size and solve challenges has resulted in improved caregiver experience scores; saved 1,215 hours of caregiver time each year and increased model area productivity as much as 43% through workflow efficiencies, reduced safety risks, and the elimination of nearly $13 million worth of waste.

Making Tomorrow Happen 3-Step Problem Solving Process in Action
The problem: Bags of soiled linens were backing up on linen chutes, preventing the chute doors from closing all the way and posing a fire safety hazard.
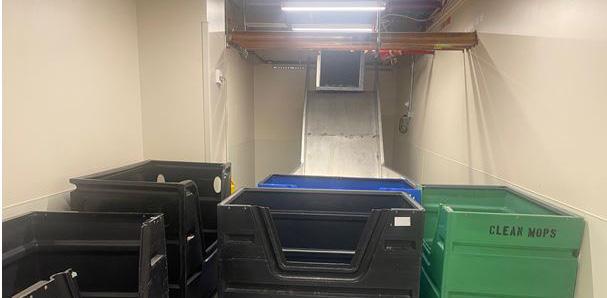
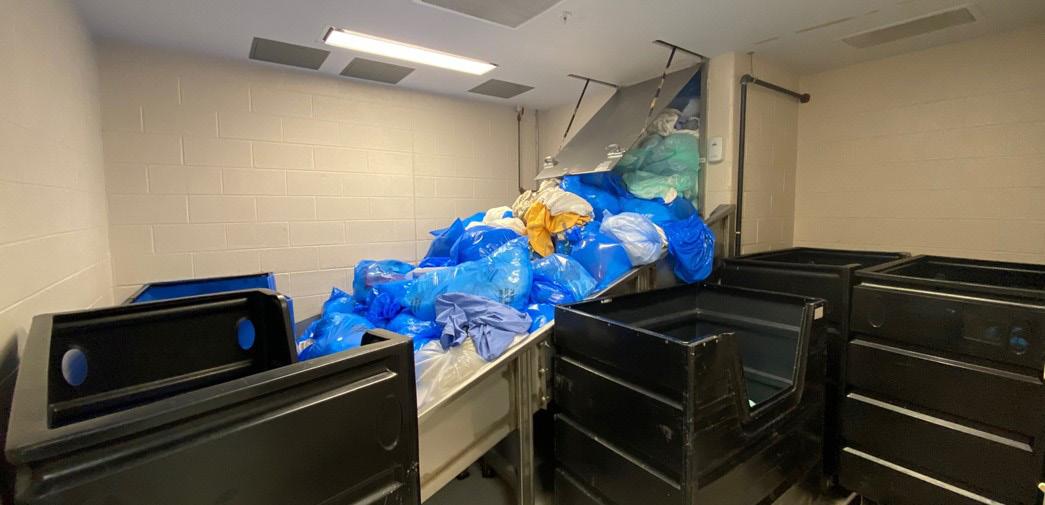
146 | ChristianaCare Quality & Safety Report 2023
3-STEP METHOD:
1. Examine the problem
Excess carts stored on units frequently block linen chutes, which causes soiled linens to back up. Not only do the carts block access and increase the time needed to clear the blockages, they clutter hallways, which makes it harder to clear the area of excess carts.
2. Consider solutions
The number four seems to be key when it comes to managing cart flow. First, any more than four carts in a chute location causes an obstruction. Second, while there is little question that excess carts should not be stored in workflow areas, the trams that pull the carts are limited to towing a maximum of four at a time in order to safely navigate corners. Interestingly, though, fewer than half of observed trams were carrying a full load of four carts.
3. Execute and evaluate
• Time studies were conducted and route combinations proposed to maximize the number of chutes serviced per hour.
• Daily walkthroughs are now performed to determine which chutes are piling up with linen bags and prioritize which chutes require servicing first to prevent backup of bags and carts (as opposed to servicing the work areas in geographic order).
• Once enough linen bags are removed to unblock a chute, service moves to the next prioritized area to keep as many chutes as possible flowing freely.
• Excess carts are now moved to a designated holding area and not stored near linen chutes.
• Whenever possible, trams heading in any direction pull the maximum four carts.
Learn, share and sustain
In the month of April, 95% of observed linen chutes were unobstructed by excess carts, and 100% of trams observed were pulling the maximum number of carts. Collection tables below linen chutes have been removed and replaced by collection carts, allowing for a faster, less labor-intensive exchange.
continued on page 148 Accelerate Growth & Transformation | 147
The problem: The NRC patient experience platform identified growing dissatisfaction with wait times in phone trees or calls not being answered when patients attempted to schedule imaging services through the Access Center.
1. Examine the problem
The Access Center handles more than 13,000 calls per month. Known issues include high caregiver turnover and inadequate staffing; a steep learning curve (8-week training period) for training new caregivers to schedule appointments on their own; insurance requirements for advance scheduling and preauthorizations, which may require outbound phone calls to reschedule appointments due to missing information; and lack of automation for helping patients complete pre-imaging questionaires. There is a need to radically simplify access.
2. Consider solutions
• Improve call center efficiency to reduce patient wait times and increase satisfaction.
• Streamline training for new hires.
• Provide adequate staffing.
3. Execute and evaluate
• The STAT order process is now simplified with an automated one source document for all services that guides the caregiver through next steps for efficient scheduling.
• New hires now receive virtual interactive training and formalized classroom education to shorten onboarding time and create a more flexible scheduling workforce.
• The number of imaging schedulers is now optimized based on volume of calls and average handling time.
Learn, share and sustain
Patients report an 8% improvement in ease of getting an appointment, to 54% in the first quarter of fiscal year 2023 compared to 50% in the second quarter. During those same time periods, the abandoned call rate decreased by 41% (to 33% from 56% of calls); the average number of minutes until a caller spoke to a scheduler decreased by 48% (to 8.7 minutes from 16. 7 minutes); the time it takes for an operator to schedule an appointment decreased by 19% (to 7.0 minutes from 8.6 minutes); and the number of calls answered within 30 seconds improved by 512% to 11% from 1.7%. Call volume also decreased by 23% to 1,911 incoming calls from 2,593 calls, which may be attributed to fewer people hanging up in frustration and having to call back to schedule appointments.
148 | ChristianaCare Quality & Safety Report 2023
Access Center: Performance Metrics
Callers’ perception of the ease to get an appointment increased to 54% from 50%. The percentage of calls answered within 30 seconds increased to 11% from less than 2% — an estimated additional 166 calls.
Access Center: Efficiency Metrics
Improvement in key metrics include a 41% reduction in the abandonment rate, to 33% from 56%; a 48% decrease in time to answer a call, from over 16 minutes to less than nine; and a 19% decrease in time to schedule, to seven minutes from 8.6.
DESIRED DIRECTION DESIRED DIRECTION 50% 1.7% 54% 11.0% 0% 10% 20% 30% 40% 50% 60% Easy to get appointm ent Calls Answered ≤ 30 seconds Percentage Ju l-Sep 2022 No v 2022-Jan 2023 56 16.7 8.6 33 8.7 7.0 0 10 20 30 40 50 60 Abandonme nt Rat e (%) Speed o f Answer (mi n) H andle Ti me ( min) Metric value Ju l-Sep 2022 No v 2022-Jan 2023 Accelerate Growth & Transformation | 149
Radically Simplify Access
5-YEAR GOALS
• Become the regional health system leader in consumer access.
• Reduce out-of-pocket health care expenses that create barriers to access for those we serve.
IMPERATIVES
• Reimagine the way people access ChristianaCare with a focus on:
• Building lasting relationships.
• Accelerating digital solutions to support access.
• Executing omni-channel services to address consumer needs.
• Removing administrative burden and barriers for both patients and caregivers.
• Delivering highly coordinated and integrated team-based care across settings .
• Optimize care models to reduce out-of-pocket expenses for patients.
150 | ChristianaCare Quality & Safety Report 2023
GOODBYE CLIPBOARDS, HELLO SIMPLIFIED PRE-VISIT UPDATES
Tablet-based screening tool alerts caregivers to patient needs in real-time
Tonic, an innovative and simplified screening platform that allows patients to answer standard intake questions, such as changes in health status and medications, before their appointment via SMS text/email or by tablet in the waiting room, alerts caregivers in real-time to patient needs to be addressed during the appointment.
Tonic captures patient responses and calculates appropriate scores and integrates findings in PowerChart. Real-time alerts and automated referrals for decision support are created before the patient sees the caregiver. The simplified process has already shown to increase completion rates for important screening, improve caregiver efficiency during the intake process by eliminating the need for manual entry in the electronic health record, and, most importantly, allow providers to take immediate action on identified needs. Having patients enter and update information engages them with their own electronic health record and improves accuracy of the information.
continued on page 152
Radically Simplify Access | 151
Tonic went live in September 2022 across all ambulatory practices and has now expanded to Women’s Health and specialty practices and to Jennersville, Cecil and Kent and Sussex counties. In addition, Primary Care at Smyrna is piloting social driver of health screening to improve capture of patient needs.
In the first month, Tonic was used in place of paper-on-clipboard forms in 74% of eligible patient visits, and, since implementation in September, has been used for intake in an average of 71% of eligible patient visits, far exceeding the 50% annual operating plan target.
• AOP Goal: Tonic decreases administrative burden for patients and caregivers by implementing an automated paperless intake process.
Paperless Intake
The percentage of eligible ambulatory visits that completed the intake process using the digital application Tonic average 71% for the year, far exceeding the 50% target.
152 | ChristianaCare Quality & Safety Report 2023
DESIRED DIRECTION 0. 0% 20.0 % 40.0 % 60.0 % 80.0 % S ep -2 2 Oc t22 N ov -2 2 D ec -2 2 Ja n23 Fe b23 Ma r23 Ap r23 Percent of Eligible Visits Utiliz ation (%) Ta rget
Tonic Advantages
• Real-Time Alerts: Tonic automatically alerts the appropriate caregiver about high-risk scores, specific patient responses, and other factors requiring immediate attention to ensure that screening results are addressed as quickly as possible.
• Easy EHR Integration: Patient screeners and risk assessments are automatically integrated in the EHR.
• Automated Scoring & Trending: Captured data can be tracked over time, allowing providers to quickly and easily identify trends in a patient’s health. Tonic’s proprietary scoring engine runs scoring algorithms in real time, allowing the care team to act on the data collected as soon as the survey is submitted.
• Intelligent Screening: This intelligent screening tool automatically branches questions based on patient response, demographic information, or score calculation, making the screening experience seamless.
Real-time dashboard radically improves consumers’ experience of access to ambulatory care
The ability to monitor key performance indicators down to the provider level across all service lines supports ongoing improvement in patient access. New standardized templates with additional slots for ambulatory practices allow the contact center to more easily schedule ambulatory appointments, which, in turn, makes it easier for patients access ambulatory care. Work is also underway to train Medical Group leaders on best-practice strategies to reduce no shows and fill slots opened from late cancellations.
Radically Simplify Access | 153
DECREASING THE CANCELLATION/NO-SHOW RATE
Organized methodology helps patients access care needed to prevent wound complications
A steadily declining trend in the number of patient visits to the Riverside Wound Care Center raised concerns that patients were bypassing needed care, putting them at risk for infection or even amputation from untreated wounds, including infection and potentially even amputation.
Using ExCEL improvement methodology, an interdisciplinary team including Perioperative Services, Organizational Excellence and the Access Center partnered with registered nurses, medical assistant and the Wound Care Center manager to implement focused improvements to increase patient visits and decrease the cancellation/no-show rate. The average number of monthly patient visits increased by 35% to 423 patient visits per month from 314 patient visits per month. The average cancellation/no-show rate decreased by 15% to 11% per month from 13% per month prior to implementation. Key were clinical caregiver reviews of all referrals at the time of scheduling, as well as electronic changes to capture self-referrals, and improved marketing of wound care services to system and community providers.
The team is now planning to expand the methodology to radically simplify access to patients at the Cecil County Wound Care Center, as well.
Access to Wound Center
Average monthly visits increased 35% to 423 from 314, while the cancellation/no show rate decreased 15% to 11% from 13%.
154 | ChristianaCare Quality & Safety Report 2023
DESIRED DIRECTION FOR VISITS DESIRED DIRECTION FOR CANCELLATION 314 423 13% 11% 0% 5% 10% 15% 0 50 100 150 200 250 300 350 400 450 Baseline Post Cancellation/No Show Rat e Mean visits per mont h Patient Vis its Canc ella tion/ No Sho w Rate
Fewer scheduling errors lead to improved patient experience on Cecil campus
Errors made during the scheduling process—often the first point of contact for patients with a care provider—impact patient experience by causing delays in care and/or treatment. They also impact caregiver experience as they lessen productivity by causing the need to repeat work.
Recognizing an opportunity at Union Hospital to improve patient experience through greater scheduling accuracy, an interdisciplinary team including project leads from the Patient Access Center and Organizational Excellence implemented a formal training curriculum, complete with training materials, replacing the side-by-side training approach for newly hired schedulers. The team also instituted refresher training for established schedulers, offered quality feedback to all team members and created and maintained a coaching log.
Together, these steps contributed to a 45% decrease in errors made per month while scheduling patients for care on the Cecil County campus, with errors reduced to 32.7 per month in October 2022 from the baseline of 59.7 errors per month in January 2022.
Scheduling Error Volume
Radically Simplify Access | 155
The number of scheduling errors per month decreased 45% to a mean of 32.7 from 59.7. DESIRED DIRECTION 0 10 20 30 40 50 60 70 80 J an-22 F eb-22 Ma r-22 Ju l-22 Aug-22 Sep-22 Oc t-22 Error Count Apr-22 May-22 Jun-22
New pediatric center offers inpatient care, addresses growing community need for pediatric emergency care
ChristianaCare’s new 14-bed emergent Pediatric Care Center on the Newark campus is improving care access, quality, safety and pediatric care experiences for Delaware families. Overall pediatric patient volume in the emergency departments has increased 69% with the center’s opening in the fall of 2022, to an average of 1,512 per month from 895. The center now cares for 38% of all emergent pediatric patients within the health system.

156 | ChristianaCare Quality & Safety Report 2023
Emergency Department Pediatric Volume
Pediatric patient volume in the EDs increased 69% after the Pediatric Center opened, to an average of 1,512 per month from 895. The Center now cares for 38% of all emergent pediatric patients.
The center is staffed 24/7 by pediatric physicians, including pediatric emergency physicians. The 8.400 square-foot facility features seven dedicated beds for emergency care, and seven beds that can be utilized for emergency observation or inpatient care. Locating these spaces next to each other creates operational efficiencies, for the same staff to provide 24hour coverage for both emergency and inpatient care. The team also includes pediatric and emergency medicine nurses, as well as a pediatric behavioral health social worker, respiratory therapists, and ChristianaCare’s first dedicated pediatric clinical pharmacist.
Families come as walk ins, referrals and direct admissions. More than half of the children seen are under the age of 4. More than 42% participate in Medicaid or a Medicaid health maintenance organization.
continued on page 158
Radically Simplify Access | 157
DESIRED DIRECTION
0 200 400 600 800 1000 1200 1400 1600 1800 2000 Jul-22 Aug-22 Sep-22 Oct-22 Nov-22 Dec-22 Jan-23 Feb-23 Mar-23 Apr-23 Number of Patient s Pediatric Center Newark Middletow n W
ilmington
Patient Volume by Age Group
975 patients are less than 1 year (23%); almost 1400 are aged 1 to 3 years (33%).
Payor Mix
Over 42% of patients are Medicaid HMO/Medicaid; 33% are covered by Blue Cross.
158 | ChristianaCare Quality & Safety Report 2023
Medicaid HMO, 40.5% Blue Cross, 32.6% HMO, 16.3% Self Pay, 3.1% Medicaid, 2.2% Other/ Unk, 5.4% 0% 20% 40% 60% 80% 100% Percent of Patient s 0% 5% 10% 15% 20% 25% 30% 35% 0 200 400 600 800 1000 1200 1400 1600 % of Patient s Number of Patient s Age Group N umber of Patient s Percent of Total 0 1-3 4-6 7-9 10-12 13-15 16-17
The top three visit reasons, which account for 56% of all visits, include respiratory, fever and gastrointestinal ailments. The Pediatric Care Center also provides expert care to children and adolescents with behavioral health emergency needs, providing appropriate referral sources for follow-up care.
Pediatric Center: Visit Reason
Behavioral health, 2%
Earache, 3%
Rash, 3%
Pain, joint/soft tissue, 4%
Injury, head, 4%
Gastro-intenstinal complaint, 11%
Other, 25%
Respiratory, 26%
Fever, 19%
The top three diagnoses—Fever, Respiratory and Gastrointestinal complaint—account for 56% of all visits.
The Pediatric Care Center is on track to surpass its goal to care for an estimated 6,300 patients the first year, with volume projected to grow 5% each year.
Radically Simplify Access | 159

“ Care was phenomenal. I am so grateful for access to this new facility and the wonderful providers.”
Patient experience comment
Radically Simplify Access | 161
The ChristianaCare Way Awards
54 PERFORMANCE IMPROVEMENT TEAMS
23 AWARDS PRESENTED
24 VOLUNTEERS PROVIDED EDUCATION, REVIEWED DRAFTS AND WORKED WITH PROJECT TEAMS
59 JUDGES FROM ACROSS THE HEALTH SYSTEM REVIEWED & SCORED SUBMISSIONS
Milestone ChristianaCare Way award ceremony celebrates 20 years of caregiver-led performance improvement
This year marked the 20th anniversary of the ChristianaCare Way Awards ceremony, begun in 2003 as Performance Improvement Awards – the brainchild of now-retired Vice President Patient Safety and Accreditation Michele Campbell, MSM, RN, CPHQ, FABC. The program morphed into the Focus on Excellence awards in 2007, and again into the ChristianaCare Way Awards in 2016 – always aligning with ChristianaCare’s strategic vision. The ceremony is held each year during National Patient Safety Week in celebration of our caregivers’ collaborative and innovative work to design and advance data-driven, evidence-based programs that best demonstrate excellence in performance improvement.
A President’s Award is presented each year to the project with the highest score, based on standardized judging by system leaders.
162 | ChristianaCare Quality & Safety Report 2023
2022 President’s Award
Leveraging Cerner Advance to Maximize Resident Efficiency
Residency program leadership and the iLEAD IT clinical applications team collaborated to offer 1:1 optimization sessions to optimize residents’ use of the electronic health record and increase efficiencies. Specialty-specific resident provider PowerChart checklists guided sessions to ensure important topics, and helpful features were highlighted. Second-year residents spent four minutes less in the chart, and saw an additional 75 patients. Third-year residents decreased time in chart by six minutes, and are seeing 145 additional patients per month.
Residency program leaders and members of the iLEAD IT clinical applications team took top honors in the 2022 ChristianaCare Way Awards for their collaborative efforts to optimize residents’ use of the electronic health record and increase efficiencies.
The ChristianaCare Way Awards 2022 | 163
People’s Choice Award A Step towards Health Equity: Eliminating Race from the Estimate of Kidney Function
The commonly used equations to estimate the glomerular filtration rate (GFR) measure of kidney function include race as a coefficient, leading to overestimation of the GFR for Black patients compared to non-Black patients, and potential health care disparities.
This multi-disciplinary team implemented a GFR equation excluding race in April 2022, and evaluated the impact on improving equity in the detection of low kidney function in Black patients. The revised equation led to a statistically significant increase in the percentage of Black patients identified as having low kidney function and reduced the difference compared to non-Black patients thus improving health equity.
Zero Hero Award – Daniel Zirolli, MSN, RN, CCRN, Hospital Care at Home Incorrect medications delivered to a patient’s home
Caregiver reporting of an unsafe or near miss incident supports organizational awareness and learning from system issues so that action can be taken to prevent future harm from reaching patients. As a result of Daniel Zirolli’s good catch, couriers are now instructed to call the Hospital Care at Home commence center with questions, and Pharmacy is now notified by the command center when a discharged patient no longer needs medication fill/delivery.
Magnet New Knowledge, Interventions & Improvements – Silver Award Increase Compliance for Bone Density Testing
This green-belt project team sought to increase compliance with bone density testing for women aged 65 or older to predict future fragility fracture risk. As a result of their work to develop quick text for providers to include in visit summary explaining the DXA test, prep and scheduling info, and a quick text portal communication reminder, non-compliance rates improved to 36% from 67%.
Magnet New Knowledge, Interventions & Improvements – Gold Award Productivity Made Easy – Tool Developed to HomeHealth Caregivers Meet Benchmarks
HomeHealth caregivers are expected to meet productivity benchmarks each pay period, but did not have a way to easily track their productivity. The nurse manager for Team C3 created an Excel tool with embedded formulas to enable caregivers to track their productivity in real time. Immediately following implementation, productivity increased to 70% from 60%, meeting the team’s benchmark to over 78% each pay period (those not meeting were precepting). Estimated cost savings from rollout to all HomeHealth caregivers statewide will be $719,000.
164 | ChristianaCare Quality & Safety Report 2023
Magnet Transformational Leadership Award
Taking the Thinking Out of Falls Screening
The Emergency Department (ED) implemented an evidence-based fall risk screening tool to reduce subjective judgment and developed specific fall mitigation interventions for each risk stratification. After implementation of the tool in December 2021, the Newark campus ED decreased nonintentional falls by 14%; Wilmington ED decreased by 25% and Middletown decreased by 50%. Total falls across the three sites decreased to 93 in fiscal year 2022 from 116 in fiscal year 2021.
Magnet Exemplary Professional Practice – Silver Award
Dermal Defense
After seeing an increase in hospital-acquired pressure injuries (HAPI) due to long lengths of stay and patient severity, 6 South, Wilmington created a dermal defense team to identify gaps in prevention, ensure rounding and chart audits focused on Braden score and two-hour turns, provide real-time education, and assist with turns and two-nurse skin checks. After implementation, 6 South decreased HAPIs by 40% in fiscal year 2022 compared to fiscal year 2021.
Magnet Exemplary Professional Practice – Gold Award
Improving Validity of Hand Hygiene Surveillance
To improve the required hand hygiene observation efficiency and accuracy, Infection Prevention, Information Technology, Nursing, Performance Improvement, Human Factors Engineering and Respiratory Care implemented CipherRounds™, standardized education and created a dashboard for real-time feedback. After go-live, monthly unit-based hand hygiene observations increased from to 3,872 from 253, with observation time reduced to one minute for a 50% reduction in cost of time wasted totaling $21,109.
Magnet Structural Empowerment Award
Patient Education Resource Support: A PERS-cription for Success in Patient Education Patient and Family Health Education implemented a Patient Education Resource Support (PERS) rounding program to increase utilization of existing health-literate patient education materials. PERS provided education to bedside nurses on accessing education materials in Cerner, as well as the availability of education in multiple languages. 214 caregivers received education, patient education leaflet use increased 189% and utilization in alternative languages increased 50%.
The ChristianaCare Way Awards 2022 | 165
Innovative Tools Award
Diggin’ In to Drop-em Down: Data to Decrease Smart Pump Alerts
Medication Safety utilized a software program to effectively mine and analyze smart pump drug library-use data to reduce “nuisance” alerts to limit alert fatigue and optimize pump safety. Override rates and threshold settings were analyzed for four medications with the highest alert-to-infusion ratios. One alert that could be modified without compromising patient safety was selected for each. Alerts decreased for lactated ringers by 53%, morphine by 73%, nivolumab by 99% and milrinone CV_OR by 100%. Alert-to-infusion ratios and percentage of overall alerts also decreased for all four medications.
Extraordinary People – Silver Award
Psychological Safety: A Foundation of Respect
After implementing virtual COVID-19 monitoring and care coordination, CareVio was divided into the Center for Virtual Health and the original CareVio with new leadership, leading to confusion and lack of standardization. A SWOT evaluation identified opportunities related to psychological safety within the department. CareVio collaborated with iLEAD to develop a 12-month, multi-pronged approach to leadership education, including individual and group coaching, the Herrmann Brain Dominance Instrument system, and curriculum. Responses on all questions on a pre/post intervention survey improved with an average increase of nine points, creating a foundation of psychological safety.
Extraordinary People – Gold Award
No Experience Needed: Be a HomeHealth CNA!
To address the shortage of certified nursing assistants (CNA), HomeHealth collaborated with Human Resources and iLEAD professional development to create and align the HomeHealth CNA Residency with the patient care tech residency program. Six CNA caregivers were hired and completed residency by June 2022. Billable homemaker hours increased 85% by July. Six additional caregivers were hired, and by Fall 2022, the program expanded to Kent and Sussex counties.
Strategic Partnerships Award
Delaware Food Farmacy: A Food as Medicine Partnership Improving Chronic Conditions
In February 2021, ChristianaCare Community Health collaborated with Lutheran Community Services to launch the Delaware Food Farmacy program to address food insecurity and reduce disparities in chronic disease among high-risk Medicaid patients. 95 patients participated in the six-month comprehensive program. Improved nutrition and health outcomes for participants included a 15% increase in meeting fiber recommendations; an average weight loss of 13 pounds each for 63% of participants; and improved hemoglobin levels and blood pressures.
166 | ChristianaCare Quality & Safety Report 2023
Organizational Vitality – Silver Award Reducing Click Burden through Optimal Conversion
Due to a customized medication order catalog, ChristianaCare had a 0% conversion rate during admission medication reconciliation, leading to 50,000 extra mouse clicks and 23 hours of provider time monthly. Medical Informatics, Pharmacy, Medication Safety and Human Factors transitioned the medication order catalog in phases by therapeutic category. As of May 2022, the auto-conversion rate was over 76%; 23.8 total hours were saved, and clicks decreased by 51,474, with no change in medication safety.
Organizational Vitality – Gold Award
Increasing Community Access to the Riverside Wound Care Center
Patient visits to the Wound Care Center decreased 8% in the 12 months ending March 2022, and the no-show/cancellation rate was 13%. Perioperative Services, Organizational Excellence and the Wound Care Center implemented clinical caregiver reviews of all referrals at the time of scheduling, electronic changes to capture all self-referrals, and improved marketing to internal and external providers. In six months, patient visits increased 35% and the no-show/cancellation rate decreased to 11%, leading to annualized additional revenue of $1,200,488.
Exceptional Experience – Silver Award
Focusing on Patient Needs through Timely Spiritual Histories
Joint Commission and National Consensus Project guidelines require that patients’ spiritual care needs are assessed and addressed in the plan of care. Chart review found a spiritual history completion rate of 37%. Chaplains modified spiritual history documentation to a PowerForm within the palliative workflow, and provided education to address provider comfort, the spiritual history process and understanding of primary spiritual care. Spiritual history completion increased to 49%, provider knowledge increased, and the percentage of survey respondents providing spiritual care increased to 60% from 22%.
Exceptional Experience – Gold Award Improving Patient Access at Union
The Cecil County campus Patient Access Center identified an opportunity related to scheduling errors that adversely impacted patient experience. The team implemented a formalized training curriculum instead of side-by-side trainings; a refresher training program for common errors made; and a quality feedback and coaching log. Errors were reduced to 33 per month from the baseline of 60. Error rates are monitored on the huddle board to drive further improvement.
The ChristianaCare Way Awards 2022 | 167
Optimal Health Quality – Silver Award
Little Drops of Love: Implementation of Oral Care Best Practices for NICU Patients
The Neonatal Intensive Care Unit (NICU) focused on standardizing oral hygiene to reduce the risk of infection and enhance protective immune mechanisms for infants. The team piloted an oral care product to support oropharyngeal administration of colostrum, modified the NICU admission order set in PowerChart, developed a care management guideline, and provided education. Maternal breast milk use increased by almost 6% in the first six months and decreased use of formula and banked breast milk led to a cost savings of $17,400. Initial results also show decreases in ventilator-associated events and pneumonias with secondary blood-stream infections.
Optimal Health Quality – Gold Award
Twiage: Prehospital Notification of STEMI
Emergency medical providers historically used radio technology to communicate with ChristianaCare from the field regarding critical incoming patients. Implementation of Twiage, a smartphone application to support electronic communication, including demographics, vital signs, pictures and ECG images, now allows immediate activation of the Cardiac Cath Lab team for ST-segment elevation myocardial infarctions. Twiage decreased the first medical contact time by 16 minutes, door-to-balloon time by almost 19 minutes, and alert-to-code time for STEMI by eight minutes.
Optimal Health Safety Award
Installing Guardrails® on the Fentanyl Infusion Freeway
In 2018 and 2019, fentanyl overdose errors increased due to programming the dose (mcg/hr) in the rate field (mL/hr) because the HIGH-Dose ONLY smart pump library was mistakenly chosen.
Medication Safety and Nursing implemented a forcing-function workflow with a profile requiring a new smart pump only for fentanyl if HIGH-Dose ONLY was selected. In the first four months, the HIGH-DOSE ONLY profile was not used, and the pump prevented 16 overdoses. Annualized, error prevention saved $470,900 and eliminated 216 patient days.
168 | ChristianaCare Quality & Safety Report 2023
Population Health Award
Community Health Worker Integration into Primary Care
In December 2019, ChristianaCare launched the Individualized Management for PatientCentered Targets (IMPaCT) community health worker program in four high-need Medicaid practices. Community health workers embedded in each of the practices met weekly with enrolled patients who had uncontrolled hypertension or diabetes, or were high utilizers. Six months of tailored support, including social needs screening and referrals; patient-centered goal setting and achievement; care coordination and advocacy was provided. 75% of enrolled patients completed the program. Participants achieved an average of five of six goals set; primary and specialty care visits increased 7%, emergency department visits decreased 35% and hospital visits decreased 15%.
Transformation Award
QI Initiative Expansion to Broaden Influenza Vaccination Coverage in People with HIV
The William J. Holloway Community Program, which cares for 70% of adults with HIV in Delaware, sought to sustain and expand an influenza vaccine coverage initiative across its six sites statewide. A bundle of interventions was rolled out, including flexible scheduling, real-time data capture & sharing, portal enrollment, Twistle messaging, culturally competent messaging, and targeted handouts. Program-wide, vaccine rates reached 85% by March 2022, with no significant differences by gender or race.
Health Equity Award – People’s Choice Winner
A Step towards Health Equity: Eliminating Race from the Estimate of Kidney Function
Commonly used equations to estimate the glomerular filtration rate (GFR) measure of kidney function include race as a coefficient, leading to overestimation of the GFR for Black patients compared to non-Black patients and potential healthcare disparities. Members of the Department of Pathology & Laboratory Medicine, Office of Health Equity, Pharmacy, Nephrologists, Internists and iREACH implemented a GFR equation excluding race in April 2022 and evaluated the impact on improving equity in the detection of low. Kidney function in Black patients. The revised equation led to a statistically significant increase in the percentage of Black patients identified as having low kidney function versus a decrease among non-Black patients; an increased number of Black patients eligible for referral to a nephrologist; and an increase in the number of Black patients who would need additional care prior to contrast-based imaging, thus improving health equity.
The ChristianaCare Way Awards 2022 | 169
Sustained improvements stemming from President’s Award projects through the years
2003
Improve Clinical Outcomes in Patients with a Traumatic Brain Injury (TBI)
The Trauma program and Neurosurgery implemented a clinical management guideline (Jan 2001) & outcome record that led to a 23.5% reduction in mortality (25.6% 10/39 from a baseline of 34.2%, 13/38.
Today, the Trauma program cares for about 700 patients with TBI each yea, with more than 300 classified as severe. TBI mortality is now less than 12%.
2004
Management of Medical Comorbidities in HIV+ Patients
The HIV Community Program (now Holloway) nested with the Internal Medicine program to improve the management of HIV-positive patients with medical comorbidities. Of 185 patients referred to the Internal Medicine program, uncontrolled diabetes (HbA1c >9) decreased to 13% from 39%; and blood pressure control (< 130/80) improved to 75% from 61%.
Updates are not available, but the program is still in existence today as part of the William J. Holloway Community Program.
2005
We Build It and They Come
Implementation of CAPES (Crisis Assessment and Psychiatric Emergency Services) in 2004 by Psychiatry, the Wilmington Emergency Department (ED) and the Delaware State Association of Mental Health decreased involuntary commitments by 43% and elopements from the ED by 33%; minimized restraint use, discharged 90% of patients within eighthour target, and reduced ED length of stay by 30 minutes.
The program has been renamed PES for Psychiatric Emergency Services (the state is no longer involved). In 2022, PES-W had 2,249 patient visits and average time in unit was 12.5 hours. As of Oct 2022, patients could be directly bedded to PES, decreasing wait times; 21% of admissions from PES go to inpatient psych on the Wilmington campus. The team also provides telenurse assessments to behavioral health patients in the Middletown ED. The three-bed PES unit at Christiana had 1,089 patient visits in 2022, with 18% of admissions going to inpatient psych at Wilmington. The team also provides telenurse assessment to the new Pediatric Care Center for quicker access to treatment.
170 | ChristianaCare Quality & Safety Report 2023
2006
Improvement of the Rate of Patients Who Receive the Pneumococcal Vaccination
Nursing, Pharmacy and Performance
Improvement created standing orders for vaccination of patients aged 65 and older or with chronic disease at discharge that included vaccine tracking in PowerChart. The vaccination rate increased to 84% in 2006 from 10% at baseline (FY 2002 – FY 2004); pneumonia mortality decreased by 21% (to 9.1% from 11.5%).
Since then, learnings from this program have informed multiple vaccination programs for patients.
2007
Improving Outcomes through Hourly Rounding
The Nursing 5A Quality & Safety Council’s implementation of hourly rounding in February 2007 decreased the number of patient falls on the unit by 17%; decreased call lights by 64% and improved patient satisfaction scores by 1.5 average points.
Purposeful hourly rounding is now a systemwide standard. 5A patients report rounding is completed more than 73% of the time.
2008
Vigilant Advocacy to Prevent HospitalAcquired Infections: VAP Eradication
The Nursing MICU Quality & Safety Committee implemented a ventilatorassociated pneumonia (VAP) bundle of interventions in 2007 to decrease and maintain zero cases of VAP. Bundle compliance averaged 83%; and there were zero cases of VAP in nine of 10 months postimplementation.
MICU maintains low levels of VAP, with zero cases in 101 of 120 months (84%) over the last 10 years.
2009
Improving Diabetes Care in Adult Medicine Office
Internal Medicine faculty, the Wilmington Adult Medicine Office, and Internal Medicine and Emergency Medicine/Internal Medicine residents held a comparison and competition among six resident teams to improve processes and outcomes and introduce principles and application of performance improvement. The competition improved aspirin use and screening for nephropathy each by 20%; and HbA1c testing by 17%.
The initiative was recognized with a second President’s Award in 2013. The practice continues to serve a large number of patients with diabetes, and current measures show that more than 64% have had hemoglobin testing within six months.
The ChristianaCare Way Awards 2022 | 171
2010
No One Dies Alone
Volunteer Administration, Pastoral Services, Nursing and Infection Prevention developed Vigil Volunteers in September 2009 to provide a companion to patients at Wilmington and Christiana hospitals who were at the end of life with no family or friends present. In the first six months, volunteers supported 11 patients for a total of 38 hours. By end of that first year, 41 volunteers had joined program.
Since 2010, about 30 Vigil Volunteers have participated in the program annually (85-100 total volunteers over 14 years), providing support to 120 patients, through 1,400 volunteer hours. The program was suspended for almost three years due to the pandemic, but resumed in February 2023.
2011
A Multidisciplinary Approach to Reducing Unit Acquired Pressure Ulcers
The Surgical Critical Care Complex (SCCC) skin resource team, with collaboration from Wound Ostomy Continence nurses and Maintenance, assessed clinical conditions contributing to skin issues, individualized interventions and goals for each patient, and implemented skin rounds. In the first month, pressure ulcer prevalence dropped to 7.7% from a peak of 20.1, and reached 0% for four consecutive months.
The SCCC continues to have very low incidence of pressure injuries, and has maintained 0% over the past 24 months.
2012
Improving VTE Prophylaxis: One Unit’s Journey
5B, Pharmacy, Performance Improvement and Organizational Excellence implemented education and monitoring for risk assessment of venous thromboembolism (VTE); worked with Information Technology to modify the VTE prophylaxis surveillance report to improve accuracy; and instituted daily tracking and posting of compliance on the unit. Their efforts improved risk assessment compliance by 12% (to 93% from from 83%) and increased prophylaxis compliance to 97% from 92%.
Recent analysis shows zero cases of deep vein thrombosis or pulmonary embolism on 5B, and 95% compliance with VTE prophylaxis.
2013
Improving Glycemic Control in the Adult Medicine Office
Through the Ammon Diabetes Care & Prevention Project, Department of Medicine faculty, Adult Medicine Office (AMO) staff and adult diabetes educators improved glycemic control of AMO patients with diabetes by improving self-management and medical management. The percent of patients with HbA1c<9% improved by 11%; and there was significant reduction in the mean HbA1c % with 25% of the uncontrolled group brought into control.
The practice continues to serve a large number of patients with diabetes. Current measures show more than 64% have had hemoglobin testing within six months, and 64% are in control.
172 | ChristianaCare Quality & Safety Report 2023
2014
The Brown Battle: Reduction of WICU Acquired Clostridium Difficile Rates
The Wilmington Intensive Care Unit value improvement team, along with Pulmonary Critical Care, Surgical Critical Care, Infection Prevention, Pharmacy, Respiratory, Dietary and Environmental Services, created a C. difficile intervention bundle including environmental monitoring, staff education/ awareness, hand hygiene, antibiotic stewardship and proton pump inhibitor stewardship. In the five months postimplementation, WICU had zero cases of C. difficile. Hand hygiene compliance topped 95% and there was a 20% reduction in antibiotic use and a 22% reduction in dispensed proton pump inhibitors, with strong performance in environmental cleaning.
WICU recently reached 49 months with zero C. difficile in December 2022.
2015
Bundling Care to Create Value Information Technology, Finance, Perioperative Services, Orthopedics, Heart & Vascular, Performance Improvement, CareVio, HomeHealth and Care Management worked together to redesign clinical care and develop a longitudinal care management infrastructure to improve quality, decrease variation and reduce cost of care under Medicare’s Bundled Payments for Care Improvement initiative for joint replacement, cervical spine and cardiac valve surgery. Their efforts Increased discharges to the community versus postacute care by 9%; decreased 30-day and 90-day readmissions by 26%; improved
functional outcomes (pain and mobility) post-discharge and achieved internal cost savings of $850,000 in the first six months.
The program has since expanded to include lumbar spine, CABG and heart failure. Through the third quarter of 2018, ChristianaCare successfully reduced total Medicare spend by $5.5 million, leading to a variance to target of more than $714,000. Participation in bundled payments for care improvement allowed for greater development of CareVio; allowed us to better understand the intricacies surrounding at-risk and Medicare Shared Savings programs for population health; created alignment and fostered better relationships with community surgeons and practices.
2016
Driving AOP Improvement Through an Interactive Dashboard
The Office of Quality, Patient Safety & Population Health, Enterprise Information Management and Information Technology instituted automated reporting and created an interactive dashboard to track and drive improvement on annual operating plan (AOP) triple aim goals. Go=live was in August 2015. In the first year, the dashboard was accessed an average of 93 times per day, versus the 200 times per month that the prior pdf dashboard was downloaded. Seven of nine service lines improved their optimal health grade, with three earning an “A.”
Now in its eighth year, the dashboard was renamed the Clinical Effectiveness Dashboard and incorporated as part of the new AOP Dashboard in FY 2021 to focus on AOP goals. Interactive dashboards using Tableau are now a universal tool to drive improvement and 544 new dashboards are currently in production.
The ChristianaCare Way Awards 2022 | 173
2017
Carelink Community –Right Care, Right Place, Right Time
The CareVio Community program, CareVio and community partners, including the St. Patrick’s Center in Wilmington, joined together to expand the Medical Home Without Walls program in which licensed social workers addressed medical and social barriers to care in an effort to reduce hospital utilization and improve health outcomes for high-risk/high-cost individuals in the community. The collaborative completed 9,200 interventions to support more than 2,400 participants, reducing emergency department visits by 49%, inpatient admissions by 20%, and total patient days by 44% for an estimated cost savings of $81,500.
Now in its 10th year, CareVio Community continues to outreach and intervene with high risk/high-cost community members. In addition to licensed social workers, team has added three community-based RNs. About 250 individuals are served annually across Delaware, with 95% referred to the team for engagement.
2018 Coder University –Talent Acquisition Innovations
Health Information Management Services and Human Resources created in in-house program to train coding assistants. Of the 23 coding assistants hired to fill 95% of vacant positions, 83% were credentialed on the first attempt during the training program. Contract coder expenses were reduced by 63%.
The program is still operating. Six more candidates participated in 2022, prepared for hire by early 2023.
2019
Improve New Provider Access to IT Applications at Onboarding
ChristianaCare Hospitalist Partners, Medical Affairs, Information Technology (IT) and iLEAD developed a formal onboarding process for new providers, which included an intranet site and profiling of in-scope applications to reduce SAM requests and improve timeliness of new provider access to IT applications.
The program has reduced the percentage of providers without access to all necessary applications on their start date from to 26% from 63%.
174 | ChristianaCare Quality & Safety Report 2023
2020
The Wilmington Cardiac Care Unit: The Right Care in the Right Place
The Wilmington Cardiac Care Unit (WCCU), Cardiac Short Stay Unit on the Newark campus, and Heart & Vascular came together to expand cardiac services on the Wilmington campus by opening a hybrid inpatient/observation intermediate cardiac care unit. In vivo training on the chest pain protocol and guideline-directed care was offered to new caregivers on the Cardiac Short Stay Unit. Expanded services at Wilmington decreased inter-hospital transfers to the Newark Cardiology Short Stay Unit by more than 75%; and decreased length of stay for chest pain observation patients by more than 12 hours.
WCCU cared for more than 800 patients with cardiac diagnoses in 2022, almost 700 who presented with chest pain. Only four observation patients and 12 inpatients required interhospital transfer. Observation length of stay averaged 20 hours.
2021
Streamlining the Structural Heart Team to Enhance Efficiency and Patient Experience
The Structural Heart Team, Heart & Vascular Interventional Services, the Cardiac Catheterization Lab and Heart & Vascular worked together to streamline the pre- and post- admission process for a patientcentered focus and reduce care transitions. They cross-trained cardiac technical caregivers and modified consent for patient shared decision-making.
The initiative has decreased turnaround time from consult to procedure by 13.6 days; increased minimalist approach by 134%; decreased transcatheter aortic valve replacement length of stay by 2.2 days, and decreased readmissions to less than 1% from 10%.
The ChristianaCare Way Awards 2022 | 175
ChristianaCare At a Glance
Headquartered in Wilmington, Delaware, ChristianaCare is one of the country’s most dynamic health care organizations, centered on improving health outcomes, making high-quality care more accessible and lowering health care costs. ChristianaCare includes an extensive network of primary care and outpatient services, home health care, urgent care centers, three hospitals (1,299 beds), a freestanding emergency department, a Level I trauma center and a Level III neonatal intensive care unit, a comprehensive stroke center and regional centers of excellence in heart and vascular care, cancer care and women’s health. It also includes the pioneering Gene Editing Institute.
ChristianaCare is nationally recognized as a great place to work, rated by Forbes as one of the best health systems to work for in the United States and by IDG Computerworld as one of the nation’s Best Places to Work in IT. ChristianaCare is rated by Healthgrades as one of America’s 50 Best Hospitals and continually ranked among the nation’s best by Newsweek and other national quality ratings. ChristianaCare is a nonprofit teaching health system with more than 260 residents and fellows. With its groundbreaking Center for Virtual Health and a focus on population health and value-based care, ChristianaCare is shaping the future of health care.
176 | ChristianaCare Quality & Safety Report 2023
ADMISSIONS 60,094 OUTPATIENT VISITS UNCOMPENSATED CARE 879,840 $32.8M BIRTHS 6,829 RADIOLOGY PROCEDURES 530,953 SURGICAL PROCEDURES 37,697 HOSPITAL-BASED LAB TESTS 4,218,400 EMERGENCY DEPT. VISITS 220,800 HOMEHEALTH VISITS 219,142 URGENT CARE VISITS 187,753 PRIMARY CARE OFFICE VISITS 355,999 VIRTUAL VISITS 30,994
OUR PEOPLE NURSES & TECHNICIANS 4,668 TOTAL CAREGIVERS 13,708 RESIDENTS 374 VOLUNTEERS (41,000 Volunteer Hours) 459
BY THE NUMBERS
The ChristianaCare Way
We serve our neighbors as respectful, expert, caring partners in their health. We do this by creating innovative, effective, affordable and equitable systems of care that our neighbors value.
We Serve Together With Excellence and Love
LOVE EXCELLENCE
We anticipate the needs of others and help with compassion and generosity.
We embrace diversity and show respect to everyone.
We listen actively, seek to understand and assume good intentions.
We tell the truth with courage and empathy.
We accept responsibility for our attitudes and actions.
We commit to being exceptional today and even better tomorrow.
We seek new knowledge, ask for feedback and are open to change.
We use resources wisely and effectively.
We are curious and continuously look for ways to innovate.
We are true to our word and follow through on our commitments.
178 | ChristianaCare Quality & Safety Report 2023 EA23-1458 ChristianaCare is a private, nonprofit regional health care system that relies in part on the generosity of individuals, foundations and corporations to fulfill its mission. To learn more about our mission, please visit christianacare.org/donors. PO Box 1668, Wilmington, Delaware 19899-1668 800-693-CARE christianacare.org
