1 minute read
environmental indicators
flood risk air pollution levels heat vulnerability

Advertisement


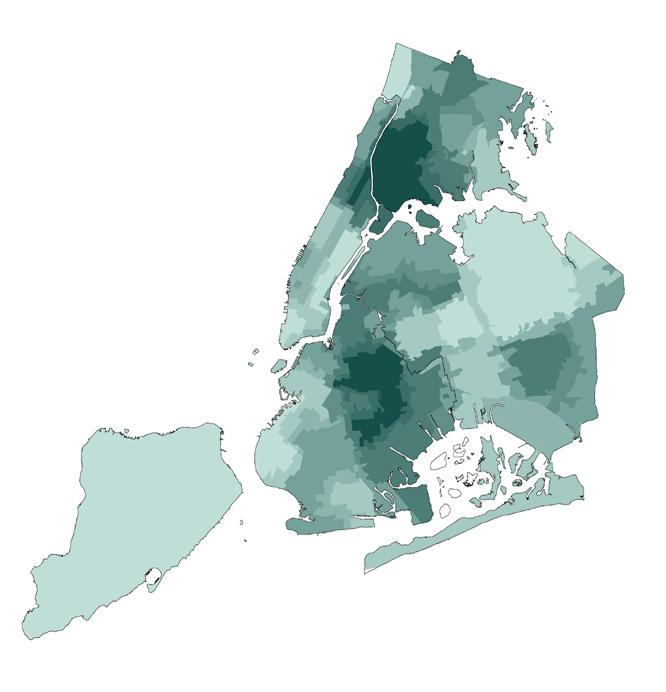
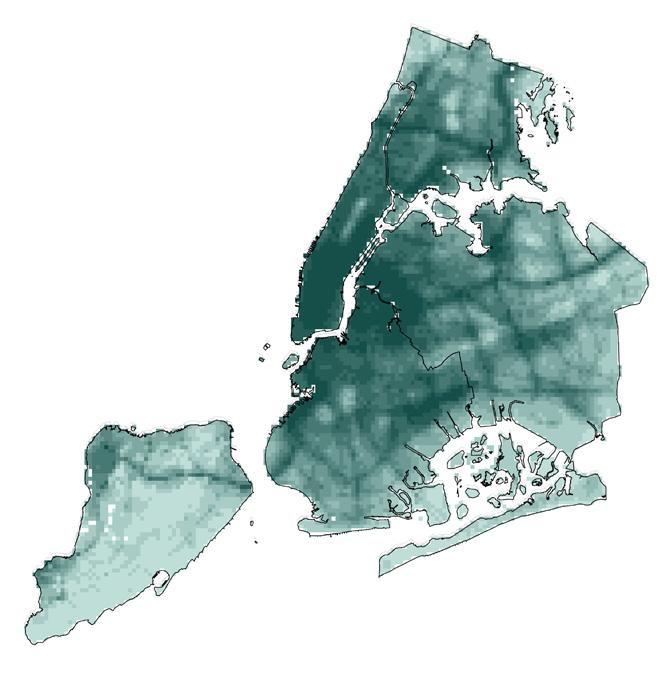
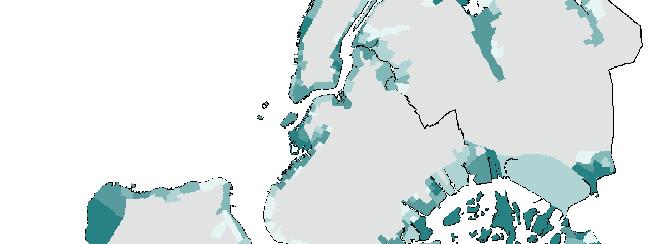
Reviewing the information provided by the individual flood risk, air pollution, and heat vulnerability analysis layers above, different regions are represented at a greater risk for environmental climate change factors. Interestingly, much of the greatest risk areas in each analysis layer are not repeated consistently across all three layers. Flood risk accordingly represents the areas with greatest risk to flooding for projected sea level rise. Air pollution represents a combination of the top five air pollutants from data provided by the New York City Community Air Survey. These air pollutants included nitrogen dioxide, fine particulate matter, black carbon, nitric oxide, and summer average for ozone. For air pollution, Manhattan and its radiating areas represent the majority of vulnerability to air pollution. Also, evaluating the air pollution analysis layer, high vulnerability to air pollution stretches out across the outer boroughs in what is hypothesized to be transit lines with heavy car traffic. Finally, for the heat vulnerability analysis layer, significant portions of the Bronx and Brooklyn are designated as highly vulnerable to heat.
A ranked decision map was created from the reclassification of the environmental vulnerability factors to create an overall decision map for environmental vulnerability to climate change. This decision map, visualized on the right, represents analysis layers for flood risk, air pollution, and heat vulnerability aggregated with all environmental factors being considered equal for this part of the analysis. It is important to note the most vulnerable areas to environmental factors of climate change in New York City are not restricted to coastlines, but instead, are spread across the city with more vulnerable areas present in the Bronx and Brooklyn.

Reclassified Raster Map of All Environmental Indicators


