1 minute read
access to resources
public facilities
12 sunway stops bus stops
Advertisement


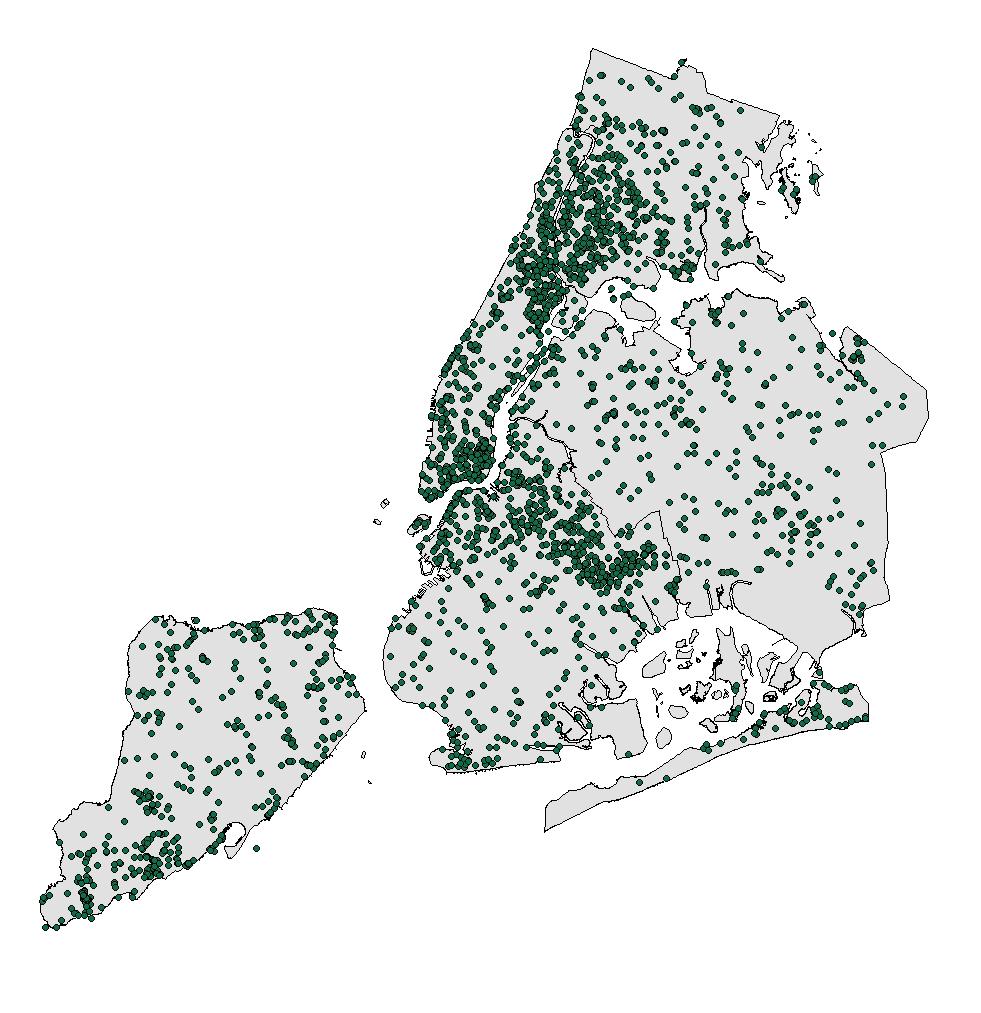
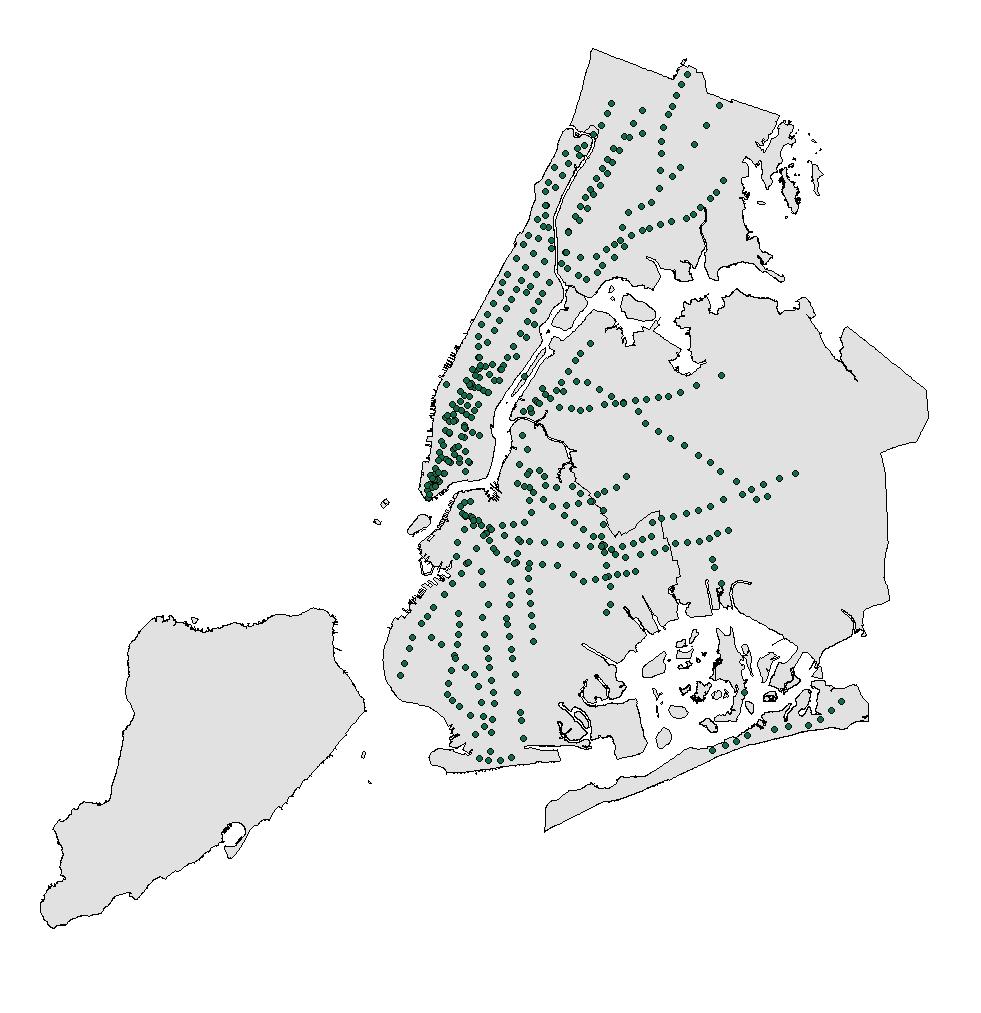
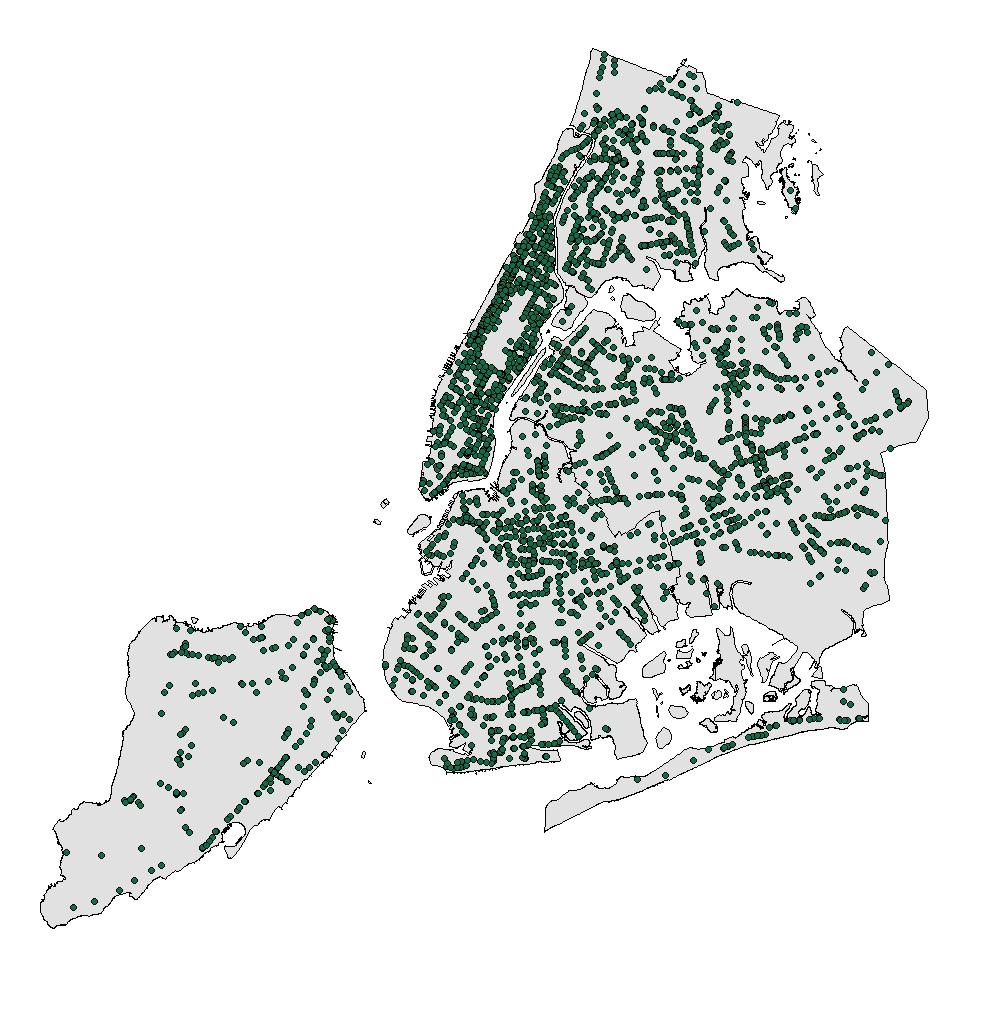
Access to resources was considered the third category of data for this analysis of climate vulnerability and included in order to try and develop a comprehensive outlook. Bus stops and subway stations were included as access to transportation resources. Other resources were selected from the New York City Department of City Planning's facilities database. Within this database, two intentional selections were made. First, public facilities were selected to distinguish between public and private access. Second, facilities were selected based on their potential to mitigate the impacts of climate change. Bus stops, subway stations, and facilities were merged together to output New York City resources against climate change.
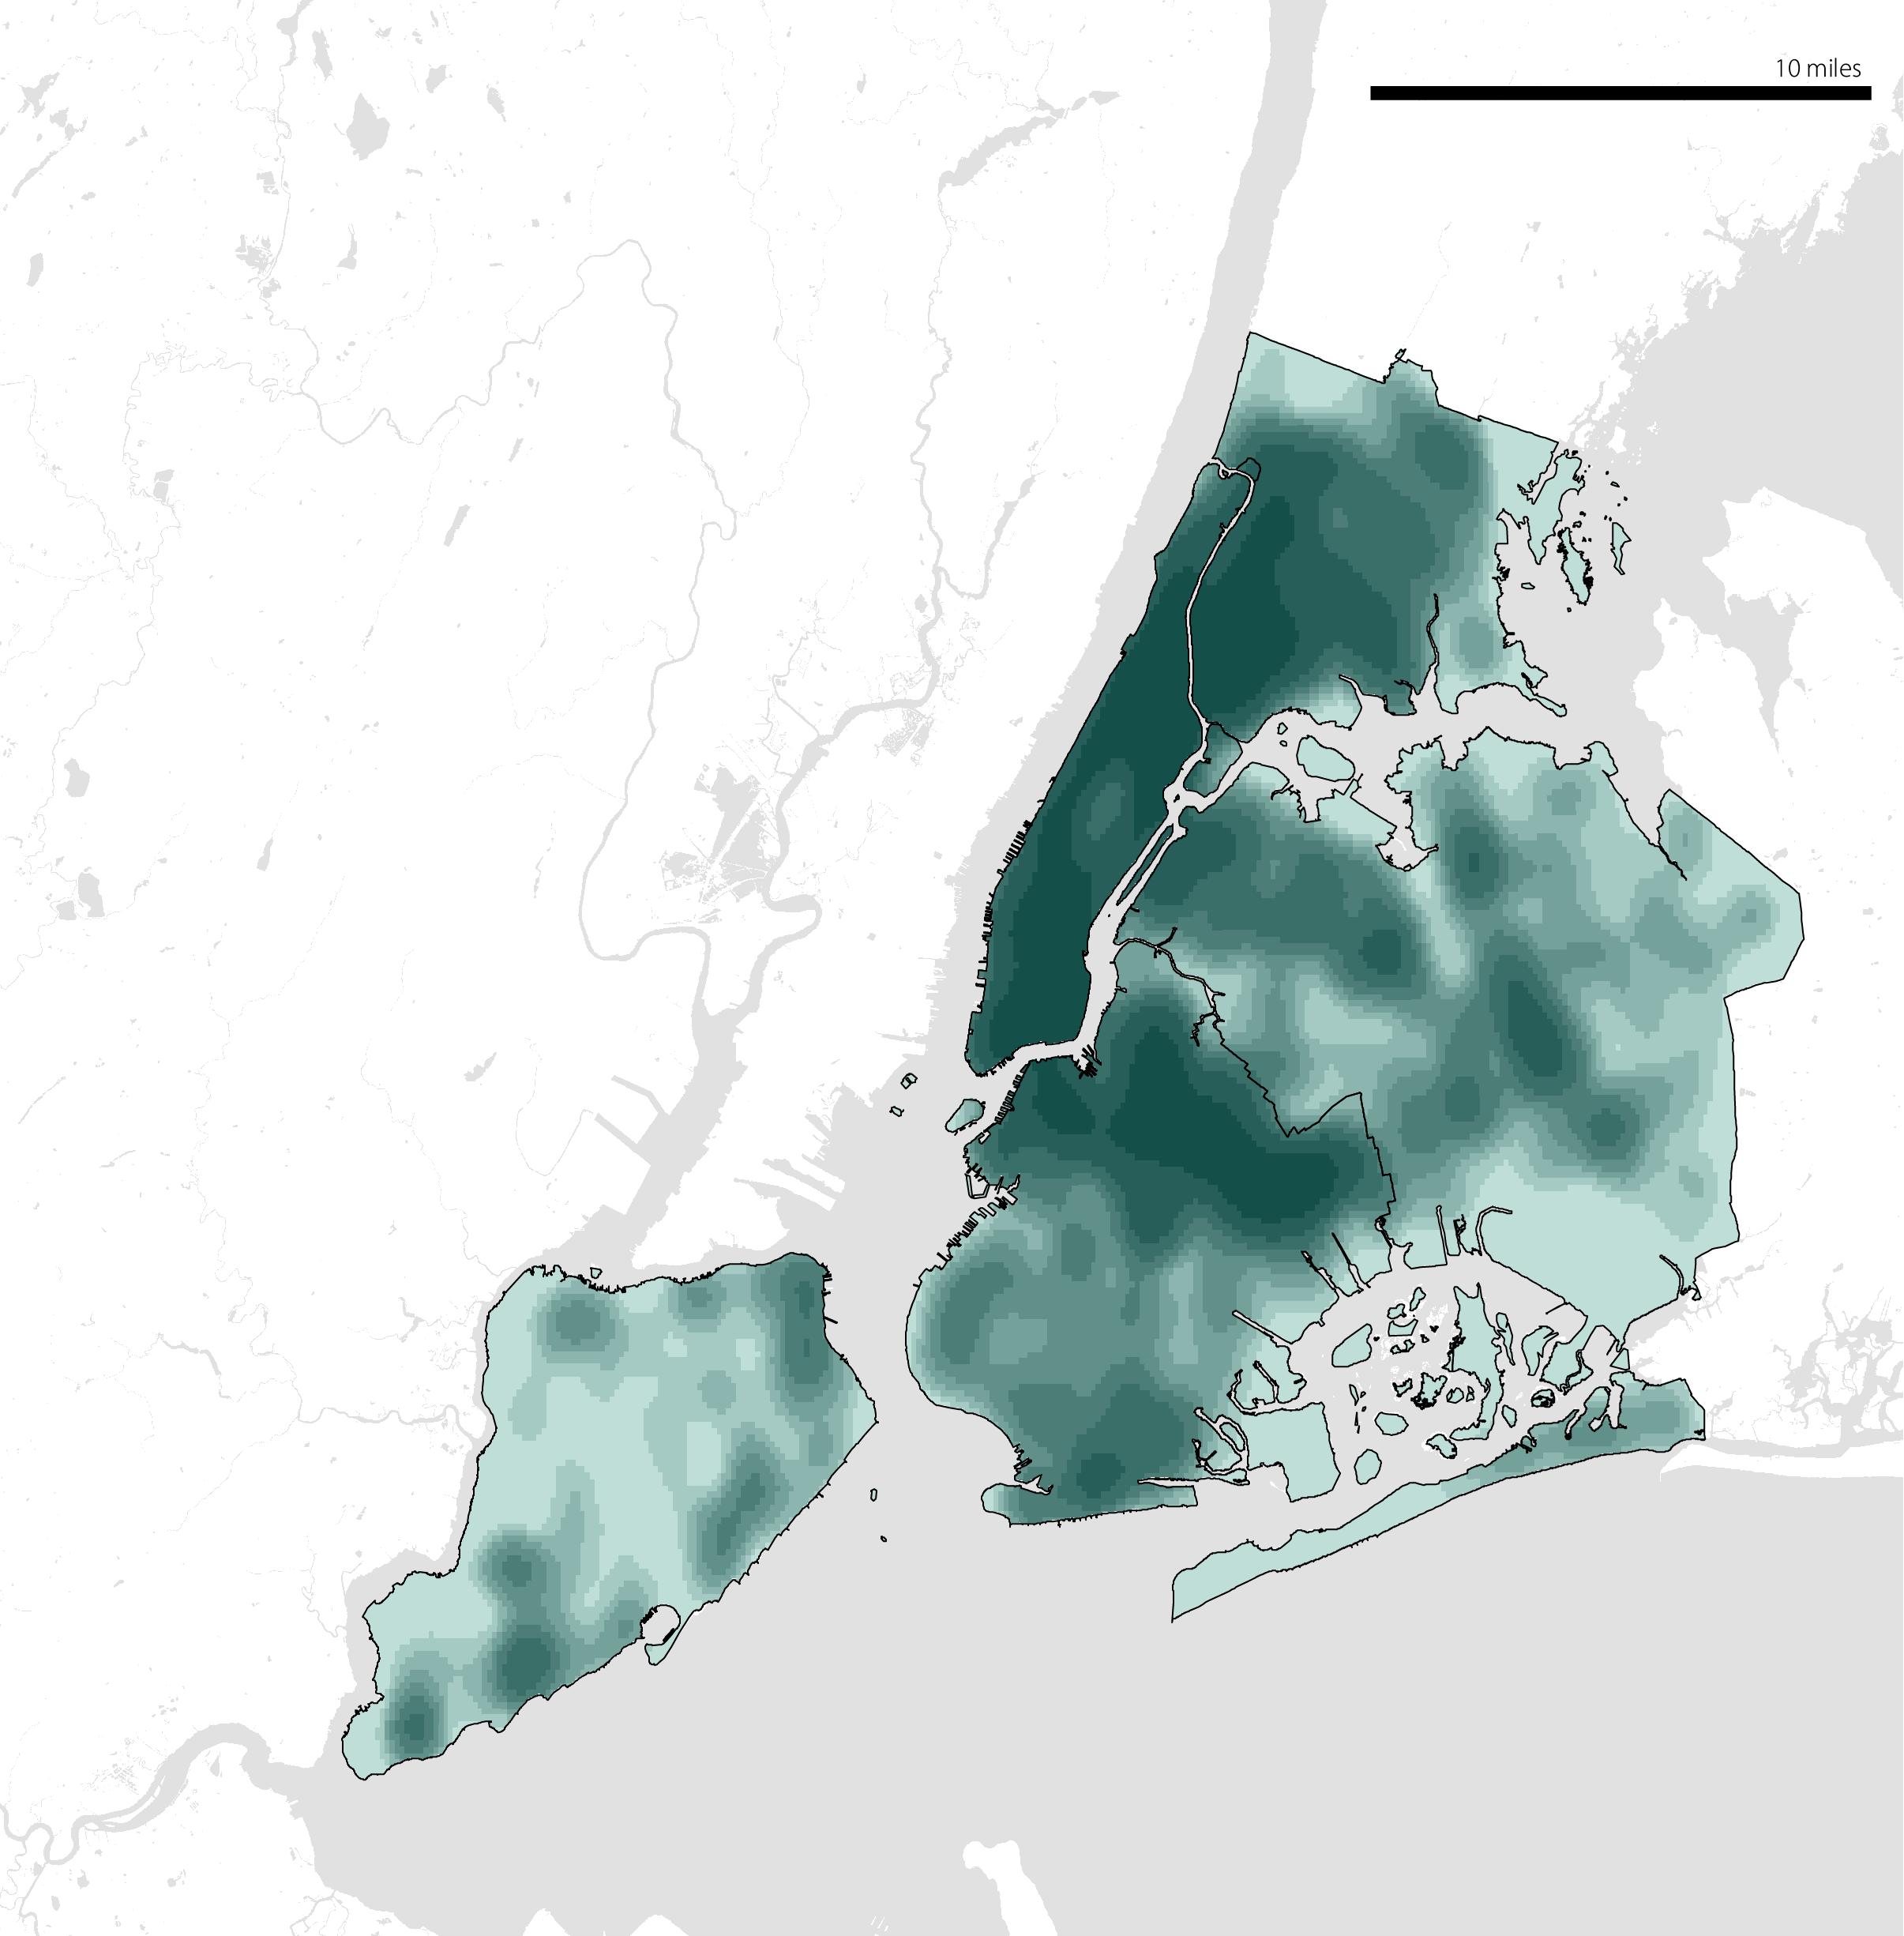
With the merged dataset, a kernel density map was created in order to sample the density of points with respect to their spatial location to one another. This process aggregated various resources to output an overall perspective of access to resources across New York City's five boroughs, visualized to the right. Darker color represents greater density of resources. Notice, Manhattan, northern Brooklyn, and souther Bronx all have the highest density of resources.
Later, towards our final decision maps, access to resources will be subtracted from this analysis' vulnerability equation.

Reclassified Kernel Density Map of All Resource Facilities


