10 minute read
10.3. Flood Risk Precincts


Table 23 Peak Flood Depths (m) at Key Locations – Design Events
ID Location 1.0 EY 20% AEP 10% AEP 5% AEP 2% AEP 1% AEP 0.5% AEP 0.2% AEP PMF
Advertisement
H01 Pedestrian Bridge 2 0.30 0.38 0.47 0.63 0.67 0.71 0.75 0.79 1.63 H02 Pedestrian Bridge 1 0.74 0.80 0.86 1.04 1.07 1.11 1.15 1.18 1.92 H03 Front of community Centre 0.16 0.18 0.20 0.20 0.21 0.22 0.24 0.33 1.73 H04 Railway underpass 2 East side 0.06 0.10 0.11 0.12 0.14 0.16 0.17 0.18 1.21 H05 Railway underpass east side 0.13 0.29 0.40 0.47 0.60 0.68 0.77 0.89 2.42 H06 Railway underpass west Side 0.24 0.42 0.51 0.57 0.68 0.72 0.79 0.88 0.94 H07 7 Concord Avenue low point 0.16 0.27 0.35 0.44 0.49 0.55 0.61 0.70 2.11 H08 George Street low point near soccer field 0.09 0.54 0.63 0.81 0.93 1.08 1.24 1.54 2.21 H09 Powells Creek @ Argonne Street 0.02 0.03 0.04 0.19 0.28 0.35 0.42 0.50 2.28 H10 Powells Creek @ Pomeroy Bridge 0.05 0.18 0.20 0.25 0.29 0.32 0.37 1.50 H11 Powells Creek @ Allen Street 1.36 1.71 1.83 1.92 2.02 2.09 2.14 2.25 3.66 H12 Powells Creek @ Brussels Street 0.07 0.16 0.25 0.40 0.49 0.56 0.62 0.71 2.49 H13 Powells Creek @ Warsaw Street 0.47 0.53 0.60 0.75 0.85 0.92 0.98 1.07 2.85
Table 24 Peak Flood Velocity (m/s) at Key Locations – Design Events
ID Location 1.0 EY 20% AEP 10% AEP 5% AEP 2% AEP 1% AEP 0.5% AEP 0.2% AEP PMF
H01 Pedestrian Bridge 2 0.10 0.09 0.10 0.14 0.18 0.21 0.22 0.25 0.80 H02 Pedestrian Bridge 1 0.57 0.16 0.65 0.93 0.93 0.93 0.96 0.96 0.95 H03 Front of community Centre 0.07 0.11 0.17 0.15 0.16 0.17 0.17 0.19 0.28 H04 Railway underpass 2 East side 1.47 1.93 2.06 2.15 2.28 2.34 2.43 2.49 2.88 H05 Railway underpass east side 0.48 0.44 0.51 0.57 0.74 0.78 0.80 0.82 1.13 H06 Railway underpass west Side 0.24 0.74 0.78 0.80 0.87 0.84 0.97 1.03 1.14 H07 7 Concord Avenue low point 0.10 0.29 0.24 0.21 0.23 0.22 0.21 0.11 0.61 H08 George Street low point near soccer field 0.02 0.39 0.34 0.35 0.33 0.37 0.37 0.40 0.23 H09 Powells Creek @ Argonne Street 0.20 0.26 0.07 0.09 0.11 0.13 0.14 0.15 0.34 H10 Powells Creek @ Pomeroy Bridge 0.24 1.67 1.81 1.88 1.81 1.53 1.64 3.26 H11 Powells Creek @ Allen Street 1.77 1.87 1.90 1.93 1.98 2.01 2.03 2.05 2.32 H12 Powells Creek @ Brussels Street 0.42 0.50 0.48 0.46 0.50 0.50 0.50 0.51 0.60 H13 Powells Creek @ Warsaw Street 0.04 0.05 0.05 0.05 0.10 0.14 0.16 0.19 0.33
Table 25 Peak Flood flow (m3/s) through Homebush Bay Drive Bridge – Design Events
Location 1.0 EY 20% AEP 10% AEP 5% AEP 2% AEP 1% AEP 0.5% AEP 0.2% AEP PMF
Homebush Bay Drive Bridge
45 57 69 83 95 107 116 129 503
7.4.2. Provisional Flood Hazard Categorisation
The 2016 Powells Creek Revised Flood Study (Reference 2) defined provisional flood hazard categories in accordance with the NSW Floodplain Development Manual (Reference 6). Provisional hazards only take account of the hydraulic aspects of flood hazard; depth and velocity (Diagram 5), while true hazard takes into account additional factors such as size of flood, effective warning time, flood readiness, rate of rise of floodwaters, duration of flooding, evacuation problems, effective flood access, type of development within the floodplain, complexity of the stream network and the inter-relationship between flows.
Diagram 5: Provisional Hydraulic Hazard Categories
Extracted from The Floodplain Development Manual (Reference 6)
In recent years there has been several developments in the classification of hazard. Managing the floodplain: a guide to best practice in flood risk management in Australia (Reference 14) provides revised hazard classifications. These add clarity to the description hazard categories and what they mean in practice. This new methodology for determining hazard has been used in this study.
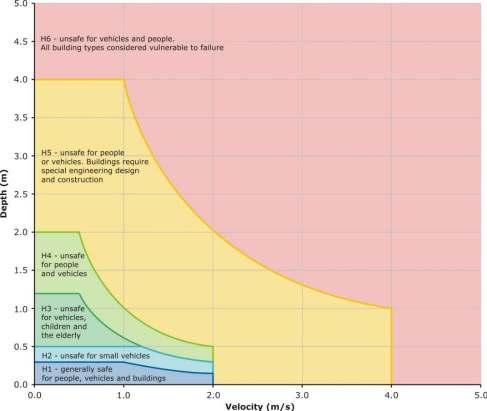
The hazard classifications are divided into six categories (Diagram 6) which indicate the restrictions on people, buildings and vehicles: • H1 - Generally safe for vehicles, people and buildings. • H2 - Unsafe for small vehicles. • H3 - Unsafe for vehicles, children and the elderly. • H4 - Unsafe for people and vehicles. • H5 - Unsafe for people or vehicles. Buildings require special engineering design and construction, and • H6 - Unsafe for vehicles and people. All building types considered vulnerable to failure.
Figure 18 provides the hazard classifications based on the H1 – H6 delineations for the design events. A summary of the 1% AEP (Figure 18F) mapping indicates: • the H5 and H6 classifications are predominantly within the Powells Creek open channel; • the majority of the land in the residential areas are H1 (note the land adjacent to the Powells Creek open channel may have a higher classification).
Diagram 6: Hazard Classifications (Reference 14)
7.4.3. Provisional Hydraulic Categorisation
The hydraulic categories, namely floodway, flood storage and flood fringe, are described in the Floodplain Development Manual (Reference 6). However, there is no technical definition of hydraulic categorisation that would be suitable for all catchments, and different approaches are used by different consultants and authorities, based on the specific features of the study catchment in question.
For this study, hydraulic categories were defined by the following criteria (Reference 15) which have been adopted by consultants in many flood studies in NSW: • Floodway is defined as areas where: o the peak value of velocity multiplied by depth (V x D) > 0.25 m2/s AND peak velocity > 0.25 m/s, OR o peak velocity > 1.0 m/s AND peak depth > 0.15 m
The remainder of the floodplain is either Flood Storage or Flood Fringe, • Flood Storage comprises areas outside the floodway where peak depth > 0.5m; and • Flood Fringe comprises areas outside the Floodway where peak depth < 0.5m.
7.4.4. Preliminary Flood Emergency Response Classification of Communities
The Floodplain Development Manual, 2005 (Reference 6) requires flood studies to address the management of continuing flood risk to both existing and future development areas. As continuing flood risk varies across the floodplain so does the type and scale of the emergency response problem and therefore the information necessary for effective Emergency Response Planning (ERP). Classification provides an indication of the vulnerability of the community in flood emergency response and identifies the type and scale of information needed by the SES to assist in ERP.
Criteria for determining flood ERP classifications and an indication of the emergency response required for these classifications are provided in the Floodplain Risk Management Guideline, 2007 (Reference 16). Table 26 summarises the response required for areas of different classification. However, these may vary depending on local flood characteristics and resultant flood behaviour, i.e., in flash flooding or overland flood areas.
Table 26: Flood ERP Classifications (taken from Reference 16)
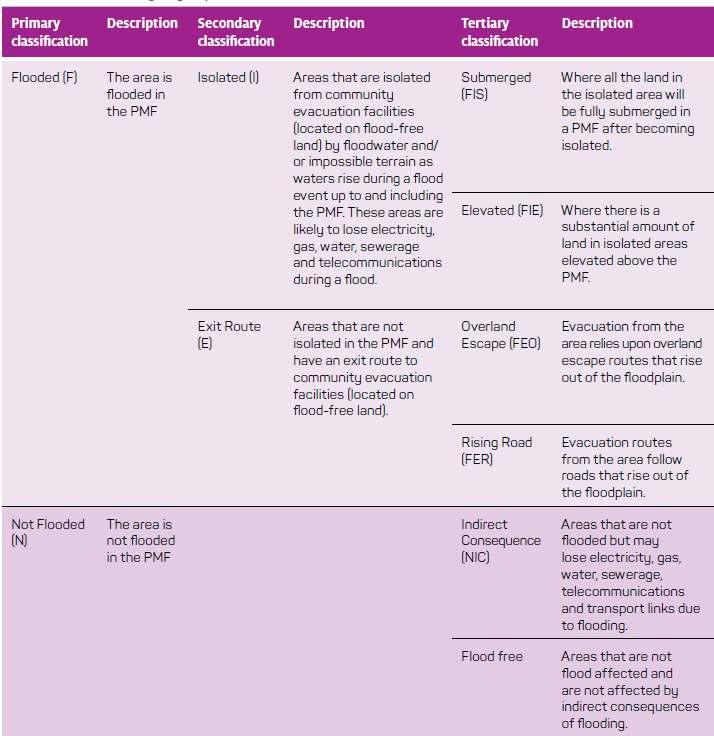
The criteria for classification of floodplain communities are generally more applicable to riverine flooding where significant flood warning time is available and emergency response action can be taken prior to the flood. In urban areas like the Powells Creek catchment, flash flooding from local catchment and overland flow will generally occur as a direct response to intense rainfall without significant warning. For most (if not all) flood affected properties in the catchment, remaining inside the building is likely to present less risk to life than attempting to drive or wade through floodwaters, as flow velocities and depths are likely to be greater in the roadway.
ERP classification for the study area is shown in Figure 20.
8. FLOOD FREQUENCY ANALYSIS
8.1. Overview
Flood frequency analysis (FFA) enables the magnitudes of floods (5%, 1% AEP etc.) to be estimated based on statistical analysis of recorded flows. It can be undertaken graphically or using a mathematical distribution.
The reliability of the flood frequency approach depends largely upon the length and quality of the observed record and accuracy of the rating curve. In addition, flood frequency inherently accounts for many assumptions which are required in rainfall-runoff routing for determining the magnitude of floods for annual exceedance probabilities.
This approach has the following advantages in design flood estimation: • no assumptions are required regarding the relationship between probabilities of rainfall and runoff. • all factors affecting flood magnitude are already integrated into the data. • estimation of rainfall losses is not required. • confidence limits can be estimated. • historic rainfall data is not required.
The flood frequency approach does, however, have some limitations. These are: • there is no “perfect” distribution”, thus different distributions will provide different answers. • as most flood records are relatively short (compared to the design event for which a magnitude is required) there is considerable uncertainty. Whilst rainfall records at a particular location are also short, data can be used by the BoM from other gauges to accurately estimate design intensities much greater than the period of record at a single gauge. • changes to the local topography such as levee banks, hydraulic controls and the construction of retarding basins or bridges can affect the homogeneity of the data set. • short to medium term climatic changes may influence the flood record; and • there are many issues with the accuracy of rating curves, especially at high flows. However, this is less of an issue with the use of hydraulic models based on high quality survey (ALS) to obtain site rating curves.
While some of these factors can affect the quality of the flood frequency analysis, for the purpose of providing confirmation for the runoff routing results they are considered reasonable.
The following is a summary of the flood frequency approach undertaken in the 2016 Powells Creek Revised Flood Study (Reference 2).
8.2. Examined Annual Series
Utilising the data presented in Table 13, various data sets of annual maximum levels are available for converting to flows for the purpose of FFA. These levels can be converted into flows using
one of the rating curves described in Section 3.4.2 and presented in Figure 7. Eight potential scenarios were evaluated for FFA.
8.3. Probability Distribution
ARR (Reference 5) recommends that FFA should be applied to peak flows rather than heights. In frequency analysis of flows, the fitting of a particular distribution may be carried out analytically or by fitting a probability distribution. The data may consist of an annual series, where the largest peak in each year is used, or a partial series, where all flows above a selected base value are used. The relative merits of each method are discussed in detail in ARR (Reference 5). In general, an annual series is preferable as there are more methods and experience available.
Many probability distributions have been applied to FFA and this is a very active field of research. However, it is not possible to determine the “correct” form of the distribution as there is no robust evidence that any distribution is more appropriate than another. ARR (Reference 5) provides further discussion on this issue.
Since publication of ARR (Reference 4) in 1987 there have been significant developments in the field of FFA both in Australia and overseas. The approach adopted in the 2016 Powells Creek Revised Flood Study (Reference 2) reflects these developments. Recent research has suggested that the fitting method is as important as the adopted distribution. The Flike flood frequency analysis software developed by Kuczera (Reference 17) uses the Bayesian approach and was utilised in this study.
The rating curve (height-discharge relationship) adopted for the estimation of stream flows from the recorded gauge heights is critical to the success of FFA. The FFA was conducted using the rating curve derived from the calibrated hydraulic model (refer Section 3.4).
Two probability distributions were tested, Log Pearson III (LP3) and Generalised Extreme Value (GEV) distributions and it was found that the LP3 distribution produced a better curve fit to the data.
8.4. Design Flow Results
The results of the FFA are provided on Figure 21 for the LP3 distribution. The choice of distribution was found to have some influence on design flow estimates. It was found that the LP3 distribution fit the annual series data better than the GEV distribution and was therefore selected in preference for determining design flows.
8.5. Reconciling Flood Frequency and Rainfall Runoff Results
An extensive flood frequency analysis (FFA) was carried out in the 2016 Powells Creek Revised Flood Study (Reference 2) at the Elva Street water level gauge. When compared to FFA design flow estimates (Figure 21), those from TUFLOW overestimate flows for more frequent events and generally accord with the FFA greater events.


