
40 minute read
Diagram 4: Rainfall Temporal Pattern Bins


A limited number of gaugings (height v velocity measurements) have been undertaken enabling the construction of a rating curve (height versus flow). Whilst in theory this approach appears very simple it becomes complex for several reasons, including: • the events occur within a few hours and thus it was very hard for the UNSW staff to get to the gauge whilst a flood was in progress. • the above means that there are several low flow gaugings but very few high flow gaugings which are more relevant for use in a flood study. • a gauging was taken by the UNSW at high flows which produced velocities above the rating of the instrument (say above 5 m/s). Thus, even this gauging could not confidently determine the peak flow.
Rating curves from various sources are provided on Figure 7.
Advertisement
2.9.2. Sydney Water Gauge
This gauge, which is located on Powells Creek under the M4, has only recorded one significant flood (January 1996) since it was installed in 1995. The gauge zero is RL 2.15 m AHD and the January 1996 flood peaked at 2.04 m (4.19 m AHD) at 14:05 hours. Three streamflow gaugings have been undertaken. All gaugings are below 0.1 m gauge height (flow <2 m3/s). Extrapolation of the rating curve based on these data is not appropriate and as a result flow data from this gauge have not been used for calibration of the hydrologic model.
2.10. Flood Levels from Debris or Other Marks
2.10.1. Resident Interviews
As part of the 1998 Powells Creek Flood Study (Reference 1) and earlier studies (refer Table 1) questionnaires were distributed to residents to collect information about past flood events. Prior to the 1998 Powells Creek Flood Study the responses were generally concerned with drainage issues (blocked pits, minor overland flow) and not with identifying historical flood levels. The only exception to this was at Airey Park (Saleyards Creek) for the January 1996 event.
Data obtained from residents should be used with caution for several reasons, including: • residents may have only been in the study area for a short period. • residents may have “missed” a flood whilst they were away. • the more recent events are remembered more clearly than (say) a larger event several years ago. • some events noted by residents may be because of a blocked drain or other local factors and are more typically referred to as local drainage problems rather than flood related. • residents can easily forget the date of a flood or become confused about the extent and nature of the problem. Experience has shown that water entering a house may have resulted from a leak in the gutter or a local drainage problem in the yard rather than overbank flow from the main creek.
Table 8 provides the most widely remembered events obtained from the results of the 1998 Powells Creek Flood Study (Reference 1) and previous questionnaire surveys. Note the questionnaire surveys were not provided to Canada Bay residents.
Table 8: Significant Floods Obtained from 1998 Flood Study Questionnaire
Approximate Date Comment
? 1930's Infrequently mentioned. 1943 Infrequently mentioned. 18 February 1959 Infrequently mentioned. ? 1960's Infrequently mentioned. November 1961 Infrequently mentioned. ? 1964 Infrequently mentioned. ? 1973 Infrequently mentioned. August 1986 Appears to be the largest event in the last 30 years March/April and July 1988 Infrequently mentioned. January 1989 Widely remembered. February 1990 Widely remembered, larger than 1996 in Saleyards Creek March 1990 Infrequently mentioned. April 1990 Infrequently mentioned. March 1991 Widely remembered. 2 December 1992 Infrequently mentioned. February 1995 Infrequently mentioned. October 1995 Infrequently mentioned. June 1995 Infrequently mentioned. December 1995 Infrequently mentioned.
Table 8 indicates that 50% of the most widely remembered events are in the 1990's. This could suggest that flooding in the 1990's has been a major issue compared to other periods. This is unlikely to be the case, and merely reflects some of the points noted previously regarding obtaining data from residents. Clearly the gauge record (Figure 6) indicates the period from 1958 to 1974 had more large floods.
As part of the 1998 Powells Creek Flood Study (Reference 1) 125 questionnaires were returned out of approximately 800 hand delivered or mailed (to non-resident owners) with some followed up by telephone or field interview. Table 9 summarises the results from this survey.
Table 9: 1998 Flood Study Questionnaire Results
Total number of questionnaires returned (Note SMC LGA only) 125 (approx.15%)
Number who responded indicating that their property had been inundated by a water depth greater than 100 mm. 60 (49%) Number not inundated. 65 (52%) Number who could indicate a historical flood level. 39 (31%) Number of buildings inundated above floor level*. 6 (5%) Note: * Previous questionnaire surveys have indicated that other buildings have been inundated above floor level.
A questionnaire was distributed as part of the 2016 Powells Creek Revised Flood Study (Reference 2) with several responses identifying recent occurrences of flooding. The reported flooding was generally less than 0.1 m and would be considered nuisance flooding and has only been for general verification of model results. Further details of prior community consultation are given in Section 2.12.
2.10.2. Surveyed Flood Levels
Several historical flood levels were collected from field interviews as part of the 1998 Powells Creek Flood Study (Reference 1). Many levels were for either the January 1996 or the February 1990 events. These are shown in Table 10 and on Figure 8.
Table 10: Historical Flood Data from Field Interviews in August 1997 as part of Reference 1
Address Date of Flood Depth (m) Description Flood Level (m AHD)
No. 21 Llandilo Avenue
No. 8 Agnes Street
No. 41 Albyn Road
No. 47 Albyn Road
Approx 1990 0.05-0.08 Garage Floor Level 29.96
Approx. 1990 0.8 North-West Corner 28.8
Jan-96 0.1 Driveway and Front Boundary 26.71
Jan-96 0.08 Crest of Driveway 22.54 Jan-96 0.35 Low Point along West. Boundary 21.64 Jan-96 0.25 Garage Floor Level 21.18
No. 35 Redmyre Road
Jan-96 0.05-0.1 Crest of Driveway 13.26 Jan-96 0.5 Ground Level at Back Fence 12.13
No. 37 Redmyre Road
Jan-96 0.05-0.1 Crest of Driveway 13.27 Jan-96 0.3 Ground Level at Garage 12.21 No. 45 Churchill Avenue Jan-96 0.1 Base Steps at Front House 10.74 No. 60 Churchill Avenue Jan-96 0.2 Ground Level at Path Granny Flat 11.49 No. 66 Churchill Avenue 18th February 1959 0.3 Floor Level 12.06
Upstream Railway crossing near Elva Street
Unknown Top coping LHS looking Downstream 8.1 Top coping RHS looking Downstream 7.83
Pharmacy adjoining Plaza Entrance, The Boulevarde Jan-96 Floor Level - water entered shop 12.29
No. 11 The Boulevarde (Gumbleys Butchery - now gone)
Nov-61 0.3 Estimated Floor Level 12.55
No. 26 Barker Road Regularly 0.1 Drive at Boundary 25.83
No. 65 Oxford Street
No. 63 Oxford Street
No. 61 Oxford Street
Jan-96 0.45 Carport Slab Jan-96 0.3 South-West corner of house 24.16
23.75
Jan-96 0.5 Garage Floor Level 23.24
No. 59 Oxford Street
Jan-96 - Patio Level No. 141 Albert Street Approx. 1990 0.3 Ground level along eastern fence 23.14
19.51
Address
Date of Flood Depth (m) Description Flood Level (m AHD)
No. 135 Albert Street Approx. 1990 0.5 Bottom steps rear of house 18.49
No. 137 Albert Street
Feb-90 - Crest of driveway 19.24 Feb-90 - Water reached floor level 19.01 No. 100 Beresford Road Feb-90 0.1 Driveway at entrance to house 15.91 No. 102 Beresford Road Feb-90 0.12 Ground level at back door 16.43 No. 104 Beresford Road Feb-90 0.55 Ground level rear house 17 No. 110 Beresford Road Feb-90 0.35 Midway along eastern fence 17.5 No. 53 Beresford Road Feb-90 0.05 Garage floor level 15.29
No. 108 Beresford Road Feb-90 0.34 Base steps rear house 17.49
No. 89 Rochester Street Feb-90 0.1 Floor level shop 12.84
No. 107 Rochester Street Jan-89 0.45 GL at rear of house 14.12
No. 109 Rochester Street
Feb-90 0.42 Base steps rear house 14.33
Jan-96 0.24 Base steps rear house 14.15
No. 57 Rochester Street Jan-96 0.41 Ground level back yard 9.92 No. 28 Broughton Road Approx. 1992 0.24 North east corner of house 12.88 No. 33-35 Burlington Road 1989 0.3 Garage Floor Level 9.14 No. 38-46 Burlington Road (Hairdresser) Feb-90 0.48 Ground level at rear shed 9.71 No. 48 Burlington Road Jan-96 0.1 Ground Floor Level 9.55
No. 29 Burlington Road Feb-90 - Stormwater reached this level at rear of factory 9.16
No. 30 The Crescent (Unit No. 2)
Jan-96 0.4 Garage Floor Level 8.7
No. 31 The Crescent
Jan-96 0.2 Garage Floor Level 8.33
No. 79 The Crescent
Feb-90 0.3 Floor level 8.2
Jan-96 0.28 Base patio at rear 7.75
No. 12 Loftus Crescent Feb-90 0.15 Ground level backyard 7.87 No. 82 Underwood Road Feb-90 0.45 Ground level at front house and driveway 4.97 No. 86 Underwood Road Jan-96 0.3 Base steps front house 4.89 No. 90 Underwood Road Jan-96 0.16 Base steps front of house 4.74 No. 22 Ismay Avenue Approx. 1986 0.3 Ground at back fence 2.2
No. 34 Ismay Avenue Jan-90 0.35 Path at back door 2.57 No. 60 Ismay Avenue Jan-96 0.1 Ground level at front of house 3.83
No. 55 Ismay Avenue
Feb-90 0.37 Base front steps 4.3
Jan-96 0.18 Base front steps 4.11
No. 51 Ismay Avenue Feb-90 0.3 Base front steps 4.19
Address Date of Flood Depth (m) Description Flood Level (m AHD)
No. 56 Ismay Avenue Feb-90 0.2 Base front steps 3.83
No. 49 Ismay Avenue Jan-96 0.22 Base front steps 4.16
No. 48 Ismay Avenue Jan-96 0.15 Base front steps 3.43
No. 41 Ismay Avenue
Feb-90 0.14 Base front steps 3.71
Jan-96 0.07 Base front steps 3.64
No. 17 Pemberton Street 1992 0.4 Ground level backyard 16.95
No. 27 Pemberton Street 1992 0.17 Base steps rear house 18.72
No. 10 Mitchell Road
No. 6 Mitchell Road
Jan-96 0.28 Ground level low side house Jan-96 0.24 Ground level low side house 14.75
14.35
No. 104 Arthur Street Jan-96 0.27 Ground level front of house 13.87
No.106 Arthur Street
Jan-96 0.34 Ground level at boundary 13.85
No. 105 Arthur Street Jan-96 0.55 Ground level at house steps side house 13.89
No. 29 Arthur Street
Jan-96 0.16 Base front steps 13.23 Jan-96 0.4-0.5 Ground level at rear fence 12.98
No. 6 Kessell Avenue
Airey Park Photos
Jan-96 0.44 Ground level at fence 7.76 Feb-90 - Water reached floor level 8.42 Jan-96 0.75 Base wall No. 77 7.65
2.10.3. Sydney Water Data
SWC holds records of flooding on Powells Creek and the relevant information is provided in Table 11. These records show no instances of flooding in 1990 and only one record (Feb 1996) since 1988.
Table 11: Sydney Water Records of Flooding in the Powells Creek Catchment
Date Flooded From Address Depth (m) Level Above Floor (m) Level Above Coping (m) Property Inundation Comments
?/07/1952 135 Albert Road, Strathfield 6/05/1953 Lot 3, Allen St, Homebush 6/05/1953 4-6 Elva St, Strathfield
6/05/1953 36 Minna St, Burwood
6/05/1953 Lot 2 Bates St, Homebush (cnr The Crescent) 6/05/1953 103 Parramatta Rd, Strathfield 9/02/1956 8-10 Elva St, Strathfield Y Flooding due to construction activity-water supply. Loss of goods. Flooding occurred where Council's bridge restricts the flow Flooding occurred where the channel is deficient in capacity Flooding occurred where the channel & Council's subsidiary drainage works are deficient Flood waters crossed the road where Council's culvert is deficient in capacity Flooding occurred where the channel is covered at coping level. 0.45 Y At the future gauging site
Date Flooded From Address Depth (m) Level Above Floor (m) Level Above Coping (m) Property Inundation Comments
9/03/1958 2A Belgrave St, Burwood 0.37
9/03/1958 4-6 Elva St, Strathfield
9/03/1958 9 Bold St, Burwood (Minna St, Burwood - west of its intersection with Bold St) 9/03/1958 33 Nicholson St, Burwood 9/03/1958 20 Woodside Ave, Burwood 9/03/1958 36A Nicholson St, Burwood
9/03/1958 24 The Boulevard, Strathfield
17/02/1959 5 Bold St, Burwood 0.53
0.1
0.15
0.05
0.6
0.45
17/02/1959 7 Bold St, Burwood
18/02/1959 4-6 Elva St, Strathfield 0.56 Y Flooding occurred above garage floor level at rear of house, but .28m below floor level of house
18/02/1959 2 Elva Street, Strathfield
18/02/1959 58 Churchill Avenue
18/02/1959 66 Churchill Avenue 1.5 Y 1.5 m above the kitchen floor. No damage was reported and the kitchen floor is considerably lower than the back yard.
0.3 Y 0.3 m above the floor. Water coming from Redmyre Road has swept through the house and damaged carpets and furniture. Many premises had been flooded.
18/02/1959 27 Minna St, Burwood 0.84
30/10/1959 7 Bold St, Burwood
17/11/1961 53 Ismay Ave, Homebush 19/11/1961 19 Oxford St, Burwood
19/11/1961 21 Morwick St, Strathfield 19/11/1961 26 Morwick St, Strathfield
19/11/1961 41 Woodside Ave, Burwood 19/11/1961 19 Oxford St, Burwood
19/11/1961 62/64 Oxford St, Burwood 0.15
0.3
0.025 Y New block of home units, water rose to within .025m of floor level & 0.38m above laundry floor.
0.15 Flooding of road only?
0.75 Flooding
Y Water banked up to a max. of 0.53m deep against the northern fence of Minna St.
Flooding of road only?
Flooding of road only?
Y Water (0.05) deep northern side Nicholson St & sewer surcharge in No. 6A Y Flood entered the shop and damaged the stock- insufficient inlets Y Flooding occurred above garage floor level at rear of house, but 0.65m below floor level of house
1.14 Y 1.14m above the coping level of the Stormwater channel at Gauging Station. Floodwater entered the Elva Street and carried some of the timbers away
1.24 Y
Y Flooding occurred above the yard level at N/W corner of house but was 0.35m below floor level of house Slight flooding only. Flood water rose to 0.30m above footpath level, no houses flooded Y Flooding of homes reported.
Y Above floor flooding
Y Above floor flooding
Y Brick fence along the frontage collapsed Y Above floor flooding
Y Extensive damage to fencing & back gardens
Date Flooded From Address Depth (m) Level Above Floor (m) Level Above Coping (m) Property Inundation Comments
19/11/1961 4-6 Elva St, Strathfield
19/11/1961 8-10 Elva Street
19/11/1961 7 Bold St, Burwood. 0.87
19/11/1961 27 Minna Street
19/11/1961 35 Nicholson Street 0.73
19/11/1961 11 The Boulevarde (Gumbleys Butchery), Strathfield. 19/11/1961 2 Elva St, Strathfield (U/S main Western Railway Line)
7/05/1963 2 Elva Street, Strathfield
20/12/1963 12, 13, 14, 15, 16 & 17 Brunswick St, Strathfield
20/12/1963 2 Elva St, Strathfield, (Railway viaduct on Main Western Line) 9/06/1964 2 Elva St, Strathfield - Sydney Night Patrol
11/06/1964 2 Elva St, Strathfield - Sydney Night Patrol
15/04/1969 177 Parramatta Rd, Homebush 29/10/1972 2 Elva St, Strathfield - Sydney Night Patrol
29/10/1972 11 Pilgrim Avenue
29/10/1972 2 Elva St, Strathfield (Railway Culvert under the Main Western Line) 17/03/1983 167-173 Parramatta Road, Homebush
8/11/1984 7-9 Underwood Road, Homebush 8/11/1984 Lot 2 Bates St, Strathfield (cnr The Crescent, Railway Culvert upstream) 0.3 Y Flood level 300 mm above footpath. Above floor flood in one work-shop- 150mm
0.3 Y Harrisons Timber P/L flooded. Damage to motors & furniture. Y Flood water was just below the floor level. Garden was ruined. Photos available Y Severe flooding. Flood water rose to 0.75m above footpath level on North side of Minna St - 19th 4.00 a.m. The water was held back by the side palings of the house No.7 Bold Street but eventually found an outlet through No. 27 Minna Street. Y Water rose .1m below the floor level of the rear house Y Water level was 0.73 m above ground level and .3 m below the floor level. Y Water entered several shops & rose to about 0.30m above floor in Gumbleys Butchery at No. 11 Considerable damage done along route of main channel. S/water unable to reach underground drains flowed over ground surface to low lying areas & followed course of original creek downstream. 0.6 Y Observed at 8.15am. High tide at 7.15 am= 1.4m? Y Flooding of roadway & front yards did not enter premises. Date of rainnot clear 0.75 Y No apparent damage to properties.
1.52 Y Flooding caused by culvert under railway + 2 curves immediately upstream. Property flooding = .9m above ground 0.46 Y Flooding caused by culvert under railway + 2 curves immediately upstream. Y A brick retaining wall collapsed at Saleyards Ck Bch. Poor foundation Y Water rose to 1.22m above brickwork recently added to walls within this property. Vehicles were submerged & a wooden bridge lifted & dumped 9m downstream. Y Basement of a block of home units was flooded by approximately 1 metre. Embankment surcharged - see photo
0.6 Y Debris mark on the fence
0.6 Y Debris on the embankment
Date Flooded From Address Depth (m) Level Above Floor (m) Level Above Coping (m) Property Inundation Comments
29/04/1988 53 Ismay St, Homebush
29/04/1988 Flemington Markets, Parramatta Rd, Homebush 29/04/1988 Lot 2 Bates St, Homebush (U/S of The Crescent, Homebush)
7/05/1988 32 The Crescent, Homebush 2/02/1996 Lot C Allen St, Nth Strathfield
2/02/1996 24 Pomeroy St, Strathfield Y Surface flooding of 5 houses in Ismay Ave & overland flow at Powell St. Channel overflowed near markets.
0.3 Y Was contained within the banks. Flood debris 800 mm above the ground at upstream railway line culvert Y Above floor flooding. Damage $10,000
0.3 Y Debris on adjacent fences indicated water flowed 500mm above upstream headwall. Flooding confined to adjacent park.
2.11. Flood Photographs
Several flood photographs taken during floods were provided by SMC (all these are within the Strathfield LGA) and these are shown on Figure 5. Canada Bay Council provided two flood photographs as shown on Photo 2.
Photo 2: Flood Photographs provided by Canada Bay Council

2.12. Community Consultation
Community consultation was undertaken as part of the 2016 Powells Creek Revised Flood Study (Reference 2) to inform the community about the study and gather information on historical flood events. A one-page newsletter detailing the study’s purpose was sent to approximately 300 addresses in the study area which excluded Burwood and Canada Bay LGA.
From the questionnaire, twelve responses were received, constituting a response-rate of around 5%. The results from the questionnaires are as follows: • All responses were from residential properties, with most having lived there for more than 15 years. • 7 respondents had experienced flooding, with all instances involving water above floor level of the house or other buildings.
• Approximately 9 events in the last 20 years were identified as causing flooding, with flooding reported in 1995, 1996, 1998, 2005, 2010, three times in 2014 and 2015.
However, most events had only one reported instance of flooding, and apart from a 0.3 m depth reported for 1995, all depths were 0.2 m or less. No event was consistently mentioned in the responses which suggests that some variation in flood behaviour occurred between similar events, for example due to pit or pipe blockage, location of the rainfall burst or localised effects on flow behaviour.
Figure 8 shows the location of the respondents, alongside the previous consultation and the Sydney Water historical data.
3. APPROACH
The approach adopted in flood studies to determine design flood levels largely depends upon the objectives of the study and the quantity and quality of the data (survey, flood, rainfall, flow etc.). Whilst there is a limited flood record from the Elva Street gauge there is no extensive historical flood record elsewhere on Powells Creek or on Saleyards Creek. A flood frequency approach can be undertaken at the Elva Street gauge. However, reliance must also be made on the use of design rainfalls and establishment of a hydrologic/hydraulic modelling system to determine design flood levels away from the gauge. A diagrammatic representation of the flood study process undertaken in this manner is shown on Diagram 2.
Diagram 2: Flood Study Process

The estimation of flood behaviour in a catchment is undertaken as a two-stage process, consisting of:
1. hydrologic modelling to convert rainfall estimates to overland flow and stream runoff; and 2. hydraulic modelling to estimate overland flow distributions, flood levels and velocities.
As such, the hydrologic model, DRAINS, was built and used to create flow boundary conditions for input into a two-dimensional unsteady flow hydraulic model, TUFLOW.
Good historical flood data facilitates calibration of the models and increases confidence in the estimates. The calibration process involves modifying the initial model parameter values to produce modelled results that concur with observed data. Validation is undertaken to ensure that the calibration model parameter values are acceptable in other storm events with no additional alteration of values. Recorded rainfall and stream-flow data are required for calibration of the hydrologic model, while historic records of flood levels, velocities and inundation extents can be used for the calibration of hydraulic model parameters. In the absence of such data, model verification to peak level data is the only option and a detailed sensitivity analysis of the different model input parameters constitutes current best practice.
The use of a flood frequency approach for the estimation of design floods and/or independent calibration of the hydrologic model is possible for the Powells Creek catchment using the Elva Street water level gauge data.
The broad approach adopted for this study was to use a widely utilised and well-regarded hydrologic model to conceptually model the rainfall concentration phase (including runoff from roof drainage systems, gutters, etc.). The hydrologic model (DRAINS - Reference 5) used design rainfall patterns specified in ARR2019 (Reference 5) and the runoff hydrographs were then used in a hydraulic model (TUFLOW - Reference 10) to estimate flood depths, extents, velocities and hazard in the study area.
The sub-catchments in the hydrologic model were kept small such that the overland flow behaviour for the study area was generally defined by the hydraulic model. This joint modelling approach was then verified against previous studies and historical data where possible.
3.1. Hydrologic Model
Inflow hydrographs are required as inputs at the boundaries of the hydraulic model. Typically, in flood studies a rainfall-runoff hydrologic model (converts rainfall to runoff) is used to provide these inflows. A range of runoff routing hydrologic models is available as described in ARR2019 (Reference 5). These models allow the rainfall depth to vary both spatially and temporarily over the catchment and readily lend themselves to calibration against recorded data.
DRAINS is a hydrologic/hydraulic model that can simulate the full storm hydrograph and can describe the flow behaviour of a catchment and pipe system for real storm events, as well as statistically based design storms. It is designed for analysing urban or partly urban catchments where artificial drainage elements have been installed.
Runoff hydrographs for each sub-catchment area are calculated using the time area method and the conveyance of flow through the drainage system is then modelled using the Hydraulic Grade Line method. DRAINS is limited to development of hydrological inputs into the downstream TUFLOW model and is not used to determine flood levels.
3.2. Hydraulic Model
The availability of high-quality LiDAR/ALS data means that the study area is suitable for twodimensional (2D) hydraulic modelling. Various 2D software packages are available and the TUFLOW package (Reference 10) was adopted as it is widely used in Australia.
The TUFLOW software is produced by BMT WBM and has been widely used for a range of similar projects. The model is capable of dynamically simulating complex overland flow regimes. It is especially applicable to the hydraulic analysis of flooding in urban areas which is typically characterised by short duration events and a combination of supercritical and subcritical flow behaviour.
The study area consists of a wide range of developments, with residential, commercial, and open space areas. The study area objectives require accurate representation of the overland flow system including kerbs and gutters and defined drainage controls.
For the hydraulic analysis of complex overland flow paths (such as the present study area) where overland flow occurs between and around buildings), an integrated 1D/2D model such as TUFLOW provides several key advantages when compared to a 1D only model. For example, a 2D approach can: • provide localised detail of any topographic and/or structural features that may influence flood behaviour. • better facilitate the identification of the potential overland flow paths and flood problem areas. • dynamically models the interaction between hydraulic structures such as culverts and complex overland flow paths; and • inherently represent the available floodplain storage within the 2D model geometry.
Importantly, a 2D hydraulic model can better define the spatial variations in flood behaviour across the study area. Information such as flow velocity, flood levels and hydraulic hazard can be readily mapped across the model extent. This information can then be easily integrated into a GIS based environment enabling the outcomes to be readily incorporated into planning activities. The model developed for the present study provides a flexible modelling platform to properly assess the impacts of any overland flow management strategies within the floodplain as part of the ongoing floodplain management process.
In TUFLOW the ground topography is represented as a uniformly spaced grid with a ground elevation and a Manning’s “n” roughness value assigned to each grid cell. The grid cell size is determined as a balance between the model result definition required and the computer run time (which is largely determined by the total number of grid cells).
3.3. Australian Rainfall and Runoff 2019
ARR2019 (Reference 5) has introduced many changes to the data and methodology used on flood studies compared to ARR1987 (Reference 4).
3.3.1. Overview
The ARR guidelines were updated in 2019 due to the availability of numerous technological developments, a significantly larger rainfall dataset since the previous edition in 1987 and development of updated methodologies. The rainfall dataset includes a larger number of rainfall gauges which continuously recorded rainfall (pluviometers) and a longer record of storms (events from 1985 to 2015 are included).
This study updates the flood study of the entire Powells Creek catchment in accordance with the ARR2019 methodologies.
3.3.2. ARR2019 – Design Rainfall Update
Three major changes have been made to the approach adopted in ARR1987 (Reference 4) in ARR2019 (References 5). 1. The recommended Intensity, Frequency and Duration (IFD) rainfall data and initial and continuing loss values across Australia have been updated based on analysis of available records (available on the BoM website). 2. ARR2019 recommends the analysis of 10 temporal patterns for each storm duration to determine the critical storm event. The critical storm event for a duration corresponds to the temporal pattern which produces the maximum average peak value from the 10 storms: and 3. The inclusion of Areal Reduction Factors (ARFs) based on Australian data for short (12 hours and less) and long durations (larger than 12 hours). ARFs are an estimate of how design rainfall intensity varies over a catchment, based on the assumption that large catchments will not have a uniform depth of rainfall across their entire area. Based on the size of the Powells Creek catchment an ARF was not used for this study.
3.3.3. IFD Data
Revised IFD curves are available on the BoM website. Diagram 3 indicates the change in rainfall intensities between the ARR1987 and ARR2019 IFD data sets for the study area. The following are noted. • there is an overall decrease in design intensities for the catchment for all durations greater than 10 minutes. • the decrease in design intensities is much higher (decreases up to 34%) for durations up to 6 hours.

Diagram 3: Change in Rainfall Intensity for 1% AEP and 5 % AEP 2019 v 1987 IFD
It is important to note that the rainfall duration which produces the peak flood levels (termed the critical duration) varies across the catchment. In the upper parts of the Powells Creek catchment, where the catchments are small, the critical duration may be 30 minutes but as the catchment size increases so does the critical duration. In the lower parts of the catchment the critical duration may approach 6 hours. Thus, based on Diagram 3 the volume of rainfall and likely runoff volumes (affected by loss rates) are reduced with the revised ARR2019 IFD data. The change in intensity for longer duration events (12 hours or more) is of little consequence for flooding in this catchment as these events do not produce the highest flood level.
3.3.4. Accuracy of the 2019 IFD Data
The 2019 IFD data can vary significantly from the previous 1987 IFD data (Diagram 3). This issue is addressed by the text below taken from the BoM's web site (May 2019).
The 2016 IFDs are based on a greatly expanded rainfall database and use contemporary methods for analysis of the rainfall data. In addition, the length of record available for each station has been maximised through quality control processes and Region of Influence methods. The 2016 IFDs provide a better overall fit to the current rainfall database than the old IFDs.
As with all statistical methods, there is a level of uncertainty in the derived results due to the variability inherent in the data sample. In the 2016 IFDs this uncertainty has been reduced through the increased sample size afforded by the additional years of recorded data and inclusion of significant amounts of rainfall data from water agencies around the country.
The process of developing the new IFDs was guided and reviewed by a panel of experts set up by Engineers Australia. The differences in methods between the new IFDs and the ARR1987 IFDs are summarised in the table below:
Method New IFDs ARR1987 IFDs
Number of rainfall stations Daily read - 8074 Continuous - 2280
Daily read - 7500 Continuous - 600 Period of record All available records up to 2012 All available records to up ~ 1983 Length of record used in analyses Daily read >= 30 years Continuous > 8 years Daily read >= 30 years Continuous > 6 years Source of data Bureau of Meteorology & other organisations collecting rainfall data Primarily Bureau of Meteorology Extreme value series Annual Maximum Series (AMS) Annual Maximum Series (AMS) Frequency analysis Generalised Extreme Value (GEV) distribution fitted using L-moments Log-Pearson Type III (LPIII) distribution fitted using method of moments
Extension of subdaily rainfall statistics to daily read stations Bayesian Generalised Least Squares Regression (BGLSR)
Gridding Regionalised at-site distribution parameters gridded using ANUSPLIN Principal Component Analysis
Maps hand-drawn to at-site distribution parameters, digitised and gridded using an early version of ANUSPLIN
3.3.5. Comparison of At Site Frequency Analysis from a Specific Rain Gauge to the IFD Data on the BoM's Website
A frequent question asked is why does the at site frequency analysis of a specific rain gauge within a catchment not always match up with the IFD data obtained from the BoM web site. This issue is addressed by the text below taken from the BoM's web site (May 2019).
Although at-site frequency analysis of the Annual Maximum Series (AMS) of observed rainfall was an integral part of the method adopted for the 2016 IFDs, it was only one of many steps used to produce the new gridded, regional IFDs.
A regionalisation method was applied to give more weight to longer record stations within each region. This improved the estimates of rare (less frequent) events. A spline interpolation method was then applied to the regionalised rainfall data from across Australia to estimate gridded values for the whole country. Factors including latitude, longitude, elevation and consistency with neighbouring sites were used, in addition to rainfall characteristics at recording sites, thus allowing more reliable interpolation of rainfall depths in data sparse areas.
Rainfall values from a Generalised Extreme Value (GEV) distribution fitted to the AMS at a specific duration for a particular site will vary from the point values extracted from the grid of IFD values. Although each event in the AMS is a record of the actual rainfall at a site, these measured rainfall values are effectively point samples of the rainfall distribution across Australia. Each point sample has its own uncertainty and does not represent completely the underlying population of rainfall values. The extracted grid values, created from the regionalised rainfall inputs, will generally fall within the 95% confidence limits of the GEV distribution for the specific duration at each location.
The length and period of record at a site makes a significant difference in the level of uncertainty of any at-site comparisons. Regionalisation was applied to the measured rainfall data to effectively smooth out the effects of sampling uncertainty.
3.3.6. Design Loss Data
Design initial and continuing loss values are available from the ARR2019 data hub. The Elva Street gauge has a flow rating curve but it is not considered viable to derive the design rainfall loss values from the limited historical events that are available. For calibration different loss rates can be adopted.
Current guidelines for design recommend using a range of initial losses (Table 12) that depend on the duration and the storm AEP. The data hub suggests a continuing loss of 1.8mm/h but Reference 11 suggests applying a factor of 0.4 to this value. The AEP neutral initial loss in Table 12 were used for the assessment as well as a continuing loss of 0.7 mm/h (0.4*1.8).
Table 12: Design Initial Loss Values from the Data Hub
Duration (min)
Annual Exceedance Probability 50% 20% 10% 5% 2% 1% 60 17.1 8.9 8.6 9.5 8.8 6.8 90 15.4 9.1 9.2 10.1 9.8 8.8 120 15.7 9.1 9.3 9.7 8.8 6.9 180 16.6 9.8 10.3 10.1 9.6 6.7 360 16.5 9.7 10.6 9.8 8.9 4.1
In an urban environment such as Powells Creek the effect of the initial loss is minimal due to the impervious nature of the catchment. Moreover, the small size of the Powells Creek catchment results in a short critical duration time (less than 6 hours) and therefore the influence of the continuous loss on the flows is also small.
3.3.7. Storm Temporal Patterns
ARR1987 provided a single temporal pattern for each storm duration for: • events less than a 30-year ARI; and • for events greater than a 30-year ARI.
ARR2019 provides several patterns for each storm duration. The temporal patterns were extracted from storms occurring across Australia and are different for each region. The data hub provides a table with all the temporal patterns that could be used at a given location. The temporal patterns are grouped in bins based on the intensity of the recorded storms as shown in Diagram
4.
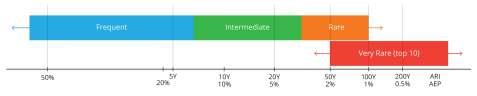
Diagram 4: Rainfall Temporal Pattern Bins
ARR2019 recommends the use of 10 temporal patterns for design storm analysis. The 10 patterns have the same total rainfall depth, but there are differences in rainfall distribution across the storm duration. Some patterns may represent storms with intense bursts at the start, middle or end of the storm duration, others represent storms with multiple bursts, and some may represent storms with constant rainfall. Different patterns can produce different peak flood levels for the same catchment area depending on the catchment topography and response.
The representative temporal pattern (used as part of the critical duration analysis) is the pattern which produces peak flood levels just greater than the average of the 10 temporal patterns (not the temporal pattern which produces the largest peak level) for each storm duration. This can be determined by running each of the 10 temporal patterns through the hydrologic and hydraulic models and obtaining the average flood level or peak flow produced. The critical storm duration for the catchment is the duration whose representative temporal pattern produces the maximum flow or level (i.e., the highest of the average values for all storm durations).
For this study peak flood levels were considered rather than peak flows. For each duration, a grid of the mean peak level at each grid cell was calculated, and from this a maximum grid was calculated taking the highest peak mean level for each grid cell. The adopted critical duration temporal pattern was the pattern which best matched or slightly exceeded this maximum grid at each grid cell.
3.4. Assessment of Data from UNSW Elva Street Gauge
3.4.1. Overview
It is important that the best possible use is made of the available data as this is the only urban catchment in Sydney where there is a long-term record for use in flood frequency analysis and which can be used to calibrate hydrologic (flows) and hydraulic (water level) models. However, there are several issues with the data, and these are discussed below.
3.4.2. Gaugings and Rating Curve
The cross-sectional area of the channel has not changed (lined ‘U’ shaped channel) since 1958 although the coping has been raised. The gauge zero is at RL 5.25 m AHD and over 29 stream gaugings (velocity measurements using a current meter) have been taken. The channel is well gauged below 1 m (RL 6.25 m AHD); there are 14 gaugings below 0.5 m (RL 5.75 m AHD); 14 gaugings between 0.5 m and 1.0 m; and the highest gauging is at 1.35 m (RL 6.6 m AHD). The gaugings show very little scatter and fit as a smooth line on log-log paper. Above 0.2 m depth the
flow tends to be supercritical, and velocities are very high (above 4 m/s). This is the greatest source of uncertainty in the gauging as the velocity is above the normal range of the current meter used to take velocity measurements.
There are four rating curves (Figure 7) namely: • used in Reference 8 and taken from UNSW records at the time. • used in the 1998 Powells Creek Flood Study (Reference 1). • used in the digital records. • used in the 2016 Powells Creek Revised Flood Study (Reference 2) referred to as the TUFLOW model rating curve.
The 1998 Powells Creek Flood Study (Reference 1) and digital record curves are practically identical and shown as the same on Figure 7. As part of the 2016 Powells Creek Revised Flood Study (Reference 2) a rating curve was produced from the TUFLOW model. All the prior curves, whilst based on various velocity gaugings aimed to extend the rating curve beyond the highest flow gauging height of 1.35 m (RL 6.6 m AHD).
It is interesting to note that the Reference 1 rating curve and the TUFLOW model rating curves are relatively similar in magnitude at a given height. The TUFLOW model rating produces a smaller flow up to approximately 1.8 m before transitioning to produce larger flows than the Reference 1 rating above this level.
Uncertainty between the prior rating curves listed above increases once the flow breaks out of the channel (approximately at 2.5 m or RL 7.75 m AHD). The channel may also choke downstream at very high depths. Since approximately the year 2000 there have been significant changes in the number and size of the bridges across the channel in the immediate reach upstream from the railway line. There is no complete record of the dates when bridges have been removed or installed. The presence of bridges will influence the high flow rating but for most of the historic record the events were not above the coping and thus not influenced by these changes.
3.4.3. For Use in Flood Frequency Analysis
Flood frequency analysis is the fitting of a statistical distribution to either the annual maxima peaks or a partial series (events above a threshold). Partial series analysis is not possible as there are too many gaps in the record. Whilst the gaps in the record also affect the annual maxima series it is expected that this approach will still provide a robust result. Derivation of the annual maxima needs to address whether the record should be based on just the digital record or whether it should be extended to include the data shown in Table 7, and whether the record should be extended from the end of the digital record (1997) to date. It is known that there have been no large events since 1997.
The present study has adopted the flood frequency analysis derived in the 2016 Powells Creek Revised Flood Study (Reference 2). A tabulation of the annual maxima from the various sources is provided on Table 13.
Year Peak Stage (m) from Reference 8
1958 Peak Stage (m) from Digital Records
1.48
Difference in Peak Stage (m)
Peak Flows from Reference 8 (m³/s)
1959 3.29 3.26 0.03 29.9 1960 1.30 1.12 0.18 11.1 1961 4.18 0.79 3.39 38.3 1962 1.69 1.74 -0.05 14.8 1963 2.40 2.47 -0.07 22.0 1964 3.52 1.88 1.64 32.1 1965 1.02 0.88 0.14 8.0 1966 1.28 1.23 0.05 10.9 1967 1.52 1.40 0.12 13.2 1968 0.84 0.70 0.14 5.9 1969 1.71 1.62 0.09 15.1 1970 3.09 1.43 1.66 28.0 1971 1.93 1.10 0.83 17.8 1972 3.20 2.76 0.44 29.1 1973 2.35 2.17 0.18 21.5 1974 2.34 2.23 0.11 21.4 1975 1.58 1.52 0.06 13.8 1976 1.70 1.25 0.45 14.9 1977 1.15 1.49 -0.34 9.6 1978 1.47 1.38 0.09 12.7 1979 1.27 1.22 0.05 10.8 1980 1.26 1.27 0.00 10.7 1981 1.41 1.38 0.03 12.1 1982 1.71 1.67 0.04 15.1 1983 1.83 1.80 0.03 16.8 1984 1.84 1.81 0.03 16.9 1985 1.30 1.21 0.09 11.1 1986 1.93 1.73 0.20 17.8
1987 1988 1989
1.18 1.92 1.28
1990 1991 1992 1993 1994
1.92 1.68 1.53 1.88 1.44
1995
1.31
1996 1997
0.90 0.86
Peak Flows from 1998 Flood Study Reference 1 (m³/s)
16.0 48.2 10.8 7.0 20.0 33.0 25.3 8.8 12.6 17.2 5.3 18.3 17.4 12.1 38.0 33.5 28.9 17.0 14.9 16.5 15.1 12.6 12.7 14.6 19.3 21.3 21.3 13.1 20.2 11.8 23.1 13.9 23.3 19.2 17.1
6.9 13.3 7.8 7.6
Peak Flows from Digital Record (m³/s)
16.1 49.1 10.6 5.9 20.3 32.1 22.5 7.2 12.3 14.9 4.7 18.4 15.4 10.3 37.3 27.1 28.0 16.7 12.6 16.3 14.6 12.1 12.8 14.6 19.1 21.2 21.4 11.9 20.1 11.4 23.1 13.0 23.1 19.2 16.9 22.4 15.4 13.4 7.4 6.9
3.5. Calibration and Verification of the Modelling Process
3.5.1. Approach
As flow data is available from the Elva Street gauge this means that the catchment hydrology (flows) can be calibrated and verified at this location. This is a significant advantage for this catchment as this is possible for only approximately 10 urban catchments in Australia and less than 5 in NSW. TUFLOW model peak levels and the shape of the hydrograph can also be calibrated to water level data from the Elva Street gauge.
In addition, peak levels from TUFLOW can be calibrated to observed water level data provided by
Council and Sydney Water (Section 2.10 and Figure 8).
The stages in the modelling calibration approach were as follows (the same as adopted in Reference 2): 1. collect available historical rainfall and water level data from prior references. 2. select events for calibration and verification based on the quality and quantity of available data (same events as adopted in Reference 2). 3. input historical rainfall data for calibration event to DRAINS. 4. input output of above DRAINS model to TUFLOW. 5. run TUFLOW for historical event. 6. compare output from TUFLOW for calibration event at the Elva Street gauge and other locations where historical flood height data are available. 7. rerun steps 3 to 6 and adjust model parameters until a suitable match is obtained. 8. rerun steps 3 to 6 for verification events without adjustment of model parameters. 9. compare output from TUFLOW from verification events at the Elva Street gauge and other locations where historical flood height data are available. 10. re-run steps 3 to 9 until a satisfactory calibration/verification is achieved.
3.5.2. Calibration Events
The choice of floods used in calibration depends upon several factors including the: • time since the flood occurred. The longer the time since a flood occurred, the greater the likelihood of subsequent changes to the catchment. The major changes in the upper catchment in recent times have been construction/alterations to buildings and fences in the floodplain and to the piped drainage system. The most significant change in recent times at the Elva Street gauge is construction of several bridges across the channel. However, as all the recent events suitable for calibration did not overtop the coping the impact of new bridges is not relevant. • quantity and quality of rainfall and streamflow data which are available. This should have been of lesser importance in this study as data are available from two well placed pluviometers and the Elva Street water level gauge. However, problems with the UNSW rainfall and water level data meant that this became the most important factor in determining the choice of events. • quantity, quality, and location of recorded levels along the creeks. It may be preferable to use a small flood with several levels which define a profile rather than a large flood with only one level. This issue is of little significance as there are few events with suitable recorded levels, apart from at the gauge. • magnitude of the flood levels. The larger the flood the more suitable it is for calibration as it is closer to the larger design flood events.
The following is a summary of the available data considered suitable for calibration in the 2016 Powells Creek Revised Flood Study (Reference 2).
2 January 1996
• the Elva Street water level gauge malfunctioned, and the Elva Street pluviometer had no digital record. The St Sabina pluviometer recorded 62 mm in 45 minutes.
• only record available for Sydney Water gauge under the M4. • 39 flood levels are available (Table 10). • at Enfield this event approached a 1% AEP (20 min to 60 min duration) but was approximately only a 5% AEP (or less) at the other gauges.
8 or 9 February 1992
• the Elva Street gauge recorded a peak level of 1.5m and it would appear from the available pluviometer records that this was not a large event. For this reason, it is not suitable for calibration purposes.
11 March 1991
• the Elva Street gauge recorded a peak level of 1.7m and the rainfall intensity approached a 10% AEP (30-minute duration) at Enfield but the lack of other flood height data and failure of both the UNSW pluviometers meant this flood was not suitable for calibration purposes.
18 March 1990
• the flood was approximately a 20% AEP event at the St Sabina pluviometer and a 5% AEP (30-minute duration) at the Elva Street pluviometer. The peak levels and flows at the Elva Street gauge are 1.92 m and approximately 23 m3/s (based on the UNSW rating curve). • the availability of water level and pluviometer records from the UNSW gauges meant that this event could be used for calibration at the Elva Street gauge. However, no flood height data were available for calibration of the TUFLOW model elsewhere.
February 1990
• four peaks occurred during February 1990 (3rd, 7th , 10th, and 17th). The water level and pluviometer data (UNSW gauges) are shown on Figure 9. The peak levels and flows (based on the UNSW rating curve) at the Elva Street gauge are: • 3rd Feb 1990 - 1.4 m - 14 m3/s. • 7th Feb 1990 - 1.4 m - 15 m3/s. • 10th Feb 1990 - 1.8 m - 21 m3/s. • 17th Feb 1990 - 1.1 m - 11 m3/s. • several flood levels (assumed to be for 10th February 1990) are available (Table 10). • the 10th of February event was approximately a 20% AEP rainfall event (30-minute and 60-minute durations). • the water level records indicate a peak on the morning of 8th February 1990. This is not compatible with the rainfall record which indicates that the peak was approximately 24 hours earlier. It has been assumed that the timing on the water level gauge malfunctioned. • the availability of pluviometer and water level data from the UNSW gauges meant that all four events could be used for calibration at the Elva Street gauge. The largest event (10th February) was suitable for calibration of the TUFLOW model as it is presumed the recorded flood levels relate to this event.


