Edmond Housing Assessment


Prepared for the City of Edmond
August 2023


Prepared for the City of Edmond
August 2023

We are thrilled to present the final report of the Edmond Housing Assessment, which encapsulates months of dedicated research, analysis, and community engagement. Our mission was to study Edmond’s housing opportunities, understand its challenges, and develop strategies and policies to advance the community’s housing goals. With the support and collaboration of the City Council, housing partners, and the community, we have achieved a comprehensive understanding of Edmond’s housing landscape.
The Housing Assessment aimed to ensure that suitable housing options are available in Edmond for all residents, regardless of their backgrounds, ages, and income levels. Our committee’s research considered the conversations and concerns expressed by frontline workers, educators, healthcare professionals, and other vital occupations who face difficulties finding suitable housing in our city. We also recognized the ongoing debate surrounding rental housing distribution and the scarcity of available options in both the sale and rental markets.
As someone who works day in and day out in the real estate and housing industry, I was not surprised by these results. I often hear stories about how difficult it can be to find housing in Edmond, especially at lower price points. In many cases, these individuals grew
up in Edmond and are returning home, yet finding it a struggle to secure housing at a price they can afford.
We firmly believe that the recommendations within this report will empower the City of Edmond and its housing partners to make informed decisions about planning and investing in suitable housing for all residents. The strategies, policies, and tools outlined herein will equip decision-makers with the means to navigate the complexities of our housing landscape effectively.
We extend our heartfelt gratitude to the City Council, city staff, community members, and housing partners who actively participated in this process. Your contributions, insights, and unwavering support have been instrumental in shaping this report. The Edmond Housing Assessment stands as a testament to our shared dedication to improving the lives of our residents and enhancing the vibrancy of our community.
Jenni DuncanOn behalf of the Edmond Housing Assessment Steering Committee
CEO, The Duncan Group, Sage Sotheby’s International Realty

Martha Ball
Trustee, Edmond Economic Development Authority

Brian Blundell
Commercial Loan Officer & Senior Vice President, BancFirst
Randy Decker
Associate Superintendent - Human Resources, Edmond Public Schools
Nicole Doherty
UCO Residential Life Director of Community Engagement, University of Central Oklahoma
Mary Dulan
Executive Director, Metro Fair Housing
Jenni Duncan
CEO, The Duncan Group, Sage Sotheby’s International Realty
Angela Grunewald
Superintendent, Edmond Public Schools

Sherry Jordan
President & CEO, Edmond Chamber of Commerce
Jenny Landes
Board President, Turning Point Ministries
Caleb McCaleb
President, McCaleb Homes
Richard McKown
Community Developer & Designer, SSLM Development
Chris Sperry
Executive Director, HOPE Center of Edmond
Ronnie Williams
Advisor & Past President, Edmond Neighborhood Alliance
Christy Batterson
Housing & Community Development Manager, Planning
Department
Destiny Andrews
Associate Long-Range Planner
Bill Begley
Marketing & Public Relations Manager
Courtney Bradford
Marketing & Public Relations Assistant
Ken Bryan
Long-Range Planner
Randy Entz
Director of Planning & Zoning
Julianna McCullough
Community Development Block Grant (CDBG) Coordinator

Corey Winston
Housing & Community Development Assistant
Consultant Team
Justin Carney, Principal
Andy Pfister, Principal
Jenny Connelly-Bowen, Project Manager
Olivia Borland, Project Planner
Catherine Kazmierczak, Project Planner
Gaargi Kulkarni, Project Planner
Richa Singh, Project Planner
Megan Hinrichsen, Art Director
Carolyn Flesaker, Research Analyst
Anjali Katare, Research Analyst
VENICE COMMUNICATIONS
Jayne Siemens, President
Image credits
Development Strategies, unless otherwise noted
49 Strategy 1
Reduce barriers to expanding production of all housing types, for-sale and for-rent
55 Strategy 2
Diversify types and price points of housing
61 Strategy 3
Facilitate the improvement of older housing stock condition while preserving affordability
65 Strategy 4
Support employers, economy, and workers through workforce housing
73 City Council’s Role
75 Priority 1: Ensure Edmond’s new zoning code allows more housing diversity
75 Priority 2: Form a Housing Task Force
76 Priority 3: Establish a Housing Fund
77 Priority 4: Establish a baseline of housing/ neighborhood conditions
77 Priority 5: Create an education campaign about Edmond resident and worker experiences with housing
78 What is the potential impact of a housing fund?
79 Implementation Matrix
87
95

Edmond’s leadership recognized that housing affordability is a major challenge in recent years. This assessment uncovered broad support for more housing variety in Edmond and substantial demand for more housing across all price points. Edmond needs 8,900 homes over the next 10 years. Achieving this target will require a change in approach from everyone involved in the housing ecosystem.
The Edmond Housing Assessment studied the community’s housing landscape and opportunities. It proposes strategies, policies, and tools that the City and their partners can use to help ensure that housing options are available in the community for households of all types, all ages, and all income levels.
Nearly one-third of all households in Edmond are housing cost burdened, including 17 percent of homeowners and 47 percent of renters. Rent for a safe and decent two-bedroom home in Edmond costs around $1,020, including utilities, which 40 percent of renters in the city cannot afford. There is also a disconnect between the housing that is available in the city and what Edmond residents can generally afford: the average sale price for a new home in Edmond is about $429,000, and 64
percent of Edmond households cannot afford that purchase price. Housing in Edmond is especially unattainable for young people: even Edmond’s median housing value of $282,000 is unaffordable to 60 percent of households aged 25 to 34.
Between 2017 and 2022 in Edmond, new home prices increased by 31 percent, the median home value increased by 38 percent, and the average number of days a home was on the market decreased from 83 to 36. The rental housing market is also very competitive: only 660 multifamily homes were built in Edmond in the last five years, and most of those homes are agerestricted for people aged 55 and older. Dedicated affordable housing is limited across Edmond. Currently, there are 7,425 households that qualify for affordable housing, but only 1,790 to 2,250 dedicated affordable units are available to serve them.
The age distribution of Edmond’s population is projected to shift over the next five years. Edmond’s current population makeup was very similar to Oklahoma County, the Oklahoma City MSA, and the United States as of 2022, and the early workforce (age 25 to 34), senior (age 65 to 74), and elderly populations (age 75+) grew substantially in Edmond between 2010 and 2022. However, the early workforce cohort is expected to decline between 2022 and 2027, along with school-aged children (age 5 to 17), collegeaged young adults (age 18 to 24), and empty nesters (age 50 to 64). These trends underscore Edmond’s housing challenges. If Edmond is
to remain a community for all ages, it needs a variety of housing that is attainable for people and families throughout their lives.
Edmond is a major contributor to the Oklahoma City Metropolitan Statistical Area (MSA) economy with eight percent of the county’s total jobs and 14 percent of the county’s retail supply. The economy in Edmond is growing at a faster rate than the Oklahoma City MSA, the state of Oklahoma, and the United States. This job growth is expected to continue, and appropriate housing development at price points workers can afford will be critical to ensure that employees are able to both live and work in Edmond. Currently, nearly 75 percent of all workers employed in Edmond live outside the city, and long commute times combined with limited regional transit are both contributing to traffic congestion and making it harder for local employers to fill open positions.
Housing stock and home values vary greatly from neighborhood to neighborhood in Edmond. This has important implications not only for the housing options available for Edmond residents, but also for tailoring and targeting the strategy tactics and resources outlined in this assessment. Not all Edmond neighborhoods will need the same types of investment and support. Poverty is concentrated in Edmond’s core areas, and existing programs are insufficient to meet the needs of the community’s cost-burdened households. Preservation of lower-cost housing will help reduce poverty. Currently, rental housing is also concentrated in Edmond’s core areas,
but spreading more for-rent options throughout the city will provide residents with more housing opportunities and choice.
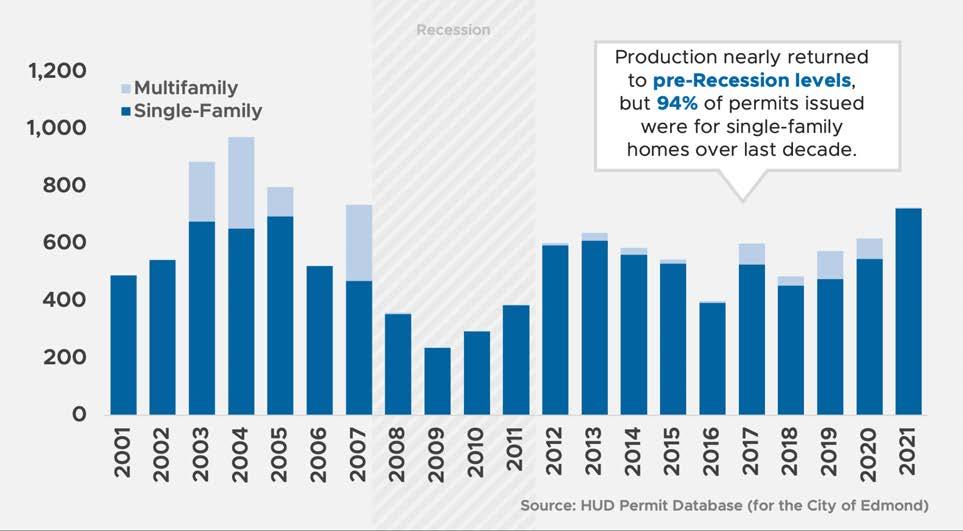
Housing production in Edmond has nearly returned to pre-Recession levels, but 94 percent of permits issued over the past decade were for single-family homes. Edmond’s housing values are also generally higher than the state’s and the country’s. Although Edmond’s housing challenges are not completely unique, many are more intense than they are in other communities with similar growth trends. Most notably, both owner and renter households are more likely to be cost-burdened than they are in the majority of Edmond’s peer cities.
Area Median Income (AMI) is a metric calculated by the U.S. Department of Housing and Urban Development (HUD) to determine the income eligibility requirements of federal housing programs.
Attainable Housing is an umbrella term that reflects the many aspects of a home that make it suitable for a household in the City of Edmond. Attainable Housing is appropriate in:
• Size (e.g., number of bedrooms, square footage)
• Type (e.g., detached home, townhome, apartment)
• Quality (e.g., healthy, safe, in good repair)
• Affordability (i.e., within the price range for the household income)
• Tenure (e.g., rental, for-sale)
• Location (e.g., near employment, school, services, etc.)
Generally, Attainable Housing is a more inclusive term to describe affordability at a range of different area median incomes. It is usually used to talk about housing where housing cost and utilities make up no more than 30 percent of gross household income for households earning up to 120 percent of the city’s AMI.
All the people who occupy a housing unit. A household includes related family members and all the unrelated people. Unrelated people may include lodgers, foster children, wards, or employees who share the housing units. A person living alone in a housing unit, or a group of unrelated people sharing a housing unit such as partners or roommates, is also counted as a household.
Households are considered cost-burdened if they spend more than 30 percent of their income on housing and severely cost-burdened if they spend more than 50 percent of their income on housing.
The assessment’s market analysis applied a combination of methods to project housing demand in Edmond for the next decade.
This segment measures demand across all incomes, housing types, and price points. Demand calculations considered the following:
• Pent-up or current demand by unmet needs and imbalances in the market today.
• Growth projections, factoring in historic growth, as well as county and state-wide trends.
• Housing preferences of different population groups.
• Needs and opportunities in all affordability categories.
A key outcome of this demand analysis is the creation of a development program that details future demand for rental and for-sale housing products by types and price points.
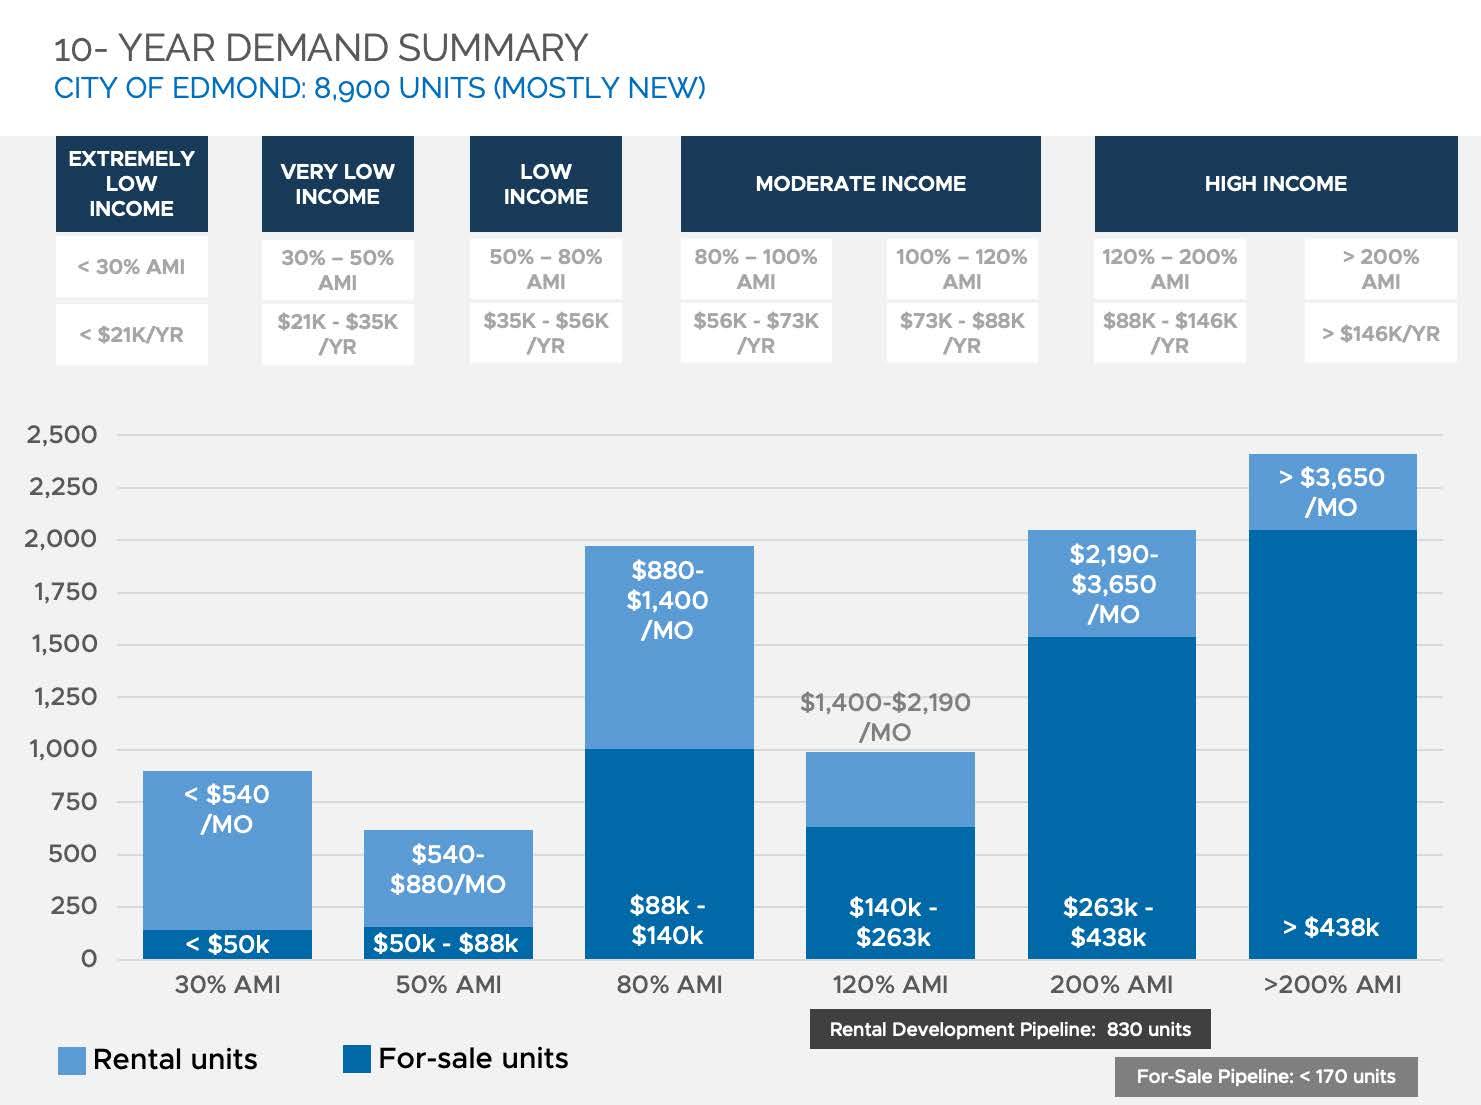
This assessment concludes that there is demand for approximately 8,900 units of housing in Edmond over the next 10 years, or an average of 890 per year. This demand spans the entire spectrum of affordability, including housing needs for low-income, middle-income, and high-income households. The graphic on the following page illustrates projected housing needs.
Housing is needed across the affordability spectrum
Edmond needs housing across the affordability spectrum, and adding housing units of any type or affordability level will help the overall market.
About 40 percent of housing demand is for units at or below 80 percent of the Area Median Income (AMI), or households earning at or below $56,000 per year. About 10 percent of housing demand is for units at or below 30 percent of AMI, or households earning below $21,000 per year.
This type of housing is very difficult to develop without gap funding or incentives. Currently, there are only up to 2,250 dedicated affordable housing units available in Edmond, even though data suggests there are roughly 7,800 local households that would be income-eligible for dedicated affordable units. Many households try to find affordable or attainable housing on the open market, and some do, but today’s market pressures make that more challenging. As a result, some may end up cost-burdened, living in a unit with condition challenges, or “doubling up” with family members or friends.
households moving from out-of-state have been a primary cause of Edmond’s housing challenges, data suggests that net in-migration in Oklahoma County has been relatively flat in recent years. That said, there are growing population groups in the region who would likely consider moving to Edmond if the right housing products were available. Some of these groups will be attracted to the newer single-family homes that already predominate Edmond’s housing market. Other groups, however, will be in search of housing products that are currently less abundant in Edmond, including housing targeted to seniors, modestly priced single-family homes and duplexes, and mobile homes.
Projected population growth calls for a greater diversity of housing types and price points
Edmond currently produces more single-family housing than its peers. While single-family homes will continue to be Edmond’s dominant housing type in the future, there is growing demand for attached and/or maintenance-free homes, as well as for quality multifamily options over the long term. The community needs a diversity of housing types to retain and attract residents, especially young families and seniors.
Although some residents suggested through the project’s community engagement efforts that
Edmond is an outlier in the Oklahoma City region in terms of the distribution of household income groups. Many households —including young professionals, young families, older adults, frontline and service workers, and longterm residents on fixed incomes—have very few housing options in Edmond. Yet, these and other groups are important to the long-term viability of the community.
is not currently a major driver of housing demand, but different housing products could attract underrepresented population groups to Edmond
This housing strategy was created to provide the City of Edmond with programs, policies, and best practices that can be implemented over the next several years to address the community’s key housing challenges.


Edmond’s housing strategy was developed using the demographic, economic, and market analysis discussed previously; input from community stakeholders; housing needs and housing preferences survey results; and conversations with the client team and Steering Committee. It includes tactics for housing production, preservation, and services designed to help households of all types find attainable, quality housing.
The housing strategy includes six housing goals (summarized at right), four strategies designed to serve those goals, and 19 tactics for implementing the strategies (summarized on the following page).
• Goals: the ‘Why’. What are our north-star priorities for Edmond over the next 10 years?
• Strategies: the ‘What’. What do we need to do to make our defined goals a reality?
• Tactics: the ‘How’. How specifically will we implement our chosen strategies?
No single program will address all of the housing challenges facing Edmond. To achieve its goals, the City and its partners will need to take a holistic approach that emphasizes collaboration, coordination, and partnership.
Reduce barriers to expanding production of all housing types, for-sale and for-rent
Tactic 1.1: Use funding tools, such as TIF or impact fees, to help pay for infrastructure improvements that support affordable and workforce housing development
Tactic 1.2: Leverage City-owned assets to support affordable, workforce, mixed-income, and mixed-use development
Tactic 1.3: Work with other City departments to reduce time required for the development review and approval process for housing that meets goals
Tactic 1.4: Update zoning code to allow more housing types-by-right, incorporate other incentives and inclusionary zoning/affordability set-asides, and include flexible design standards
Tactic 1.5: Work with partners to expand homeownership supports like down payment assistance/loan programs, credit counseling, and homebuyer/homeowner training
Tactic 2.1: Create a “look book” of housing typologies and share type-specific resources
Tactic 2.2: Keep track of housing trends based on type, demographic markets, renter vs. ownership patterns, foreclosures/ vacancies, and available lots for development/ redevelopment
Tactic 2.3: Work with architects and builders/developers to create pre-approved plans for new housing types
Tactic 2.4: Market development opportunities to the local, regional and national development community using results of this study
Tactic 2.5: Evaluate and revise building codes related to certain requirements, such as fire sprinklers, while maintaining the safety of the units
Tactic 2.6: Expand Edmond’s ability to secure additional federal resources and participate in the real estate market
Facilitate the improvement of older housing stock condition while preserving affordability
Tactic 3.1: Expand Edmond Builds to include exploration of protections for existing residents in the neighborhoods targeted for revitalization
Tactic 3.2: Continue to support homeowner renovations and weatherization through Edmond’s Owner-Occupied Housing Rehabilitation (OOHR) program
Tactic 3.3: Adopt a more proactive approach to code enforcement of problem properties
Tactic 3.4: Create and fund new housing programs to encourage reinvestment in older rental properties while maintaining attainable rents
Tactic 3.5: Work with partners and other government staff to explore creating a tax abatement program
Support employers, economy, and workers through workforce housing
Tactic 4.1: Map/update employment concentrations and housing options within a 15-minute drive to show mismatch between what’s available and what the growing workforce needs
Tactic 4.2: Identify key development sites within employment shed(s) for workforce attainable housing
Tactic 4.3: Support the creation and funding of a workforce housing program to facilitate development of moderately-priced for-sale and rental housing
Tactic 4.4: Advocate for state and federal workforce housing programs
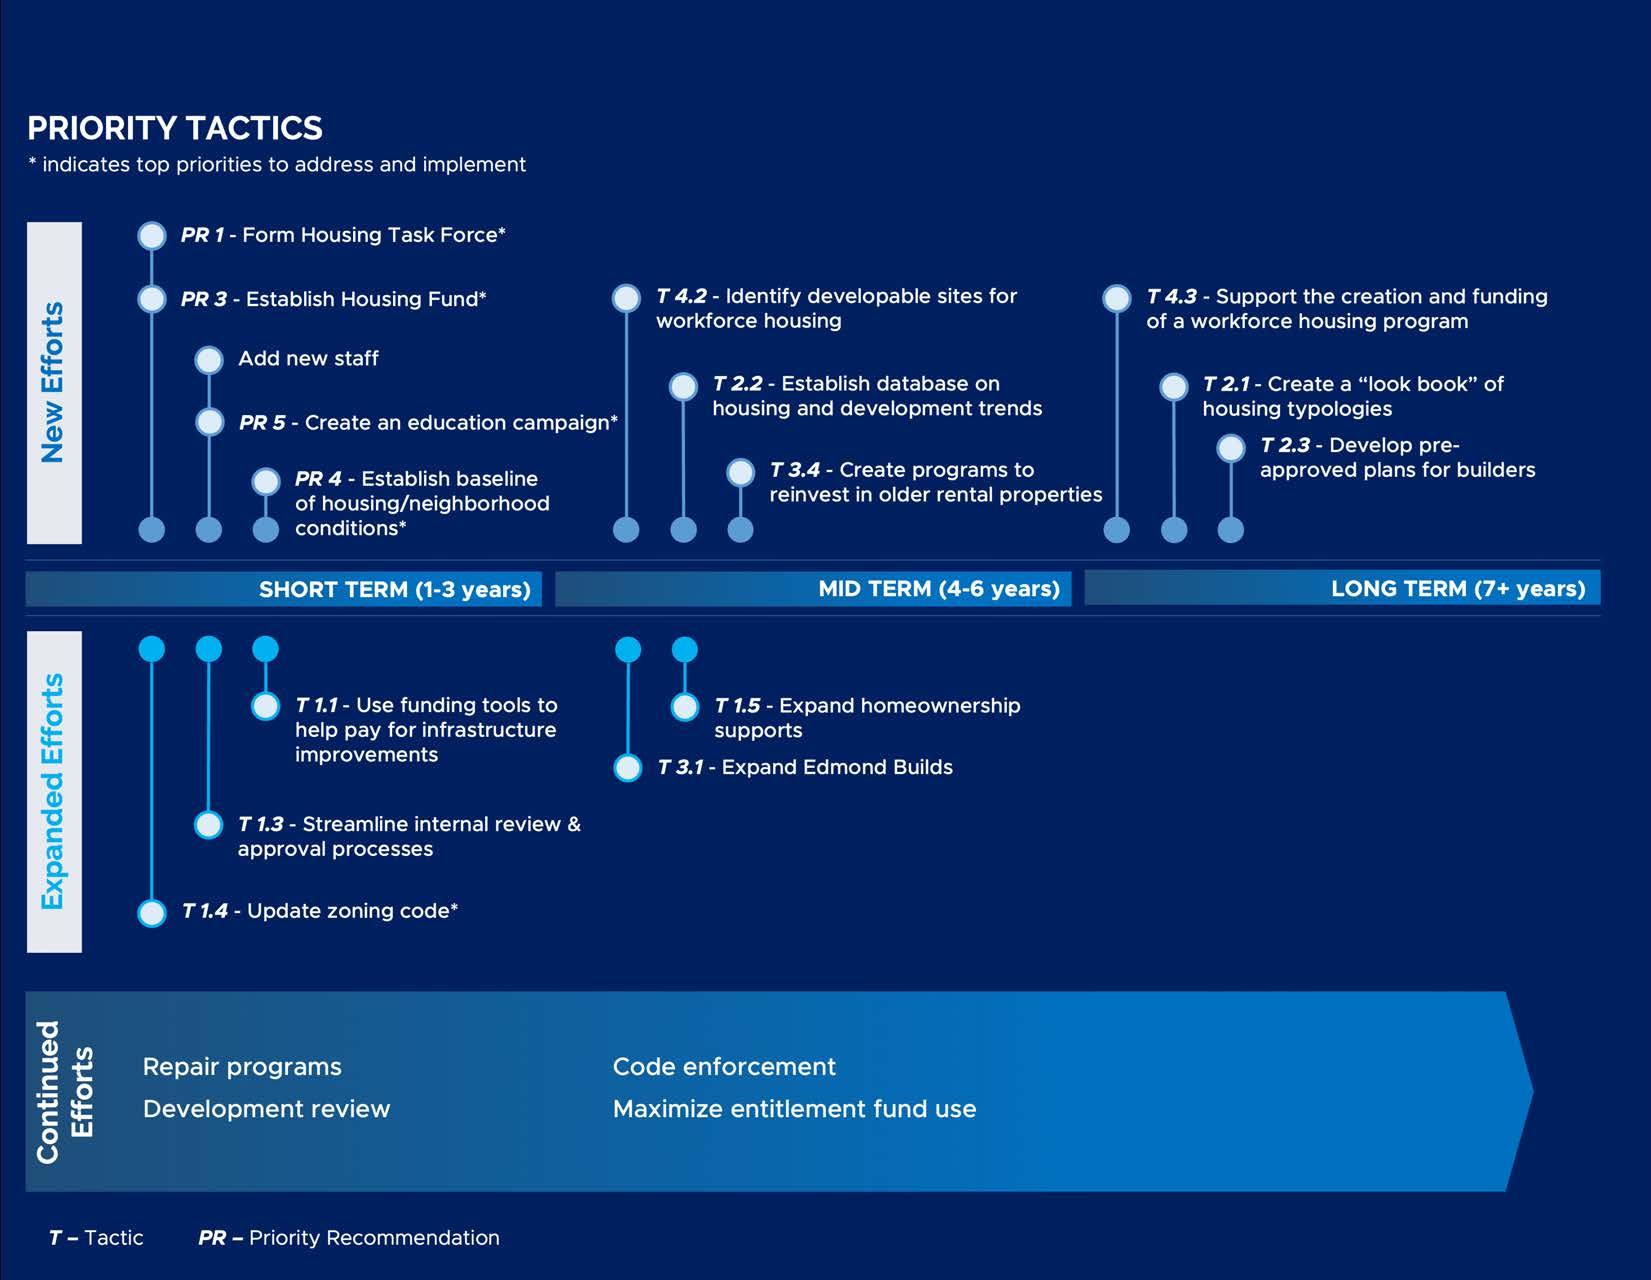
Edmond will need to prioritize actions in the short term and plan for future actions as conditions change.
The City of Edmond cannot implement all four strategies and 20 tactics at once, and it would not be prudent to do so. A more systematic approach will lead to be better long-term results.

There are clear and urgent needs in the city that can be addressed right away through strategic focus. Five priority efforts were identified through
understanding Edmond’s housing needs with input from the Steering Committee and City staff:
1. Ensure the new zoning code allows more housing diversity
2. Form a Housing Task Force
3. Establish a Housing Fund
4. Establish a baseline of housing/neighborhood conditions
5. Create an education campaign
These priorities have been selected to address the critical needs of the community now while setting the groundwork for future implementation.


This effort examined Edmond’s housing challenges and proposes policies and strategies that will help advance the community’s housing goals.
Why study Edmond’s housing? There have been many conversations in Edmond about housing over the past several years. There is ongoing debate over where rental housing is appropriate and how much of it the community needs. What’s more, the market in Edmond is strong—there are few for-sale or rental housing options available at any given time.
The City of Edmond Housing Assessment explores Edmond’s housing landscape and gives the City strategies, policies, and tools they and their partners can use to help ensure that housing options are available in the community for households of all types, all ages, and all income levels. Specifically, this study:
• Provides a data-driven assessment of the housing market, housing stock, and housing needs of the Edmond community.
• Quantifies housing demand across various price points and types.
• Engaged the community in dialogue about their housing experiences, policy options, preferences, and priorities for the future.
• Lays out a strategy with specific tactics that address Edmond’s unique housing market.
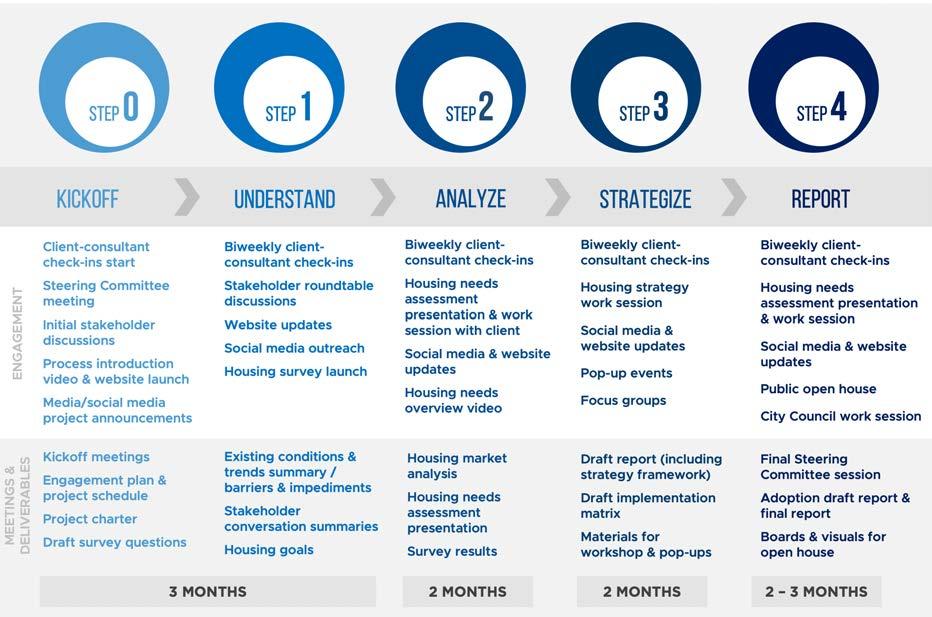
The Housing Assessment kicked off with a work session with the City team and Steering Committee and touring the City of Edmond. The kickoff trip also included several stakeholder conversations (with others conducted via videoconferencing).
The Understand phase established an in-depth understanding of current socioeconomic and
housing conditions in Edmond. This included field work, conversations with the Steering Committee and key local stakeholders, and detailed quantitative analysis.
During the Analyze phase, real estate market analysis determined the scope of present and future opportunities to both 1) supply unmet housing demand to different consumer groups and 2) evaluate competitive opportunities to deliver development that responds to current consumer demand for a greater variety of housing options. Collected data comes from a variety of
sources, including surveys, interviews with area development professionals, and third-party data providers.
The Strategize phase built on the market and economic analysis to create a set of goals and a holistic strategic framework for housing in Edmond. This included follow-up research on best practices and precedents from other cities and extensive conversation with the City of Edmond team and Steering Committee.
Based on feedback and discussion during the Strategize phase, the Align phase outlined priority strategies and implementation steps. The implementation framework identifies roles the City and community partners can take on to address the full range of housing needs in Edmond.
The assessment followed a five-step process that allowed the consultant team to have an iterative dialogue with the community. Each step brought the process closer to a clear understanding of Edmond’s housing needs and priority strategies.

While some elements of housing studies are highly technical and data-driven, it is just as important to capture and understand community experiences of the housing market. It is impossible to identify which strategies are best-suited to meet local housing needs without input from community members about local values, potential, barriers, and priorities.
The consulting team used five main methods to tap into the Edmond community’s diverse perspectives and experience and secure feedback that shaped the recommended strategies.
A 13-member Steering Committee representing a broad cross-section of the Edmond community brought expertise in housing development, real estate, advocacy, social services, education, finance, and economic development. Steering Committee members provided critical feedback throughout the assessment process and helped to prioritize possible strategies. This group is
now well-positioned to identify opportunities for collaboration as recommended strategies are implemented.
Round table discussion and interviews with local stakeholders enriched the consultant team’s analytical understanding and helped to identify key local issues. These discussions involved over 25 individuals who provided a diverse set of perspectives on housing in Edmond, including developers, lenders, major employers, local nonprofits, school and university staff, real estate agents, service providers, residents, and more.
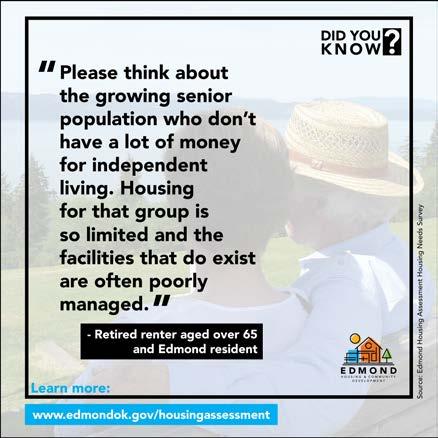
Two online surveys were created to invite community input on their housing experiences, priorities, and preferences.
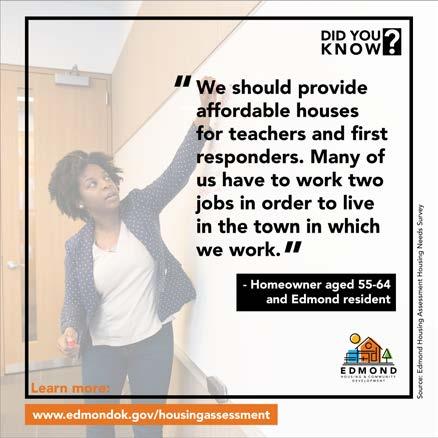
• Housing Needs Survey—launched early in the assessment process to invite community input on housing experiences and priorities in Edmond. It received more than 1,700 responses and provided valuable insight into the housing preferences and challenges facing the Edmond community.
• Housing Preference Survey—asked the community to share their feedback about different housing types and features. This survey received more 450 responses and provided context about what types and price points of housing are preferred, which helped shape recommended strategies.
During the second half of the assessment process, four focus group conversations gave Edmond stakeholders—including developers, renters, and young professionals—the opportunity to discuss their specific challenges and input on ways to combat them.
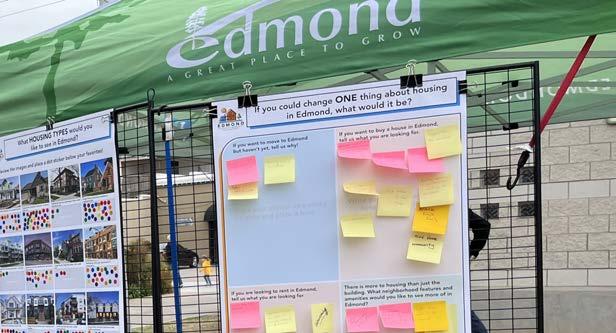
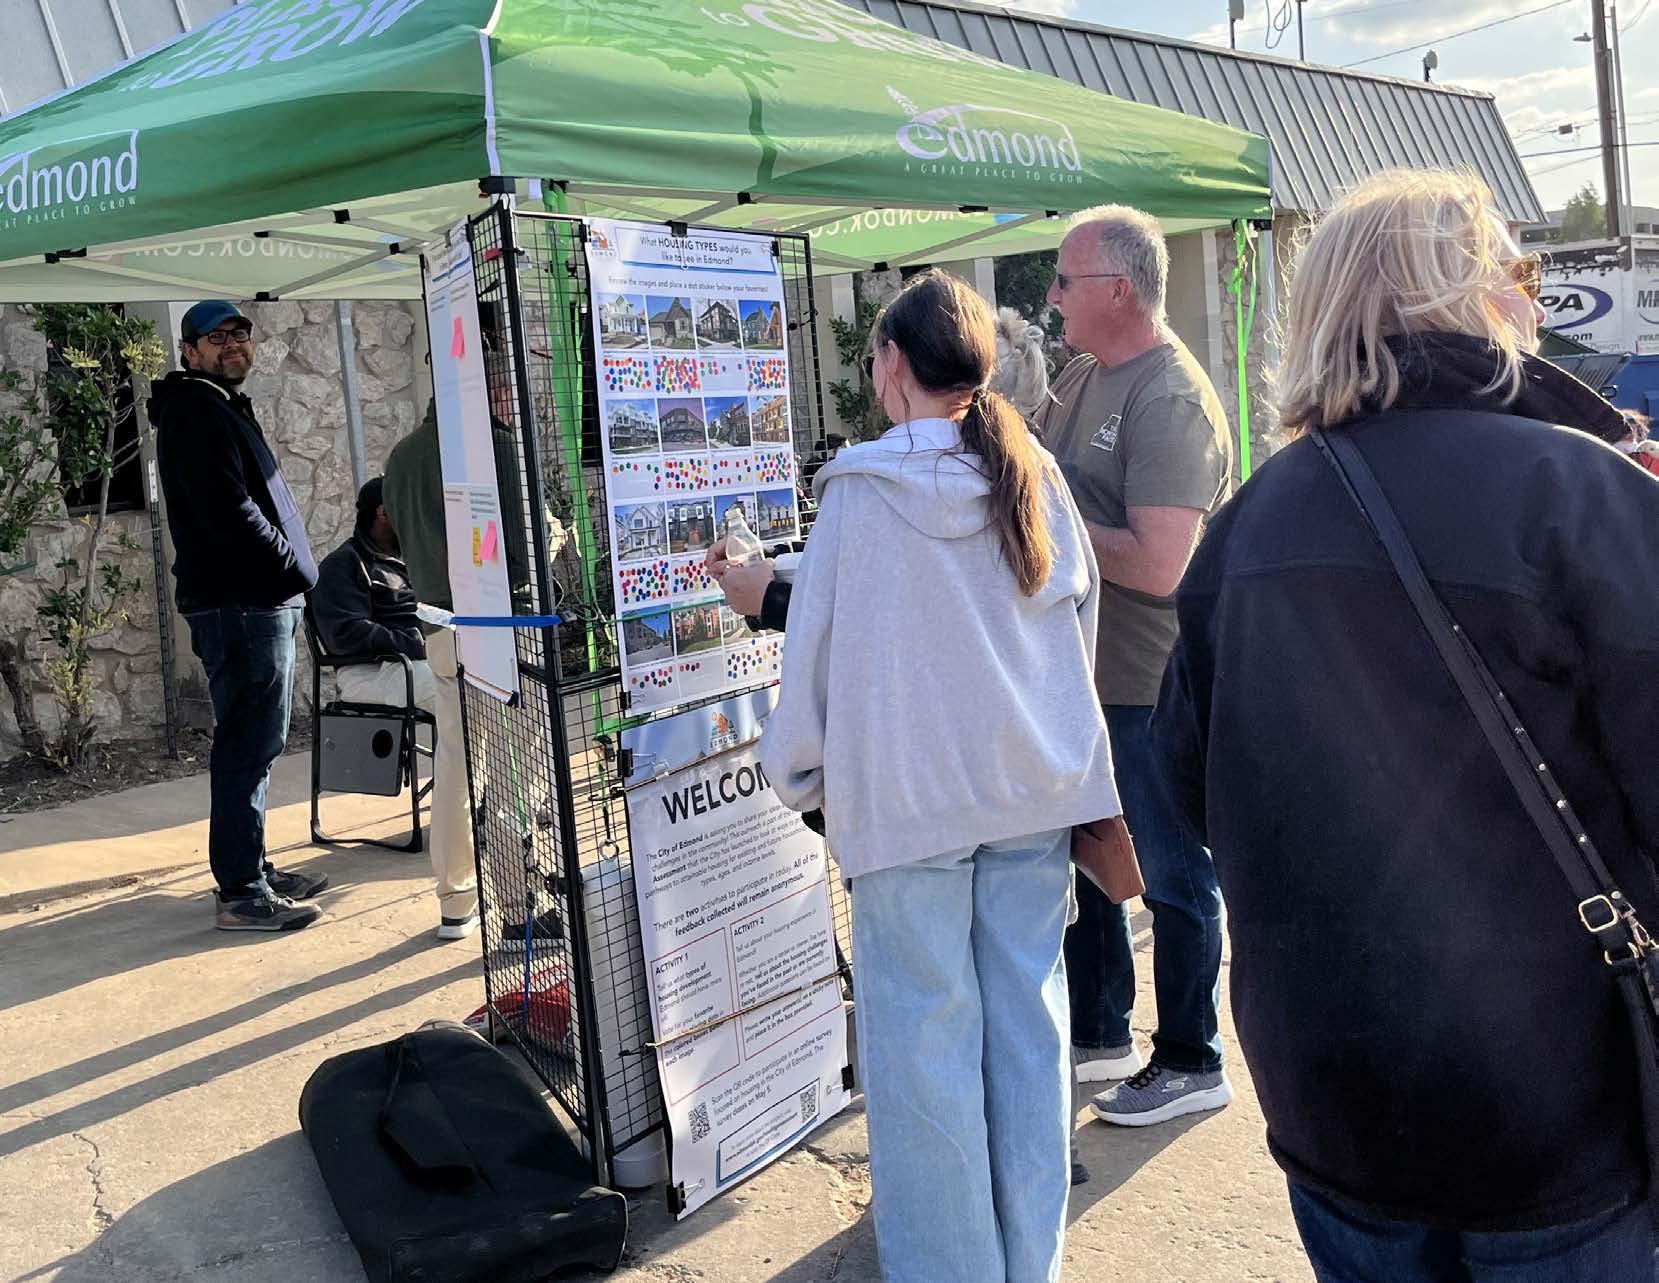
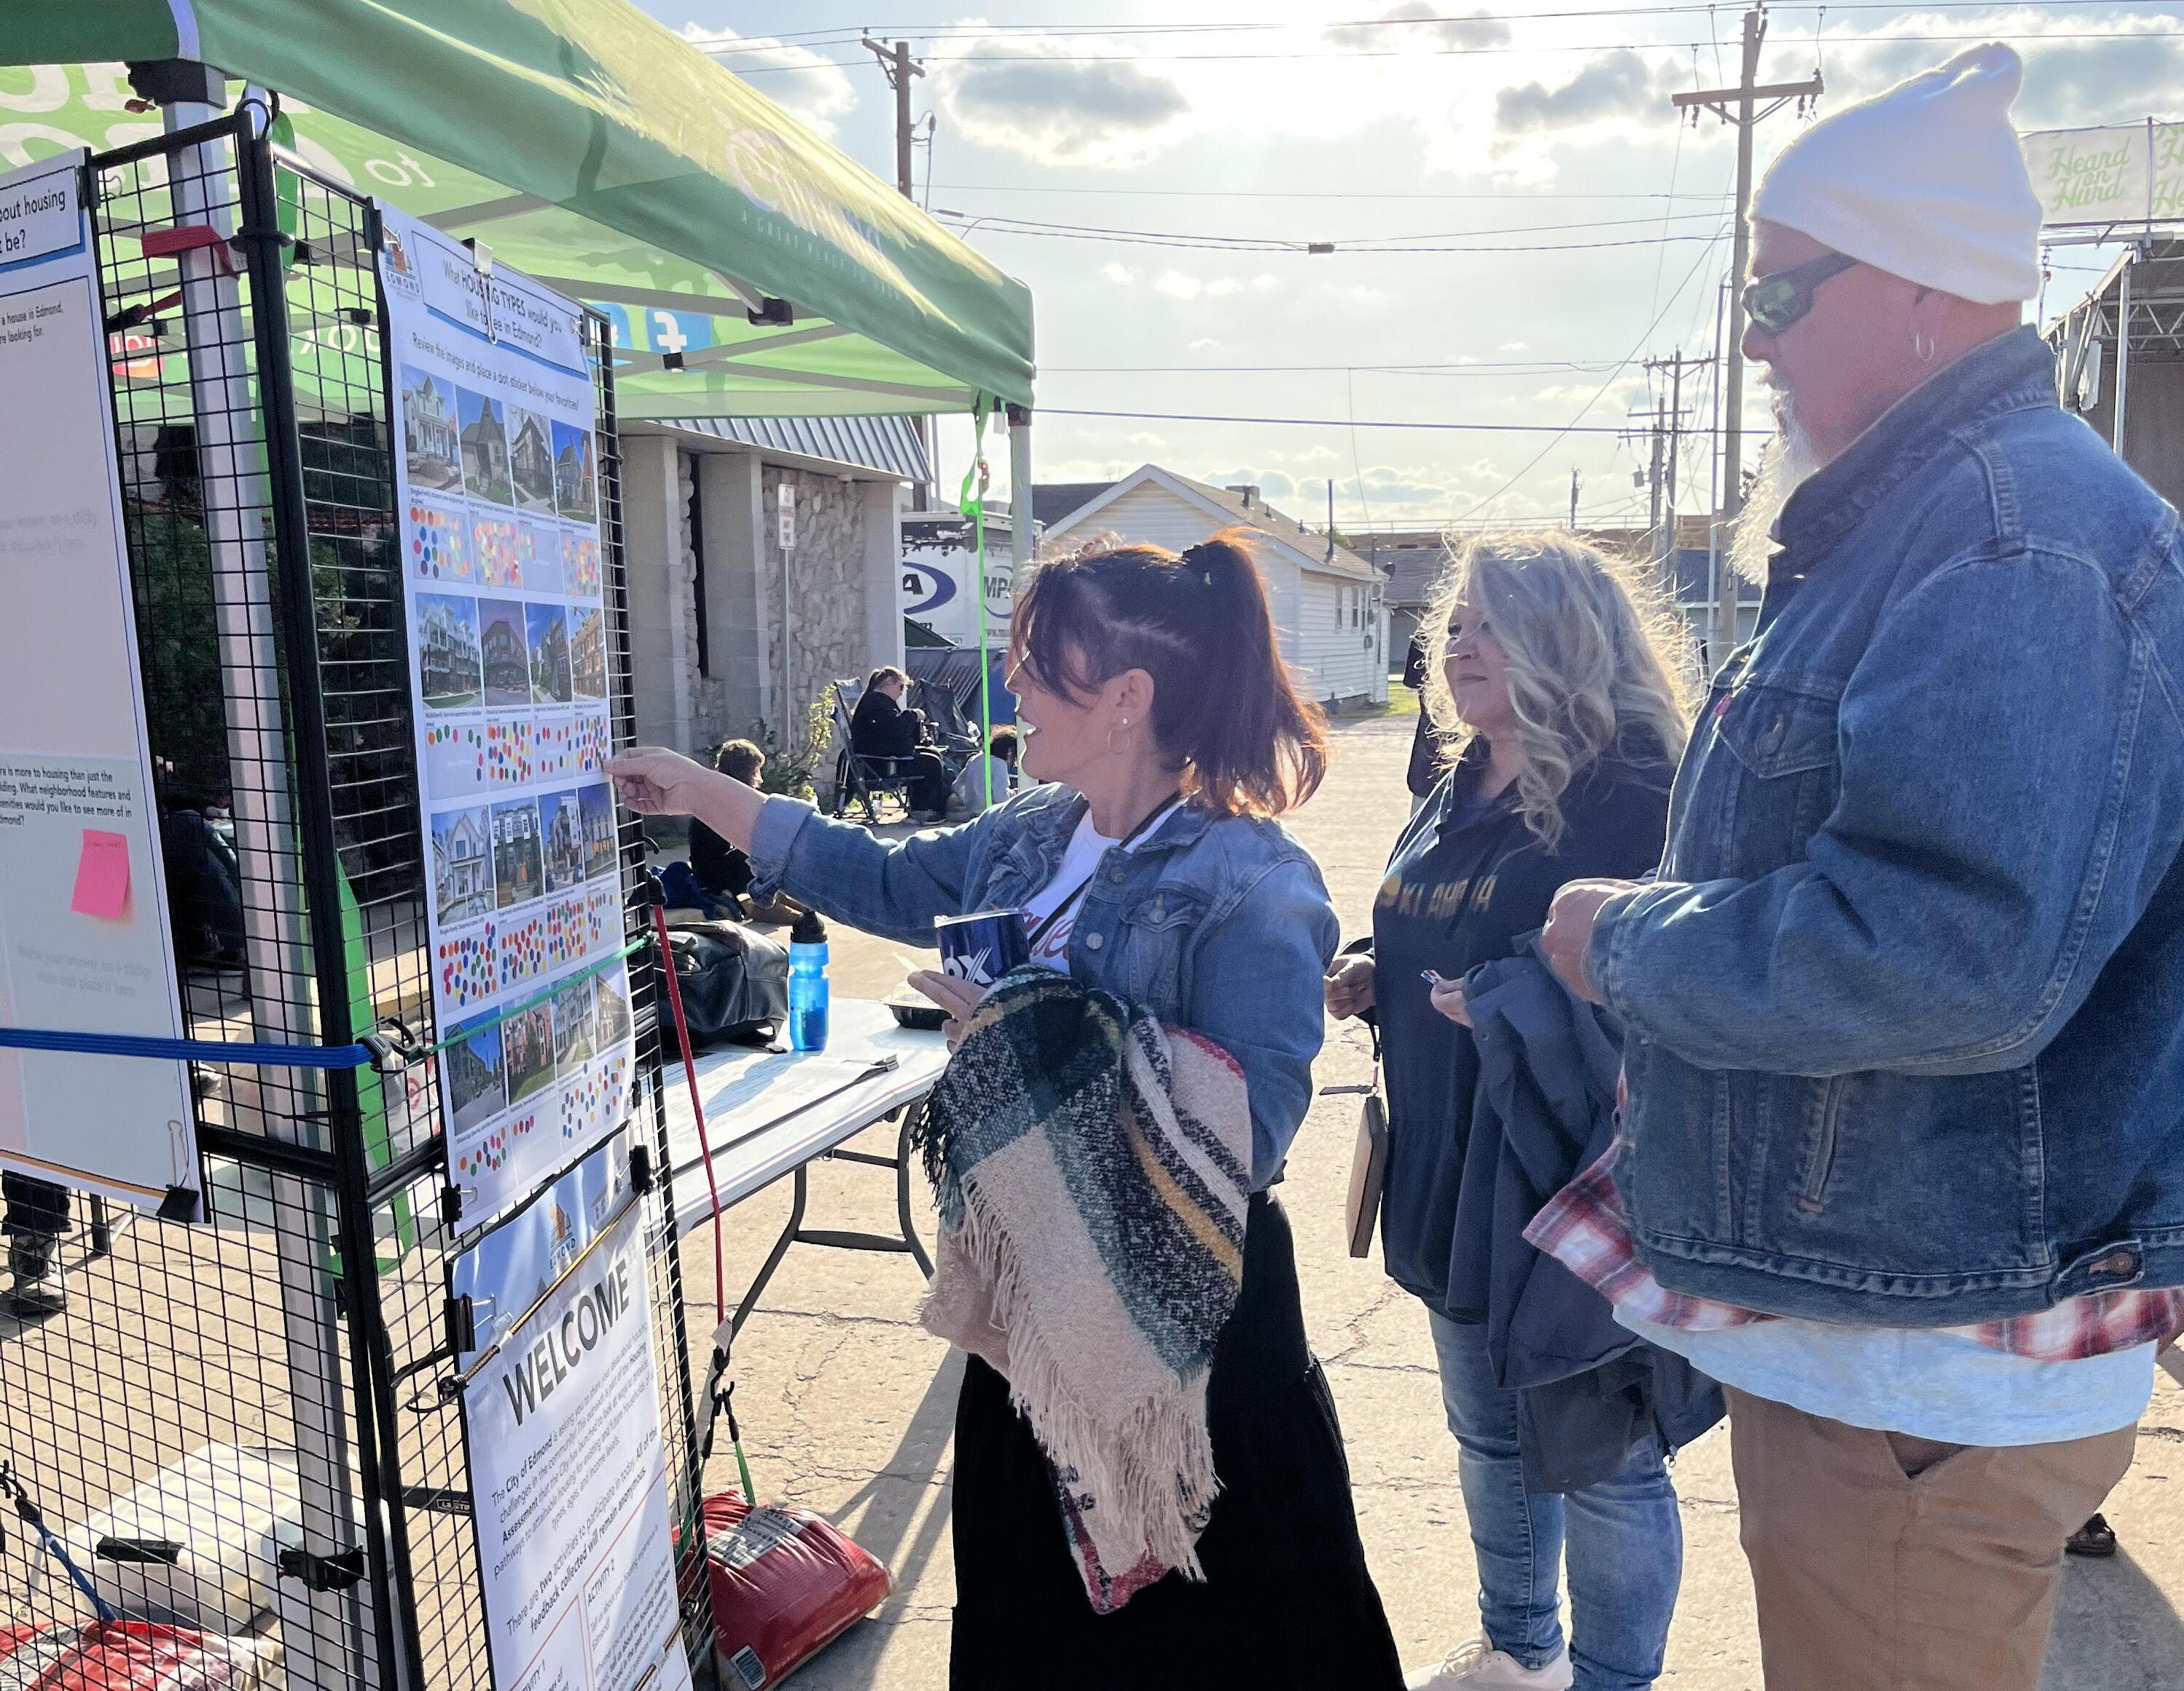
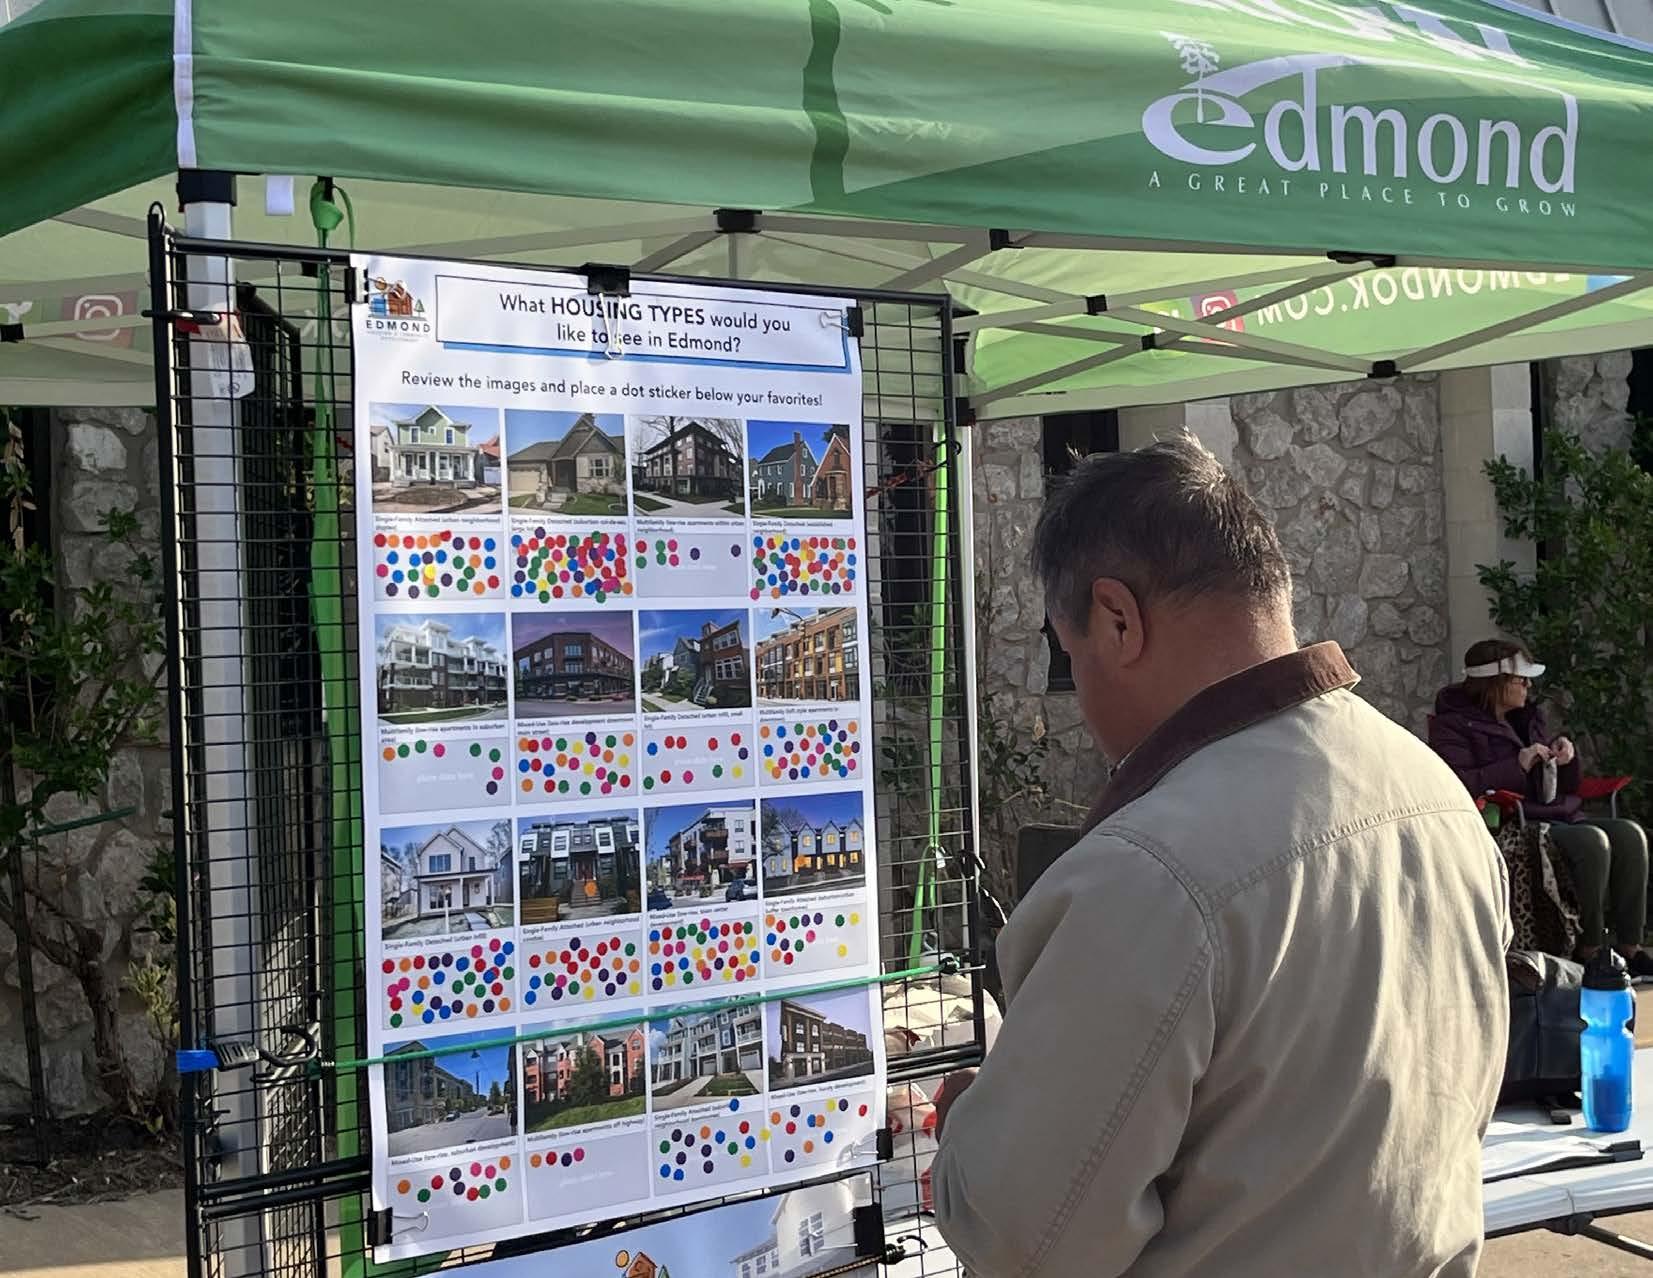
Pop-up booths at the monthly Edmond Farmers Market and Heard on Hurd music festival provided community members the opportunity to share their housing experiences firsthand.
To keep the community informed about project progress, key updates and deliverables were also regularly posted on the City’s web page and shared via the City’s social media accounts. This included a series of infographics highlighting findings from the market analysis and Housing Needs Survey, as seen in the images to the right.


American households continue to navigate the long-term economic consequences of the COVID-19 pandemic.
For many households across the country, the pandemic brought growing economic equities to the forefront. While some were temporarily alleviated by policy responses, many are now being compounded by rapid inflation. In particular, the gap widened between homeowners and renters—home equity rose substantially in the past two years, while renters continued to face escalating housing costs that outpaced both inflation and wage growth. Consequently, millions of households are still behind on their housing payments and could face eviction or foreclosure as pandemic-era interventions end; according to the Federal Reserve, 10 percent of American households, including 15 percent of renter households, were behind on housing payments as of April 20221.
Households throughout the nation face a number of housing-related challenges. Housing costs increased substantially after 2020, particularly in growing metros; according to Zillow, the average market rent increased 25 percent (or nearly $400) since 2019, while Americans’ median household income rose just 5.4 percent2. As a result, 46 percent of renter households are burdened by housing costs and nearly one-third (32 percent) of households cannot afford to cover a $400 emergency expense3. Policies enacted in the wake of the pandemic, such as eviction and mortgage moratoria, improved financial wellbeing

for American households broadly in 2021. For instance, 78 percent of households reported being economically stable in 2021—up from 75 percent in 2019 and the highest level recorded since 20134. However, the expiration of pandemicera policies, coupled with rapid inflation, created new economic challenges, and households are increasingly likely to face housing insecurity, unpaid bills, and mounting debt5
Meanwhile, construction costs rose by 8.5 percent between November 2021 and November 2022, with a 31.4 percent increase in the last five years6, which contributed to the recent escalation in home prices. Since 2000, home prices rose 66 percent after adjusting for inflation, with a 37.6 percent increase since 2019 alone7. Despite these trends, households with steady incomes through the pandemic were able to capitalize on low interest rates and temporarily reduced housing values, contributing to an increase in the homeownership rate for the first time since 20168.
In response to record-breaking inflation, the Federal Reserve raised interest rates in 2022 and mortgage rates rose from 4.2 percent in March 2022 to 6.6 percent in March 2023 (30-year fixedrate mortgage, or FRM)9. Consequently, low- to moderate-income households and young families are increasingly unable to buy in the current market. Gen Xers, Millennials, and elder Gen Zers are having a harder time transitioning from renting to homeownership than previous generations did.
of households cannot afford to cover a $400 emergency expense.

32% Construction Costs
Source: Federal Reserve, 2022
31.4%
rise in construction costs over the last five years, with an 8.5 percent rise in construction costs between November 2021 to November 2022.
Source: Rider Levett Bucknall
6.6%
was the recorded interest rate in March 2023 which increased from 4.2 percent recorded in
Rising Prices
66%
increase in home prices (inflation-adjusted) since 2000, with a 37.6 percent increase since 2019 alone.
Source: Zillow Home Value Index
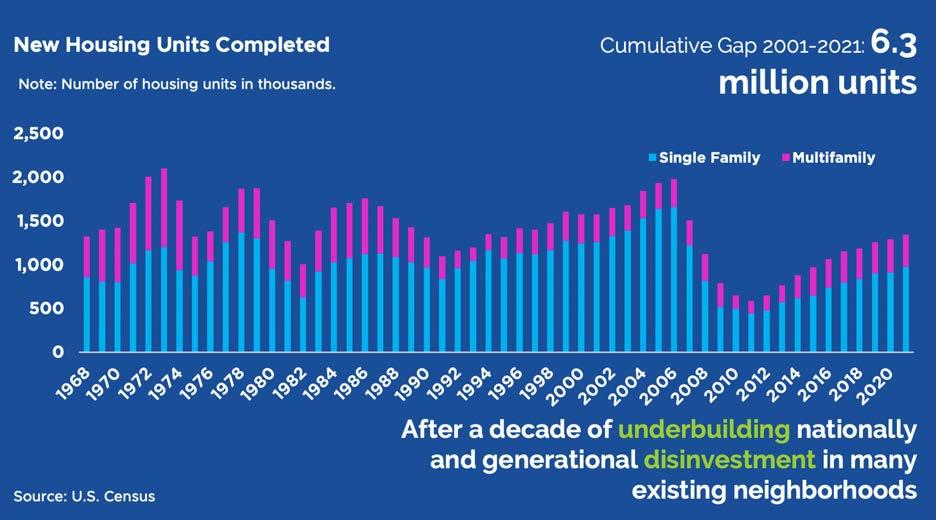
A key reason for increased housing costs is lagging housing production during the past decade.
From 2010 to 2020, the gap between supply and demand for housing units in the nation grew at a rate of nearly 600,000 units per year, including 325,000 affordable housing units. Construction of entry-level homes decreased five percent and the rate of affordable rental unit production declined seven percent10.
Recently, overall housing production increased despite rising construction costs. In 2021, singlefamily home starts exceeded one million units for the first time since before the Great Recession11 This trend continued through 2022, with 1.55 million total housing starts, including 547,400 multi-family unit starts—the highest levels seen since 198612

Despite recent increases in supply, housing costs continue to rise.
Prices for new-construction homes are increasingly costly: nationally, new multi-family units have a median rent of $1,740 and new single-family homes have a median sales price of $473,600 (Q4 2022)13, up from an average of $1,550 in 201714 and $335,400 in Q4 201715, respectively. While new construction does alleviate demand pressure on existing, comparatively affordable housing stock, the extent to which it will reduce overall costs is uncertain.
The rising cost of for-sale housing outpaced both wage growth and inflation. Per the Bureau of Labor


Statistics (BLS), inflation averaged 8 percent in 2022, compared to 4.7 percent in 202116. From 2021 to 2022, shelter costs rose 8.1 percent and rents rose by 8.8 percent17. Heightened costs for other essential goods like food, gas, and utilities further strained budgets. As a result, the national home price-to-income ratio (for the median household income) rose to 4.5—the highest level since 200618
Shifting demographics are bringing changing preferences in housing types.
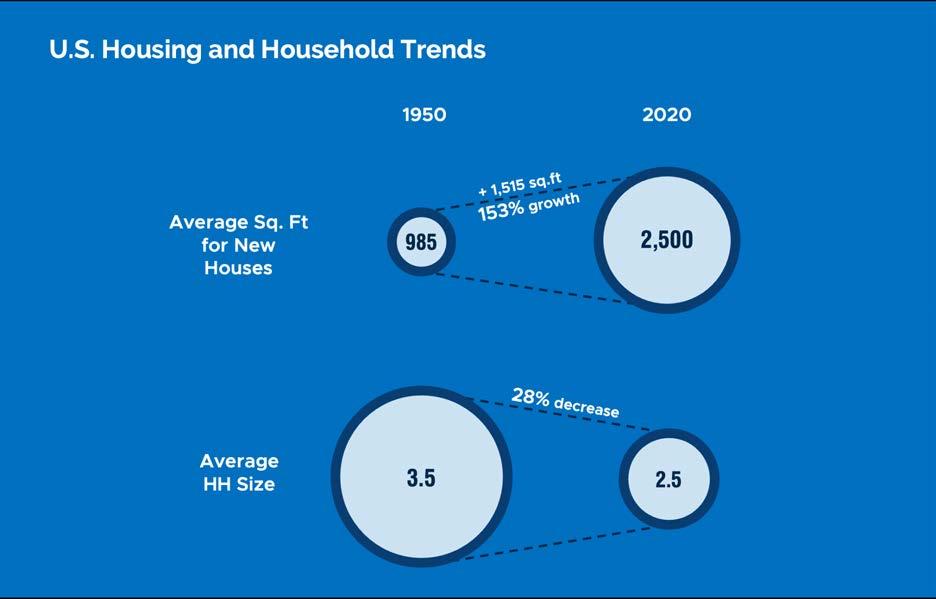
While single-family homes comprise an estimated 65 percent of the nation’s current occupied housing units, demographic shifts are changing the complexion of the ‘typical’ household. For instance, the average household size has dropped from 2.76 persons in 1980 to an estimated 2.55 persons in 202219. Married couples with children now comprise just under 19 percent of all households in the U.S., dropping from nearly onethird in 198020. The dominant housing typology since World War II, suburban three- to fourbedroom homes, have long served this market, yet are becoming less desirable with the increase in smaller, single-person and roommate households.
At the same time, the housing stock is aging. The median age of owner-occupied homes is now 41 years old, up from 34 years in 201021. Beyond demographic changes, older housing will require modernization to remain marketable.
Source: U.S. Census, American Community Survey USA, 1980-2020
Share of detached Single-Family homes
Share of married households with children
The share of single-family homes remained the same from 1980 to 2020
Yet, the share of married households with children, a primary market for single-family homes, declined substantially

Household sizes also decreased, impacting consumer preferences about the size of housing units
Source: U.S. Census 1950 and 2020
Single-family rental housing, both attached and detached, currently comprises around one-third of the total rental housing stock nationwide22 While the share of SFRs has remained relatively consistent over the past decade, institutional and investor-driven activity in the SFR market has escalated. According to the National Association of Realtors (NAR), institutional buyers made up around 13 percent of residential purchases in 2021—an increase from 12 percent in 202023. Investors tend to purchase moderately-priced housing that traditionally served the first-time homebuyer market, as well as low- and moderateincome home buyers. Just under half (42 percent) of the properties purchased by investors in 2021 were converted to rentals24
Because institutional ownership creates more competition for the for-sale supply, it can contribute to heightened housing costs. In 2021, the State of Oklahoma had the third highest share of institutional buyers at 18 percent of all transactions25. Oklahoma County had the largest share of institutional buyers of any county in Oklahoma and local stakeholders and Realtors in Edmond report a similar trend in the city26
Short-term rentals (e.g., vacation rentals by owner) can boost tourism and sales activity; however, they can also reduce the supply of long-term rental and for-sale housing, particularly starter homes or moderately priced rentals, thereby contributing to increases in rents and
for-sale prices27. Units are frequently purchased by investors, pricing out local buyers, to be converted to short-term rentals—a practice that has grown increasingly common over the past half decade, with the share of “hosts” owning 20 or more units nearly doubling from 2016 to 202028
According to AirDNA, there are currently 250 short-term rental properties in Edmond, of which the majority (83 percent) are entire homes29. Most short-term rentals are located in southern central Edmond, surrounding both the University of Central Oklahoma (UCO) and Oklahoma Christian University (OC)30.
According to the 2021 ACS, 42 percent of renters in the state are housing cost burdened—meaning they pay over 30 percent of their income toward housing expenses, including utilities—compared to 18 percent of homeowners31. The challenge is much more pronounced for renter-occupied households earning under $35,000 annually, 84 percent of which are housing cost burdened32. The state has a median housing value of $178,500, around $100,000 lower than the median in Edmond ($281,700)33. Per Redfin, the median sales price statewide is $229,800, 48 percent higher than it was in 2018 ($155,500)34. According to CoStar, the market rent per unit statewide is $884, an increase of 20 percent over the past five years35. The median year of housing structure built is 1979, which is similar to the nationwide median, and just over one-third (34 percent) of housing units were built before 197036.
With a population of just over 96,00037, Edmond is the fifth largest city in Oklahoma and the third largest in the Oklahoma City MSA (Metropolitan Statistical Area)38. MSAs represent a geography made up of one or more counties that contain a city of 50,000 or more residents or Census Bureau-defined urbanized area, and have a total population of at least 100,000 people39. Edmond directly borders Oklahoma City to the north. The city is intersected by Interstate 35, a major northsouth highway, connecting Edmond to Downtown Oklahoma City (15 miles south), and all the way to Fort Worth, Texas (212 miles south) and Wichita, Kansas (148 miles north). Edmond is just north of Interstate 44, providing access to Tulsa (100 miles northeast) and Lawton (100 miles southwest). A portion of historic route 66 and state highway 77 also run through Edmond.
Housing in Edmond is predominantly comprised of single-family detached structures, with a limited supply of multi-family dwellings. Relative to that of the nation, Edmond’s housing stock is newer; only about ten percent of structures were built prior to 197040. Housing production in the city escalated through the 1970s and 80s, coinciding with the population boom, and continued through the 2000s. Around 14 percent of homes were built in 2010 or later. The median age of housing units in the city is 30 years old—well below the nationwide median (41 years)41
Edmond offers numerous unique cultural assets, including a major university, historic landmarks, and multiple museums. The city is known for its family-friendly culture and amenities, high-quality school district, and historic structures situated in
its walkable downtown. In addition to its cultural assets, Edmond has a large park system, an annual Fourth of July celebration, and various public arts festivals.
Edmond is a high-growth city within a high-growth region relative to the state. The Oklahoma City MSA grew by 17 percent from 2010 to 2022, while the state grew by 6.8 percent. Edmond grew by 17.9 percent, adding 14,600 new residents during the same period42. Demand for housing remained strong in Edmond and, unlike trends nationally and statewide, the production rate in Edmond from 2011 to 2022 (on average, 585 annually) actually exceeded rates during the prior decade (570 units annually)43. Edmond’s population is projected to grow by 0.4% over the next five years44.
Esri 2022, Multiple Listing Service (MLS) 2022,
2020
The vast majority (80 percent) of housing units in Edmond are single-family detached and attached structures45, and single-family construction accounted for 94 percent of housing permits issued in the city from 2010 to 202246. Recent sales data sourced from Redfin indicates that most for-sale properties are between 1,700 to 2,500 square feet, containing three to five bedrooms, with prices ranging from $250,000 to $450,000 and a median of $364,20047. The median housing value citywide is approximately $282,00048
The multi-family housing supply in Edmond increased 72 percent, from around 4,700 units to 8,100 units from 2000 to 202249. Edmond has a significant supply of units targeting seniors and, excluding these, the current multi-family supply is 5,500 units. While supply trends for the multifamily market appear strong, recent deliveries have fallen far behind single-family construction and failed to keep up with the growing demand. Further, vacancy rates during the last three years were consistently under five percent, a decrease from the average of six to eight percent annually from 2010 to 2019.
Edmond’s new multi-family stock is larger and more expensive, and thus tends to be out of reach for most renters. The average size of a multi-family unit in Edmond is 912 square feet compared to 876 square feet in 2016 and 815 square feet in 2000, while the asking rent per square foot has risen 20 percent since 2016, not adjusting for inflation50.
 Housing by Year Built in Edmond
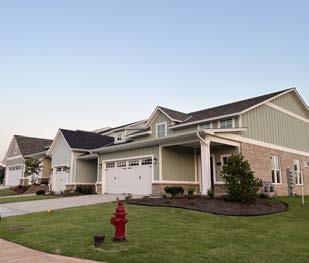
Overall, Edmond has a competitive housing market, evidenced by limited supply, increasing prices and rents, and low vacancy. The city continues to be desirable for new construction, especially housing; however, the lack of diversity in housing types is contributing to market challenges. In particular, housing options are unattainable for the general workforce (i.e., teachers, nurses, frontline workers, and service workers), young families, young professionals, and older adults looking to downsize and stay in the community.
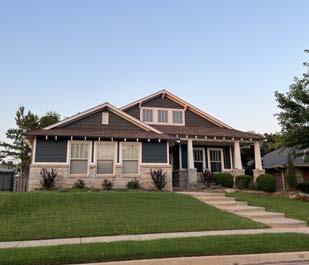
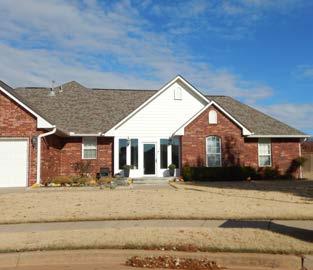
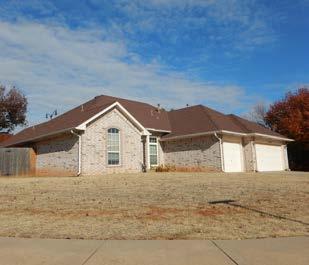
Older homes are concentrated in historically undeserved parts of the community near and around Downtown and heading south. These areas
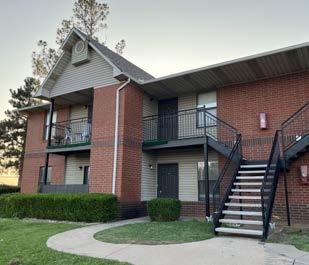
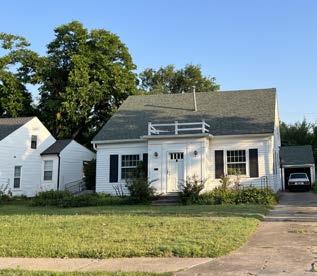
tend to have higher rates of poverty and lower housing values. In contrast, communities in the northeastern and southeastern quadrants of the city have newer housing stock, as well as high median housing values.
The Edmond and Oklahoma City MSA economies are growing at a much faster rate than the state’s and are driven by the health care, education, manufacturing, and government sectors.
The ten largest employers in the Oklahoma City MSA include the State of Oklahoma, Tinker Air Force Base, the University of Oklahoma, INTEGRIS Health, and Hobby Lobby51. Nearly 16 percent of the region’s workforce are employed by these businesses.
The region’s workforce increased by four percent in the last year—an indication that the area employment level is recovering from job losses caused by the pandemic. Of service sector jobs, Education and Health Services and Leisure and Hospitality sectors show the most growth. Financial Activities, including the Insurance and Professional and Business Services sectors are

also important contributors to job growth in the region. The largest industry sector in the region is Education and Health Services, employing more than 30,000 workers52.

Edmond has nearly 50,000 jobs, or 6.5 percent of the jobs within the Oklahoma City MSA. With a consistently low unemployment rate, total employment in the city grew 8.7 percent from 2013 to 201953. The most recently available BLS data indicates that Edmond’s economy continues to remain strong—as of November 2022, the unemployment rate is just 2.3 percent and the city has added nearly 3,650 jobs since 202054.
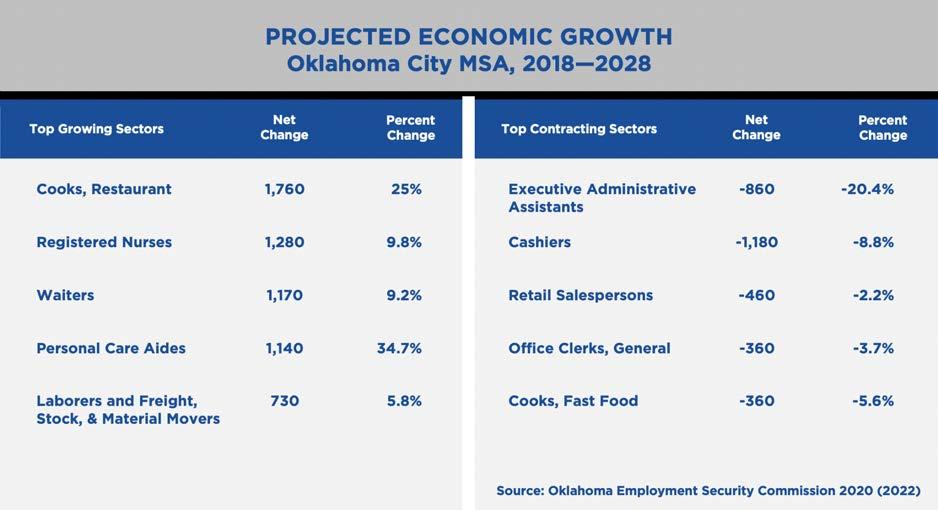
The Oklahoma Employment Security Commission publishes projected job growth for the state and Oklahoma City MSA, which includes Edmond. Many of the fastest-growing jobs in the MSA are relatively low-paying; for instance, the fastest-growing occupations in the MSA include restaurant workers, personal care aides, and freight, stock, and material movers, all of which earn between $20,000 to $35,000 annually55. Further, projections indicate that 27 percent of jobs added from 2018 to 2028 will pay less than $40,000, while a similar share of jobs requiring high school diplomas will pay between $35,000 to $65,00056. Hence, as demand for workers within critical sectors grows, the demand for quality housing within the affordable and workforce ranges will continue to grow.
1 Board of Governors of the Federal Reserve System. (May 2022). Economic Well-Being of U.S. Households in 2021. https://www.federalreserve. gov/publications/files/2021-report-economicwell-being-us-households-202205.pdf
2 Esri. (2022). ArcGIS Business Analyst. Bao. arcgis.com; Site To Do Business. https://bao. arcgis.com/esriBAO/
3, 4 Board of Governors of the Federal Reserve System. (May 2022). Economic Well-Being of U.S. Households in 2021. https://www.federalreserve. gov/publications/files/2021-report-economicwell-being-us-households-202205.pdf
5 Cutts, A. C. (February 2023). The Financial Condition of American Families Heading Into 2023. Primerica. https://www.primerica.com/public/ White_Paper_Primerica_Financial_Security_ Monitor_February_2023.pdf
6 Rider Levett Bucknall. (January 2023). RLB Construction Cost Report North America Q4 2022. https://www.rlb.com/americas/insight/ rlb-construction-cost-report-north-america-q42022/
7 Zillow. (n. d.). Housing Data. https://www.zillow. com/research/data/
8 Joint Center for Housing Studies of Harvard University. (2022). The State of the Nation’s Housing. Harvard University. https://www.jchs. harvard.edu/sites/default/files/reports/files/ Harvard_JCHS_State_Nations_Housing_2022.pdf
9 Freddie Mac. (July 2023). Mortgage Rates. https://www.freddiemac.com/pmms
10 U.S. Census Bureau. (2023). New Residential Construction Time Series / Trend Charts. https:// www.census.gov/construction/nrc/index.html
11 Joint Center for Housing Studies of Harvard University. (2022). The State of the Nation’s Housing. Harvard University. https://www.jchs. harvard.edu/sites/default/files/reports/files/ Harvard_JCHS_State_Nations_Housing_2022.pdf
12 U.S. Census Bureau. (2023). New Residential Construction Time Series / Trend Charts. https:// www.census.gov/construction/nrc/index.html
13 Federal Reserve Bank of St. Louis. (2023). Median Sales Price for New Houses Sold in the United States. FRED Economic Data. https://fred. stlouisfed.org/series/MSPNHSUS
14, 15 Joint Center for Housing Studies of Harvard University. (2022). The State of the Nation’s Housing. Harvard University. https://www.jchs. harvard.edu/sites/default/files/reports/files/ Harvard_JCHS_State_Nations_Housing_2022.pdf
16, 17 U.S Bureau of Labor and Statistics. (n. d.). Consumer Price Index. https://www.bls.gov/cpi/
18 Zillow. (n. d.). Housing Data. https://www.zillow. com/research/data/
19 Esri. (2022). ArcGIS Business Analyst. Bao. arcgis.com; Site To Do Business. https://bao. arcgis.com/esriBAO/
20, 21 United States Census Bureau. (2021). American Community Survey (ACS). Census.gov. https://data.census.gov/
22 Reid, C. K. (2018). The Rise of Single-Family Rentals after the Foreclosure Crisis. Terner Center at University of California Berkeley. https:// ternercenter.berkeley.edu/wp-content/uploads/ pdfs/Single-Family_Renters_Brief.pdf
23, 24,25, 26 National Association of Realtors. (May 2022). Impact of Institutional Buyers on Home Sales and Single-Family Rentals. https://cdn.nar.realtor/sites/default/files/ documents/2022-impact-of-institutionalbuyers-on-home-sales-and-single-familyrentals-05-12-2022.pdf
27 National Low Income Housing Coalition. (February 2023). Report Demonstrates Short Term Rentals Are Exacerbating Puerto Rico’s Housing Crisis. https://nlihc.org/resource/ report-demonstrates-short-term-rentals-areexacerbating-puerto-ricos-housing-crisis
28 AirDNA. (2021). 2021 U.S. Short-Term Rental Outlook Report. https://www.airdna.co/industryreport/2021-u-s-short-term-rental-outlook-report
29, 30 AirDNA. (n. d.). Vacation Rental Data. https://www.airdna.co/vacation-rental-data/app/ us/oklahoma/oklahoma-city/overview
31 , 32 U.S. Census Bureau. (2021). American Community Survey (ACS). Census.gov. https:// data.census.gov/
33 Esri. (2022). ArcGIS Business Analyst. Bao. arcgis.com; Site To Do Business. https://bao. arcgis.com/esriBAO/
34 Redfin. (2023). Real Estate, Homes for Sale, MLS Listings, Agents. Www.redfin.com. https:// www.redfin.com/
35 CoStar (2023). https://www.costar.com/
36 U.S. Census Bureau. (2021). American Community Survey (ACS). Census.gov. https:// data.census.gov/
37 Esri. (2022). ArcGIS Business Analyst. Bao. arcgis.com; Site To Do Business. https://bao. arcgis.com/esriBAO/
38 U.S. Census Bureau. (2021). American Community Survey (ACS). Census.gov. https:// data.census.gov/
39 U.S. Census Bureau. (n. d.). Metropolitan Areas. https://www2.census.gov/geo/pdfs/reference/ GARM/Ch13GARM.pdf
40 , 41 U.S. Census Bureau. (2021). American Community Survey (ACS). Census.gov. https:// data.census.gov/
42 Esri. (2022). ArcGIS Business Analyst. Bao. arcgis.com; Site To Do Business. https://bao. arcgis.com/esriBAO/
43 U.S. Department of Housing and Urban Development. (n. d.). SOCDS Permit Database. https://socds.huduser.gov/permits/
44 ,45 Esri. (2022). ArcGIS Business Analyst. Bao. arcgis.com; Site To Do Business. https://bao. arcgis.com/esriBAO/
46 U.S. Department of Housing and Urban Development. (n. d.). SOCDS Permit Database. https://socds.huduser.gov/permits/
47 Redfin. (2023). Real Estate, Homes for Sale, MLS Listings, Agents. Www.redfin.com. https:// www.redfin.com/
48, 49 Esri. (2022). ArcGIS Business Analyst. Bao. arcgis.com; Site To Do Business. https://bao. arcgis.com/esriBAO/
50 CoStar (2023). https://www.costar.com/
51 Greater Oklahoma City. (April 2023). Major Employers. https://www.greateroklahomacity. com/clientuploads/OKCMajorEmployers.pdf
52 Esri. (2022). ArcGIS Business Analyst. Bao. arcgis.com; Site To Do Business. https://bao. arcgis.com/esriBAO/
53, 54 U.S. Bureau of Labor Statistics. (2023). Local Area Unemployment Statistics. https:// data.bls.gov/PDQWeb/la
55, 56 Oklahoma Employment Security Commission. (2023). Industry and Occupational Employment Projections. https://oklahoma.gov/ oesc/labor-market/employment-projections.html


The prior section discussed general trends impacting housing and development in the Edmond market and they begin to create an understanding of what housing challenges the community faces. However, they do not provide a complete picture.
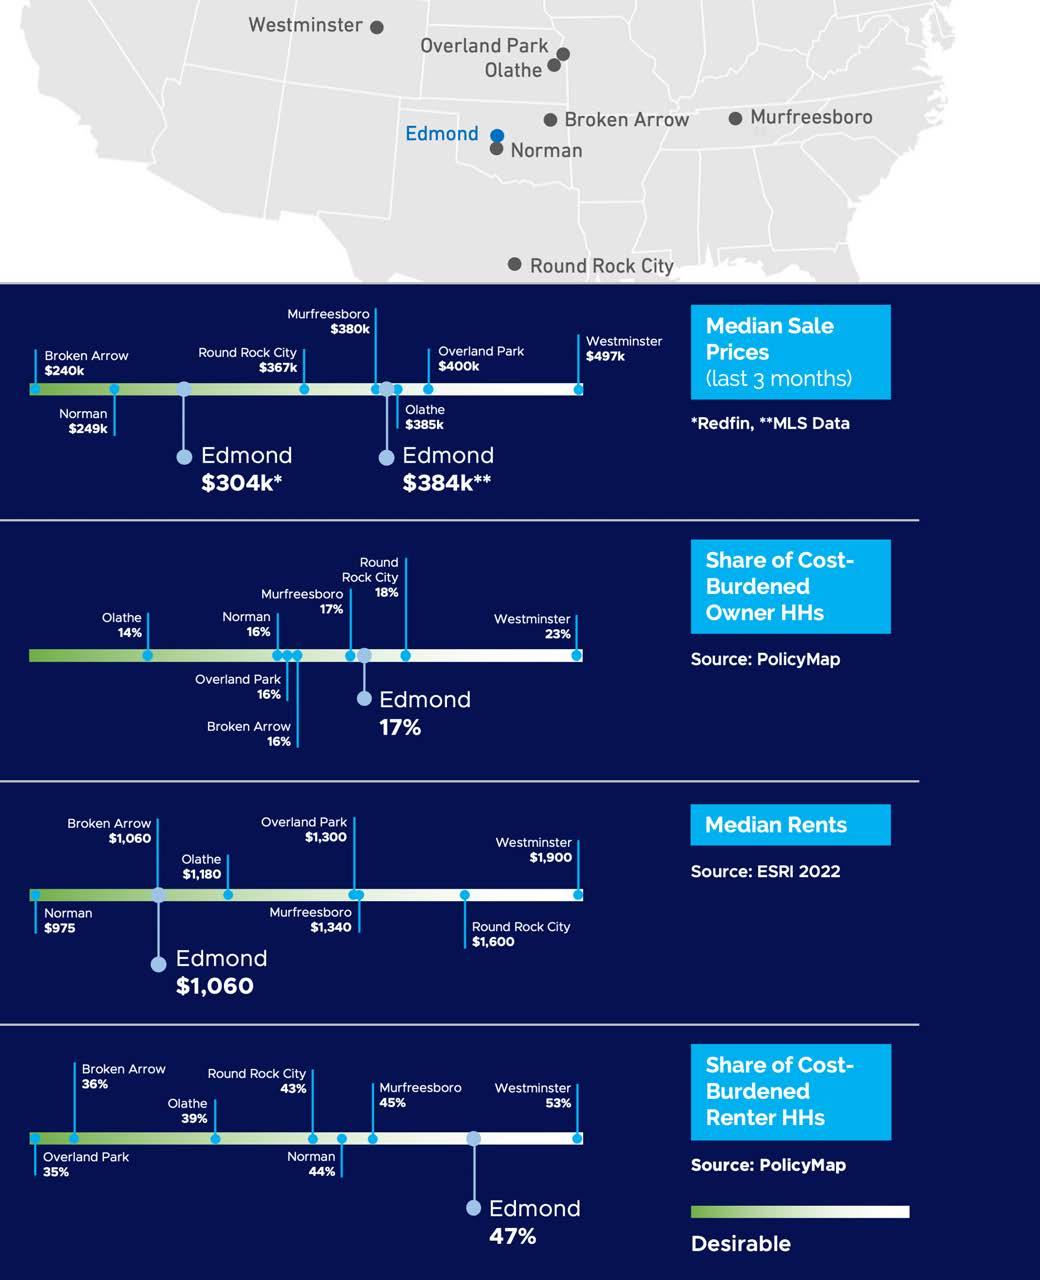
Detailed data analysis, conversations with community stakeholders, the housing needs survey, and other observations led to the identification of six key trends.
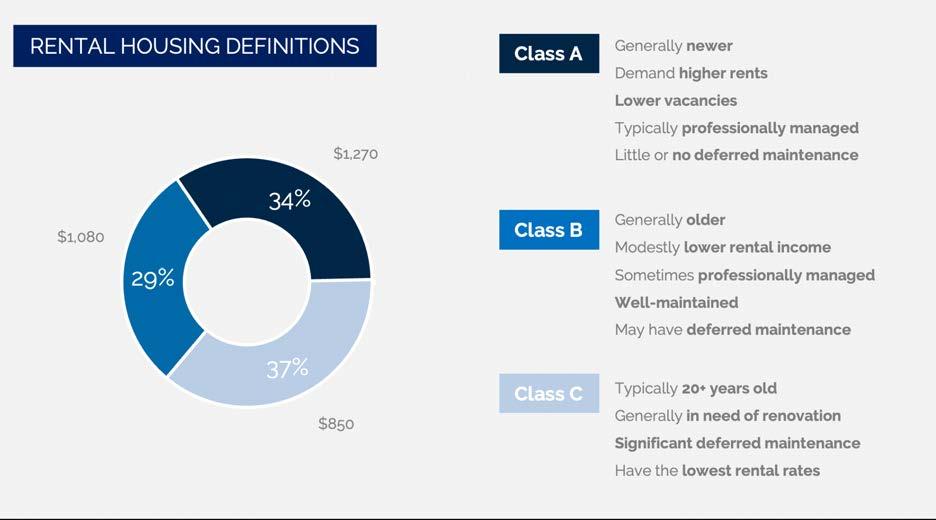
Nearly 40 percent of renters cannot afford a safe and decent two-bedroom unit in Edmond: a safe and decent two-bedroom unit costs $1,020 per month, including utilities1. “Safe and decent” means that the unit does not have any major maintenance needs, the mechanical systems are functional, and there are no health or safety hazards.
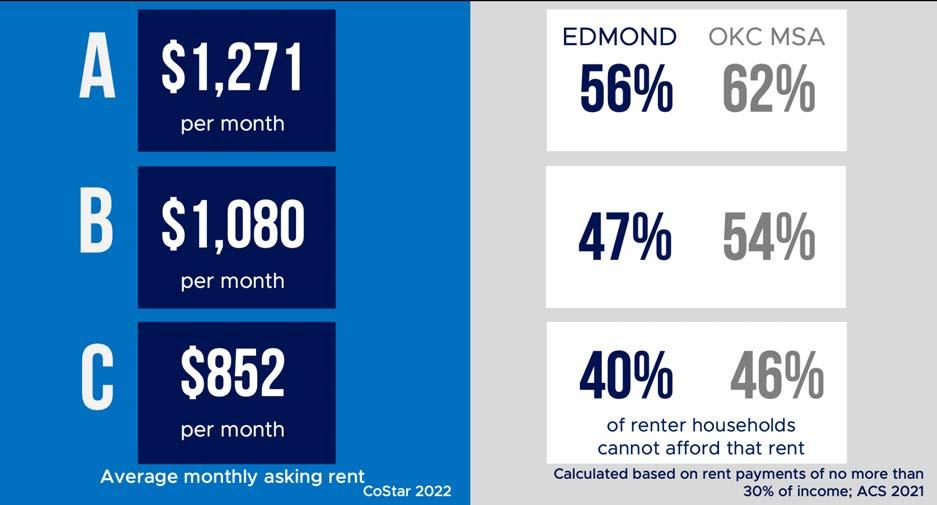
Nearly one-third of all households are housing cost burdened. Of the total households in Edmond, 17 percent of homeowners and 47 percent of renters are housing cost burdened2. Each month, these residents may have to make choices between paying for housing and securing other essentials like food, medicine, health care, and transportation.
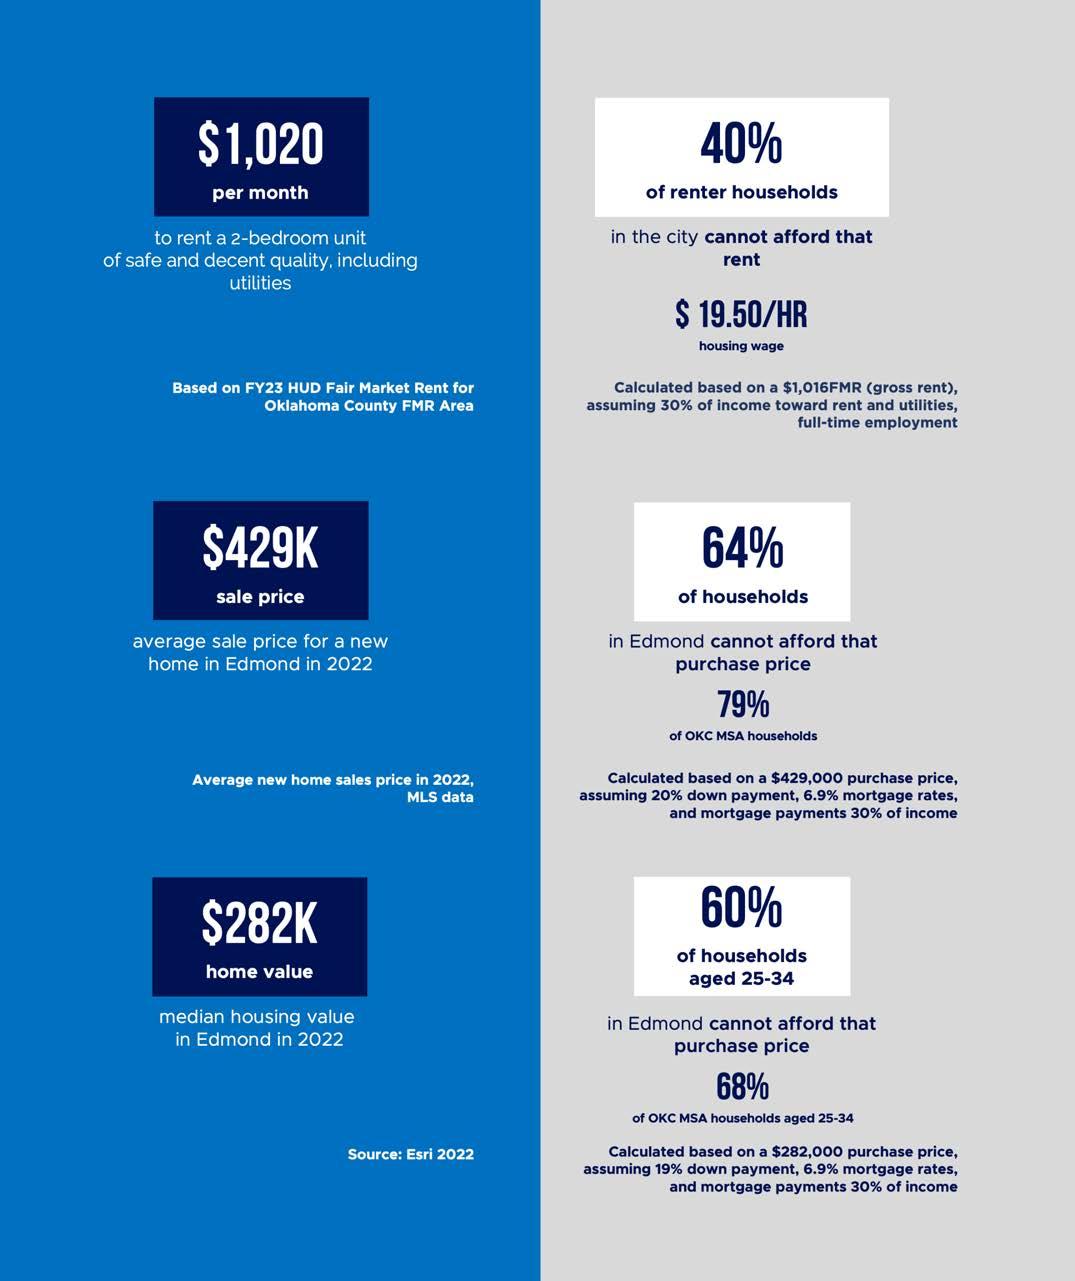
The average sale price for a new home in Edmond is about $429,0003. Sixty-four percent of households in Edmond today cannot afford that purchase price, and 79 percent of all households in the Oklahoma City MSA cannot afford to buy a house at that price. Housing affordability is particularly challenging for young adults aged 24 to 34—75 percent of this group cannot afford the average new home in Edmond4.
The median housing value of a home in Edmond is $282,0005. Sixty percent of households aged 25 to 34 cannot afford that purchase price. Sixtyeight percent of all households in the same age range in the Oklahoma City MSA cannot afford this price point6.
New home prices increased by 31 percent from 2017 to 2022 and the median home value increased by 38 percent. The price increases are making homeownership unattainable for many in Edmond.
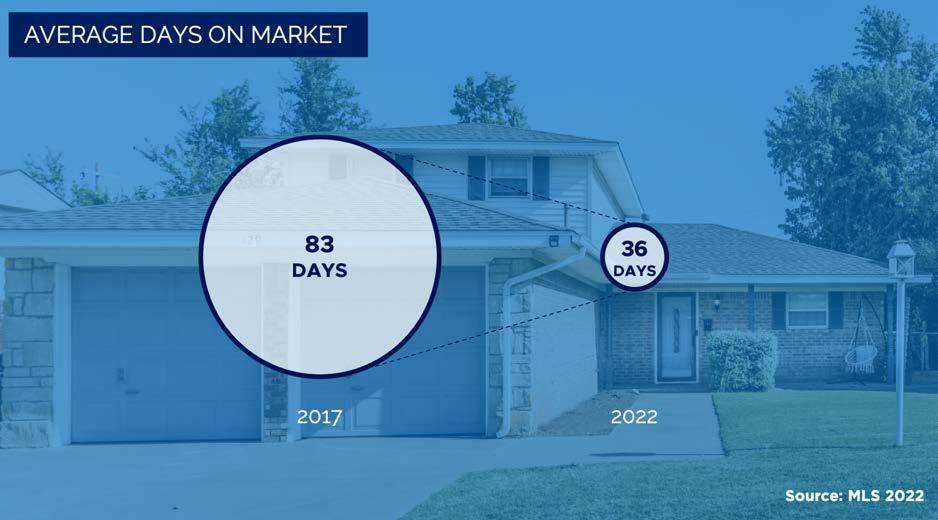
Homes are selling faster than ever. Between 2017 and 2022, the average number of days a home was on the market decreased from 83 to 367. Edmond’s desirability has made it more difficult for people to find homes in the community due to increased competition.
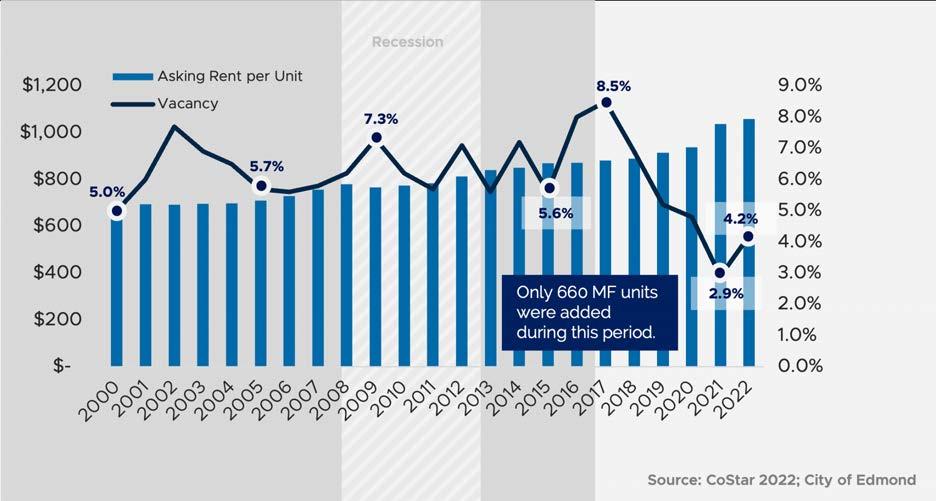
The rental housing market is also very competitive. Only 660 multifamily units were built in Edmond in the last five years, and most of those units are age-restricted for people aged 55 and older.8 Despite average rental rates being historically high, low vacancy rates indicate strong demand for more rental housing options in Edmond.
Long-term
is limited across Edmond. Many dedicated affordable units are located in the city’s western areas. These properties may have land use restrictions, were developed using tax credits, or are subject to housing programs that are affordable to qualifying households (those earning less than 60 percent of the area median income) and must remain affordable for a required number of years. Currently, there are 7,425 households that qualify for affordable housing in Edmond, but only 1,790 to 2,250 dedicated affordable units available to serve these qualifying households.9 Over 5,000 units are needed to close this gap.
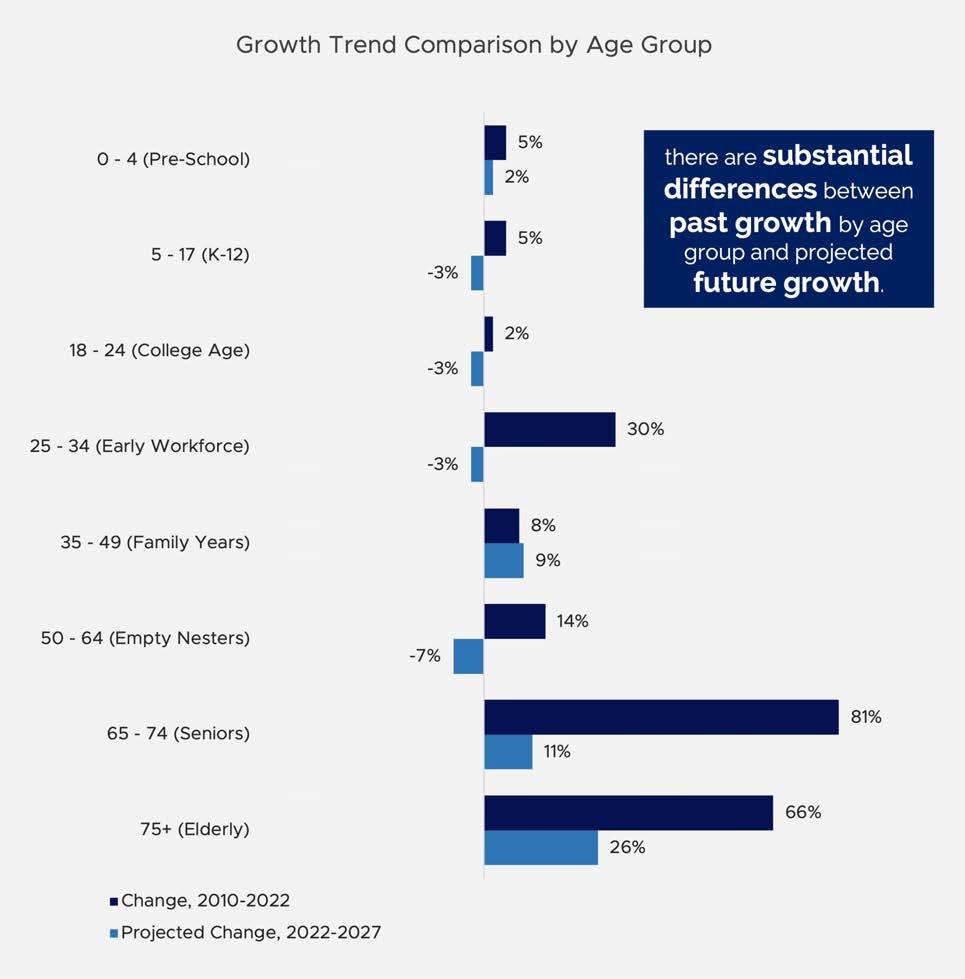
Asking Rent and Vacancy Rates in EdmondThe age distribution of Edmond’s population is projected to shift over the next five years. Edmond’s population makeup was very similar to Oklahoma County, the Oklahoma City MSA, and the United States in 2022. The early workforce (age 25 to 34), senior (age 65 to 74), and elderly populations (age 75+) grew substantially in Edmond between 2010 and 2022. However, the early workforce cohort is expected to decline between 2022 and 2027, along with school-aged children (age 5 to 17), college-aged young adults (age 18 to 24), and empty nesters (age 50 to 64)10.
If Edmond is to remain a community for all ages, it needs a variety of housing that is attainable for people and families throughout their lives. Young adults and families earn less and have less buying power. As people age and families grow, their earning potential increases, and so does their buying potential for housing. Different housing types target specific values and desires that allow people to move within in a community as their lifestyles change. Because Edmond does not have housing to support aging in place, for example, people may look to move out of the city as they grow older. Downsizing—moving to a home that has less square footage, less land, and/or is less expensive—in Edmond is also difficult given the current short supply of smaller and less expensive housing stock in Edmond. Older residents hoping to downsize are competing with first-time home buyers in an increasingly crowded market due to lack of affordable housing availability.
Edmond makes up 12 percent of Oklahoma County’s population and is a major contributor to the Oklahoma City MSA’s economy with eight percent of the county’s total jobs11. Seventeen percent of Edmond’s jobs are in education-related fields12. The job market is not expected to decline in the future, and housing products in Edmond will need to accommodate working families and their wages if the city wants to continue attracting residents to fill employment opportunities for people of all skill sets and experience levels.
Edmond is a retail center for the county. There are approximately 4,650 businesses registered in Edmond ranging in size13. The city makes up 14 percent of the county’s retail supply, which generates about $2.4 billion annually14
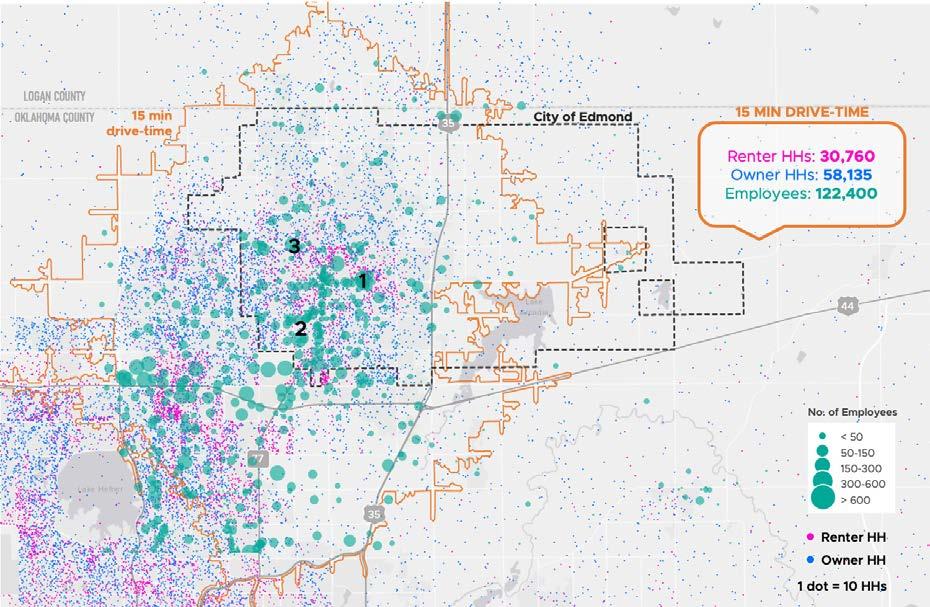
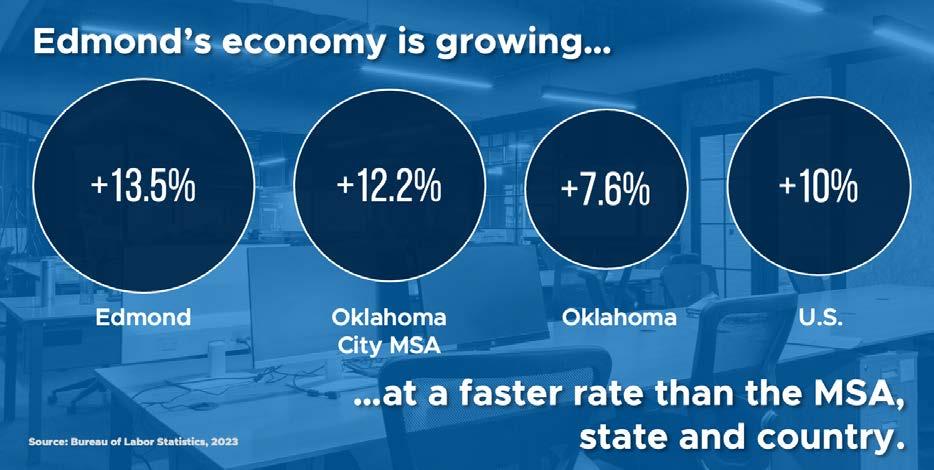
Edmond’s economy is growing at a faster rate than the Oklahoma City MSA, state of Oklahoma, and United States15. There are 38,000 jobs in the city, and job growth is expected to continue16. Most people will not consider commuting more than 30 minutes for a job, and some jobs require their employees live within a certain distance to work. Appropriate housing development is critical to enable employees to live and work in the same community, and situating housing near jobs helps reduce transportation costs.
Commuters face challenges, too. Nearly 75 percent of all workers employed within Edmond live outside the city17. Lack of affordable housing and limited access to regional public transit means that many employees are left with tough
choices about which shifts they are able to work. As a result, local employers have been unable to fill open positions and lose out on potential new hires.
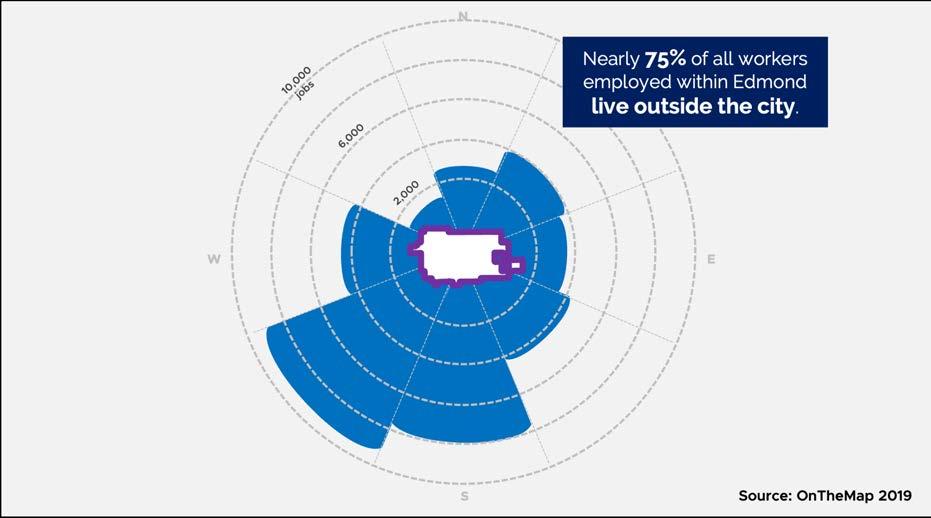
Additionally, as Edmond is forced to import workforce, it increases traffic congestion, especially during peak AM and PM times (the period when there is the highest volume of traffic for a continuous period of time)18. Traffic is one of the most highly rated concerns reported in Edmond’s Resident Satisfaction Survey: 39 percent of 2021 respondents said it was the single biggest issue facing the city. Promoting additional housing types and price points can help reduce congestion and address this resident concern.
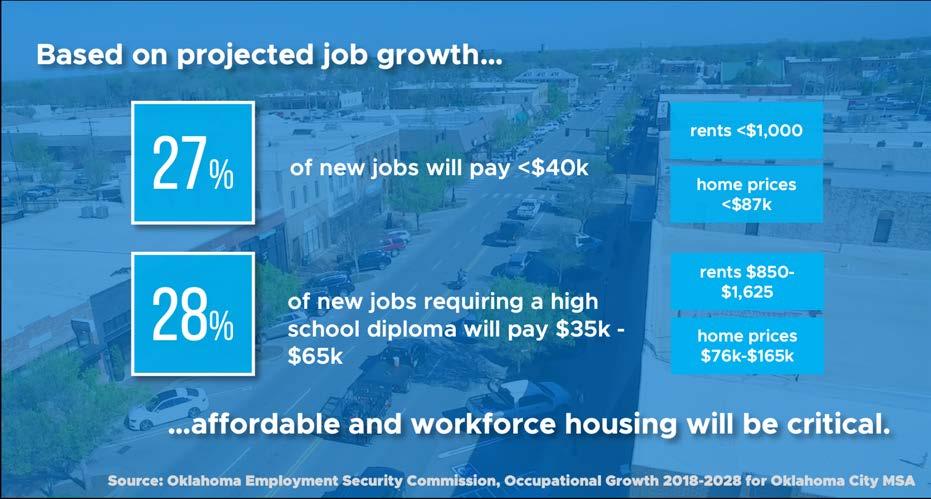
Rent and housing sales prices will need to decrease to house Edmond employees. Based on projected growth calculations, many of the growing and essential jobs in Edmond will not pay a wage that aligns with the housing market. It is expected that 27 percent of new jobs will pay less than $40,000 a year. Someone earning this wage will need a monthly rent less than $1,000 and home prices less than $87,000 if they want to both work and live in Edmond19. Quality housing of all types and at all price points—including affordable and workforce housing—is essential to retaining the workers that provide the services and products that Edmond residents have come to value as a part of the city’s quality of life.
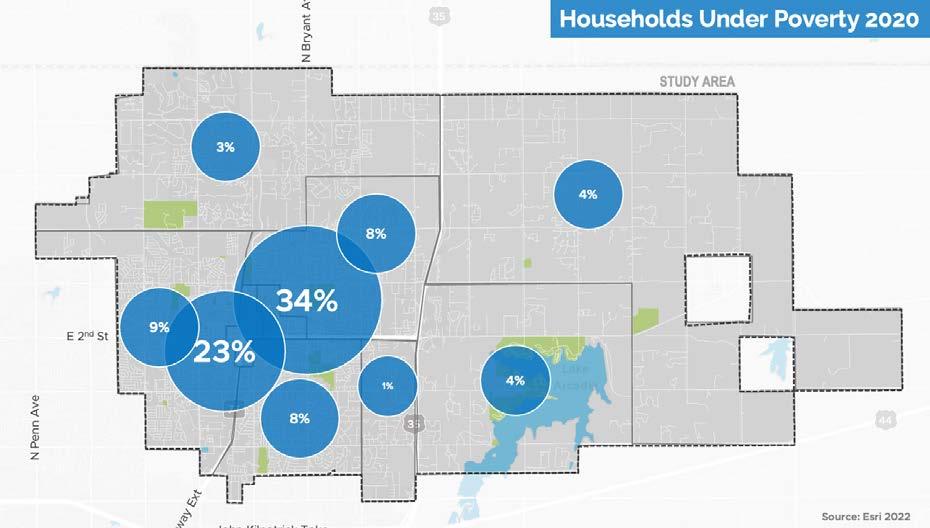
Poverty is highest near the core areas of Edmond. Programs have been created to help address the problems housing cost-burdened households face, but are not sufficient on their own. Preservation of lower-cost housing will be important for reducing poverty in Edmond.
Renters live in the core areas of Edmond. Planned developments will increase density, but additional for-rent options for residents should be spread throughout the city. This will provide residents with more housing opportunities and choice.
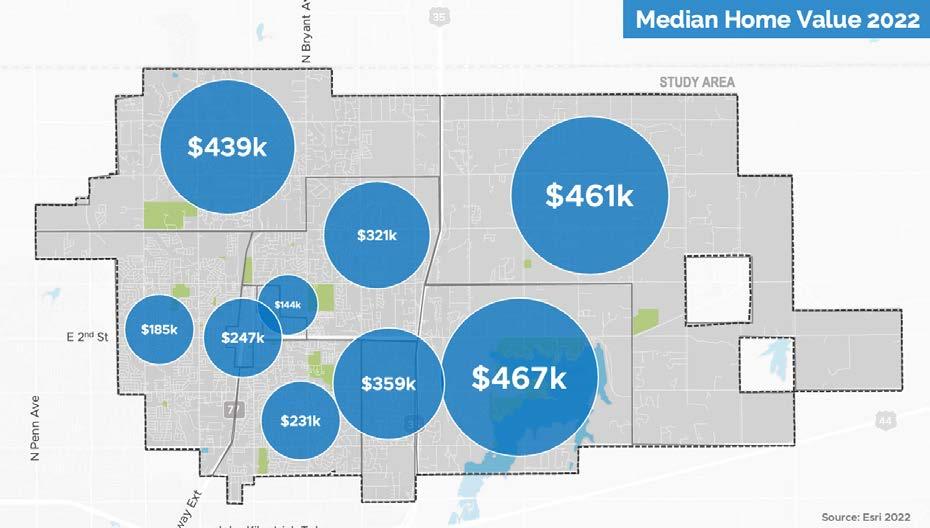
Housing stock and home values vary greatly from neighborhood to neighborhood. This has important implications not only for the housing options available for current and potential future Edmond residents, but also for tailoring and targeting the strategy tactics and resources outlined in this assessment. Not all Edmond neighborhoods will need the same types of investment and support.
For instance, the area around UCO has the lowest median housing values, and housing there is in need of renovation, rehab, and the preservation of affordable housing options. Conversely, areas of East Edmond may be suitable for housing diversification to introduce more attainable price points, in line with what is outlined in the East Edmond Plan.
Housing production in Edmond has nearly returned to pre-Recession levels, but 94 percent of permits issued over the last decade were for single-family homes20. Edmond’s housing makeup is different from that of the state and country’s: Edmond’s median housing value is just over $100,000 more than Oklahoma’s21, and new construction sales prices in Edmond are $167,000 more than Oklahoma’s and $68,000 more than the United States’22.
Edmond’s housing challenges are not exclusive, but they are more intense when compared to communities with similar growth trends. Comparable cities across the United States may appear to have higher rents, but renters in Edmond are more likely to be cost-burdened than renters in six of seven peer cities listed on the right.
Homeowners in Edmond are also more likely to be cost-burdened than homeowners in five of the seven peer cities. Edmond’s sluggish housing development is likely contributing to many of these issues.
There is demand in Edmond for housing of all types and price points, for-sale and for-rent, and diversifying the housing stock will help meet that need.
Demand for housing comes from several demand segments, including existing residents and new residents moving to the city. The needs of these segments differ, but there is some overlap among them—for example, many existing residents and potential residents need better access to quality housing at price points that are not currently available. It is important for the community to have a variety of housing options to support its continued growth and economic vitality.
For instance, attainable housing for young professionals and young families allows these households to establish roots, participate in the community, and invest their resources. Housing that allows aging-in-place for older adults provides options for long-time residents to stay in the community when their housing needs change. Housing that supports the workforce helps employers and business owners grown their local presence.
A community’s existing housing stock is influenced by many related factors, including historic housing policies, economic trends, and residents’ access, preferences, and choices at various points in history. Edmond’s rapid growth over the past several decades put pressure on the
local housing market overall, but housing needs still vary significantly by neighborhood and income level. Different areas and housing types require different approaches. Some areas of the city need programs that help residents with home repairs so that they can remain in their current homes, others need a greater variety of housing types, and still others may need infrastructure improvements to support housing development.
Edmond is growing because it continues to attract new residents, with its high quality of life, strong schools, job market, and favorable location within the region. However, many potential residents, including front line workers, young families, young professionals, empty nesters, and other groups, cannot find suitable housing options in the city. Part of the demand analysis considers what types and price points of housing are needed to support these target markets.
Determining market demand for the different needs and aspirations of existing and potential future residents requires a multi-faceted approach. To arrive at an overall housing demand for Edmond and project the scale of the city’s future need, five different approaches were used:
• Assesses income variables within the city to determine the amount and types of units that are affordable to existing residents.
• Considers consumer profiles of residents within the market area to determine desirable housing products that can attract them to Edmond.
• Uses household income levels and projected population growth to determine future demand.
• Uses age group projections, senior demographic data, and supply information from the market to determine future demand.
• Uses county-to-county migration data to understand inter- and intra-regional flow of population to compute demand.
Quantifying the number of households by affordability levels and product segments can inform both the housing price and rent levels required and the scale of the need in the market to address demand. The graphic on the right distills the HUD-determined Area Median Income (AMI) for the Oklahoma City MSA, adjusted for Edmond’s average household size, into various affordability levels. At each affordability level, ideal equivalent housing prices are set so that residents are not cost-burdened. This allows us to break up the market into different segments that correspond to different types of housing products. The chart also uses American Community Survey (ACS) data to show the number of households in Edmond that fall within each price bracket, with a further breakdown by race and ethnicity.
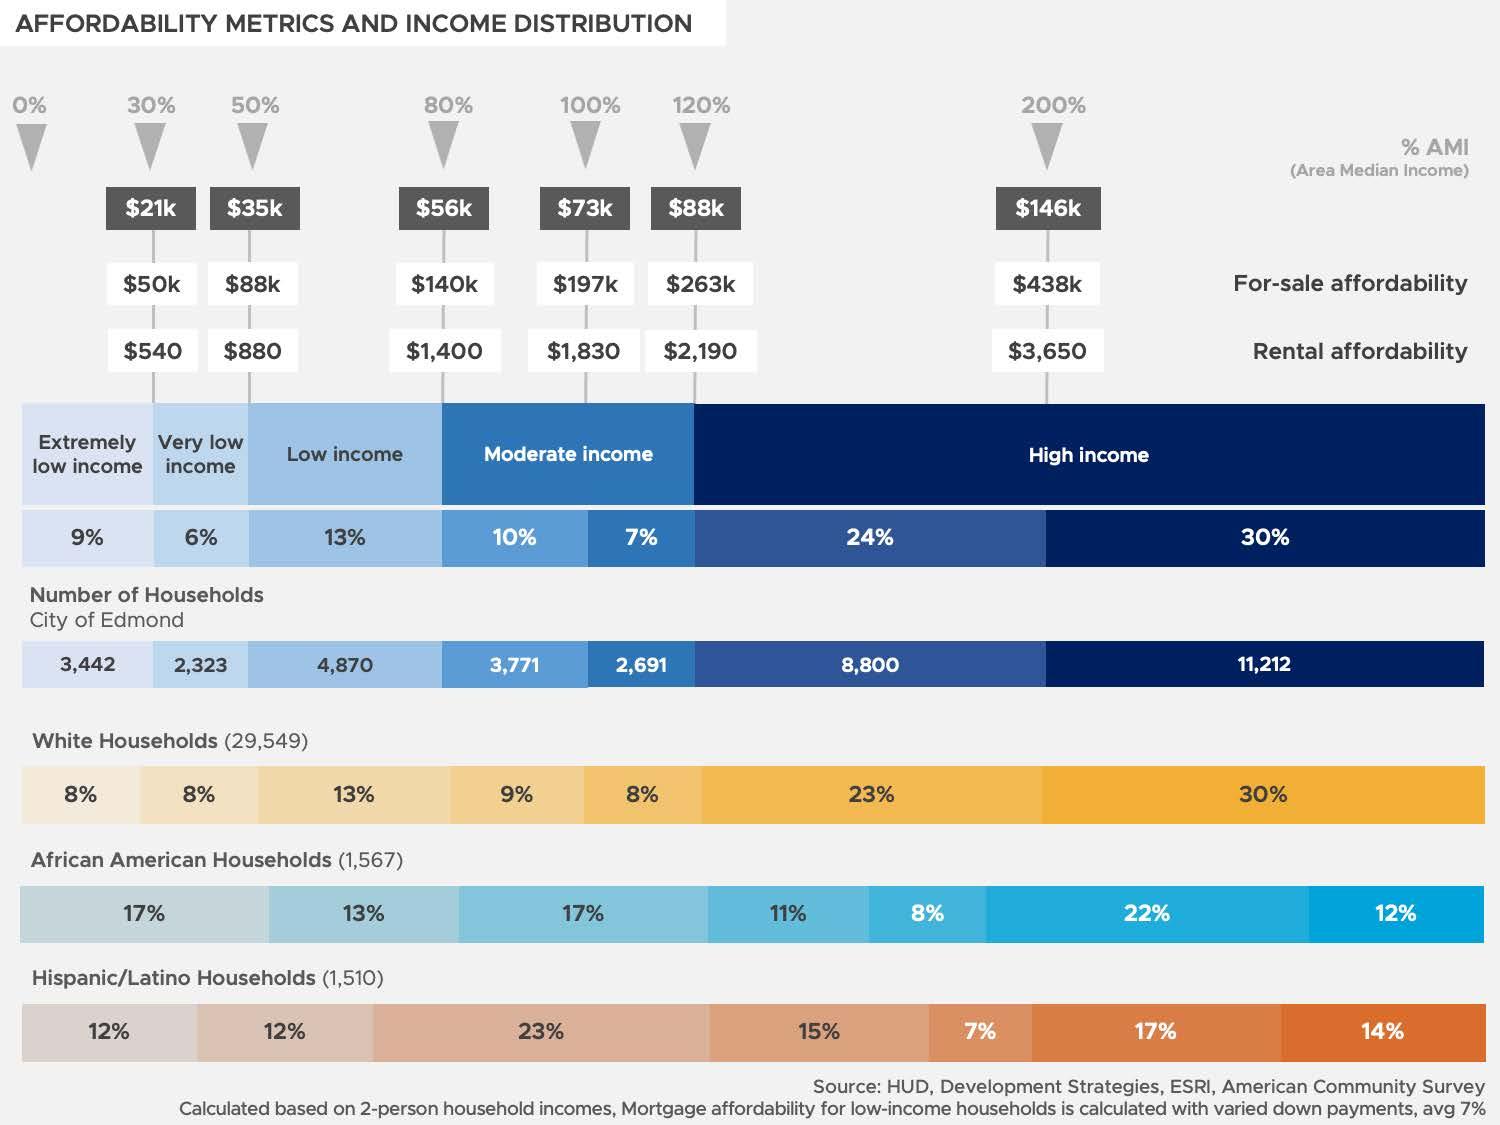
With population growth projected to slow over the next five years, the affordability levels of existing Edmond households and workforce will drive demand for housing in the near term. Attracting households from the broader metro area with diverse housing products currently absent in the market can drive additional demand.
The first step in the demand analysis is quantifying what existing households can afford without being cost burdened compared to what housing values or rents are currently in the city. This analysis highlights potential opportunities for development where there are gaps between existing housing supply and what households can afford. It can also provide a more nuanced look at how idealized household spending for Edmond’s market—that is, scenarios where households are not housing cost-burdened—lines up with the supply currently available in Edmond.
The ACS provides income distribution data by housing tenure and the share of owner and renter households in Edmond. In the charts at right, the ‘household affordability’ bars represent the number of households able to afford residential products at various price points, taking into account appropriate housing spending patterns at various income levels that would not result in a household becoming cost-burdened. This does not equate to actual household spending on housing. In some cases, households are spending more
than 30 percent of their income on housing, while others may spend significantly less due to higher saving levels, unavailability of a desired type of housing, or a number of other factors.
Each housing cost range (mortgage or rent) is assigned to a housing type to pair product with affordability, ranging from subsidized units to luxury housing products. It is important to note that housing value and rent data is for all units in the market based on U.S. Census Bureau’s ACS data and does not represent what is currently available, or listed, in the market.
The affordability gap analysis for owners shows:

• An oversupply of existing for-sale homes priced between $88,000 and $263,000.
• An under supply of for-sale homes priced above $263,000.
• A slight under supply of for-sale homes priced under $88,000.
There are important implications to consider. First, while this data indicates there is an oversupply of moderately-priced homes, it is currently rare for homes in this price range to be placed on the market. Thus, homes in this price range are currently unavailable, or have substantial competition when one becomes available.
Second, the analysis also shows there are many
households in Edmond that could afford more expensive homes than they currently live in, specifically homes priced at $263,000 or higher; however, there is an under supply of these homes. Thus, if these homes were available, more moderately-priced homes would also become available, creating market churn.
Third, this data does not include information about condition, age, number of bedrooms and bathrooms, and overall marketability. The Housing Needs Survey indicated that many households seeking housing encountered condition issues of some kind. Thus, much of this housing could require modest to substantial renovations to meet market preferences, which impacts affordability.
Finally, this data does not represent the challenges associated with attainable homeownership for low- and moderate-income households, including down payments, housing condition, etc.
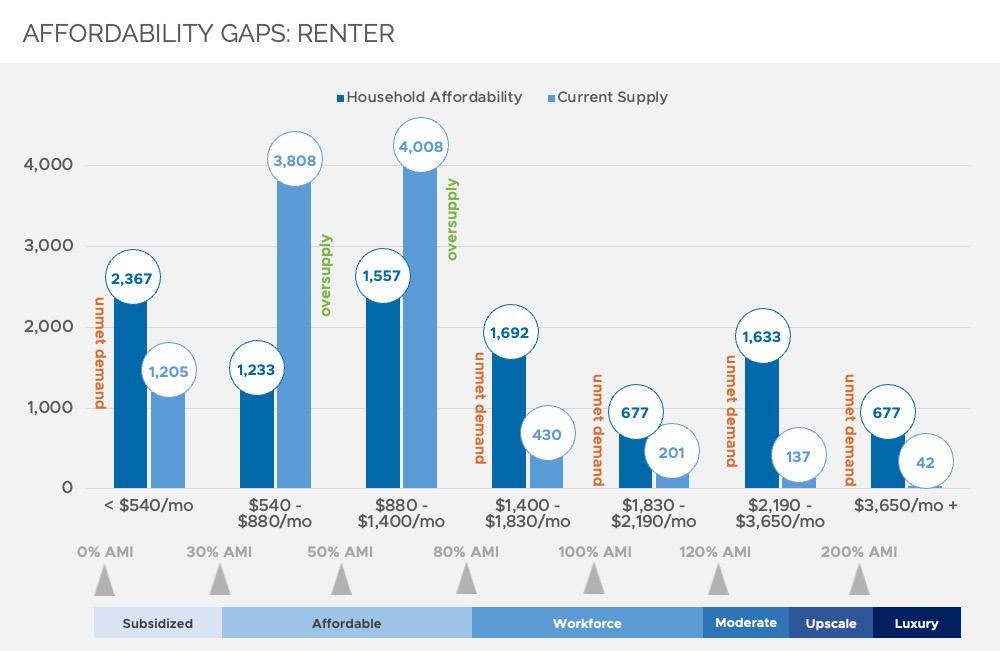
The affordability gap analysis for renters shows:
• An oversupply of existing rental homes priced between $540 and $1,400 per month.
• An under supply of existing rental homes priced below $540 per month.
• An under supply of existing rental homes priced over $1,400 per month.
The oversupply in the ‘affordable’ segment points largely to low quality of existing rental housing stock, especially in the private rental market. The high demand for publicly funded assisted housing, the low addition of newer affordable housing units, and the level of cost-burdened households in the city suggests the need for significant quality upgrades to the rental housing stock.
There is considerable unmet demand for very affordable housing—that is, housing that is affordable to those earning at or below 30 percent of AMI—at rents $540 and below. Additionally, there is substantial unmet demand for rental housing at workforce segment and above ($1,400 and up), which can be met with new construction, renovations, and natural aging of existing quality market-rate units.
The affordability gap analysis provides a high-level overview of where there are clear mismatches between supply and demand within the existing housing stock today. However, several other factors are important to consider. Housing quality is generally substandard at lower affordability levels. While these units are ‘affordable,’ their condition leads to higher utility bills and potential health and safety hazards.
Smaller for-sale units—like condos and townhomes—can be positioned at a more accessible price point for workforce and moderate-income households than larger detached single-family homes. Diversity in housing stock can fill these gaps and create a pathway to homeownership for a broader range of households. Renovating the existing housing stock will be key to meeting future demand and a wider range of housing needs.
Target market analysis provides more detail about what household groups are growing in Edmond and the region and what their housing preferences are.
Target market analysis helps to determine demand based consumer preferences, as well as geography and demographic traits. Just as market segmentation is used to determine tendencies to buy different types of consumer products, it can also help identify demand for and affordability of different types of housing products at a particular location. The market segments present in Edmond and the surrounding region were identified using Esri’s Community Tapestry™ data, which use algorithms to link demographic, geographic, and psychographic data to create 67 unique geodemographic segments.
Given Edmond’s growth patterns, demand will likely continue from the existing dominant groups, and development of housing that meets their preferences will be important.
The map to the upper right shows the five groups that are most common in Edmond:
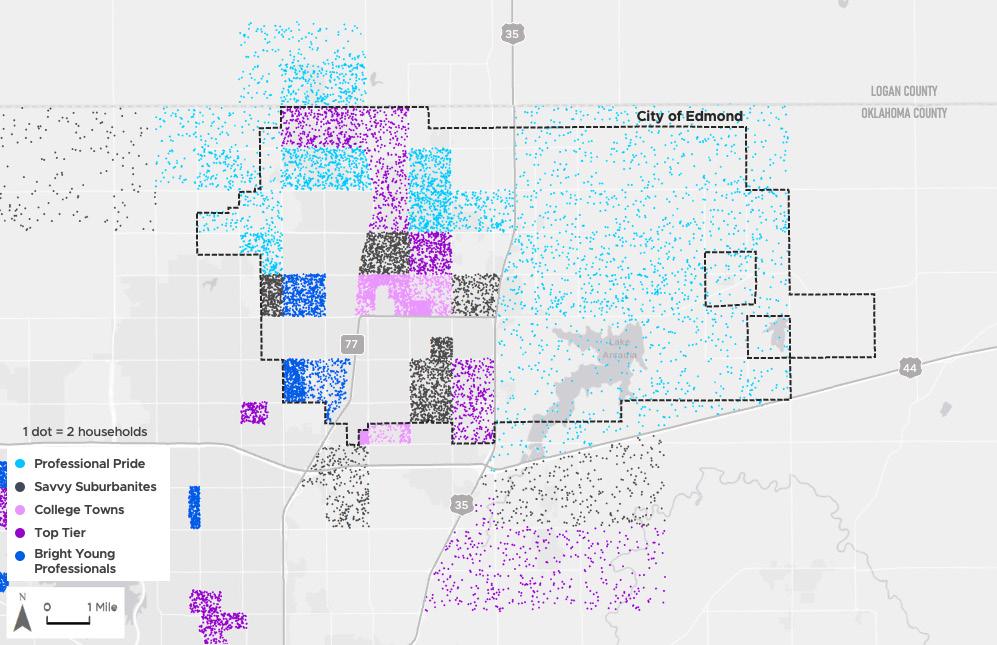
Top Tier: Married couples with no children or older children dominate this group. They own and live in the country’s highest-value homes in older neighborhoods on the suburban periphery of the largest metropolitan areas.
Professional Pride: These households are typically married couples, many with children.
They prefer single-family homes in newer neighborhoods (over 67 percent built in the past 20 years) at the suburban periphery of large metropolitan areas.
Savvy Suburbanites: Most of these households are married couples with no children or older children. They occupy single-family homes in established neighborhoods (most built between 1970 and 1990) on the suburban periphery of large metropolitan markets.
Bright Young Professionals: This group is composed primarily of couples, both married and unmarried, and also includes higher concentrations of single-parent and singleperson households. They live largely in multi-unit
buildings or row housing, much of it built between 1980 and 1999, and are more likely to rent than to own.
College Towns: This group is largely non-family households, many of whom are students living alone or with roommates. Most households rent, and housing types include dense student housing, local residences, and low-rent apartments.
The existing dominant groups in Edmond align with key trends observed through data analysis, survey results, and conversations with community stakeholders. They represent a mix of students, young professionals, and high-income households. These groups’ preferences support diversifying
housing types and price points to meet current and future demand as their populations grow.
The target market analysis also considers growing groups in the region that are underrepresented in Edmond. Often, households in these groups would consider, or even prefer, to live in Edmond, if the right housing product were available.
Using the population growth trends provided by Esri, we can estimate that more than half of the new potential households in Edmond will belong to the following Tapestry segments.
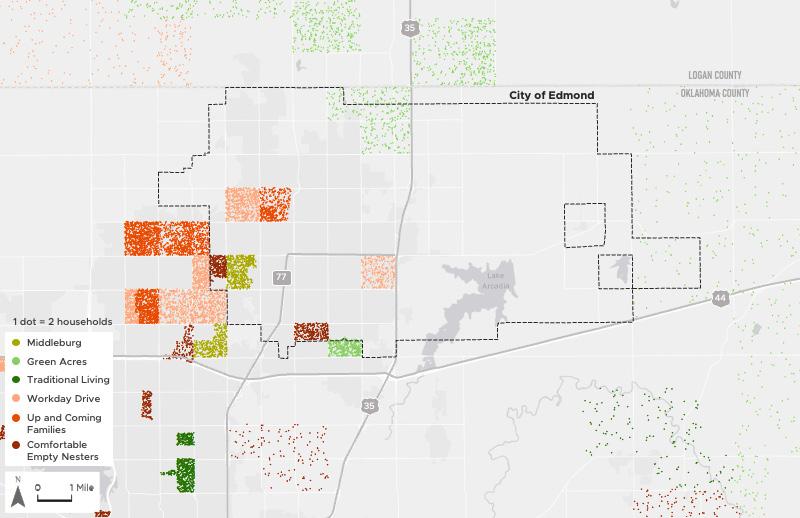
Comfortable Empty Nesters: These households are primarily married couples, most without children. They live in suburbs and small towns in metropolitan areas, usually in singlefamily detached homes.
Green Acres: A majority of these households are older married couples without children. This group tends to prefer rural settings in metropolitan areas. They are primarily interested in singlefamily homes with high acreages.
Middleburg: Most of these households are young couples, many with children. They occupy semirural locations in metropolitan areas, largely formerly rural neighborhoods that have changed rapidly in the past decade as new single-family homes have been built. Many live in mobile homes.
Workday Drive: These households are typically married couples with children. They tend to cluster in the suburban periphery of metropolitan areas and prefer single-family homes in newer neighborhoods (over 60 percent built after 1990).
Traditional Living: This group includes married couples, and some with children, but also higher proportions of single-person and single-parent households. They live primarily in lower-density urban clusters of metro areas, in single-family homes or duplexes within older neighborhoods.
Up and Coming Families: Most of these households are young families occupying singlefamily homes in new housing subdivisions. This group is made of young, mobile consumers and is a fast-growing market.
The potential target market groups include young families and older adults—groups that face particular challenges finding attainable housing in
Edmond. Other potential groups include frontline workers who would benefit from having attainable housing closer to work. Many of these households also have children.
Target market analysis yields theoretical demand for about 3,000 housing units in Edmond today.
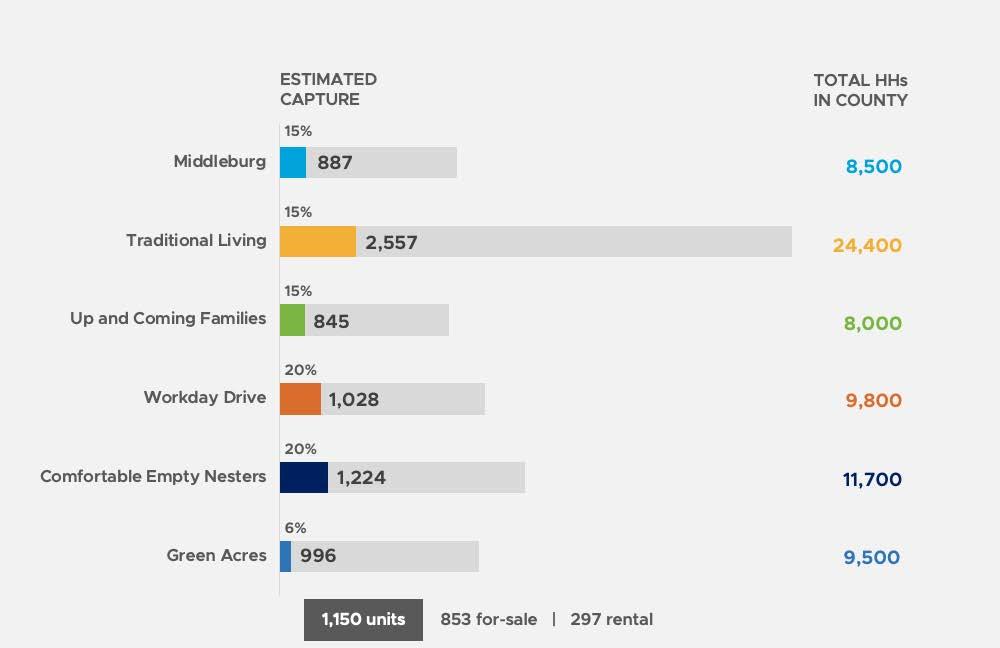
By applying a mathematical model to Esri Community Tapestry™ data on market segmentation, demand analysis of target market households with market-appropriate capture rates indicated support for about 800 rental and 2,200 for-sale units in Edmond from identified Tapestry groups found in Oklahoma County.
The graphic on the right outlines the new households available for capture in the region from Tapestry potential target market groups. The percentages estimate the share of these new households that Edmond can expect to capture by offering housing products that appeal to these groups.
The table on the opposite page shows the summary of existing owner and rental households within each Tapestry group alongside their implied housing product price point. Offering housing products within these ranges with architectural style, size, layouts, finishes, and other aligned consumer preferences can attract these household groups to Edmond.
New construction upscale and luxury for-sale and rental developments will be primarily driven by existing and new residents in the Top Tier, Professional Pride, and Savvy Suburbanites Tapestry groups. Members of the Workday Drive and Up and Coming Families Tapestry groups will also be attracted to newer single-family homes in Edmond’s newer neighborhoods. Predominantly
rental housing products in the subsidized, affordable, and workforce price points will attract existing and new residents in the Bright Young Professionals and College Towns Tapestry groups and provide opportunities for many to put down roots in Edmond.
Meanwhile, several Tapestry potential target market groups will be in search of housing products that are currently less abundant in Edmond’s market. The predominantly older residents in the Green Acres and Comfortable Empty Nesters groups are more likely to be attracted to housing products targeted to seniors, although many will opt to age in place if they are able. Young families in the Middleburg and
Traditional Living Tapestry groups will prefer modestly priced single-family and duplex housing found in Edmond’s older neighborhoods; some may also be attracted to mobile homes. These groups can afford homes priced within the affordable and workforce housing ranges.


Affordable housing is typically developed with tax credits used as equity to help finance the development of a property, while subsidized housing is generally provided through federal programs that provide a rent subsidy. Strategic usage of these programs throughout Edmond could improve housing conditions for a large share of current residents.
Low Income Housing Tax Credit (LIHTC) and mixed-income properties help diversity the existing rental housing stock. Such properties
provide quality residential options for residents who cannot afford market-rate development.
Housing affordability for Oklahoma County and Edmond is based on HUD-published household income limits, as well as tenure data from the American Community Survey (ACS).
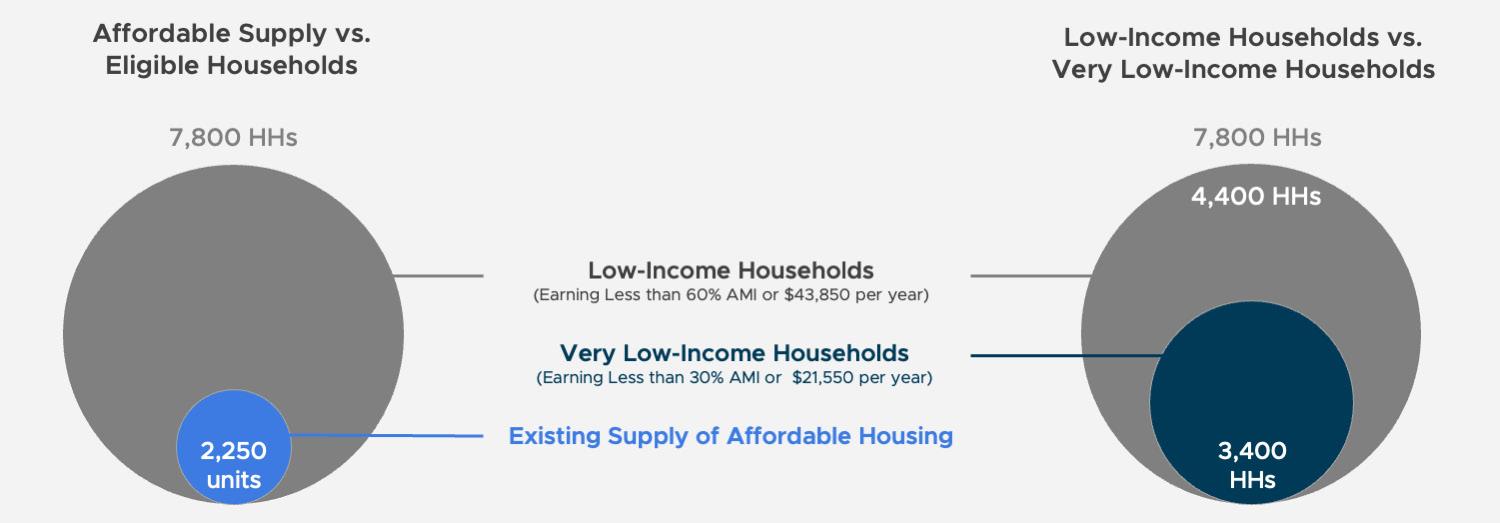
This data indicates that there are roughly 7,800 households in Edmond that would be incomeeligible for units at 60 percent AMI. Of those, about 3,400 are very low-income households at below 30 percent AMI. This far exceeds the existing supply of the up to 2,250 dedicated affordable housing units available in Edmond. These units participate in LIHTC, Housing Choice Vouchers, and other affordability programs. Some portion of this excess demand could be met with a combination of federal programs that
include LIHTC, Section 8 subsidies, and other development incentives.
At achievable LIHTC rents, roughly 2,430 renter households in Edmond would be income-qualified for affordable rental housing at 60 percent AMI without additional project-based rental assistance. Applying a capture rate of ten percent indicates that a series of affordable properties containing up to 240 additional units could be added to the market if appropriate sites are available.
In addition, a number of households are currently living in naturally occurring affordable housing, compromising on housing quality for affordability, or in other potentially vulnerable situations. One-third of all Edmond households are cost
burdened, including 47 percent of renterhouseholds. While ACS data shows that a very small proportion of Edmond’s housing has severe condition challenges (only 100 units lack adequate plumbing, for instance), 34 percent of survey respondents indicated encountering homes and apartments in need of significant repair.
Considering these factors, approximately 25 percent of households qualifying for affordable housing but not living in dedicated affordable units are at risk. The preservation of existing naturally occurring affordable housing and addition of new units will ensure that these 1,300 households have suitable housing.
Future affordable housing projections are based
on the assumed need of households earning at or below 60 percent of AMI, including service workers, retirees, and others on fixed incomes to have options in Edmond. Considering recent growth patterns, jobs projections, and other factors, this income group is projected to grow by 2,400 households over the next 10 years.
As with current demand considerations, these projections assume that a portion of these households, both homeowners and renters, will find suitable and attainable housing in the private market. However, the need for dedicated units will grow to limit housing vulnerability.
Over the past decade, approximately 20 to 30 new dedicated rental and for-sale homes were added to Edmond each year, including LIHTC units and homeownership options produced by
Turning Point Ministries. While each of these units is critical to the housing market, it is important to look for ways to increase the supply of dedicated affordable units.
If new tools were created and funding sources aligned to support an average of 120 additional units per year—bringing the total production of affordable units to 150 per year—1,500 additional new dedicated affordable housing units could be constructed over the next 10 years. This would move Edmond closer to meeting its affordable housing demand and reduce the affordable housing gap from 1,300 to 950 units by 2033.
There is a projected need for approximately 2,150 quality affordable units over the next 10 years, which would require increasing annual production to 215 units.
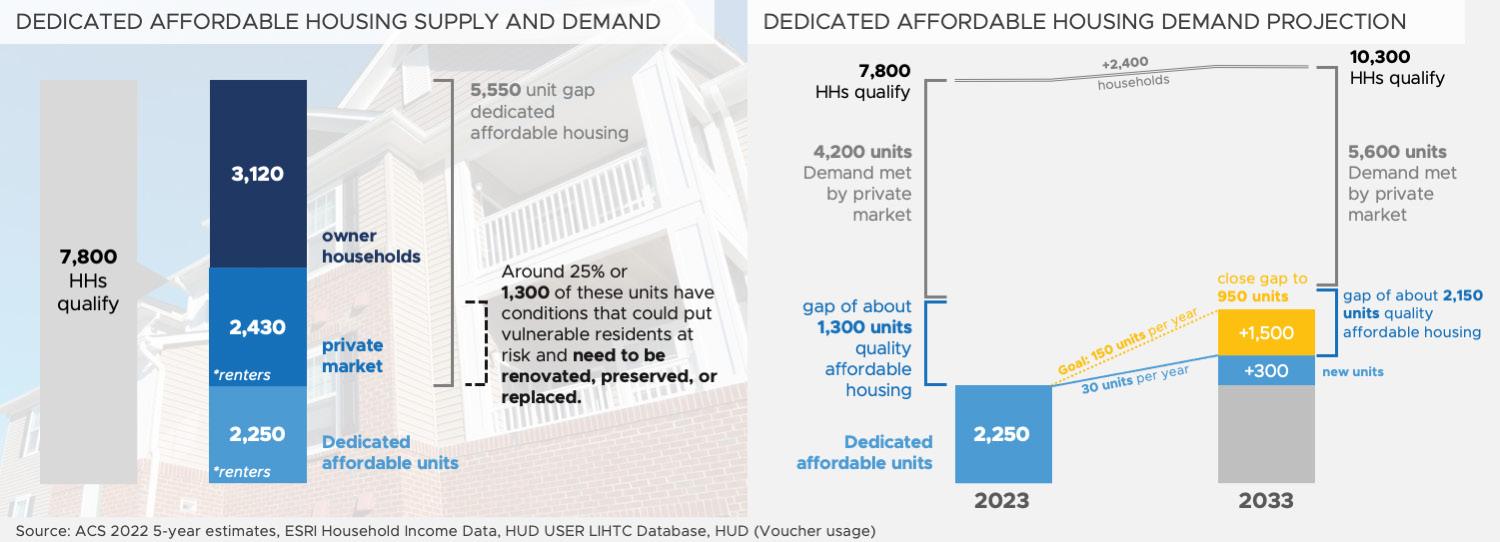
Older adults continue to live longer, yet many prefer to no longer care for single-family homes, larger spaces, or yards. New housing typologies will be necessary to allow seniors to remain in their current neighborhoods.
Like in many regions across the country, the senior population in the Edmond region is expected to grow at a much faster rate than the population overall over the next several years. While many seniors will choose to stay in their homes as long as possible, alternative housing arrangements may be necessary as housing preferences and care needs change. This often presents a challenge in low-income areas due to the high
costs of senior care. Additional senior housing options can accomplish at least two important goals: they free up existing housing stock for firsttime buyers, and they provide seniors with a more suitable housing option to meet their lifestyle preferences.
The senior market has moved away from more institutional settings such as nursing and skilled care facilities over the past few decades. Now, the bulk of current senior housing supply consists of contemporary assisted living, memory care, and independent living communities. Costs for these properties are often prohibitively high even more moderate-income senior households, with monthly rates exceeding $5,000. Many of these communities cater to individuals or households with substantial home equity.
As the population of those aged 65 and older continues to grow, demand for senior-oriented housing will grow as well. A total of approximately 2,200 units will be needed to meet senior housing demand.
As illustrated in the graphic at the bottom left, demand for senior-oriented housing makes up a relatively small share of senior population housing demand.
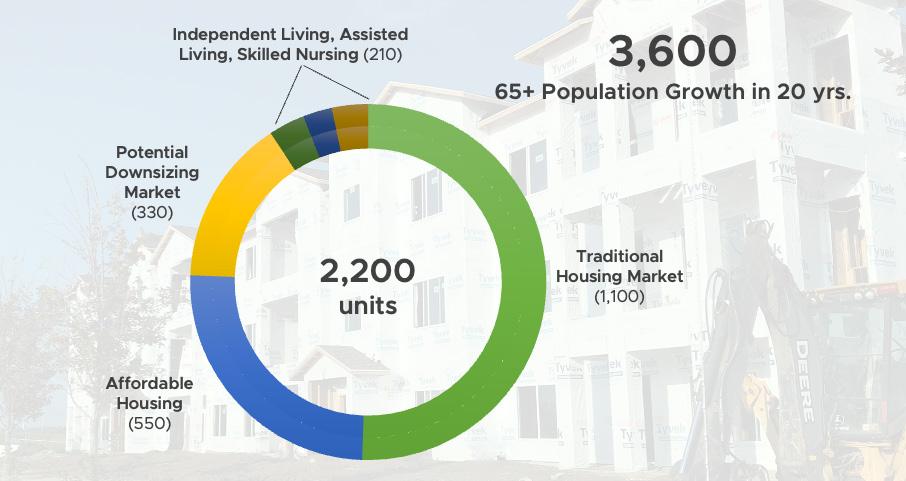
• About 50 percent of households (1,100 total) will find appropriate housing on the traditional housing market. This consists of primarily forsale single-family homes and for-sale or rental villas/attached homes.
• About 25 percent of households (550 total) will need affordable housing of some kind (that is, housing for households earning 60 percent of AMI or less). Most senior-oriented affordable housing consists of one- and two-bedroom rental units as well as affordable options for aging in place.
• About 15 percent of households (330 total) make up the potential downsizing market—that is, primarily those who would sell their existing, often larger (three- or four-bedroom) home for something smaller. Villas, townhomes, condominiums, and other similar missing middle products are the primary home types for this cohort.
• The remaining 9 percent of households (210 total) in the senior population lives in independent living, assisted living, or skilled nursing facilities, including memory care.
Several residents suggested in the housing survey, stakeholder conversations, and popup events that households moving from outof-state were a primary cause of Edmond’s rapid price appreciation and other housing challenges. Migration data provided by the U.S. Census Bureau indicates that about 70 percent of households moving into Oklahoma County originate from other counties in the state. Further, the county only has a slightly positive net migration (460 households), meaning that nearly as many households leave the county as those who move to it from other places.
The top origin counties and areas moving into Oklahoma County are:
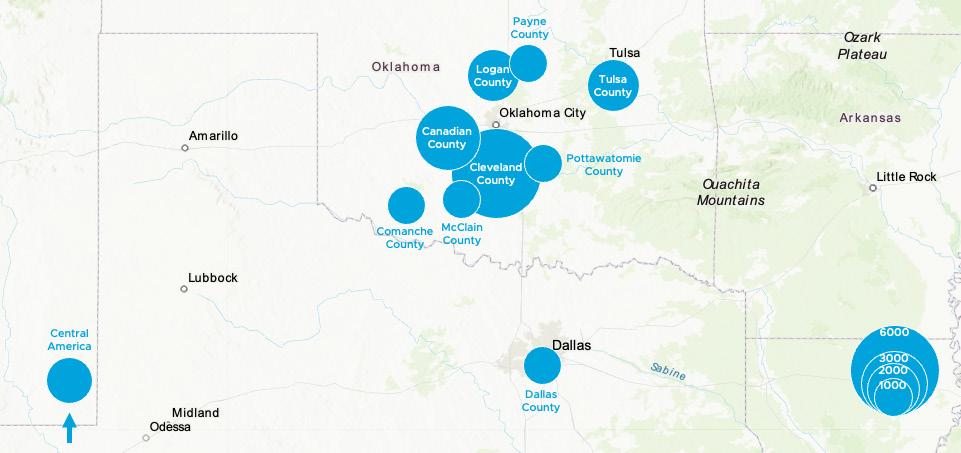
• Cleveland County, Oklahoma (6,400)
• Canadian County, Oklahoma (2,700)
• Tulsa County, Oklahoma (1,600)
• Logan County, Oklahoma (1,500)
• Central America (1,500)
The top five counties for out-migration are:
• Cleveland County, Oklahoma (8,900)
• Canadian County, Oklahoma (3,600)
• Tulsa County, Oklahoma (1,900)
• Logan County, Oklahoma (1,200)
• Payne County, Oklahoma (1,100)
This data is not available specific to Edmond (vs. Oklahoma County). However, county trends suggest that in-migration from coastal areas is not a major contributor to current housing demand.
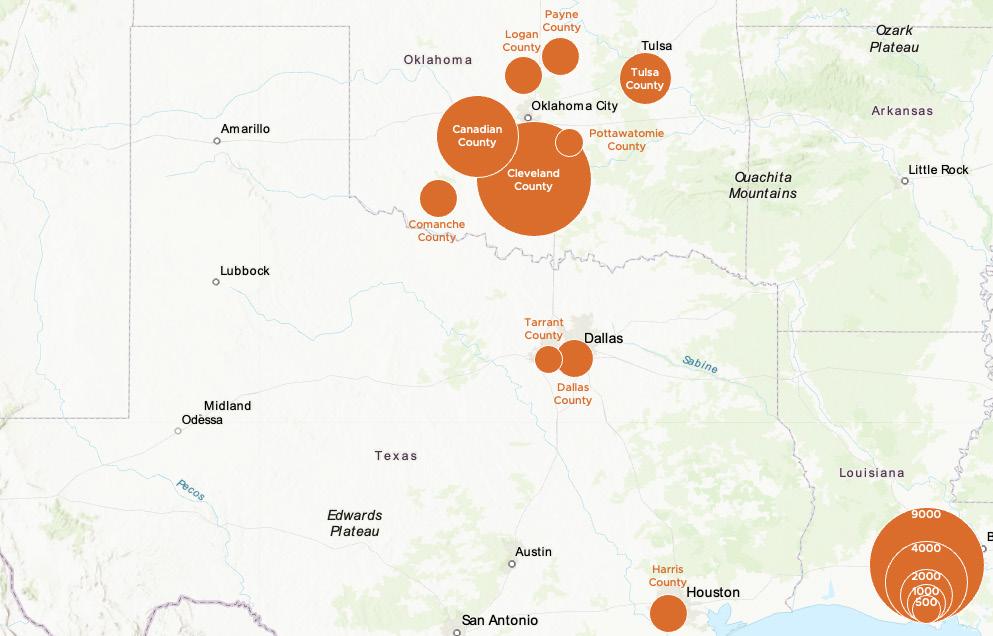
Oklahoma County, 2016-2020
Oklahoma County, 2016-2020
New housing demand will be driven primarily by new development, as the city has low for-sale and for-rent vacancy.
Demand for new housing generally consists of a combination of household growth and the replacement of obsolete residential units.
Demographic indicators over the next ten years estimate continued population growth in Edmond. The current demand estimates include adding for-sale units to create a balanced market (i.e., a six-month inventory) and adding rental units to increase vacancy to an industry target of 7.0 percent. Very little of Edmond’s housing stock is in need of outright replacement; however, a growing
percentage needs moderate to substantial repairs to maintain reasonable quality.
Demand in Edmond will primarily be driven by continued population growth and be met by new development, ideally of a wider variety of typologies and price points.
Another important consideration is that Edmond is an outlier in the Oklahoma City region in terms of the distribution of household income groups. As documented throughout this report, many households—including young professionals, young families, older adults, frontline and service workers, and long-term residents on fixed incomes—have very few housing options in Edmond. Yet, these and other groups are important to the long-term viability of the community. For instance, young professionals
and young families look to establish roots in a community, are active in the schools, and are future leaders and entrepreneurs. Older adults may prefer to downsize or have less maintenance and maintain their ties and spending in Edmond. Frontline and services workers allow local businesses and institutions to maintain the high level of service they are known for, as well as grow.
For these reasons, the demand projections assume that more attainable housing for all household groups will be available. Thus, the distribution of households by income is projected to shift over time as more diverse housing types become available.
The dominant housing type in Edmond is the single-family home, and Edmond has been building far more of this housing type than its peers. This has long-term implications.
As detailed in this study, single-family homes were the primary type of housing built in Edmond over the past decade: 94 percent of permits issued were for single-family homes, compared to 82 percent in Oklahoma and 63 percent nationwide. Production had nearly returned to pre-Recession levels as of 2021.
The market analysis clearly concludes that there is a need for a diversity of housing types to retain and attract residents, particularly for young families and seniors. While single-family
homes will continue to be the dominant housing type, there is a growing demand for attached and/or maintenance-free homes, as well as for quality multifamily options over the long term. It is therefore important to assess how demand for different housing types will change over the 10year demand projection period.
The table below summarizes demand projections for different housing types, with adjustments to the ratios to allow for a more diverse housing stock.
Understanding the projected shift in housing type over the next 10 years will allow Edmond to identify ideal sites, work with land and housing developers, update its zoning code, and assess its comprehensive plan to ensure that these types of housing are adequately supported.
There is a need for the following housing to support demand and provide equitable housing choices over the next 10 years:
• 1,520 units of affordable housing at or below 50 percent of AMI (1,225 rental and 295 forsale), with rents of less than $880 per month and for-sale prices less than $88,000
• 2,960 units of workforce-affordable housing affordable between 50 percent and 120 percent of AMI (1,325 rental and 1,635 for-sale), with rents between $880 and $2,190 per month and for-sale prices between $88,000 and $263,000
• 4,460 units of market-rate housing (870 rental and 3,590 for-sale), with rents of $2,190 per month and above and for-sale prices over $263,000
*Counts for each structure type may not sum to the total due to rounding
Source: Esri 2022, ACS 2022 5-year estimates
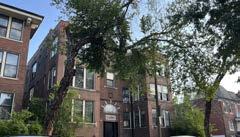
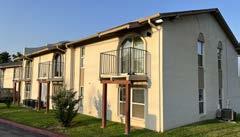
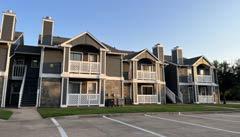

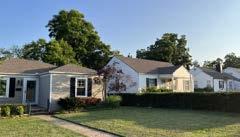

1 U.S. Department of Housing and Urban Development (HUD). (2022). FY 2023 Fair Market Rent Documentation System - FY 2023 Oklahoma City, OK HUD Metro FMR Area FMRs for All Bedroom Sizes. Www.huduser.gov; Program Parameters and Research Division, HUD. https:// www.huduser.gov/portal/datasets/fmr/fmrs/ FY2023_code/2023summary.odn
Based on FY23 HUD Fair Market Rent for Oklahoma County FMR Area; calculated based on a $1,016 FMR (gross rent), assuming 30% of income toward rent and utilities and full-time employment
2 Esri. (2022). ArcGIS Business Analyst. Bao. arcgis.com; Site To Do Business. https://bao. arcgis.com/esriBAO/
3, 4 Multiple Listing Network. (2022). Multiple Listing Service (MLS) - MLS Listings, Real Estate Property Listings, Homes for Sale. MLS.com; Multiple Listing Network. https://www.mls.com/
Average new home sales price in 2022 MLS data; calculated based on a $429,000 purchase price, assuming 20% down payment, 6.9% mortgage rates, and mortgage payments 30% of income
5, 6 Esri. (2022). ArcGIS Business Analyst. Bao. arcgis.com; Site To Do Business. https://bao. arcgis.com/esriBAO/
Calculated based on a $282,000 purchase price, assuming 19% down payment, 6.9% mortgage rates, and mortgage payments 30% of income
7 Multiple Listing Network. (2022). Multiple Listing Service (MLS) - MLS Listings, Real Estate Property Listings, Homes for Sale. MLS.com; Multiple Listing Network. https://www.mls.com/
8 City of Edmond; “SOCDS Building Permits Database.” Socds.huduser.gov, socds.huduser. gov/permits/index.html.
9 U.S. Department of Housing and Urban Development (HUD). (2022b). Picture of Subsidized Households - Assisted Housing: National and Local. Www.huduser.gov; HUD User. https://www.huduser.gov/portal/datasets/ assthsg.html
10 Esri. (2022). ArcGIS Business Analyst. Bao. arcgis.com; Site To Do Business. https://bao. arcgis.com/esriBAO/
11 United States Census Bureau. (2019). OnTheMap.Census.gov; U.S.Census Bureau, Center for Economic Studies, LEHD. https:// onthemap.ces.census.gov/
12, 13 Esri. (2022). ArcGIS Business Analyst. Bao. arcgis.com
14“City of Edmond, Budget & Financial Plan, FY 23-24.” Issuu, issuu.com/cityofedmond/docs/ budget_book_fy23-24?fr=xKAE9_zU1NQ.; Esri. (2022). ArcGIS Business Analyst. Bao.arcgis.com Retail Marketplace Profile
15 U.S. Bureau of Labor Statistics (BLS). (2023). Employment Data - Labor Force Statistics. Bls.gov. https://www.bls.gov/data/#employment
16, 17 United States Census Bureau. (2019). OnTheMap.Census.gov; U.S.Census Bureau, Center for Economic Studies, LEHD. https://
18 Law Insider. (2023). Peak hour traffic definition. lawinsider.com. https://www. lawinsider.com/dictionary/peak-hourtraffic#:~:text=Peak%20hour%20traffic%20 means%20traffic,segment%20of%20a%20 transportation%20facility. Additionally, as Edmond is forced to import workforce, it increases traffic congestion, especially during peak AM and PM times (the period when there is the highest volume of traffic for a continuous period of time)18
19 Oklahoma Employment Security Commission, Occupational Growth 2018-2028 for Oklahoma City MSA
20 City of Edmond. 2022. edmondok.gov. Building Permits Issued. https://www.edmondok.gov/ Archive.aspx?AMID=49; “SOCDS Building Permits Database.” Socds.huduser.gov, socds.huduser. gov/permits/index.html
21 Esri. (2022). ArcGIS Business Analyst. Bao. arcgis.com; Site To Do Business. https://bao. arcgis.com/esriBAO/
22 United States Census Bureau. (2021). American Community Survey (ACS). Census.gov. https://data.census.gov/
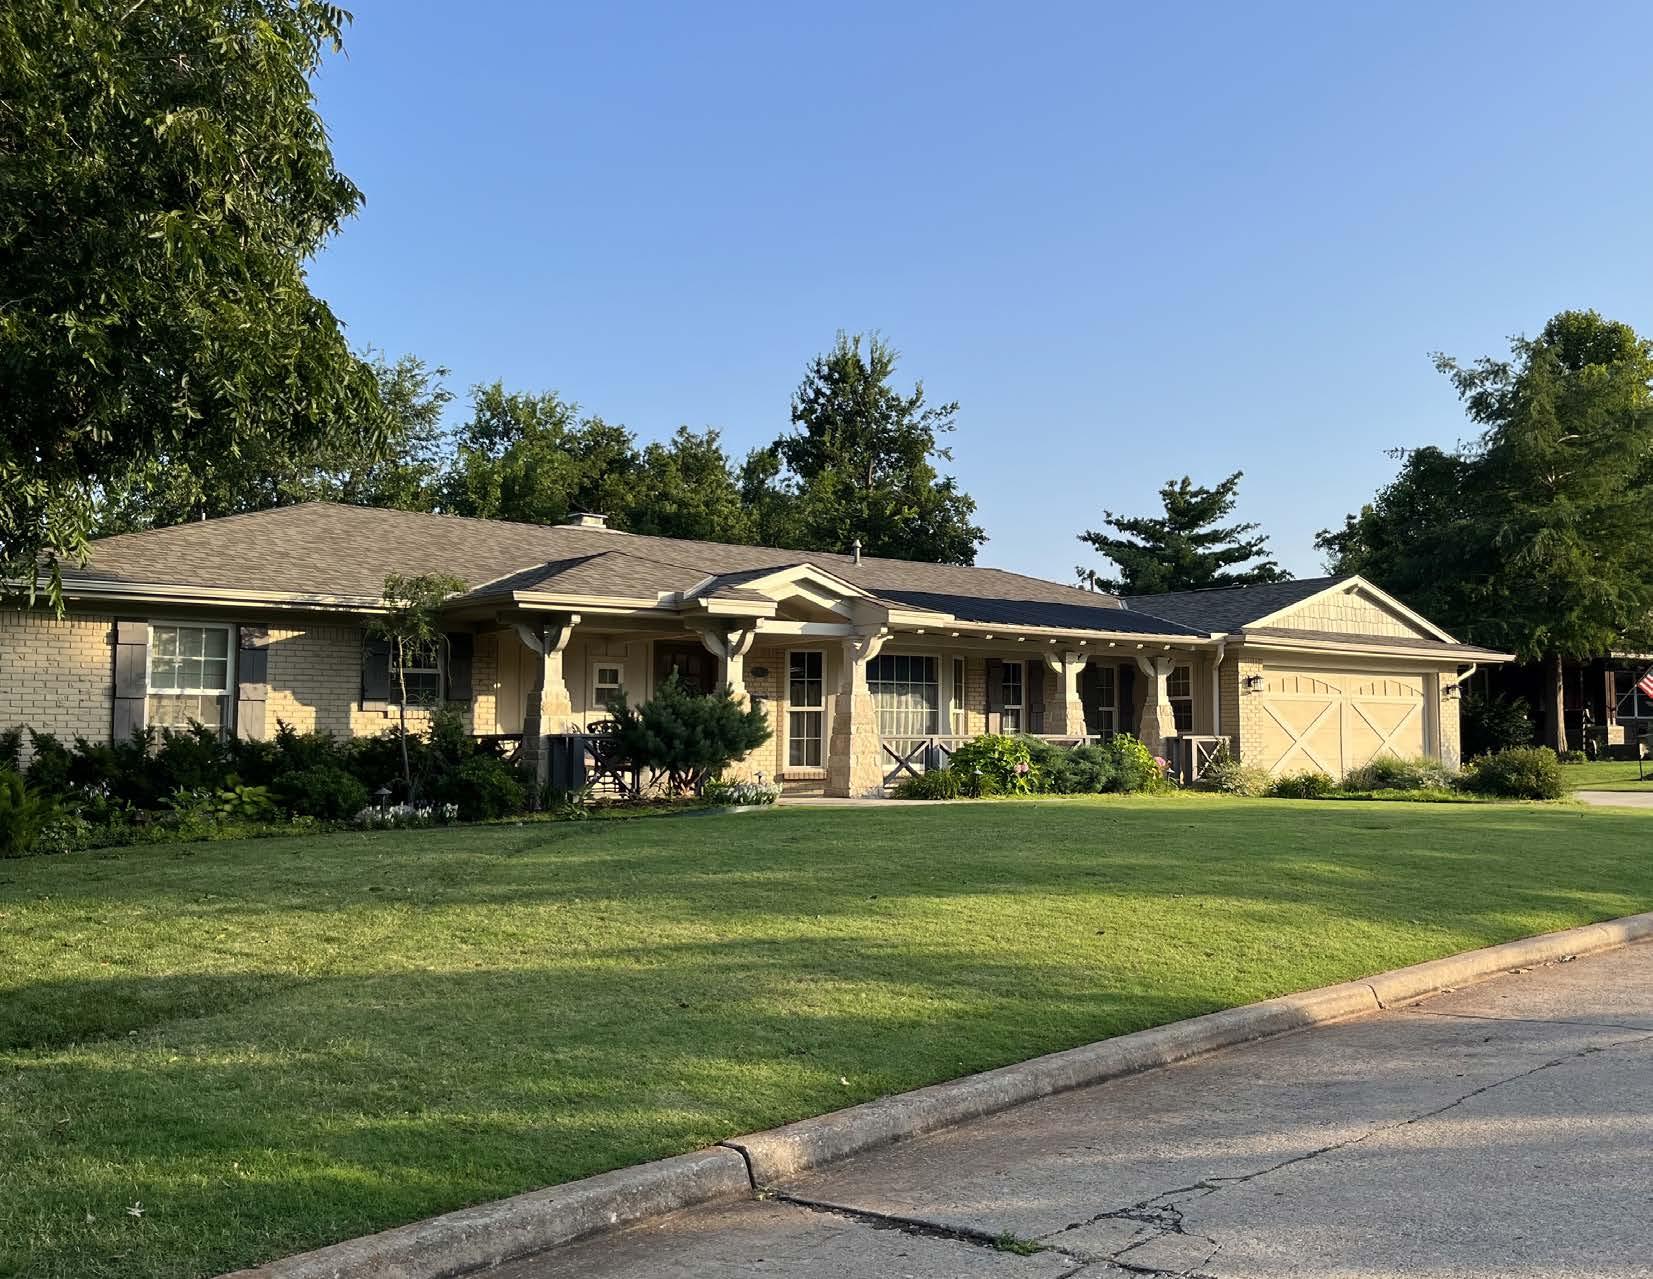

This housing strategy was created to provide the City with programs, policies, and best practices that can be implemented over the next several years to address the community’s key housing challenges.
A housing strategy is a framework for addressing a community’s housing challenges and opportunities. It includes a collection of recommendations—in the form of programs, policies, and best practices—designed to work together to meet current needs and ever-changing demands. A housing strategy frequently includes recommendations on:
• Prioritization: What should be implemented first?
• Leadership: Which entity is going to lead/own this program?
• Partnerships: Who needs to be involved for this to be successful?
Edmond’s housing strategy was developed based on the work summarized in prior chapters and discussions with the client team, Steering Committee, and community stakeholders. It includes tactics for housing production, preservation, and services designed to help households of all types find attainable, quality housing.
Demographic, economic, and market analysis; input from community stakeholders; housing
needs and housing preferences survey results; and input from the client team and Steering Committee were used to define six housing goals for the community, which are summarized on the following page. These housing goals define key focus areas for the community to address over the next several years. The policy, programs, and best practices contained within the strategy are designed to help the community meet those goals.

The housing recommendations for Edmond are organized into four strategies, which are summarized in this chapter. The goals addressed by each strategy category are also noted in the appendix.
No single strategy will address all of the housing challenges facing Edmond. To achieve its goals, the City and its partners will need to take a holistic approach that emphasizes collaboration, coordination, and partnership. This framework aims to make that possible by highlighting needed resources and investments.
These terms have specific meanings in this report:
• Goals: the ‘Why’. What are our north-star priorities for Edmond over the next 10 years?
• Strategies: the ‘What’. What do we need to do to make our defined goals a reality?
• Tactics: the ‘How’. How specifically will we implement our chosen strategies?
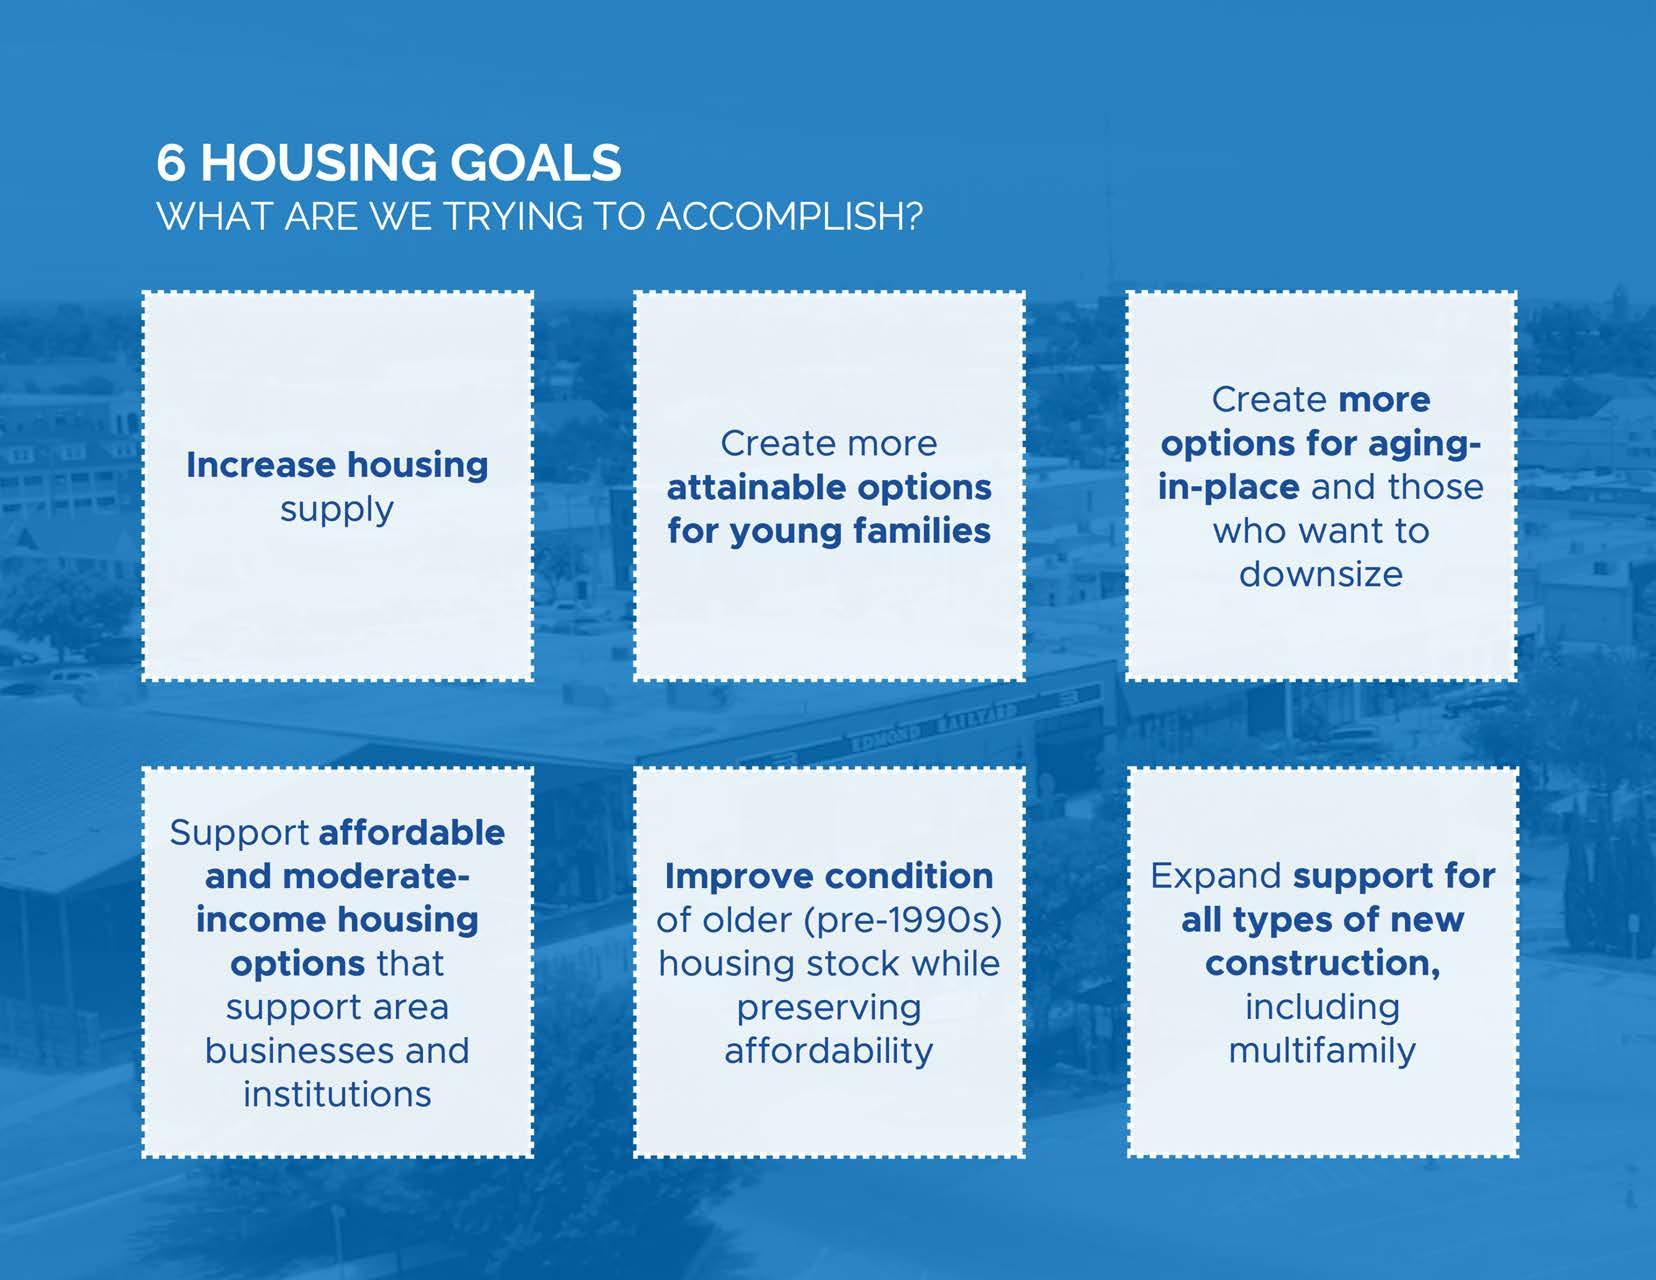
Reduce barriers to expanding production of all housing types, for-sale and for-rent
New housing development for owners and renters is vital for the health of Edmond’s future. It is needed to accommodate Edmond’s ongoing economic growth and changes in demographics as families, young professionals, and seniors seek to live in Edmond. The right housing and amenities should not only support existing residents, but also accommodate future residents and allow people who have previously lived in Edmond to move back.
Use funding tools, such as TIF or impact fees, to help pay for infrastructure improvements that support affordable and workforce housing development

Intent: Reduce the development cost of housing types that meet affordable and workforce housing goals.
Tax Increment Financing (TIF) districts can generate additional money to be reinvested back into a given area. When TIF districts are established, the property taxes generated by new developments within a project area is held at predevelopment levels for a period of time (up to 25 years). As the new development is constructed and matures, the new (incremental) tax revenue generated goes back into the area within the district boundaries to be spent on infrastructurerelated costs. Once the TIF period is up, the tax revenue generated by the development flows back to the taxing jurisdictions instead of the TIF area.
TIF dollars can also be used for housing-related purposes, including single-family rehabilitation, voluntary demolition of unsound properties, title assistance, homebuyer assistance, and development assistance for new housing on vacant land (the Peoria-Mohawk TIF District in Tulsa, Oklahoma is used for gap financing).
Communities can also ask developers who are asking to use a TIF to include set-asides of affordable/workforce housing units as a condition for receiving the TIF incentive. This is particularly beneficial in areas, like Edmond, where increasing land prices and values will make providing and maintaining affordable housing difficult in the future (National Housing Conference, 2023).
The first step in evaluating the viability of TIF in Edmond is to secure buy-in from all affected taxing jurisdictions before moving forward, especially because the City does not collect property taxes. This tool has the potential to reduce development costs and enhance affordability in Edmond.
Impact fees are one-time charges applied to new developments where the developer pays a sum of money to the City. This money is then used to help the City construct public facilities as growth occurs. The money can be used for water and sewer systems, schools, libraries, parks and recreational facilities, and other infrastructure that is necessary to serve residents (HUD). This can provide the City with dollars they can leverage to obtain more funding for projects that need additional support. The City can also use the money collected from the impact fees as an incentive to cover the costs for infrastructure improvements, possibly in exchange for affordable and workforce units, to ensure that a project comes to fruition.
A recent revenue study showed the revenue generated by Edmond households will no longer cover the City’s expenses for providing public services. Impact fees are one way to address this, although more diverse housing densities will also help with fiscal sustainability. A feasibility study considering the effects of impact fees on developers and the City is an important next step.
Leverage City-owned assets to support affordable, workforce, mixed-income, and mixeduse development
Intent: Use development agreements and other tools to support the creation of housing types that are not currently in Edmond on sites where the City has control.

City-owned properties create a unique opportunity that Edmond can use to attract new development. Edmond can define what it wants on a site and what incentives it is willing to bring to the table, then seek a developer-partner to deliver on those community goals. Because the property is Cityowned and Edmond has a strong market, Edmond can work to ensure new developments support adequate housing for various income levels.
The City-owned properties in downtown Edmond are one current example of this. When the new City Hall is complete, the unused parking lot/land could support a catalytic mixed-use and mixedincome development.
At its most basic, the City enters a partnership with a developer and contributes (for free, or at a reduced cost) the City-owned property as the City’s investment into a new development. This can help reduce the overall costs to the developer. In return, the developer provides various amenities and community benefits within the development, possibly including a certain number of affordable units. This is negotiated as part of the agreement to provide the land.
This is a useful strategy in communities where vacant and underutilized land and buildings are appropriate for residential use, but the market makes developing affordable and workforce housing more difficult2
As part of a larger economic and housing affordability strategy, the City of Tulsa created a TIF district nearby a newly built business park in North Tulsa to help leverage funds that will be used to bolster homeownership and neighborhood revitalization efforts in the area. In 2020, the City approved the TIF district around the PeoriaMohawk Business Park, which is projected to raise $35 million in funds over the next 25 to 35 years.
Most of these funds are planned to be used to transform the neighborhoods around the TIF district. The City plans to use funding to help implement the City’s Affordable Housing Strategy and contribute to economic mobility goals. The raised TIF funds will support single-family home rehabilitation, title assistance, voluntary demolition of problem properties, and infill development on vacant land. Additionally, funds will be used to help individuals and families access homeownership through home buyer assistance. The Peoria-Mohawk TIF District has the dual benefit of contributing to economic development and growth for the City, while also supporting its housing and neighborhood development goals1.
Tactic
Work with other City departments to reduce time required for the development review and approval process for housing that meets goals
Intent: Streamline the review and approval processes for housing specific projects.

Many developers reported during the assessment’s community engagement efforts that the review and approval process in Edmond can add significant time to a development process, which in turn can add costs to the developer in terms of holding costs, options on land, and paying interest before the development is generating revenue. These costs can be particularly acute for small-scale developers and non-profits developing affordable housing. Streamlining the review and approval process, for appropriate developments, can be one way the City can help reduce costs for developers of attainable housing.
This can be done in a variety of ways, some of which the City of Edmond has already been addressing following recommendations in the The Edmond Plan, released in 2018. Options that work well for many communities include updating submission requirements to remove outdated requirements, adopting technology such as electronic submission of materials,
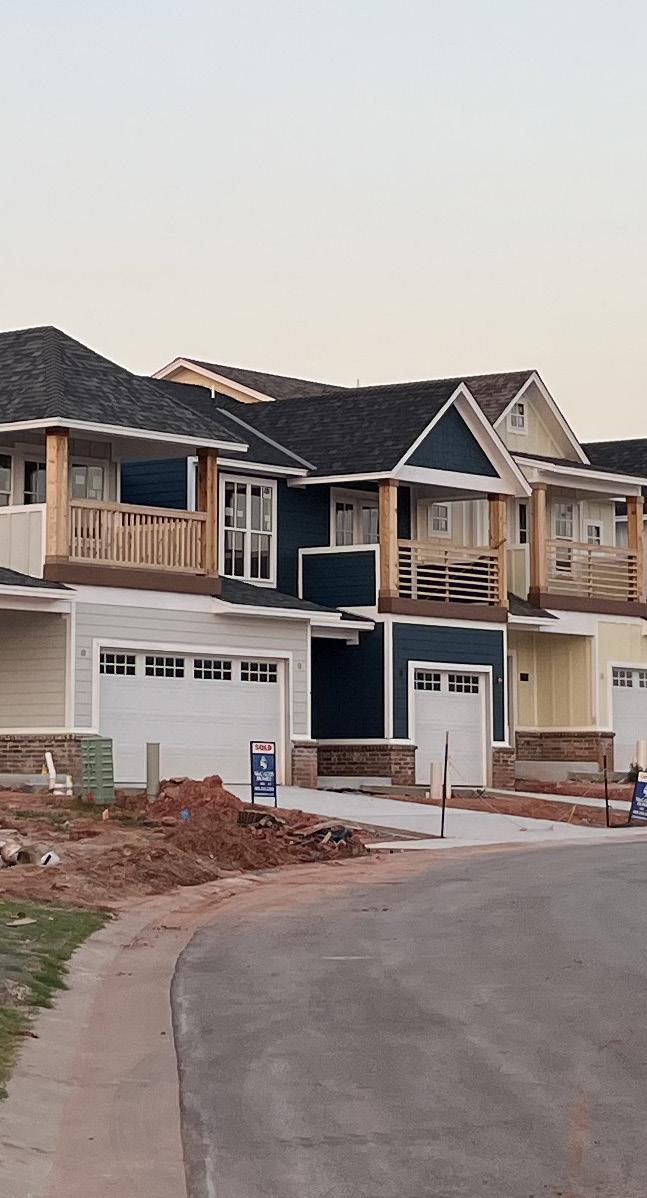
having interdepartmental coordination meetings, or even having a review tracking portal that provides developers with review deadlines and status updates. Sometimes, simplifying and accelerating the development review process may be appropriate for certain types of projects that the City has prioritized, such as affordable and workforce housing.
Some communities explore the creation of Technical Review Committees (TRC) that bring together members of various departments to review all proposed development plans—including subdivisions—when they are submitted. This approach can streamline the review process by replacing the need to send projects sequentially through each individual department. It can also improve issue identification and support creative problem solving during the review process, as everyone is in the room at the same time to talk through issues and solutions. This group may include someone from a City’s engineering, streets, wastewater, water, police, fire, building, parks, and planning departments, among others.
Update zoning code to allow more housing types-by-right, incorporate other incentives and inclusionary zoning/affordability set-asides, and include flexible design standards
Intent: To attract housing developers, make lower-cost housing types more easily developable, create programs to ensure dedicated affordable housing can be developed, and diversify housing options in Edmond.
Zoning codes are a foundational piece of the City’s development review process, and as such, are a critical piece of the housing development ‘toolbox.’ They are regulations that determine what can be developed, where, and how to develop it. They play an important role in the orderly development of communities, and they can also have unintended impacts on a community’s ability to meet its housing goals. It is important to review zoning regulations to ensure they are not a barrier to creating certain housing types that a city may want to support.
One such area that zoning codes often work counter to a community’s housing goals is in ‘missing middle’ housing—such as duplexes, quadplexes, townhomes, and small-scale apartments—which fall in the ‘middle’ of single-
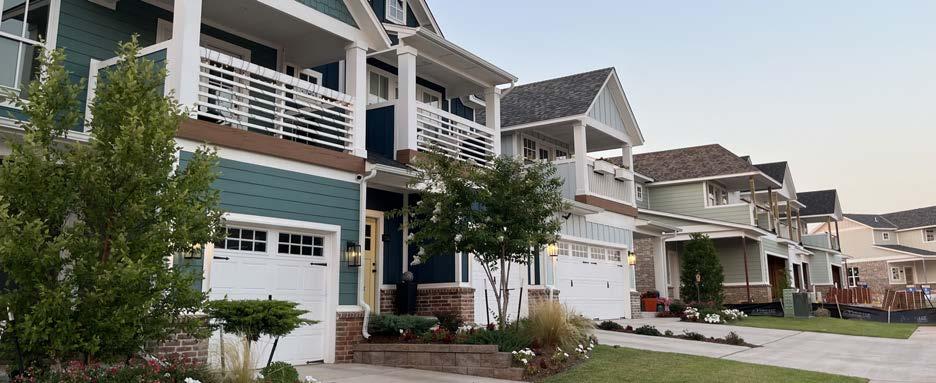
family homes and larger-scale apartments. Such home types have slightly greater density than single-family homes, but are not as dense as larger apartments, and often make sense as a transition between commercial and residential, or in mixed-used intersections. The problem is that many zoning codes only allow for one end of the housing spectrum or the other—either single family detached housing or larger multifamily developments. ‘Missing middle’ development types are not easily allowed in the codes, and therefore developers avoid building them.
As communities across the country continue to address growing housing challenges, many have begun updating their zoning code to allow for development of a greater variety and density of housing types. This includes changing dimensional standards, setbacks, densities, and types of development allowed within various zoning districts. Additional considerations include exploring density bonus programs, fee waivers, inclusionary zoning, new zoning classifications, and infill-specific development.
Density bonus programs: allow a developer to increase the maximum allowable units (among other intensity options, including floor area ratios, building heights, or developed square footage) for a development in exchange for providing community benefits, including a number of units at a specific price point3. Communities have used this to produce affordable housing in places with a strong real estate market, as the return on the additional units help offset the increased cost of providing more attainable units.
Fee waivers or reduced fees: with this tool, the City grants a developer a waiver that reduces the total cost of construction as a tradeoff for meeting certain criteria, including incorporating affordable housing units into a project. Fees that may be waived include permit, sewer, and water. While the fees may not be significant, they can add up and help reduce the costs at the margins, which can help close the development gap for smaller-scale and non-profit developers.
Inclusionary zoning: requires that a part of new housing development be made affordable to people with low to moderate incomes. Sometimes these can be combined with other incentives such as density bonuses or fee waivers, but some communities in highgrowth markets simply require the inclusion of affordable units outright, without incentives.
Intent: Help prospective and current residents entering the housing market in Edmond as homeowners.


A key theme that emerged through stakeholder conversations, focus groups, and the housing survey was that it has become increasingly difficult for some groups—including young people and first-time home buyers—to become homeowners in Edmond. Homeownership assistance programs can be helpful for first-time home buyers looking to enter the market. While there are national and state-wide programs that can be used to help with down payments and closing costs, the City can also work with financial institutions to create their own local programs.
These programs can be attractive to financial institutions as strategies to attract new mortgage customers and retain existing ones. City staff can advise on eligibility criteria and help determine what type of assistance could be offered. For instance, funds could cover a certain percentage of down payments or closing costs, or support free or low-cost consulting services that help home buyers create payment plans and manage money responsibly.
1.5 Example Programs
• Edmond Homebuyer Assistance Program
• Turning Point Ministries
1.5 Recommended Timing
Ongoing, as opportunities arise
The City offers the Edmond Homebuyer Assistance Program, which provided nearly $845,000 in down payment assistance and supported 159 first-time homebuyers over the past 10 years. This program, funded through CDBG, is limited to households earning at or below 80 percent of AMI. Expanding the program with different funds (City or partner contributions) with a higher income threshold would support more households looking to become homeowners in Edmond.
Work with partners to expand homeownership supports like down payment assistance/ loan programs, credit counseling, and homebuyer/homeowner training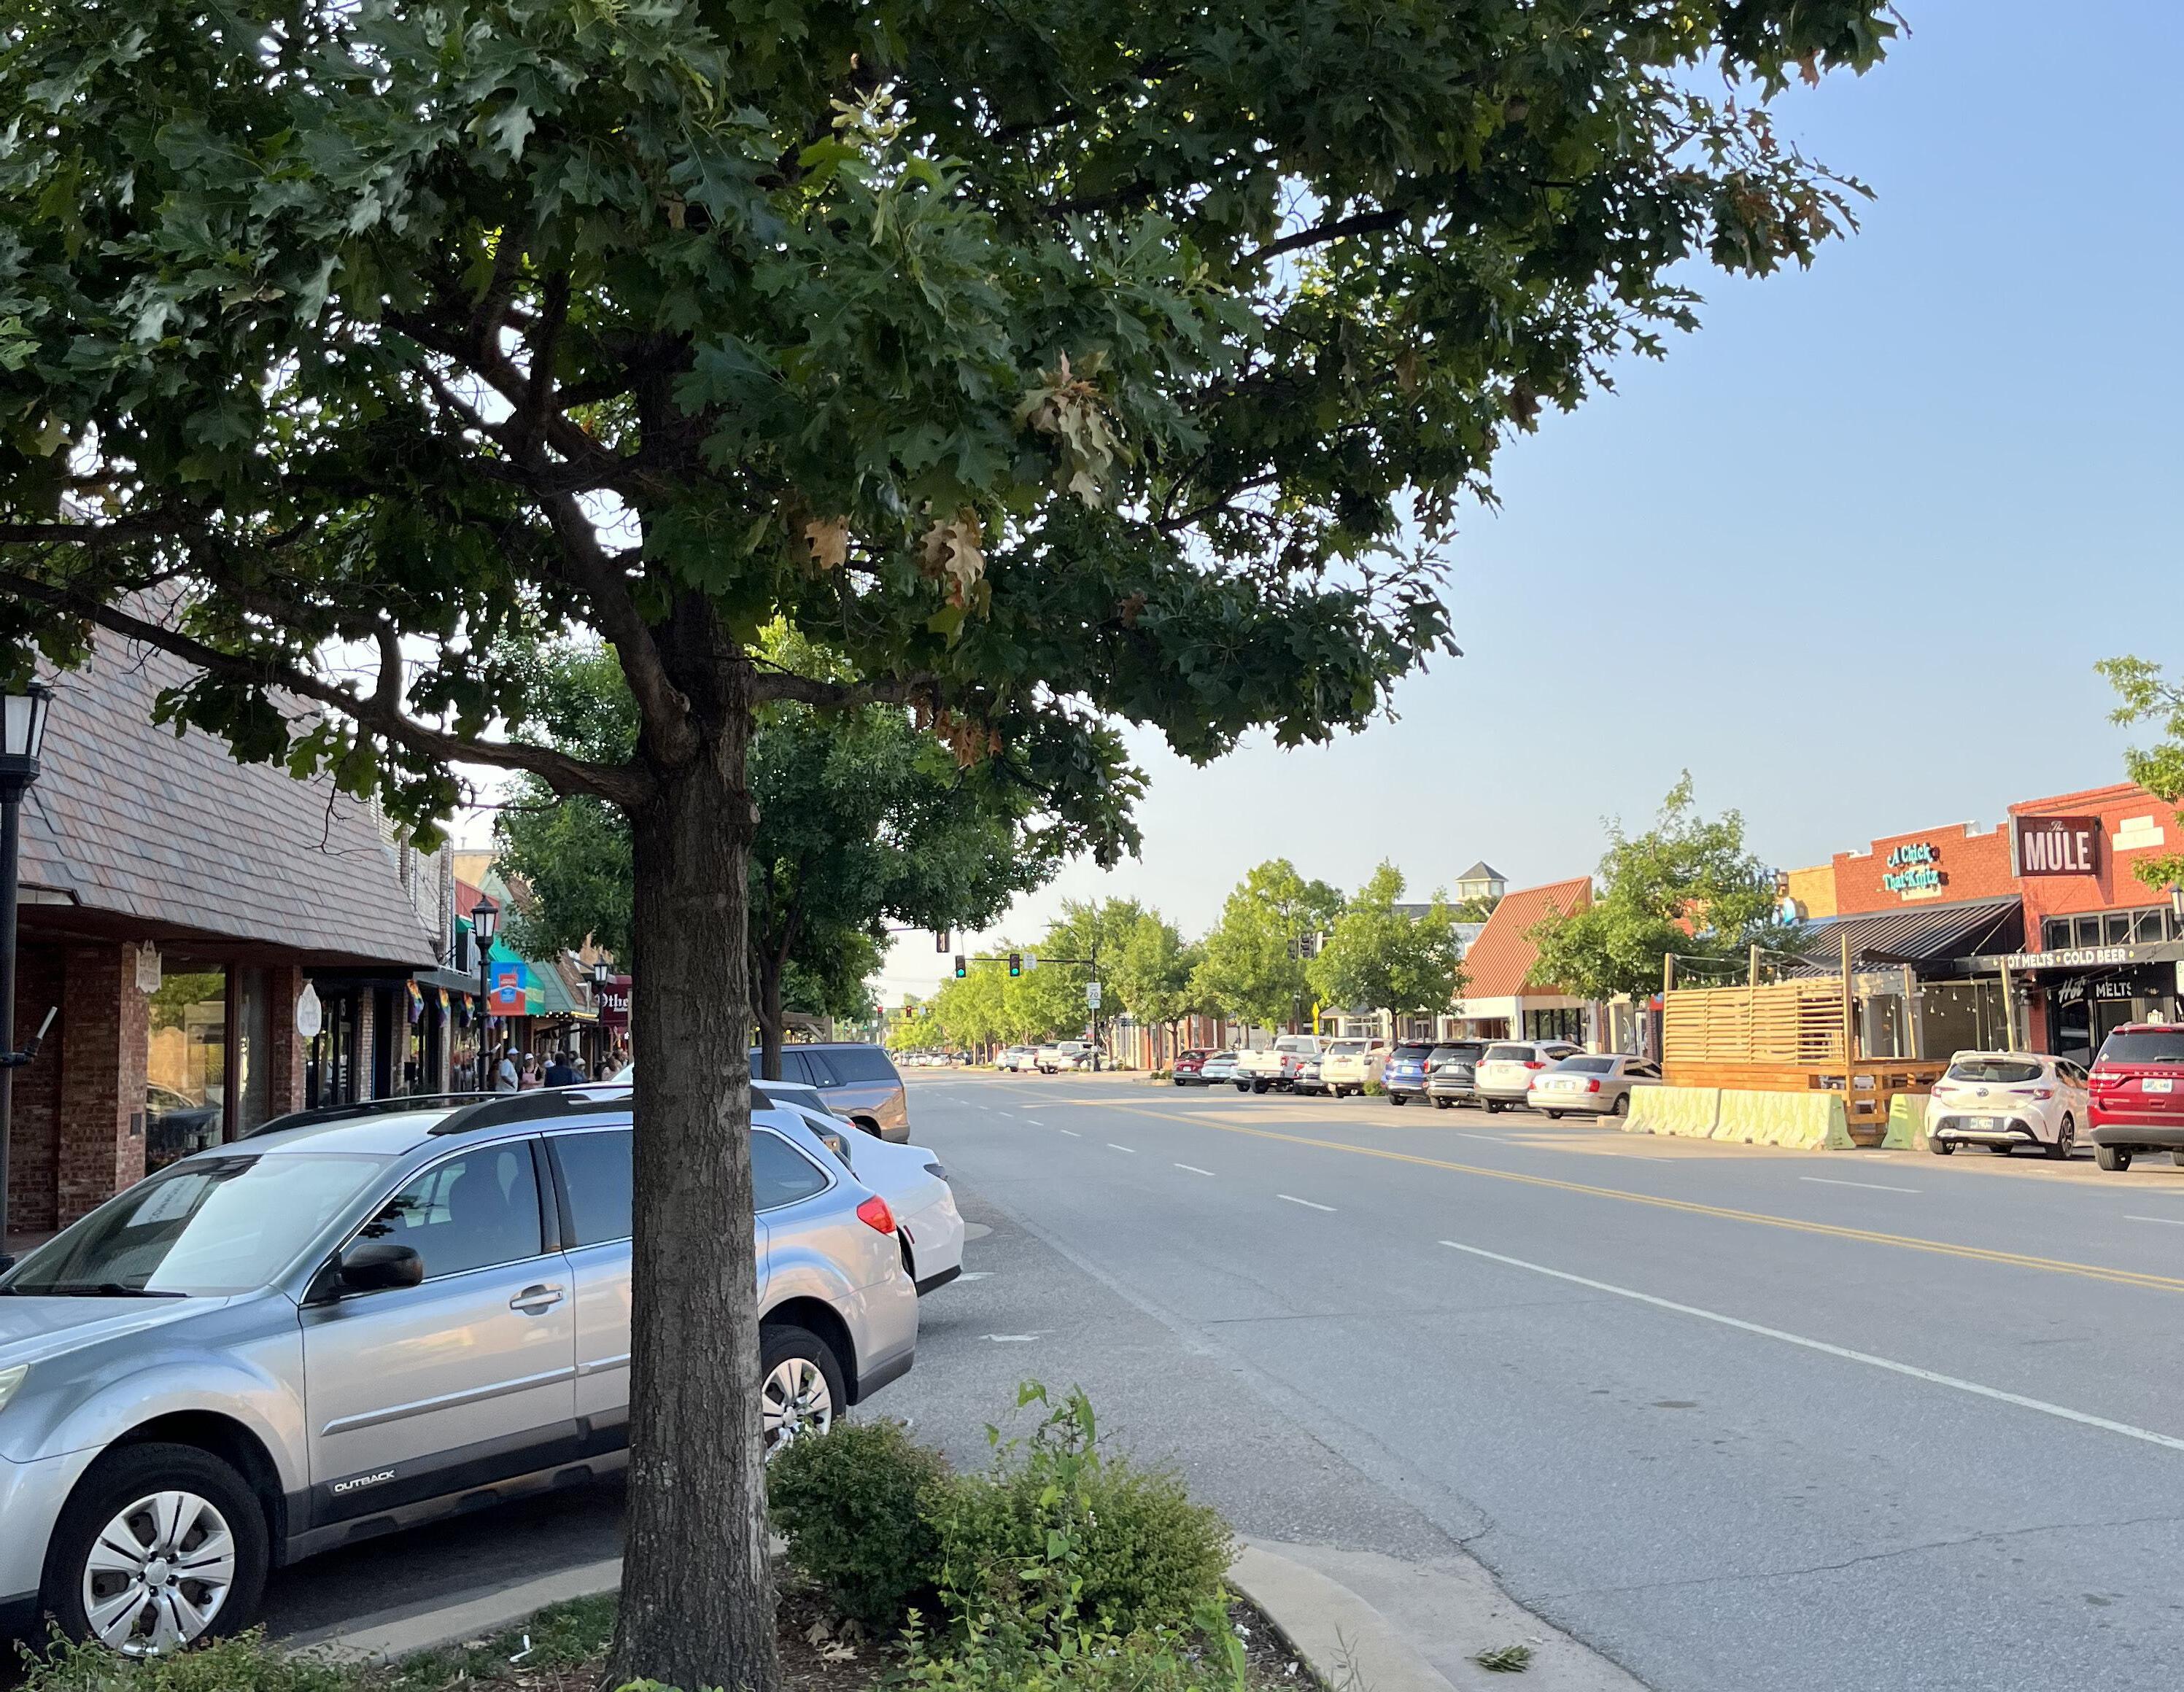

As housing prices and monthly rents continue to increase, it becomes more difficult for people to afford to live in Edmond. By diversifying the housing types available in the community, Edmond can ensure that it is welcoming to people in various stages in life, from young professionals to families to empty nesters. Diversifying housing options can also quell runaway housing competition and promote reduced housing costs.
Intent: Provide developers with a resource for types of housing developments and desired architectural standards that would be appropriate to build in Edmond.
As Edmond considers diversifying the types of housing it permits, it must be strategic about where and how such housing is developed. Zoning codes are one component, as discussed above, but it may not be enough to simply remove the barriers to different housing types. A more proactive approach may also help—something that provides more of a picture to developers about exactly what the City would like to see. This is especially true in markets like Edmond, where the local developers have not historically delivered a housing product other than the single-family subdivision.
“Look books” are one way some cities are telling developers exactly what they want to see in certain residential developments.
These pattern books go beyond the zoning code and provide developers with photos of neighborhood characteristics, concepts for lot layout, architectural designs, and diagrams of specific development features that address unique conditions and housing types in certain neighborhoods. They allow developers to explore product options and associated expectations the City has for specific neighborhoods. As developers consider their options, especially for building so-called ‘missing middle’ housing (see tactic 1.5 above), this resource would provide them with architectural design standards and other guidelines meant to help maintain neighborhood character.
• Pattern Book for Congress Heights, Anacostia and Saint Elizabeths (CHASE) communities
• City of Rochester Hills, MI Architectural Design Standards
Create a “look book” of housing typologies and share type-specific resourcesKeep track of housing trends based on type, demographic markets, renter vs. ownership patterns, foreclosures/vacancies, and available lots for development/redevelopment
Intent: Understand housing trends in Edmond using GIS mapping and other tools.
As a way of understanding what is happening across the community, the City should begin keeping track of housing data and associated demographic trends using GIS and other tools. This will help City officials, staff, and community members track the success of the housing strategy, and be aware of changing demographics and community needs. Some of the data can be tracked citywide, or in specific districts and
neighborhoods. Some information that could be tracked includes:
• A windshield survey of properties to identify development status and condition
• Renter and ownership occupancy could be tracked on a property basis, but additional information could be pulled from publicly available Census data.

• Keeping track of foreclosures and newly vacant properties can help facilitate redevelopment and resale opportunities.
• Housing stock age and assessed value can indicate where more investment in upkeep or public infrastructure is needed.
CASE STUDY TACTIC 2.2
Incentive Dashboard
CINCINNATI, OH
Cincy Insights is an interactive dashboard created to be a centrally located webpage that can be used to access and showcase city-level information and data easily. The webpage’s Neighborhood and Development dashboard showcases a breadth of useful information about economic incentives, residential and private tax abatements, TIF districts, permitting, and code enforcement in the region.
A user can review maps and data to learn about what incentives are available and how and where these incentives are being used in the city. In addition to the Neighborhood and Development dashboard, other dashboards offer information about health, public safety, public services, regional business, and more. The database provides a useful one-stop shop for learning, planning, and understanding the development trends and tools the City has to offer4.
2.2 Example Program
• Cincinnati, OH Cincy Insights program
2.2 Recommended Timing
Long-term, a database would help Edmond staff to be more proactive and plan for future redevelopment and housing improvements.
Work with architects and
to create pre-approved plans for new housing types
Intent: Diversify housing options in Edmond and allow development of specific structures outright within zoning districts to reduce overall time (and cost) spent on the project by developers.

Development is an expensive and time-consuming process; pre-approved plans can make it easier for all parties involved. By prescribing desired architectural features and materials, including variations of exterior layouts, this tool can reduce design and approval time for the developer or property owner and allow for faster construction. Pre-approved plans can also provide critical guidance and cost savings to mission-oriented housing providers with less development experience, such as nonprofits and community development corporations (CDCs).
Creating a set of pre-approved plans requires collaboration among multiple groups of professionals, including City staff, planners, developers, builders, and architects. Once created, pre-approved plans can and should evolve over time. The City should be open to feedback after
implementation and be ready to modify plans so that they better serve specific developers, builders, residents, and potential residents. Once these modifications are reviewed and approved, they may be added to the complete set of preapproved plans.

It is important to note that homes built using preapproved plans will still need to go through the foundation review and approval process with the City of Edmond’s Engineering Department.
• South Bend, IN Pre-Approved Building Plan Sets
• Eugene, OR Pre-Approved Accessory Dwelling Unit (ADU) Program
2.3 Recommended Timing
Approximately
builders/developersIntent: Attract developers who are willing to build and/or renovate housing in Edmond.

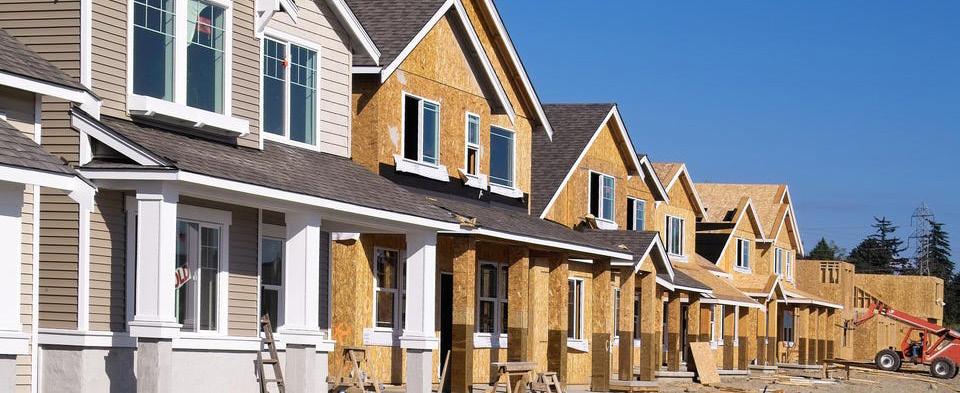
Edmond has competitive advantages: people want to move to the city, and businesses want to locate in Edmond and expand employment. These trends can provide housing developers with opportunities. It is important for the City to use the results of this study to show developers (and the community) a renewed commitment to a diversity of housing. Such commitment can be shown through marketing materials such as a “look book” (see tactic 2.1) and actions such as zoning code changes (see tactic 1.5). Such efforts could be highlighted in community outreach and promotional materials.
These efforts will work best when carried out in partnership with economic development groups and the Edmond Chamber of Commerce. These groups can support ongoing efforts to brand Edmond and market to both existing and future residents. As the city gains both residents and jobs, continued investment in resident and employee retention will be critical.
Market development opportunities to the local, regional, and national development community using results of this studyEvaluate and revise building codes related to certain requirements, such as fire sprinklers, while maintaining the safety of the units
Intent: Reduce barriers for missing middle typologies (townhome, duplex, triplex, quadplex, small multifamily) and reduce overall development costs.
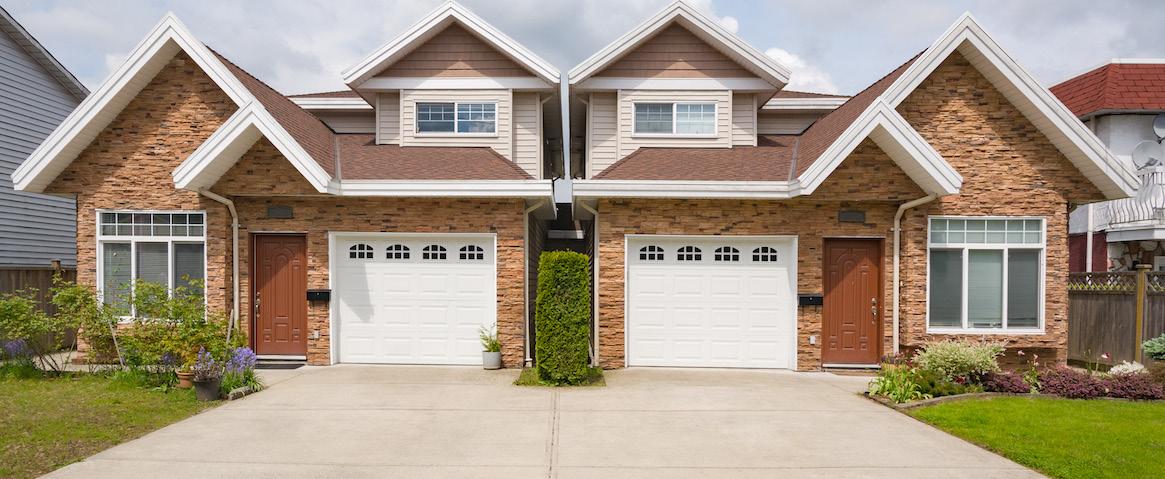
As outlined in tactic 1.5, zoning codes can create barriers to developing more diverse housing options that may be compatible with traditional neighborhoods. Building codes can do the same when they trigger additional guidelines that increase development costs.
Smaller multi-unit developments that may be appropriate for some Edmond neighborhoods— such as duplexes, triplexes, quadplexes, townhomes, and small multifamily buildings— often require additional safety standards, some of which may be more appropriate for specific housing types than others. By exploring costsaving measures for some of the development features that building codes require, Edmond could help lower development costs and possibly encourage more proposals for missing middle housing types. Some possible solutions include:
• Offering clearer information to developers on minimum system requirements
• Coordinating with the City of Edmond’s Water and Public Works Departments to secure discounted rates on water and sewer capacity fees for developers that install sprinkler systems off of a domestic line

• Exploring stricter energy codes to reduce utility bills for homeowners and renters
As part of this effort, the City should consult with building, engineer, and fire safety experts to make sure any changes to the building code do not create safety hazards for various build types.
Tactic
Expand Edmond’s ability to secure additional federal resources and participate in the real estate market
Intent: To give the City the flexibility to initiate or expand policies and programs that support housing goals, leverage its role in the real estate market, enable it to pursue additional federal housing resources add additional, and to give Edmond local control over HUD housing programs.
There are several ways the City can do this.
1. Match Edmond’s CDBG allocation to reach the HUD-defined threshold of $750,000 for the City to be eligible to apply for HOME funds (The City’s CDBG allocation was $544,917 in 2023, so the City’s match would need to be $205,038.)
• The City would have to apply to HUD to become a Participating Jurisdiction (PJ), expand its Consolidated Plan and Annual Action Plan to include what it would use the HOME funds for, and maintain the Citizen Participation Committee.
• HOME is often paired with CDBG to maximize the number of affordable homes produced
and/or units renovated or preserved.
• HOME funds can be used for homeowner rehabs, homebuyer supports such as down payment assistance, rental development, and tenant-based rental subsidies for households earning at or below 80 percent of AMI.
• The City would need to have assigned staff with capacity and expertise to track costs, monitor projects, and report to HUD.
• Up to ten percent of a city’s allocation can be used for administration (i.e., pay for staff).
• A Community Housing Development Organization (CHDO) partner would be needed to maximize the use of HOME funds (15 percent of allocation must go to CHDO).
• Exploring stricter energy codes to reduce utility bills for homeowners and renters
2. Create an Edmond Housing Authority.
• The City of Edmond does not currently manage any Housing Assistance Payment (HAP) contracts with property owners or Housing Choice Vouchers (HCVs) that are utilized in the City.
• Creating a Public Housing Agency (PHA) as part of the City of Edmond would enable the City to better manage the use of these programs, while also enabling the City to pursue other federal and state housing resources more easily. These programs are currently administered by Oklahoma Housing Finance Agency (OHFA).
• Similar to applying to receive HOME funds, the City would need to amend its Consolidated Plan and Annual Action Plan to outline what
functions the PHA would carry out. The Citizen Participation Committee would oversee this.
• The PHA could be a City department, a nonprofit affiliate organization, or a consortium with adjacent or nearby communities. Each option has its benefits and challenges. Further research and discussion would be needed to select the best approach.
• Keeping the PHA as a City department or affiliate would allow the City to maximally leverage CDBG and HOME funds along with HCVs.
3. Expand the City’s ability to acquire or receive property (land and/or existing homes or buildings) for affordable and workforceattainable housing. This would enable the City to participate as a partner in the real estate market while leveraging its position to require affordable or workforce-attainable housing.
Ideally, these programs would be housed within a single City department so that programs can be aligned and leveraged, and staff can be shared among the programs to maximize efficiency. This series of tactics aligns with the Edmond Plan (2018), which recommended the creation of a real property or real estate division (AR462) to “modernize the City’s approach to and role in the development process.” These efforts would fit within such a division and support broader real estate initiatives.
Short- to mid-term; begin evaluating viability in 9 to 12 months; implementation process likely to take 12 to 18 months afterward
As housing ages, it requires continued maintenance to remain safe and habitable. Newly constructed homes in Edmond are out of budget for many Edmond residents, but older housing, while more affordable, often carries hidden costs for deferred maintenance or damage repair. By investing in upkeep of older housing stock, Edmond can ensure a diverse set of housing products at various price points remain available to residents, even as neighborhoods change.
Expand Edmond Builds to include exploration of protections for existing residents in neighborhoods targeted for revitalization
Intent: Implement a long-term and holistic commitment to neighborhood revitalization that aligns all of the tools at the City’s disposal.
Revitalization and reinvestment efforts can bring exciting and long-awaited changes to neighborhoods. They can also leave existing residents vulnerable to displacement. Edmond can explore a variety of tools to prevent this:
• “Right to Return” ordinances in revitalizing neighborhoods prioritize affordable housing access for long-term residents.
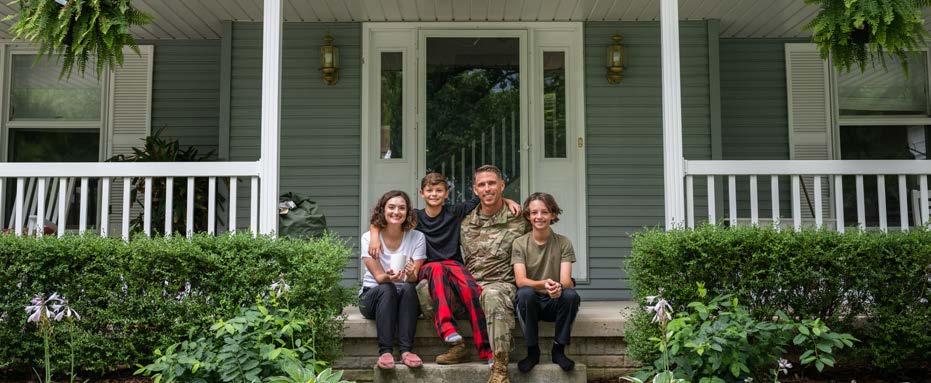
• Property tax freezes cap the amount of property tax that homeowners pay based on a share of their income.
• Real estate tax assistance programs can help prevent tax foreclosures due to unpaid real estate taxes. These programs are especially appropriate for areas where investment is leading to rising property taxes.
• Tenant protection policies help protect tenants from rejection based solely on characteristics like credit history, screening score, or prior eviction.
• Right-of-First-Refusal policies give tenants of a building the opportunity to purchase it first before it goes to market.
Edmond Builds provides a natural umbrella for an expanded neighborhood revitalization effort: its goals already encompass city equity, capacity building, resident success, and vibrant neighborhoods, and it is focused on exploring opportunities to bring residents and the City together.
• OKC Strong Neighborhoods Initiative
• Topeka SORT (Stages of Resource Targeting)/ Dreams Neighborhood Improvement Initiatives Program (NIIP)
12 to 18 months for property tax support potentially as part of housing fund; ongoing as program evolves
Continue to support homeowner renovations and weatherization through Edmond’s Owner-Occupied Housing Rehabilitation (OOHR) program
Adopt a more proactive approach to code enforcement of problem properties
Intent: Support homeowners, particularly low to moderate-income individuals and families, with rehabilitation and renovation programs focused on structural safety, sanitary conditions, and energy efficiency.
Weatherization programs can help low-income families reduce their energy costs by making their homes more energy efficient. Expanding the City’s existing weatherization efforts will help improve overall health for residents. The City could move a portion of its HUD entitlement funds to sustain funding dedicated to home weatherization programs. This program could be expanded in the future to include rental properties owned by responsible landlords who meet certain performance criteria, leading to decreased utility bills and rental prices for renters.
Intent: Improve condition of older properties that may have health and safety issues; provide improved conditions for renters, particularly lower-income; encourage reinvestment in existing stock.
Code enforcement is essential for preventing property vacancy, protecting property values, and improving neighborhood stability. Housing that is maintained well is likely to remain occupied and hold its value, while properties that fall into disrepair are unlikely to stay occupied and can attract nuisances.
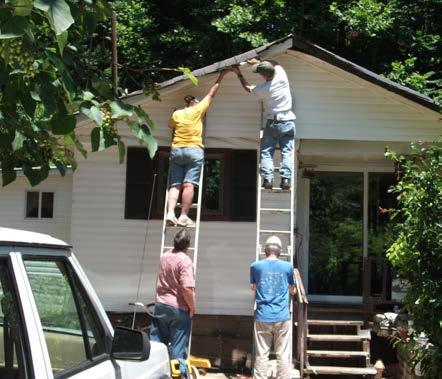
Adopting a more proactive code enforcement approach will likely require hiring more City staff. This larger team can continue to strengthen code enforcement practices that resolve code compliance issues before they become major problems. By providing additional support and funding for code enforcement, Edmond can improve property maintenance standards and improve housing stock quality for buyers.
In any year, an estimated 50 or more owneroccupied homes in St. Louis are lost due to tax foreclosure. Led by a local community development corporation, this fund is a crosssector partnership leveraging City investment and philanthropic funds to provide property tax assistance to families who are facing foreclosure. The fund not only prevents foreclosure on owner-occupied homes but also contributes to preventing vacancy and neighborhood instability. Additionally, it prevents lost revenue for the City. In 2022, the fund saved 68 homes from foreclosure and served 132 residents in the city5
• Edmond Owner-Occupied Housing Rehabilitation (OOHR) program
• City of St. Louis Healthy Home Repair program
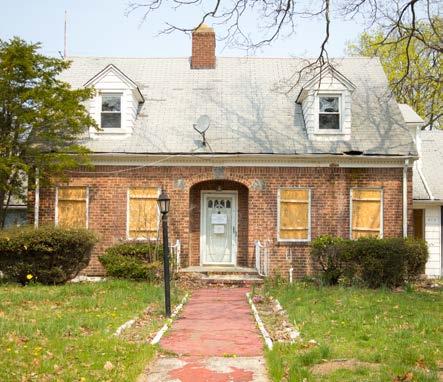
3.2 Recommended Timing
Ongoing
• Tulsa, OK Rental Inspection Program (Councilapproved, starting July 1, 2023)
• Lawrence, KS Rental Licensing
3.3 Recommended Timing
Approximately 2 to 3 years
Intent: Ensure older rental properties are safe and habitable for low- and moderateincome renters without defaulting to expensive renovations that may displace them.

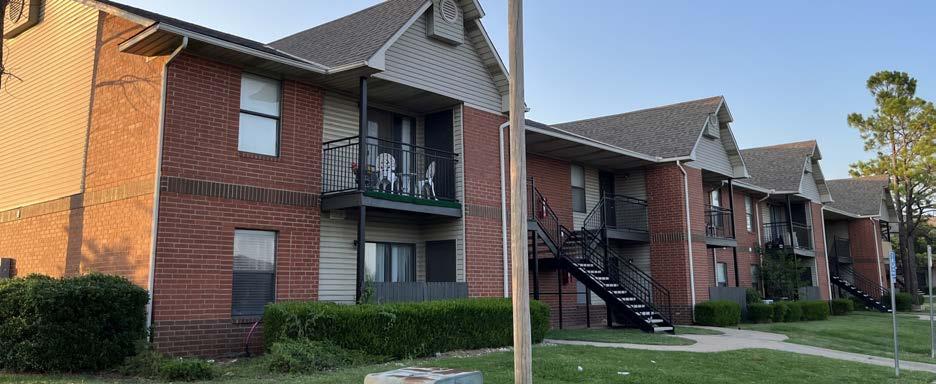
Some of the best affordable properties can come from older housing that already exists in Edmond, so-called naturally occurring affordable housing (NOAH). Often, such housing is Class B and Class C multifamily properties, meaning they are older buildings that may have deferred maintenance or need renovations. NOAH can also be single-family housing that has been held by the same owner for a long period of time, and may not have an active mortgage. These factors often result in ‘naturally’ lower rents, but lower rents in turn mean less cash flow to invest in repair and maintenance needs, which makes NOAH properties vulnerable
to redevelopment. While property updates are important for ensuring housing remains safe and habitable, significant upgrades that command higher rents are more likely to displace existing residents. Since many NOAH properties are owned by small local landlords, they serve as an important source of wealth for low-income communities.
Targeted programs that support NOAH can stabilize these properties and protect them from major redevelopment. Examples include energyefficiency programs, low-interest loans, grants for maintenance and functional upgrades, property management resources, tax abatements through nonprofit partnerships, and access to refinancing resources6.
Work with partners and other governmental staff to explore creating a tax abatement program
Intent: Help reduce or eliminate the amount of property tax owners pay on new construction, rehabilitation, and/or renovations (major improvements).
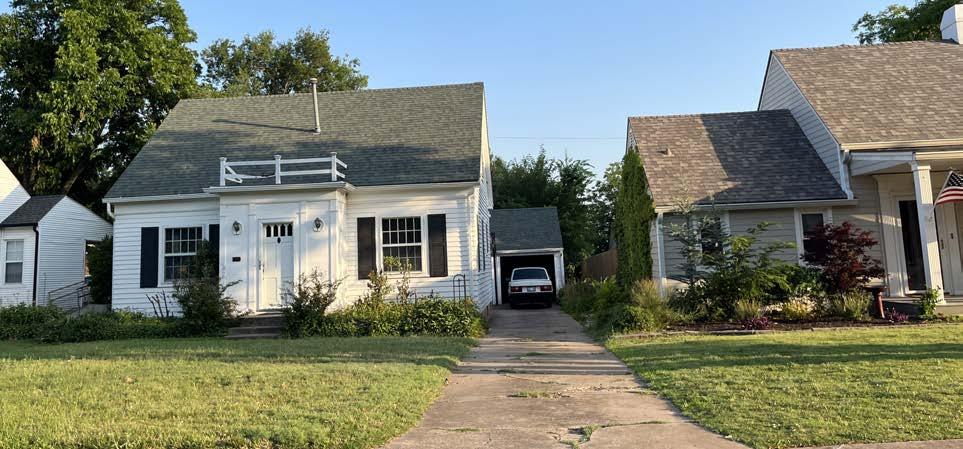
Tax abatement programs, like TIF, freeze property taxes for a period of time (typically 10 years) for a specific property. Working in partnership with the County, the City can determine eligibility criteria—which typically considers age of structure, property location, and property type—and evaluate and grant tax abatement opportunities on a case-by-case basis. As with TIF, tax abatement can be offered as an incentive in exchange for desired development, including dedicated affordable units in new construction projects and improvements that will raise a property’s appraisal value by a certain percentage once the abatement period is up.
Tax abatement can help stabilize neighborhoods and attract additional development, but it has drawbacks, including lowered revenue for the City and publicly funded partners—such as the Edmond Public School District—during abatement periods. For this reason, the City will need to involve partners funded by property taxes in discussions about the feasibility of creating a tax abatement program. If such a program is implemented, careful consideration of benefits and costs will be important when evaluating whether to grant projects tax abatement status.
Minneapolis’s NOAH Impact Fund is a publicprivate partnership aiming to preserve the affordability and quality of naturally occurring affordable housing throughout the city. Led by the Greater Minnesota Housing Fund, this social impact fund targets NOAH properties in highopportunity areas and most at-risk for being converted into market-rate housing. Housing that is preserved through the fund maintains a fifteenyear affordability period. Altogether, the NOAH Impact Fund helps to ensure that NOAH properties remain accessible for low- and moderate-income families without subsidies, prevents displacement, and helps to maintain the affordable housing stock in the metropolitan area.
The fund is supported by impact investors, which includes a mix of banks, government, and nonprofit and foundation support. It incentivizes private developers to invest in target NOAH properties by providing 90 percent of equity for the acquisition of a property, with the owneroperator co-investing 10 percent of the equity. The remainder of acquisition financing is obtained from traditional lending7
Edmond is a desirable community for residents, families, and employers. Jobs move where people move, and employers attract people to a community. Jobs are also one of the biggest factors in a person’s decision to move. Transportation-related expenses impact monthly expenditures for a household, and commuting takes up time in a person’s day. If housing costs make living close to work difficult or impossible for a significant portion of the workforce, businesses may lose out on talent and consider not locating in Edmond over the long term.
Map/update employment concentrations and housing options within a 15-minute drive to show mismatch between what’s available and what the growing workforce needs
Intent: Illustrate the housing location challenge facing workers for Edmond’s employers.

Similar to tactic 2.2, this effort will help City officials, staff, and the community understand the need for housing, from the perspective of Edmond’s employers. It will help track the changing demographics of Edmond’s workforce, and help provide a reference for where housing needs to be built to more adequately serve workers and employers.
The City can use this analysis to better understand and support local housing development needs, as well as the development of commercial and place making amenities that support housing, such as grocery stores, restaurants, and parks.
Information tracked should include:
• Total housing units
• Housing types, availability, and for-sale and rental prices
• Resident tenure
• Average salaries for professions with local employers
• Median resident income
This analysis should also consider the type of transportation options available to employers and employees commuting longer distances.
Identify key development sites within employment shed(s) for workforce attainable housing
Intent: Market and guide developers toward specific sites where workers in Edmond could live in workforce-attainable housing.
Given Edmond’s desirability, the City has an opportunity to work with local employers and partners to identify key areas that could be used for workforce housing development. This should include consideration of vacant or underutilized space. Workforce housing can range in size and housing type and include a mix of single-family; duplexes, triplexes, and quadplexes; small-scale multifamily; and more.
In addition to distance from major employers (or Downtown), the City and its partners should consider these factors when selecting ideal locations for workforce housing:

• School locations
• Park locations
• Access to grocery stores
• Access to public transit
• Trails and bike lanes
Once potential sites are identified, Edmond can provide this information as a resource to developers to help make it easier for them to build workforce housing in Edmond.
The Land Access for Neighborhood Development (LAND) platform was created to support policymakers, planners, and community groups in strategically identifying potential opportunities for affordable and workforce housing units in transit corridors8. The mapping platform achieves this by visually identifying vacant and underused land that is owned by the government, anchor institutions, or a faith-based organization. As a result, developers are able to use the map to see where opportunities lie, how parcels can be assembled, and learn to gather information about the land, such as who owns it.
Miami’s LAND project is an academic and government partnership designed in collaboration with key stakeholders. The process involved gathering previously dispersed data in a central mapping platform that is now easily accessible and user-friendly. The LAND platform is a method that can be replicated and adapted to other communities based on their own affordable and workforce housing goals and needs8 9 .
Support the creation and funding of a workforce housing program to facilitate development of moderately-priced for-sale and rental housing
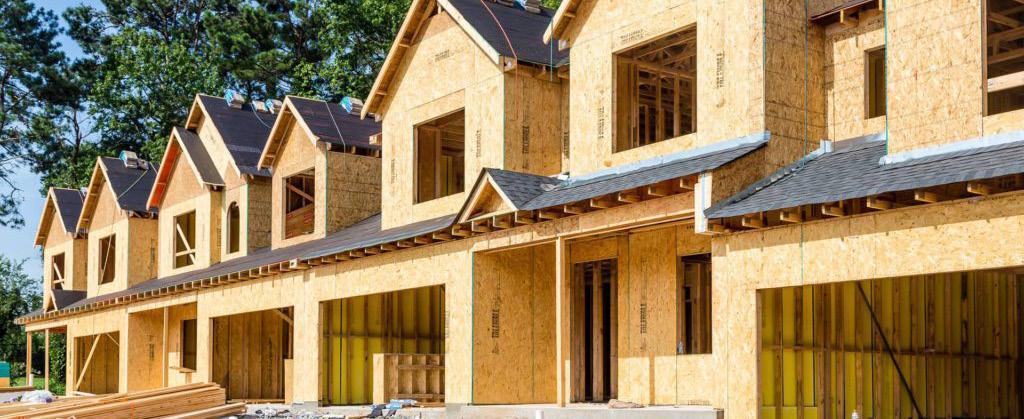
Intent: Encourage more development of housing that is accessible to groups currently struggling to find and afford housing in Edmond’s market today.

Workforce housing typically supports households earning between 80 and 120 percent of a community’s Area Median Income (AMI). These households are not eligible to live in Low Income Housing Tax Credit (LIHTC) housing. For the Edmond area, this includes averagesize households earning between $55,000 and $86,000 per year. These households can generally afford housing priced within these ranges:
• For-sale: $140,000 to $263,000
• Rental: $1,400 to $2,190 per month
The market will not typically sustain the development of workforce housing without some type of support from the public sector. To help encourage more workforce housing development, the City can explore creating a local fund and using existing statewide and federal programs that support housing developments with a set number
of units dedicated to affordable or workforce housing. Existing programs, especially from HUD, have established project criteria and required time frames during which funded units must remain affordable. This funding can in turn be layered with funding from Community Development Block Grants (CDBG), the HOME Investment Partnerships Program (HOME), philanthropic and corporate donations, and impact fees collected from local developers.
Intent: Encourage the development of affordable and workforce housing by providing funds to developers to offset their costs.

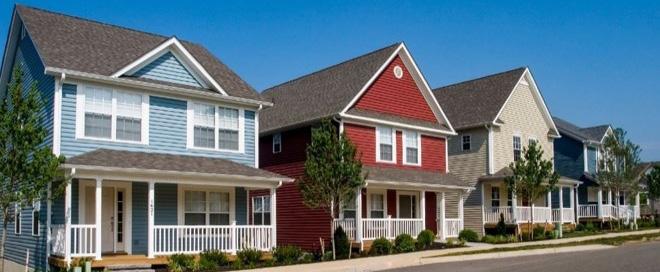
As previously discussed, housing that is affordable to households earning less than 100% of the Area Median Income almost always requires some type of subsidy to be feasible. State and federal affordable and workforce housing programs can help incentivize developers to build housing stock that they otherwise would opt out of building. These programs are often at risk of funding cuts, especially as the political landscape shifts. Funding sources to watch and support, especially when threatened, include CDBG, HOME, LIHTC (national and state), and Oklahoma’s Rural and Affordable Housing Linked Deposit Program (described below).
Oklahoma’s Rural and Affordable Housing Linked Deposit Program is issued by the state treasurer and Oklahoma Housing Finance Agency and provides low-interest loans of up to $2 million to housing developers to construct affordable housing in rural and select urban areas. Housing must be affordable to households earning up to 110% AMI.
for state and federal workforce housing programs1 Tulsa City Council Approves $42.6 Million TIF District Near New Peoria-Mohawk Business Park; Housing Projects the Main Focus. (2020, November 18). Www.cityoftulsa.org; City of Tulsa . https://www.cityoftulsa.org/press-room/tulsacity-council-approves-426-million-tif-districtnear-new-peoria-mohawk-business-park-housingprojects-the-main-focus/
2 Use of publicly owned property for affordable housing. (n. d.). Local Housing Solutions; Abt Associates & NYU Furman Cente . https:// localhousingsolutions.org/housing-policy-library/ use-of-publicly-owned-property-for-affordablehousing/
3 Density bonuses. (n. d.). Local Housing Solutions; Abt Associates & NYU Furman Center. https://localhousingsolutions.org/housingpolicy-library/density-bonuses/
4 CincyInsights. (n. d.). CincyInsights; City of Cincinnati Office of Performance & Data Analytics. Retrieved May 2023, from https://insights. cincinnati-oh.gov/stories/s/CincyInsights/s59xyqy3/
5 Welcome to RETAF. (n. d.). Real Estate Tax Assistance Fund; Park Central Development. Retrieved May 2023, from https://retaf.org/
6 Kling, S., Peloquin, S., Riesenberg, C., & Woetzel, J. (2021, February 23). Preserving the largest and most at-risk supply of affordable housing. Www. mckinsey.com; McKinsey & Company. https:// www.mckinsey.com/industries/public-sector/ourinsights/preserving-the-largest-and-most-at-risk-
supply-of-affordable-housing
7 NOAH Impact Fund. (n. d.). NOAH Impact Fund; Greater Minnesota Housing Fund. https:// noahimpactfund.com/
8 Land Access for Neighborhood Development. (n. d.). Affordablehousing.miami.edu; University of Miami Housing Solutions Lab. Retrieved May 2023, from https://affordablehousing.miami.edu/ land/land.html
9 Kinkade, L. (2019, November 14). Mapping Tool IDs Potential Land for Affordable Housing. GovTech; Government Technology . https://www. govtech.com/civic/mapping-tool-ids-potentialland-for-affordable-housing.html
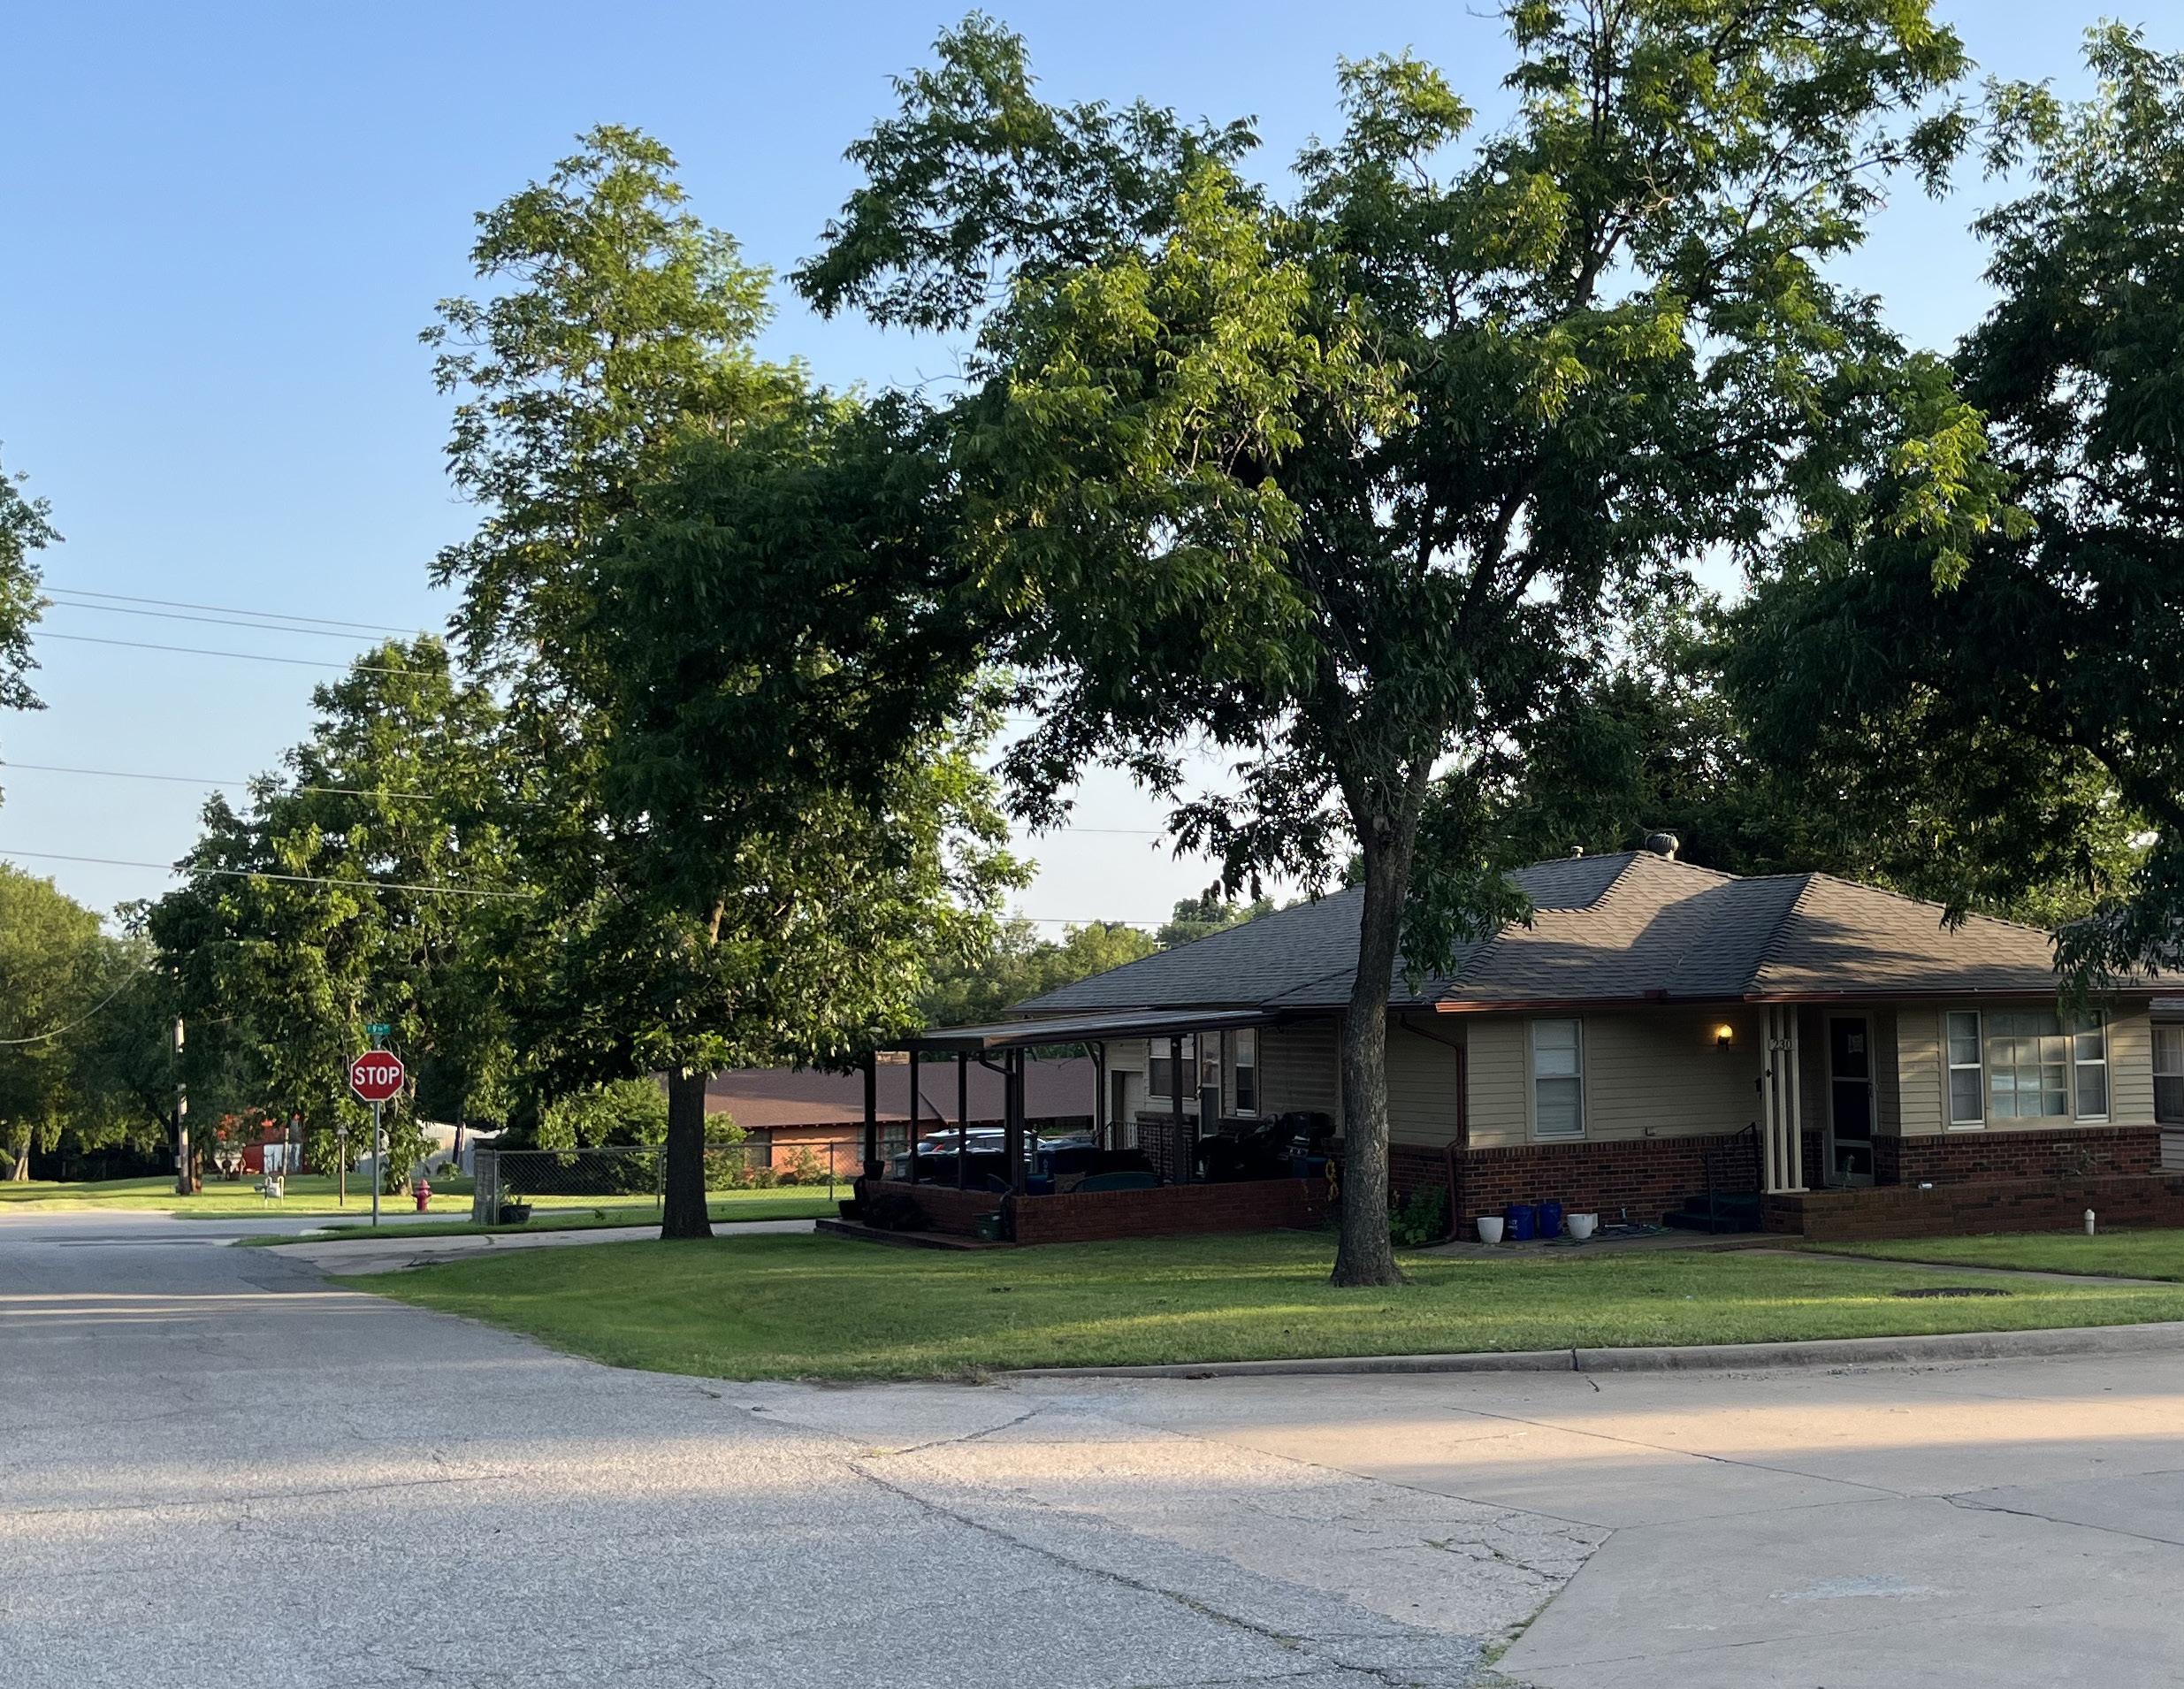
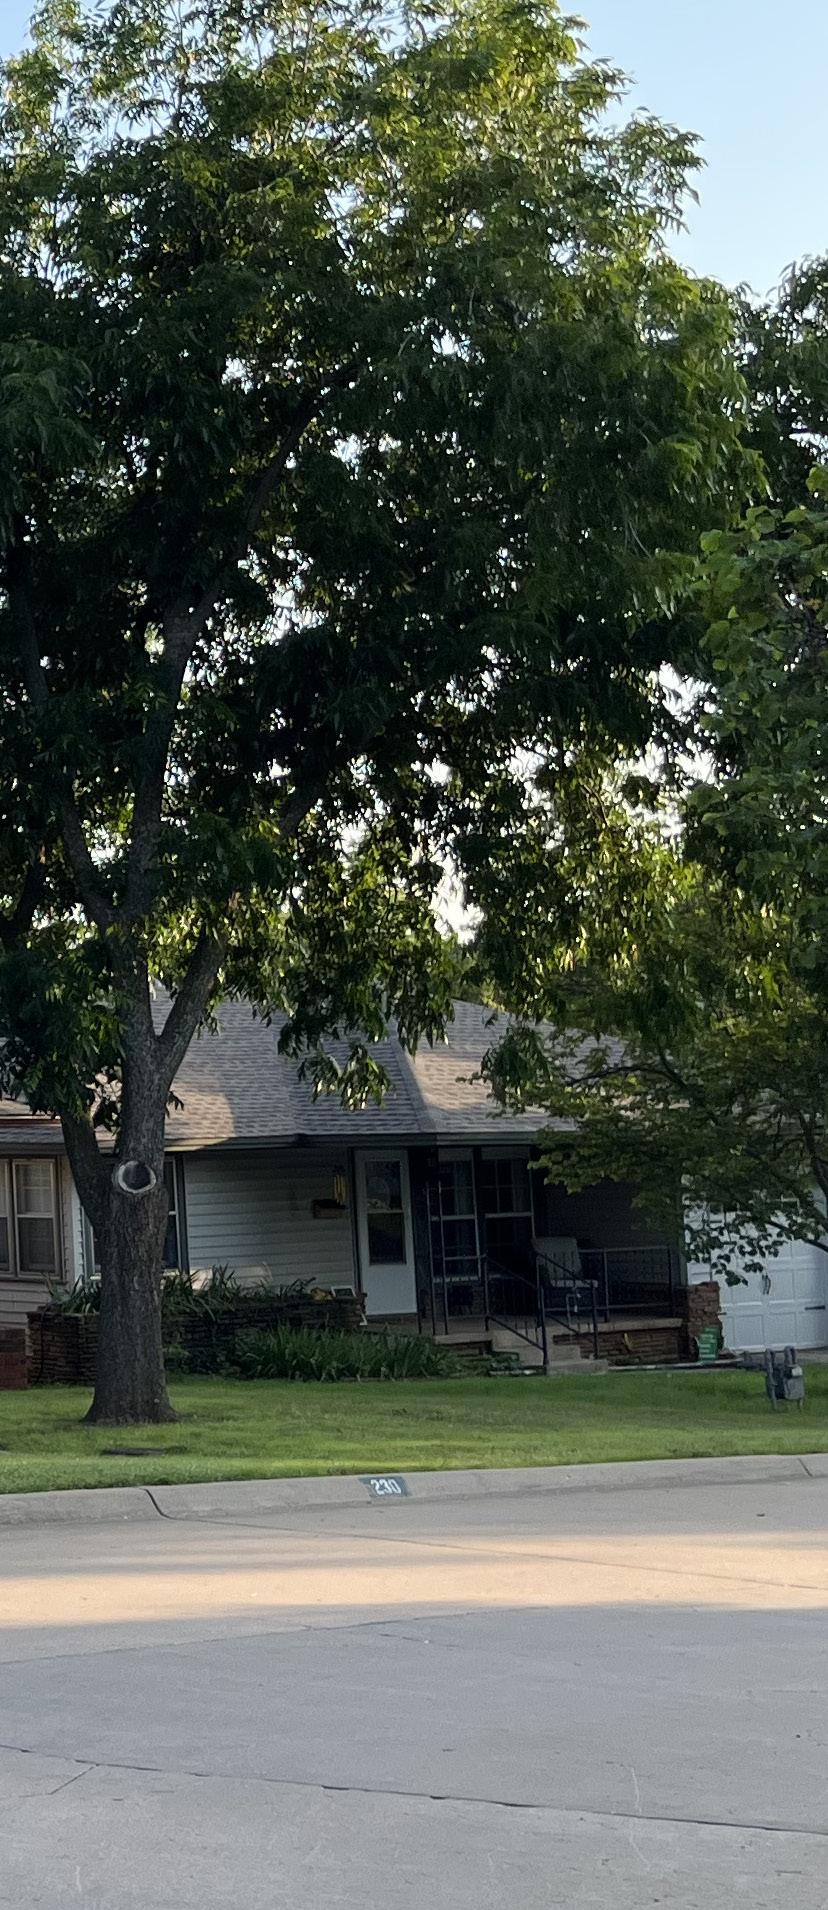
No community can implement all of the strategies at once. Therefore, cities should prioritize efforts that can have immediate impact and help set up the community for long-term success.
To help ensure success, Edmond should collaborate closely with its community partners to implement the housing strategy. One way to foster collaboration is to focus on near-term priorities that emerged through discussions with the Steering Committee and City staff. These priorities—identified based on available resources, community priorities, and timing—can help align community energy around impactful actions. Establishing priorities for implementation is necessary to coordinate efforts by public, nonprofit, and private-sector partners.
The Edmond City Council will have the ability to review policies, programs, or funding opportunities, whether these pass through the Workforce Housing Steering Committee first or come directly from staff. This ensures the Council is informed, engaged, and empowered to direct housing development policies and programs.
The City has a central role in implementation. It sets policy for the use of land and public resources, administers programs, manages careful study of housing needs, and facilitates conversations with community partners about the potential for collective action. The City will operate in each of these capacities to implement the strategies outlined in this study, but especially the tactics that have been identified as priorities.
There are many other entities that contribute to successfully implementing a housing strategy. This group of partners—referred to as the housing ecosystem—includes philanthropy, nonprofits, developers, lenders, investors, and other housing and community groups. Alongside the City, these groups also act as funders, program providers, risk takers, builders, sources of capital, community organizers, and leaders that form an integrated system for housing.
Each of the strategies and tactics will rely on the partnership of this housing ecosystem for success. Opportunities for their collaboration are also identified in the pages that follow.
Priority tactics have been identified that will help focus community support and build capacity for future actions.
Given current resources, it is not possible for the City of Edmond to immediately implement all 20 tactics contained in the four strategies, while also maintaining ongoing efforts. Some tactics may require new legislation, new regulations, or changes in policy. Community members may not currently have the necessary capacity to effectively partner on certain efforts. For these reasons, a thoughtful, systematic approach is needed to help ensure long-term results.
Some near-term tactics are needed to address immediate needs. Others are needed to build capacity and lay the groundwork for future action. Five priority efforts were identified through understanding Edmond’s housing needs with input from the Steering Committee and City staff:
1. Ensure the new zoning code allows more housing diversity
2. Form a Housing Task Force
3. Establish a Housing Fund
4. Establish a baseline of housing/neighborhood conditions
5. Create an education campaign
These priorities have been selected to address the critical needs of the community now while setting the groundwork for future implementation.
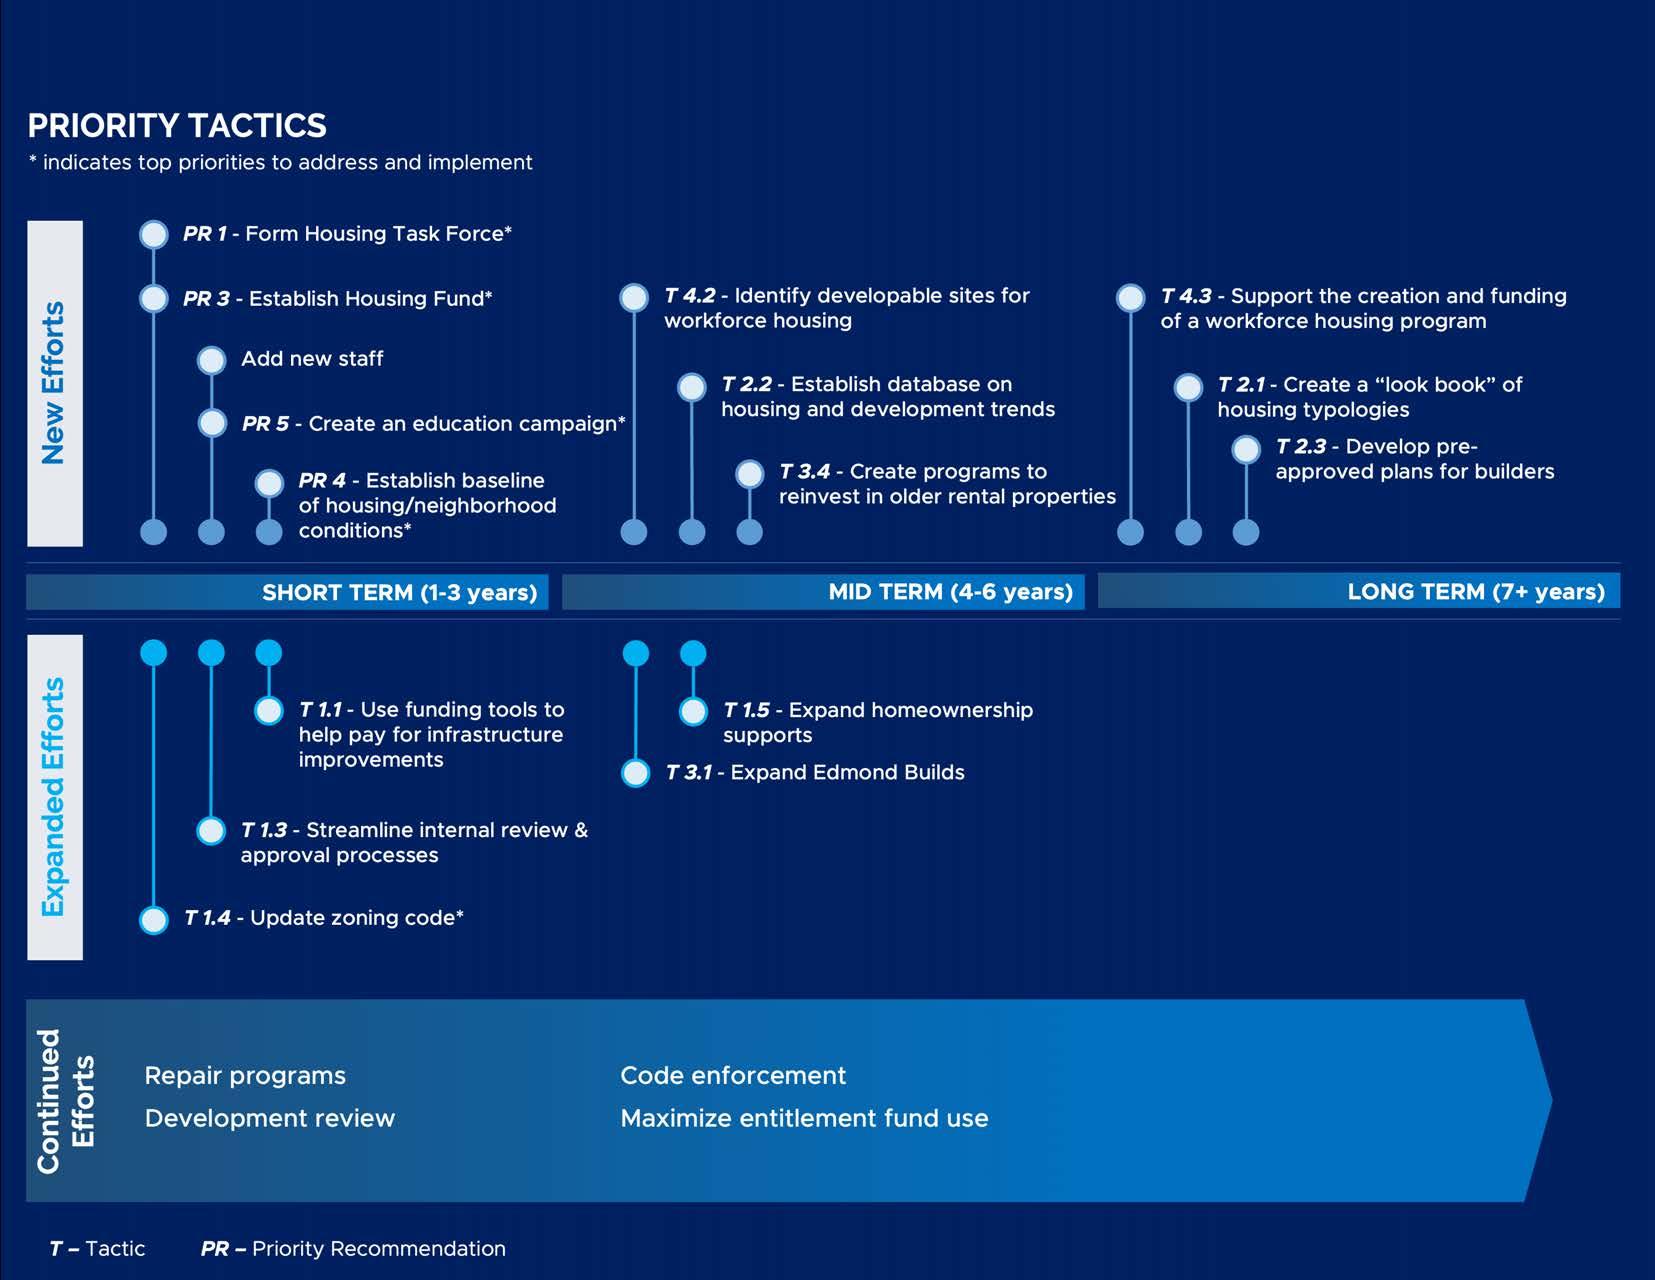
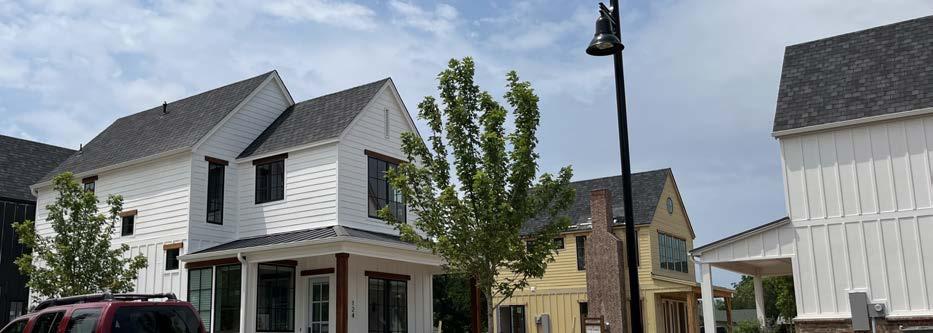
This will support tactics 1.3 and 1.4 directly, as well as many of the other tactics indirectly by creating a streamlined code system that will help increase housing diversity and the pace of development. Specific recommendations include:
1. Establish districts and procedures that support housing goals, including:
• Zoning districts that allow small footprint homes (i.e., single-family starter homes or attached homes with 300 to 600 square feet)
• Zoning districts that allow for missing middle housing products, including attached homes, duplexes, townhomes, fourplexes, sixplexes, and eightplexes
• Zoning districts that allow for smaller multifamily properties (i.e., those with approximately eight to 20 units)
• Mixed-use developments with housing and commercial uses
• Allowing accessory dwelling units (ADUs)
• Overlay districts that allow any of the above within existing districts but only applied in areas defined by the overlay
• Other legally permissible zoning regulations that make it simpler for developers to build needed housing in Edmond
2. Review and amend the permitted by-right and specific use permit developments in residential districts as they relate to specific housing types that may be appropriate for the whole district.
• Consider consolidating residential districts as both permitted and specific use developments change to be allowed or removed from districts
3. Consider form-based codes or performance zoning to accomplish any of the above.
A Housing Task Force should represent a broad cross-section of housing and community leaders in Edmond, including housing providers, finance, real estate agents, the Chamber of Commerce, major employers, school districts, and others. It would:
1. Support all housing initiatives
2. Serve as an advisory board for the City’s housing policies and programs
3. Be composed of community partners who would help implement housing initiatives and raise awareness
4. Serve as the advisory board and review committee for the housing fund
5. Provide ongoing accountability and feedback to the City and its partners
Key elements should include:
• Expanding the role of the existing HUD Citizen’s Participation Committee to become the Housing Task Force
• Defining regular meeting frequency (typically quarterly or every two months)
• Defining tenure for members (e.g., one-year terms, two-year terms, etc.)
• Defining the maximum, if any, for terms of service allowed for members
• Defining how members are appointed
Establishing a housing fund would enable the City to expand the resources dedicated to housing, while allowing partners to contribute as well. It would align tactics 1.6, 3.2, 3.4, and 4.3.
The following is an outline of key steps other communities have taken to establish a housing fund. Most of these steps will require iteration with various City departments, City Council, and the Housing Task Force:
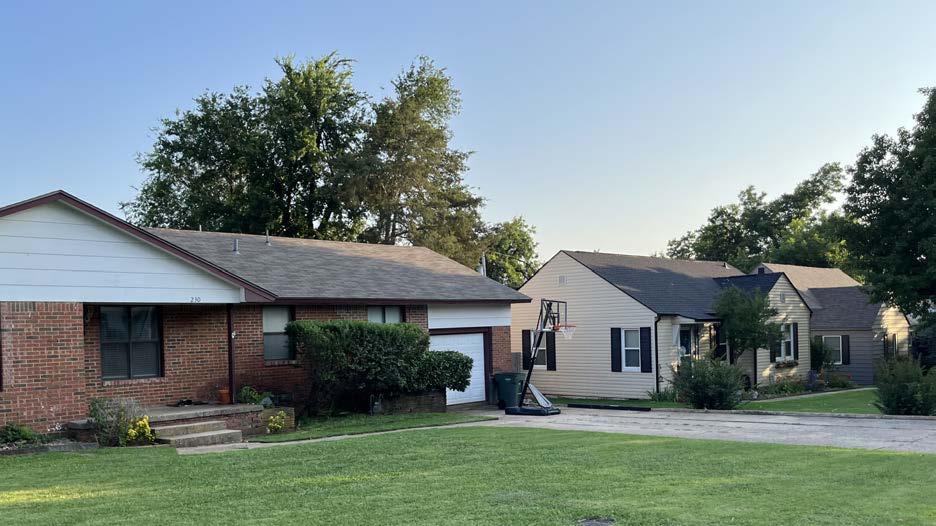
1. Work with the City of Edmond Legal Department to identify key elements needed for an ordinance to establish the Housing Fund
2. Establish the Housing Task Force
3. Define key parameters, including:
a. Funding mechanisms
• American Rescue Plan Act (ARPA) seed funding
• Existing Community Development Block Grant (CDBG) funds
• Grants and other special programs that become available (local, state, and federal)
• General fund contributions
• Special bond or tax issuance
• Partner contributions
b. Use of funds
• Income ranges
• Renovation
• New construction
• Geography
c. Review process
d. Administration process
e. Other needed policies
6. Establish timeline for launching fund, initial program publication and review, and initial award decisions
7. Draft ordinance for review from necessary departments
8. Finalize ordinance for Council Approval
9. Initiate fund
a. Initial housing task force meeting
b. RFP for housing proposals
3. Review initial round of applications and announce awards
4. Establish a project tracking system
5. Establish regular review of policies and be willing to adjust them to make the program user-friendly for developers and housing providers
This baseline would give the City a database to evaluate areas of the city that need various types of housing supports and to track progress on addressing housing conditions and other concerns. It would support tactics 1.2, 2.2, 2.6, 3.1, 3.2, 3.3, 3.4, and 4.3.
At the start, key elements should include:
• The existing parcel database as the basis
• Demographic indicators, such as household growth, household income, housing cost burden, households in poverty, etc.
• Permitting data, including for repairs and renovations, to map where housing investment is occurring and the scale (value)
• Code enforcement data to visualize where more citations occur and what types of issues are present
• Property condition ratings, to be added over time
Once the baseline database is established, key next steps should include:
• Identifying areas that need further information, such as property conditions
• Conducting windshield surveys to rate exterior property conditions, focusing on elements that suggest housing maintenance challenges (such as broken windows, peeling paint, leaning
porches, and poor roof condition)
• Establish a regular time interval to update the data (e.g., every two years)
An education campaign will communicate the lived experience of Edmond residents and workers of all walks of life as they navigate finding suitable housing. In doing so, the campaign will illustrate the need for more diverse housing types and price points.
Key elements should include:
• Establishing partnerships with local organizations who can support the campaign
• Setting a budget for the campaign
• Defining target audiences
• Defining the primary problem that the campaign is aiming to solve
• Defining the project objective
• Defining a primary message or call to action
• Defining audience attitude, objections, and concerns
• Deciding on what types of media should be used (e.g., video, audio, infographics, interviews)
• Coordinating with media outlets/avenues
• Establishing a schedule for pushing out products
• Recording and producing video content from young professionals and seniors
• Expanding storytelling to young families, frontline workers, and major employers
• Identifying and recruiting community partners and influencers who can help spread the message, including an “ambassadors” group
The graphic to the right summarizes three potential funding scenarios for a housing fund to inform discussions about what funding level is appropriate for Edmond. The calculations assume the following:
• Average renovation cost of $20,000 per unit
• Average development gap of $75,000 per unit for workforce-attainable and affordable units
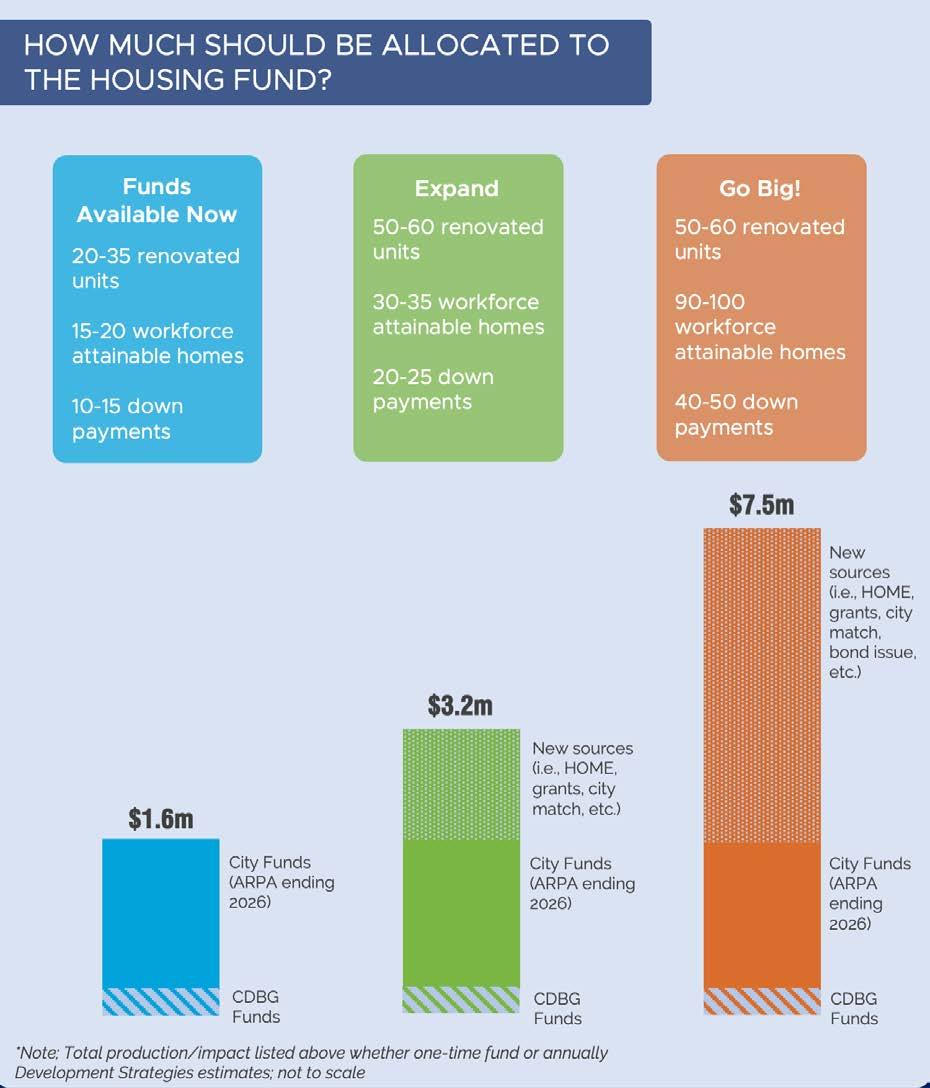
These calculations are for informational purposes to generalize what different funding amounts could accomplish. More detailed development feasibility analysis is recommended to support program design (i.e., grants, loans, income levels, renovations vs. new construction, etc.) as the housing fund initiative moves forward.
The three potential funding scenarios are:
1. Proceed with the funds available today, or the roughly $550,000 CDBG allocation plus the $1,000,000 ARPA allocation for housing
2. Leverage other city resources to expand the funds available today, to bring the total housing fund to approximately $3.2 million
3. “Go big,” or raise enough funds to support substantial unit production at approximately $7.5 million
Each scenario shows what could be accomplished as a one-time offering, or if the funds were made available annually. Identifying a sustainable annual funding source will help Edmond better meet its housing goals.
Each strategy and implementation action has a different focus, a different timeframe for implementation, and different partners involved. The implementation matrix serves as a resource for the City to connect the dots and identify a path forward. It also serves as a reference tool for all partners involved.
The following matrix is a tool that the City and its partners can use to understand how the strategies and tactics fit together, which types of housing need they address, and the partners involved. This matrix should change to reflect new challenges and opportunities that arise in the future. Community priorities may change, shifts in the housing market may occur, funding availability may fluctuate, and new and additional projects and partners may emerge. These future conditions should not be ignored, and new tactics should be discussed, prioritized, and evaluated against the strategies and tactics set forth in this plan.
As mentioned previously, the housing strategy takes a holistic view of housing, one that addresses the needs of owners as well as renters across the full range of household types and incomes. The target housing columns highlight the relevant details related to tenure and affordability.
Implementation of these tactics will involve multiple parties and require partnerships to ensure success. In many cases, the City will take the lead role (marked with an L) and in others it will be a primary partner playing a supporting role to other lead actors. Some partners were identified to have a supporting role (yellow cell) that would be beneficial to implementation of a tactic, but less critical than other players. These groups will be a part of discussions and meetings but likely for short periods of time during the planning and implementation process and not regularly consulted, although this may change based on their interest and the needs of the community.
These columns indicate the likely format for early collaboration in implementation but may change with time.
The target housing columns talk about who the tactic will impact and what housing price points are being targeted. The key actors/partners column identifies the are the groups likely be involved in planning for and implementing the tactic. The implementation timeframe column estimates when these tactics could be explored. It is also useful as a guide for determining an initial priority level. Not everything listed in the matrix will be able to be achieved in the next few years, and will take years of planning to accomplish them all.
This matrix is further continued in the Appendix.
1.1 Use funding tools, such as TIF or impact fees, to help pay for infrastructure
that support affordable and workforce housing development
1.2 Leverage City-owned assets to support affordable, workforce, mixed-income, and mixed-use development
1.3 Work with other City departments to reduce time required for the development review and approval process for housing that meets goals
1.4 Update zoning code to allow more housing types-by-right, incorporate other incentives and inclusionary zoning/affordability set-asides, and include flexible design standards
(L = lead; blue cells = primary partner; yellow cells = supporting partner)
X Affordable, Workforce, Moderate
Key L: Leading partner Blue: Primary partner Yellow: Supporting partner
X Chapter 5 –Implementation
2.1 Create a “look book” of housing typologies and share
2.2 Keep track of housing trends based on type, demographic markets, renter vs. ownership patterns, foreclosures/vacancies, and available lots for development/ redevelopment
2.3 Work with architects and builders/ developers to create pre-approved plans for new housing types X X All L
2.4 Market development opportunities to the local, regional, and national development community using results of this study X X All L
2.5 Evaluate and revise building codes related to certain requirements, such as fire sprinklers, while maintaining the safety of the units X X All
2.6 Expand Edmond’s ability to secure additional federal resources and participate in the real estate market - X Affordable L
(L = lead; blue cells = primary partner; yellow cells = supporting partner)
Key Actors/Partners
(L = lead; blue cells = primary partner; yellow cells = supporting partner)
Workforce, Moderate, Upscale)
STRATEGY
3.1 Expand Edmond Builds to include exploration of protections for existing residents in neighborhoods targeted for revitalization X X Affordable; Workforce
3.2 Continue to support homeowner renovations and weatherization through Edmond’s Owner-Occupied Housing Rehabilitation (OOHR) program
X X Affordable; Workforce L
3.3 Adopt a more proactive approach to code enforcement of problem properties X X Affordable; Workforce, Moderate
3.4 Create and fund new housing programs to encourage reinvestment in older rental properties while maintaining attainable rents
X Affordable, Workforce, Moderate L L
3.5 Work with partners and other governmental staff to explore creating a tax abatement program - - All L
Strategies and Tactics
Point (Affordable, Workforce, Moderate, Upscale)
1 Explore how development costs are impacted by expenditures related to City infrastructure
2 Regularly update local research on housing topics, such as multifamily impacts on property value, crime trends, etc.
3 Include key housing research in staff reports on housing projects to keep the messaging consistent, including economic and fiscal impacts
4 Partner with area organizations and advocates to regularly publish housing-related trends to encourage broad support for diverse housing types and price points
5 Work with partners, area organizations, and advocates to create an education campaign about housing trends and its importance
6 Continue to address concepts of growth, land use, density, transportation, sustainability, and fiscal health through broader planning efforts
Key
X X All L
Key Actors/Partners
(L = lead; blue cells = primary partner; yellow cells = supporting partner)
X X All
X X All
X X All L
L: Leading partner Blue: Primary partner Yellow: Supporting partner

Housing is accessible when public or common areas of the building can be approached, entered, and used by someone with a physical disability. Accessible housing may have ramps, elevators, and wider doorways to accommodate people with mobility improvements. Other accessibility features include wheelchair-accessible bathrooms and universal design features like lever door handles.
The extent to which there are enough rental units at different costs in an area to meet the housing needs of each renter household, assuming that each household pays no more than 30 percent of their income for rent.
According to the federal government, housing is affordable when rent or mortgage payments (principal, interest, taxes, and insurance) plus utilities are no more than 30% of the occupant’s monthly income.
For instance, an apartment unit for an elementary school teacher earning an annual wage of $45,810 in the Oklahoma City region needs to cost less than $1,145/month for it to be considered affordable to them.
Area Median Income (AMI) is a metric calculated by the U.S. Department of Housing and Urban Development (HUD) to determine the income eligibility requirements of federal housing programs.
Attainable Housing is an umbrella term that reflects the many aspects of a home that make it suitable for a household in the City of Edmond. Attainable Housing is appropriate in:
• Size (e.g., number of bedrooms, square footage)
• Type (e.g., detached home, townhome, apartment)
• Quality (e.g., healthy, safe, in good repair)
• Affordability (i.e., within the price range for the household income)
• Tenure (e.g., rental, for-sale)
• Location (e.g., near employment, school, services, etc.).
Generally, Attainable Housing is a more inclusive term to describe affordability at a range of different area median incomes. It is usually used to talk about housing where housing cost and utilities make up no more than 30% of the gross household income for households earning up to 120% of the city’s median area income.
Displacement occurs when residents can no longer afford to live in their neighborhood and they move elsewhere. This often stems from the impact of increasing housing prices in a neighborhood, which in turn can be the result of neighborhood reinvestment and major infrastructure investments.
Any building, structure, or portion thereof which is occupied as, or designed or intended for occupancy as, a residence by one or more households. Dwellings may be single-family homes or multifamily structures, occupied by either renters or owners.
A household composed of one or more persons at least one of whom is at least 62 years of age at the time of initial occupancy. Also referred to as Elderly Person Housing or Senior Household.
Households with incomes below 30 percent of area median income. Most federal affordable housing programs serve households earning up to 80% of area median income.
The Fair Market Rent is the average rent and utility costs for newly leased, nonluxury rental units with basic amenities. Fair Market Rents are used to set rental assistance payment standards for federal housing programs.
All persons living in the same household who are related by birth, marriage or adoption. In HUDassisted housing, all persons sharing a dwelling unit are referred to as a family, whether related or not.
There is no singular definition of gentrification. The term typically encompasses changing neighborhoods, increased development, rising housing costs, and residential turnover.
The total income received by all members of the tenant’s household. This is the amount before taxes and deductions are subtracted.
Gross rent is the amount of rent stipulated in a lease. When someone signs a lease, they will have to pay rent each month, and the gross rent is the combined amount of monthly payments.
An individual who is homeless lacks a fixed, regular, and adequate nighttime residence. Additionally, “homeless” may describe an individual who has a primary nighttime residence that is one of the following:
• A supervised publicly or privately operated shelter designed to provide temporary living accommodations.
• An institution that provides a temporary residence for individuals intended to be institutionalized.
• A public or private place not designed for, or ordinarily used as, a regular sleeping accommodation for human beings.
All the people who occupy a housing unit. A household includes related family members and all the unrelated people. Unrelated people may include lodgers, foster children, wards, or employees who share the housing unit. A person living alone in a housing unit, or a group of unrelated people sharing a housing unit such as partners or roommates, is also counted as a household.
The monthly dollar amount a Public Housing (PHA) would pay directly to the landlord on behalf of the Section 8 Voucher holder. The amount of HAP is the difference between the unit rent and the tenant contribution. The tenant contribution in the Section-8 voucher program is 30% of monthly income.
As HUD’s major tenant-based rental assistance program, Section 8 Housing Choice Vouchers allow low-income households to receive rental assistance in a home of their choice. Housing Choice Voucher tenants pay 30% of their monthly income for rent and the federal government pays the landlord the remainder through a local housing authority. Payments to landlords are restricted by the area’s Fair Market Rent (FMR). This is called the Housing Assistance Payment, or HAP (see above).
A geographic region from which it is likely that renters/purchasers would be drawn to a given housing project. A housing market area most often corresponds to a Metropolitan Statistical Area (MSA).
Housing with severe or moderate physical problems, as defined in the American Housing Survey (AHS) since 1984. A unit is defined as having severe physical problems if it has severe problems in any of five areas: plumbing, heating, electrical system, upkeep, and hallways. It has moderate problems if it has problems in plumbing, heating, upkeep, hallways or kitchen, but no severe problems.
A household whose combined income does not exceed 80% of the median family income for the area. This is the income eligibility threshold for most federal affordable housing programs.
The geographic are from which a project owner could reasonably expect to draw applicants.
The most probable price that a property should bring in a competitive and open market. This is provided that all conditions requisite to a fair sale are present, the buyer and seller are knowledgeable and acting prudently, and the price is not affected by any undue stimulus.
An area with at least one urbanized area of 50,000 or more population, plus adjacent territory that has a high degree of social and economic integration with the core. This integration is primarily measured by commuting ties.
Net rent is the rent a lessee pays on average per month of a lease period. It is not the actual amount a lessee pays per month, but a mathematical calculation that considers free months on the lease as if they’d been paid for. The net rent may appear on rental listings to guide potential renters toward the listing with the promise of lower payments.
Describes the phenomenon in which residents of a neighborhood designate a new development or change in occupancy of an existing development as inappropriate or unwanted for their local area.
Naturally occurring affordable housing is housing that is available on the regular market, open to anyone and happens to be affordable to many families.
Payments authorized by the U.S. Housing Act of 1937 for operating costs of low-rent public housing properties. Operating subsidies help public housing authorities pay for utilities, maintenance, security, accounting, reporting and similar operating costs.
The condition of having an average of more than one person per room. Overcrowding is considered a serious housing problem. Overcrowding is not allowed in federally assisted housing.
Project-based housing assistance describes when government housing assistance is tied to the unit, not the tenant. When a tenant moves out, they do not take the rental assistance with them. New tenants moving into the unit will benefit from the rental assistance attached to the property.
A component of a public housing authority’s housing (PHA) Section 8 Housing Choice Voucher program. A PHA can attach up to 20% of its voucher assistance to specific housing units if the owner agrees to either rehabilitate or construct the units, or the owner agrees to set aside a portion of the units in an existing development.
Housing assisted under the provisions of the U.S. Housing Act of 1937 or under a state or local program having the same general purposes as the federal program. Public housing is distinguished from privately financed housing, regardless of whether federal housing subsidies or mortgage insurance are features of the housing development.
Any census tract (or equivalent geographic area defined by the Census Bureau) in which at least 50% of households have an income less than 60% of the area median gross income. In addition, a census tract may also be a Qualified Census Tract if it has a poverty rate of at least 25%.
Discrimination based on location is often referred to as redlining. Historically, some lending institutions were found to have maps with red lines delineating neighborhoods where they would not do business, which were typically neighborhoods with large populations of racial minorities.
A new pathway to home ownership meant to bridge the gap between renting and owning a home. Rent is generally agreed up front and purchase price is fixed, providing stability while you save.
The labor, materials, tools, and other costs of improving buildings, other than minor or routine repairs. Rehabilitation includes when the use of a building is changed to an emergency shelter and the combined cost of this change and any rehabilitation costs does not exceed 75 percent of the value of the building before its use was changed.
Rehabilitation that involves costs of 75 percent or less of the value of the building before rehabilitation. Examples of renovation projects include jobs like kitchen or bathroom remodels, upgrading windows, or adding a deck.
A federally funded rental assistance program that pays private landlords the difference between what a low-income household can contribute and the fair market rent.
Section 8 Housing Choice Vouchers (HCV) provide rental assistance for households to use renting in the private market. Section 8 Project-Based Rental Assistance (PBRA) is attached to a specific
home or apartment community. In both programs, the tenant pays 30% of monthly income for rent with HUD pays the owner the remainder, up to the area’s Fair Market Rent (FMR).
Tenant-based housing assistance (as opposed to project-based housing assistance) is a broad category of affordable housing programs where the rental subsidy is tied to the tenant. Households receiving the benefits of a tenantbased housing assistance program may be able to keep the benefits when moving.
Tax increment finance is a mechanism for capturing the future tax benefits of real estate improvements in order to pay for the present cost of those improvements. It is generally used to channel funding toward improvements in distressed or underdeveloped areas where development would not otherwise occur.
Transit-oriented development creates compact, mixed-used communities near transit where people enjoy easy access to jobs and services.
An amount used by a Public Housing Authority (PHA) to determine average utility bills for a specific area. It is used to calculate the tenant’s portion of the monthly rent.
An ordered list of households who have applied for housing assistance through a Housing Authority or private landlord. Waiting lists are used when affordable housing demand exceeds the supply of available assistance.
Workforce housing is housing for the occupations needed in every community, including teachers, nurses, police officers, fire fighters, and many other critical workers. The families in need of workforce housing do not fall neatly into a single narrow income category. Employees in some industries (for example, retail sales, food service, tourism) are more likely to be in lower income ranges. Seasoned workforce jobs with education or training requirements—such as teachers, police officers, nurses, etc.—may fall into the middle income brackets, but still find it difficult to afford homes in the community where they work.
For instance, in the Oklahoma City region, the median annual wage for restaurant cooks is $24,790, for elementary school teachers is $45,810, and for registered nurses is $65,680.
Sources:
1. www.charleston-sc.gov/DocumentCenter/ View/25791/Housing-for-a-Fairer-Charleston-Report
2. https://affordablehousingonline.com/glossary
3. https://www.cdfa.net/cdfa/cdfaweb.nsf/ resourcecenters/tif.html
4. https://www.transit.dot.gov/TOD
Stakeholder conversations gave local experts—community members who live and work in the Edmond region—a chance to share insights about the area’s challenges and opportunities related to housing. Approximately 25 individuals participated. They represented a broad range of perspectives, including real estate agents, major employers, housing developers, small businesses, social services, education, health care, economic development professionals, City representatives, neighborhood organizers, and nonprofits.
Stakeholder conversations both informed much of the data and market analysis and confirmed its conclusions. A variety of the challenges that stakeholders identified center on the need for more housing units at more affordable price points. Many stakeholders cited anecdotally how difficult it is to find homes for sale for less than $200,000. Homes at this price point would be affordable to households earning $76,000 per year or less. Households earning less than $75,000 per year account for 40% of Edmond’s population.
• Edmond’s quality public schools have made it a highly desirable area to live.
• Many stakeholders say that the community overall has excellent amenities available (for example, fitness centers, libraries, health and wellness features like trails, parks, and shopping). That said, some amenities (e.g.,
childcare facilities) are more difficult to access in some parts of Edmond.
• Downtown retail locations struggle to survive without appropriate foot traffic. Housing units take a long time to build in downtown Edmond (see below), which is creating a mismatch.
• It is difficult to find smaller, less expensive single-family homes in Edmond. Many stakeholders cited a need for ‘missing middle’ housing and barriers for households who are young or have more modest incomes.
• It is difficult to find quality rental housing at affordable prices in Edmond. Many existing rental units that are affordable are of low quality with habitability issues.
• Having rental housing available does not only make a community more inclusive for households of different income levels; it also makes a community more inclusive for people at different life cycle stages. College students, young adults, and older adults are more likely to be interested in rental housing, for example.
• Some stakeholders observed that many university students have to withdraw from school in Edmond because they live outside town and can’t manage adequate transportation to campus.
• Affordable, readily available senior housing is a challenge in the Edmond community. Many older adults who are interested in downsizing cannot find suitable housing options, and as a result stay in homes that are bigger than they need for longer than they would otherwise desire.
• A number of stakeholders observed that many young people do not aspire to live in Edmond— not because they do not like the community, but because they do not see it as achievable to live there.
• There are concerns about affordable for-sale properties being converted to corporatelyowned rental properties, which often target good school districts like Edmond’s.
• It is relatively easy to build apartments on the west side of Edmond compared to the east side of Edmond. This is creating a crunch for the school district on the west side of town. If it were possible to build apartments across town more evenly, it would help distribute school enrollment more sustainably.
• Edmond needs a wider variety of housing types, including diverse single family and multifamily options (such as duplexes and quadplexes).
• Housing developers report that it can be difficult to work with the City, especially on multifamily projects and/or in the downtown Edmond area.
• Getting through permitting and inspection processes can be challenging, especially downtown, where some developers report a two-year delay beyond what it would take to build further from the center of town.
• Moreover, there isn’t a robust system set up to support multifamily housing projects. Even a month or two of delay on a large housing project can add up to hundreds of thousands of dollars in carried interest cost.
• Regulations currently make it especially difficult for smaller scale developers to work on smaller scale projects.
• It has been easier to develop denser housing in and outside of Edmond to the west (vs. east).
• Different neighborhoods in different parts of Edmond have different needs.
• When developing smaller homes, the price per square foot tends to go up.
• It is difficult and expensive to build affordable housing. Skyrocketing construction costs are making that issue worse.
• It has become difficult for many critical frontline workers, including those working in the school and healthcare systems, to find housing they can afford in Edmond. This is especially true for support staff positions that are paid lower wages.
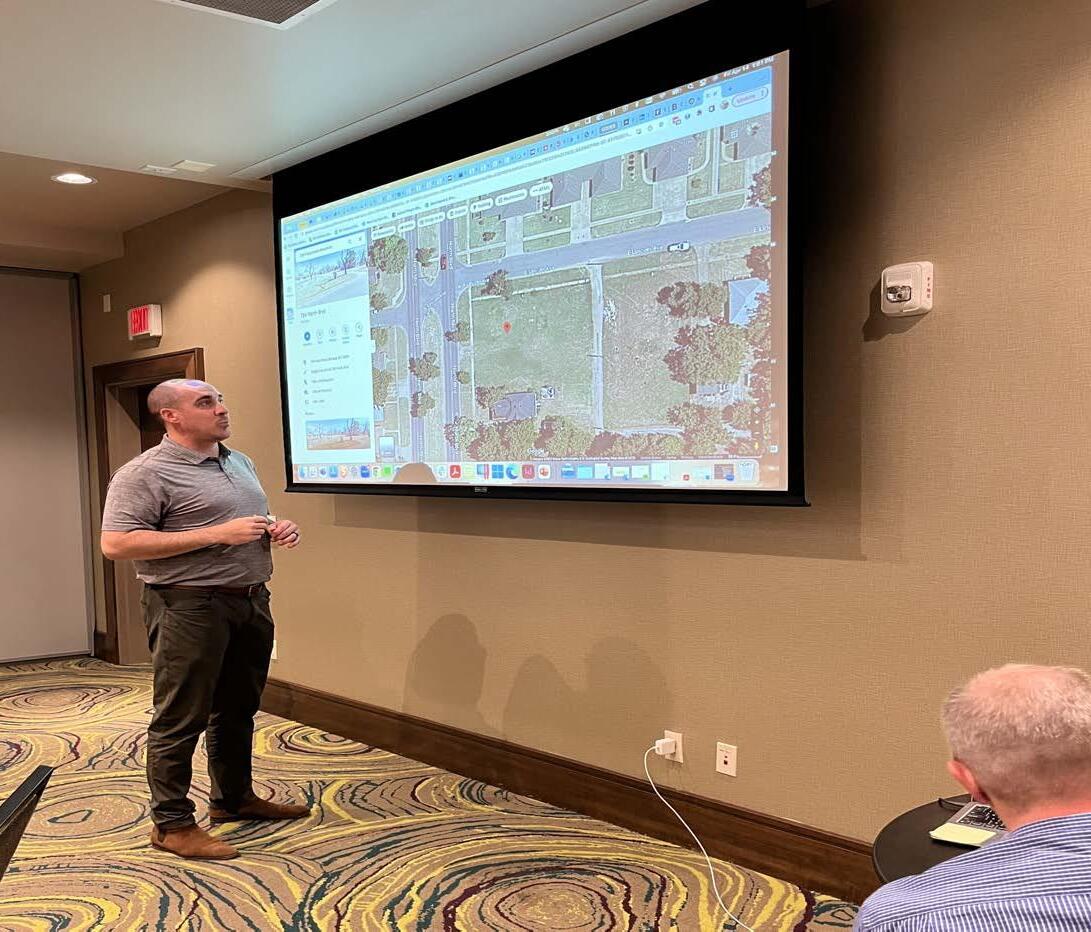
• High housing prices and lack of variety in Edmond have forced many Edmond-based workers to look outside the city for housing, both in Oklahoma City and smaller surrounding towns. There are incentives (shorter commute time, money saved on gas) for these workers to find jobs closer to home when they move away from Edmond. Some of these smaller communities do not yet have adequate infrastructure to accommodate this population growth.
• For healthcare systems, housing issues directly impact hospital efficiency. When organizations can’t find workers locally, they are forced to rely more on contingent labor, which is more expensive. When personnel costs balloon out of
control, healthcare systems are forced to start considering shutting down service options. This often starts with mission-driven services like OB-GYN and psychiatric units.
• There is a subset of the community that is hostile toward low-income housing units and multifamily housing at all price points, and Oklahoma’s referendum process makes it easy to block a project after it’s been approved.
• Some of this opposition is not directed at rental and/or multifamily housing in general, but rather concern about where it is located.
• In conversation with state legislators, there is not a willingness to change regulations about this; they report that Edmond is the “only” community in Oklahoma experiencing this issue.
• Many stakeholders perceived a community resistance to change in general and developing more housing variety specifically.
• There is a widespread misperception that people who rent housing are of less value than people who own housing.
• Some opposition is directly rooted in growing pains as Edmond is changing. “I want commercial development, but not located by me. Multifamily housing is okay, but not located by me.” There is a disconnect here: when we say “not by me,” this adds traffic by default (see below).
• There are more limited financing support
options (e.g., downpayment assistance, supplemental financing) available in Edmond than in Oklahoma City.
• Limited public transportation infrastructure means that workers who cannot or choose not to rely on cars are at a severe disadvantage. For healthcare employees, for example, a more limited bus schedule limits their ability to accept certain shifts. Additionally, public transportation options are often limited in areas where housing is affordable.
• Traffic has gotten worse in recent years. Some of this is driven by ongoing opposition to new commercial development, since that means that a growing population is squeezing into the same number of commercial areas.
• Many commercial developments in town do not have good cross-access connectivity (i.e., parking lots are not linked up).
• City of Edmond residents are generally receptive to the idea of new amenities.
• Storytelling campaigns reframing the narrative around rental and affordable housing may help open up the conversation, diffuse hostility, and educate the public about how a lack of affordable housing and housing diversity is hurting Edmond. Specifically, stakeholders suggested these approaches may be effective:
• Sharing facts and data about housing in Edmond (this likely won’t convince those who are most deeply entrenched)
• Challenging people to think about the full
life cycle in relation to housing: was there a time in your life when you rented? Do you have young adults in your life who would like to live in Edmond, but can’t because it’s too expensive? Do you know any aging adults who would like to downsize or shift to a rental property?
• Sharing employers’ struggles to fully staff up given housing challenges
• Talking about the average value of a singlefamily home; this has grown over time
• Talking about average household size vs. average home size in Edmond
• It would be helpful to have community conversations about the differences between:
• Protected affordable housing and naturally occurring affordable housing
• Affordable housing and attainable housing
• It could help balance the conversation if we encourage people who are supportive of more diverse housing stock to speak out in support.
• Are there creative new housing models we can explore to diversify housing options in Edmond?
• If the City were to preapprove a set of plans or types of plans for certain development types, it would make housing development more accessible to more people.
• Opportunity Zones can pair well with noncompetitive 4% Low-Income Housing Tax Credits (LIHTCs). However, Edmond only has one Opportunity Zone, and most of it is the University of Central Oklahoma college campus.

The Housing Assessment used two public surveys to complement other community engagement and research. This section summarizes key findings from the Housing Needs Survey.
The survey was designed to capture public input on housing needs, affordability, barriers, and other key issues related to housing. The results helped paint a picture of the broad experience of housing in Edmond.
The survey included 33 questions organized into five sections.
Section 1: Tell us about your home
This section asked respondents to provide basic information about their homes, including:
• Zip code and area where they reside
• Type of housing
• Whether they rent or own their home
• Housing costs
Section 2: Tell us about your housing experience
This section asked respondents how long they had lived in their current home and whether they have ever lived or searched for housing in Edmond. If a respondent had not lived or searched for housing in Edmond, the survey skipped them ahead to Section 3. If they had searched for housing or lived in Edmond, the respondent was asked about their experiences with different issues when trying to find suitable housing:
• Physical condition issues
• Interior and exterior safety issues
• Affordability or access issues
• Location issues
Section 3: Tell us about your housing preferences and goals
This section asked about the respondent’s housing goals in the next three to five years (e.g., stay in their current home, make improvements to their current home, buy a new home, rent a new home, find stable housing). The respondent was then asked questions specifically related to their selected goals:
• Types of improvements they were hoping to make
• Important qualities desired if they were to buy or rent a new home
• What they needed to secure stable housing
• What amenities and services were most important to have near home
Section 4: Share your thoughts on community housing priorities
This section asked respondents to:
• Rate priority objectives for changes in Edmond’s housing market
• Select price ranges they would feel comfortable spending to buy or rent a home
• Share open feedback on what they would like to see for Edmond’s housing landscape
Section 5: Tell us a little about yourself
This section asked respondents to share their personal and demographic information. All questions were optional:
• Age range
• Employment and/or student status
• Commute time
• Racial/ethnic identity
• Household size
• Household income
The survey was made available in English and was administered through the web-based survey platform SurveyMonkey. A paper version was also created for groups without internet access, but it received no responses.
The survey was promoted through the City’s social media channels and website, a press release for local media, Steering Committee members and other local stakeholders, and a flier that was posted in public places throughout Edmond, including in libraries and bus shelters.
Overall, 1,767 people participated in the survey, including City of Edmond residents (93%) and people living outside of the city (7%). While survey respondents were not perfectly representative of the City of Edmond, the responses to the survey created a better understanding of local housing preferences and experiences.
The following tables provide details about the demographics of the Housing Assessment Survey respondents compared to those of residents living in the City of Edmond. Some demographic groups were over- and under-represented among survey respondents, which was accounted for when highlighting and reporting on results.
Please note that all results graphs do not have the same scale, and rather are scaled based on the results for maximum legibility.
Questions 31, 32, and 33 asked survey respondents to indicate whether they wanted to receive project updates, and if so, to provide their name and email address. Those responses are not recorded here.
Answer Choices:
This was an open-ended question in which respondents could type their zip code.
The map at right displays all zip codes with at least 5 survey responses. These zip codes account for 1,712 out of 1,755 total survey respondents.
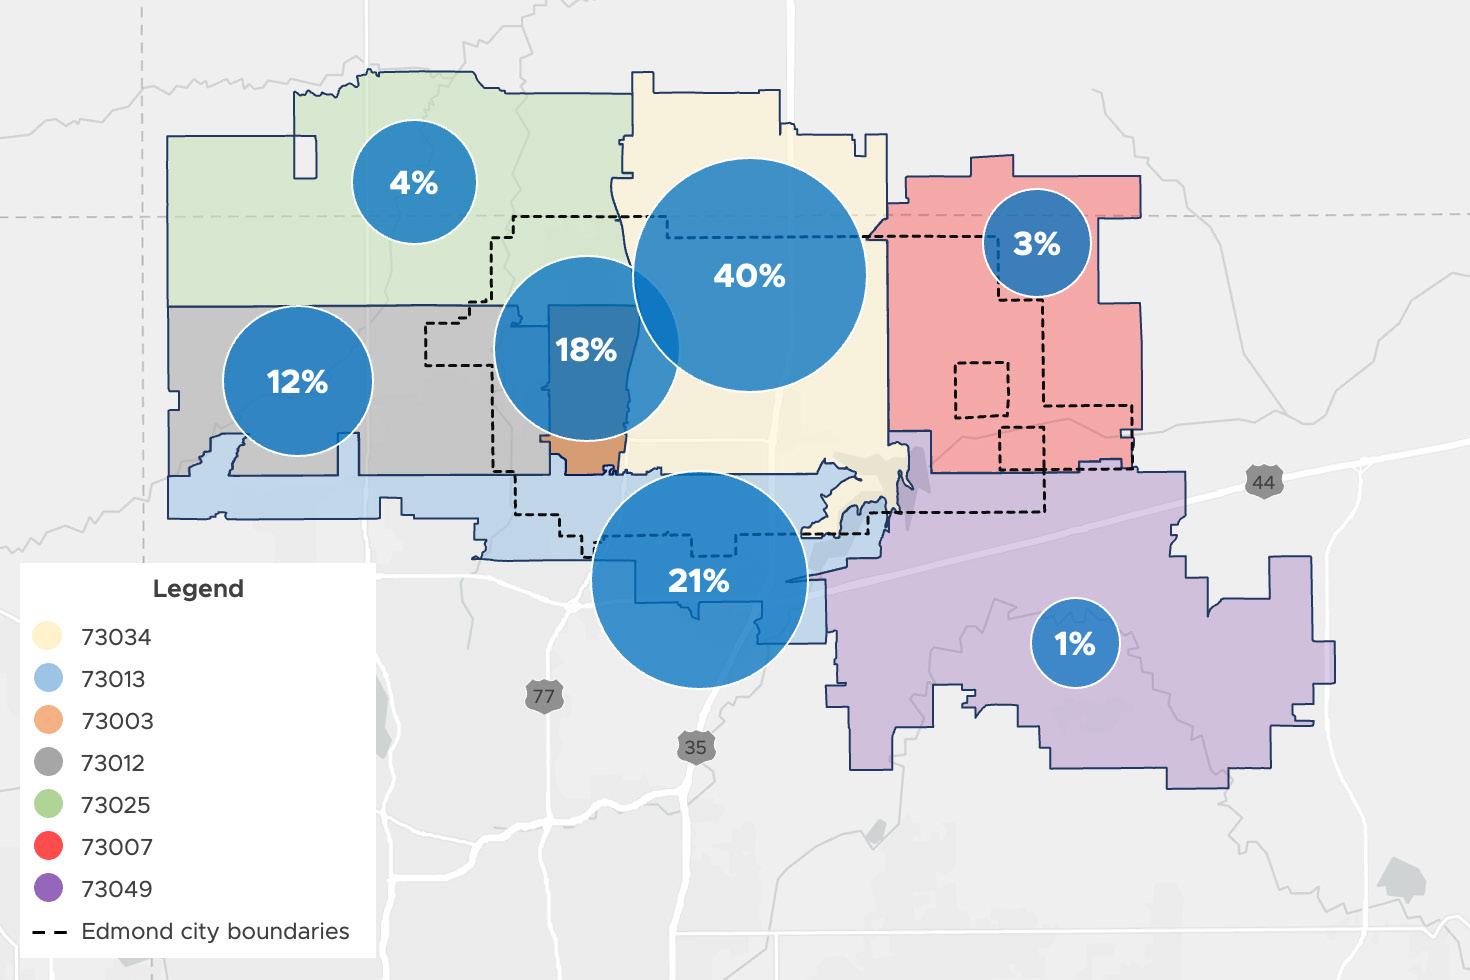
Please review the map of Edmond below (displayed at right), then select the area that best describes where you currently live.
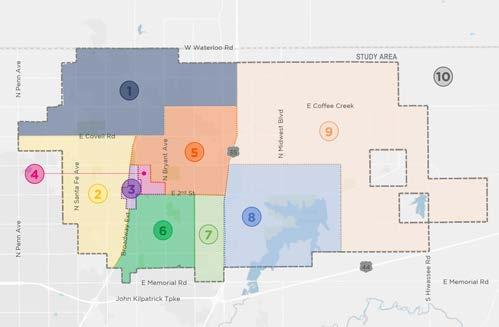
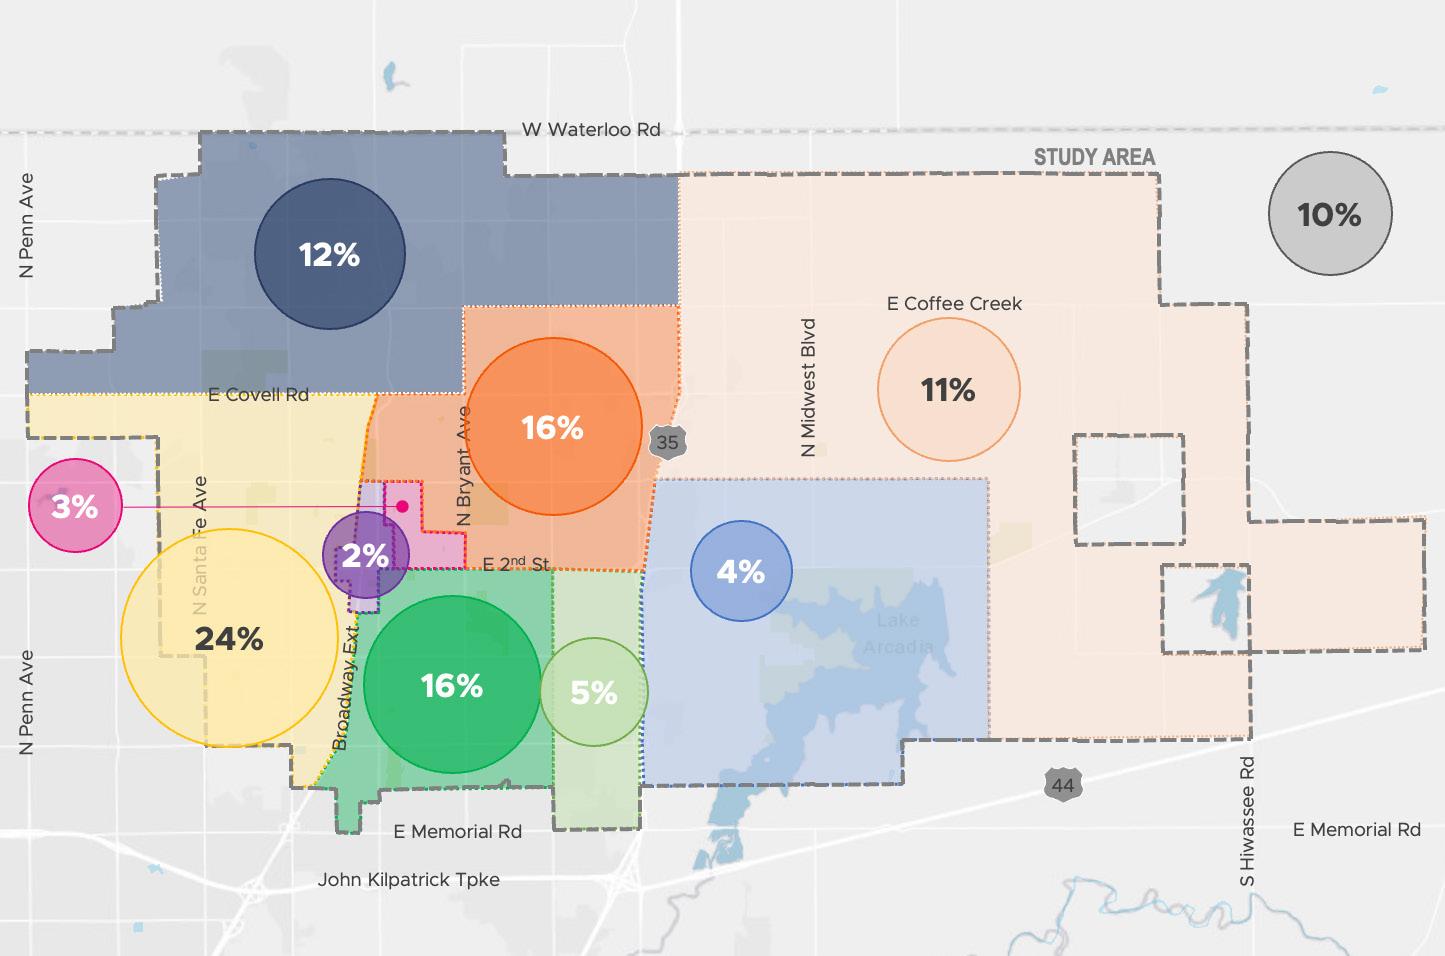
Answer Choices:
The respondents were shown the map displayed on the upper right hand corner and asked to select which area in Edmond they lived in (Areas 1-9) or Area 10 if they lived outside of Edmond.
What type of home is your current residence?
Answer Choices:
• Single family
• Duplex
• Townhouse/row house
• Small apartment building (fewer than 6 units)
• Medium apartment building (6 to 17 units)
• Large apartment building (18 units or more)
• Campus or student housing
• Mixed-use (e.g., with residential above commercial/retail)
• Mobile home
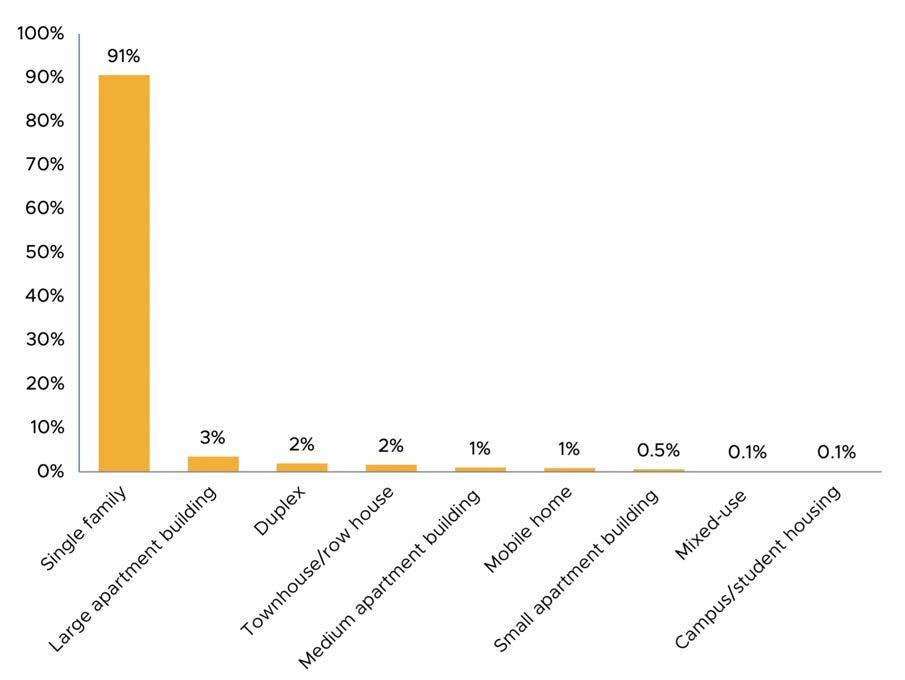
Question 4:
Do you own or rent your home?
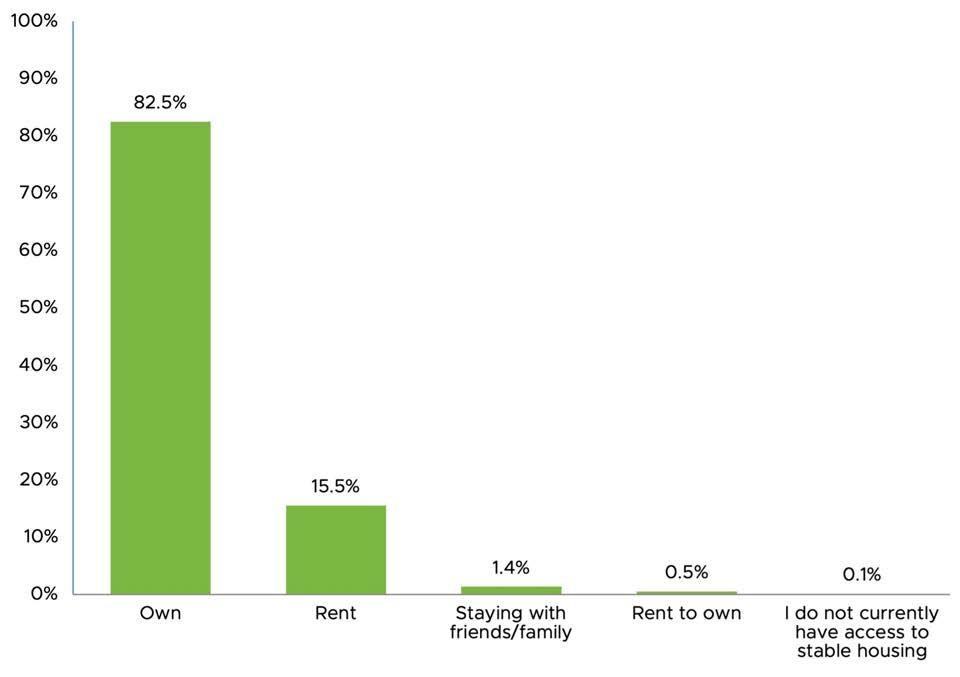
Answer Choices:
• Own
• Rent
• Rent to own
• Staying with friends/family
• I do not currently have access to stable housing
What are your total monthly housing costs—either rent or expenses related to owning your home (including mortgage, insurance, taxes, and utilities)?
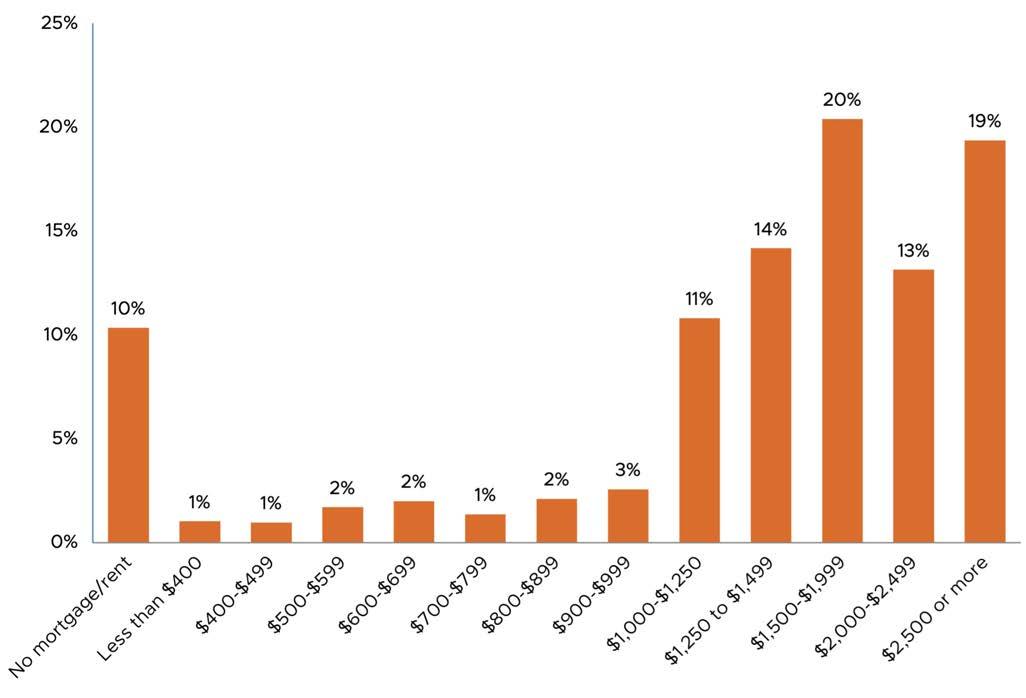
Answer Choices:
• No mortgage/rent
• Less than $400
• $400 to $499
• $500 to $599
• $600 to $699
• $700 to $799
• $800 to $899
• $900 to $999
• $1,000 to $1,250
• $1,250 to $1,499
• $1,500 to $1,999
• $2,000 to $2,499
• $2,500 or more
How long have you lived in your current home?
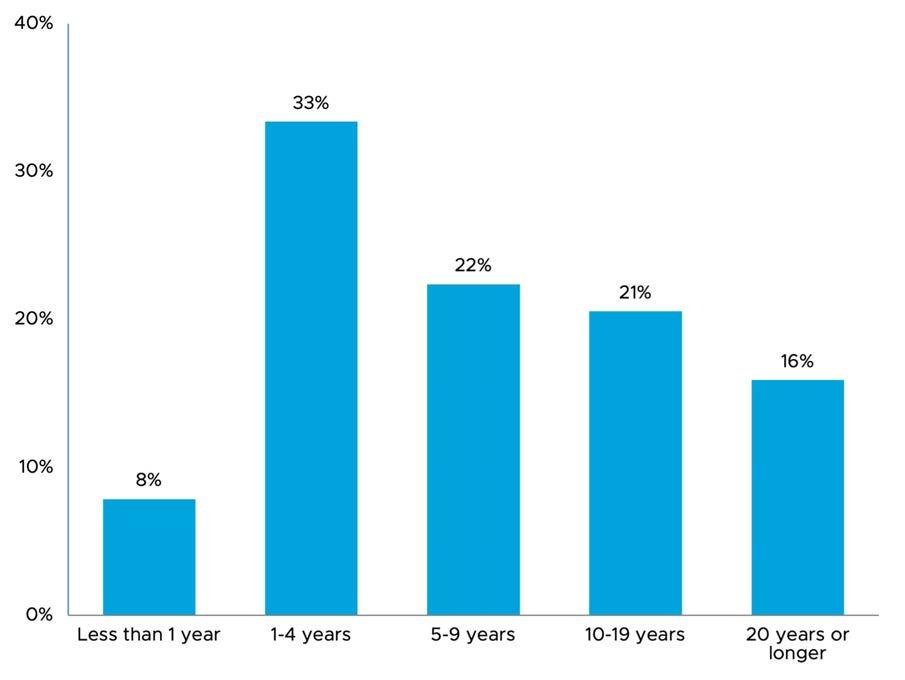
Answer Choices:
• Less than 1 year
• 1-4 years
• 5-9 years
• 10-19 years
• 20 years or longer
Have you ever searched for or lived in housing in Edmond?
Answer Choices:
• Yes
• No, I have never lived in Edmond or searched for housing there
Have you ever encountered any of the following physical or condition issues when trying to find suitable housing in Edmond? (Select all that apply.)
Answer Choices:
• None of the above
• I have seen homes/apartments with significant repair needs
• I have had difficulty finding a home upgraded for my needs
• I have a disability and could not find an accessible home
• I have had difficulty finding a home large enough for me/my family
• I have had difficulty finding a home with the architectural qualities or features I want
• I have had difficulty finding a home located close to the amenities I want
• I have had difficulty finding the type of home I expect within my price point range
• Other (please specify)

Which of the following interior safety issues or repair needs have you seen/experienced in Edmond? (Select all that apply.)
Answer Choices:
• None of the above
• Basement unit without proper egress windows (a window large enough for entry or exit in case of an emergency; typically required when finishing a basement and paired with an egress well with attached ladder or steps for easy escape)
• Mold and/or water damage
• Insufficient smoke alarms or carbon monoxide detectors
• Plumbing, electrical, or mechanical systems deficiencies or hazards
• Leaky, drafty windows and doors
• Other (please specify)
Answer Breakdown:
• 42% of respondents did NOT see or experience an interior safety issue or repair need
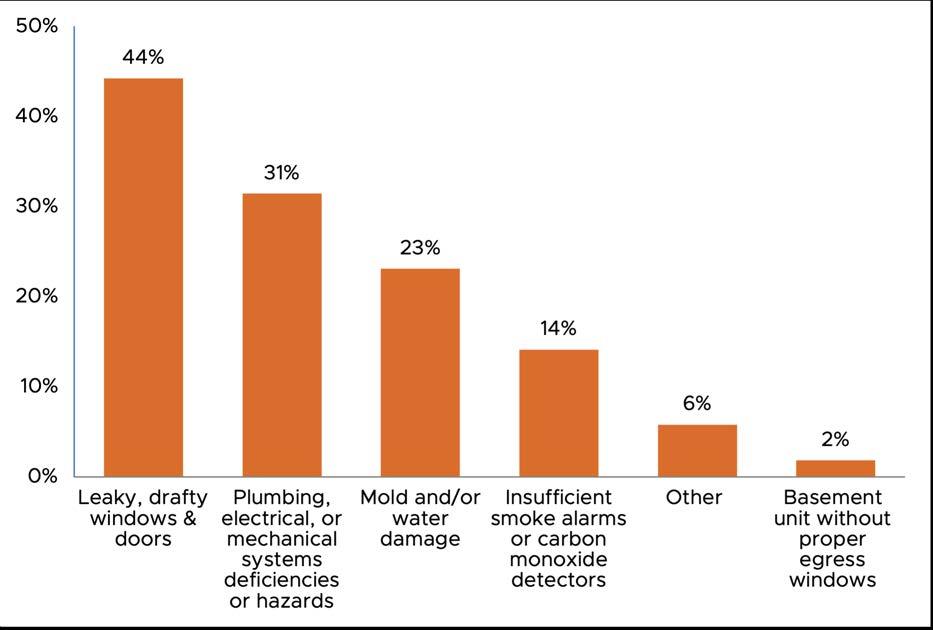
• 58% of respondents saw or experienced an interior safety issue or repair need
The following graph is a breakdown of the interior safety issues or repair needs that 58 percent of respondents have experienced.
Which of the following exterior safety issues or repair needs have you seen/experienced in Edmond? (Select all that apply.)
Answer Choices:
• None of the above
• Windows and doors in disrepair
• Problems with the roof
• Peeling paint, decayed siding
• Cracked, settled foundation
• Exterior stairways, decks, and porches in disrepair
• Other (please specify)
Answer Breakdown:
• 29% of respondents did NOT see or experience an exterior safety issue or repair need
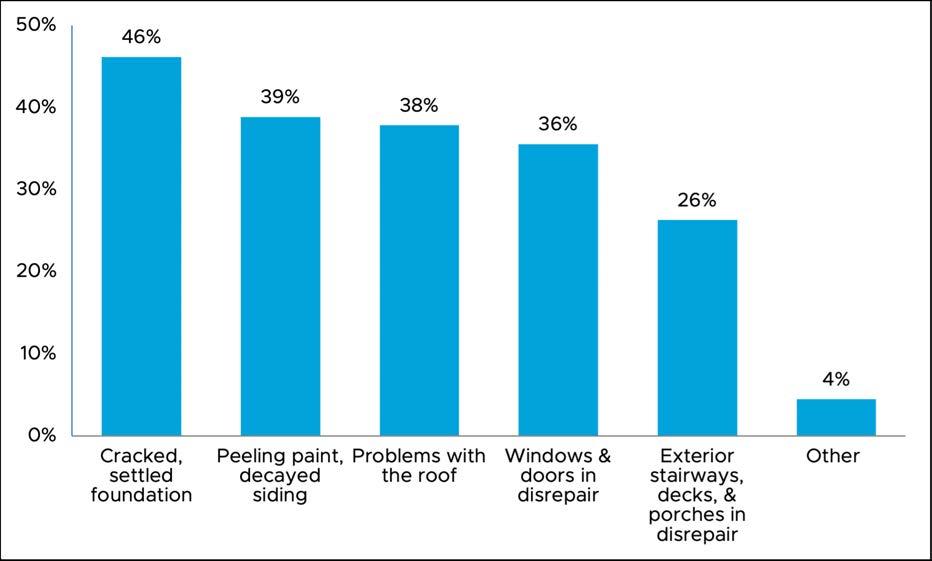
• 71% of respondents saw or experienced an exterior safety issue or repair need
The following graph is a breakdown of the exterior safety issues or repair needs that 71 percent of respondents have experienced.
Have you ever encountered any of the following affordability or access issues when trying to find suitable housing in Edmond? (Select all that apply.)
Answer Choices:
• None of the above
• I have had difficulty finding a home I could afford on my wages
• The utilities costs were too high
• I have had problems with my credit history
• I have a history of eviction or being threatened with eviction
• I need but do not have a co-signer to access housing
• I have faced discrimination on the basis of my race
• I have faced discrimination on the basis of my gender identity
• I have faced discrimination on the basis of my religion
• I have faced discrimination on the basis of my sexuality
• I have faced discrimination on the basis of my disability or disabilities
• I have faced discrimination on the basis of my source of income
• Other (please specify)
Answer Breakdown:
• 42% of respondents did NOT encounter any affordability or access issues when trying to find housing
• 58% of respondents encounter any affordability or access issues when trying to find housing
The following graph is a breakdown of the affordability or access issues that 58 percent of respondents encountered.
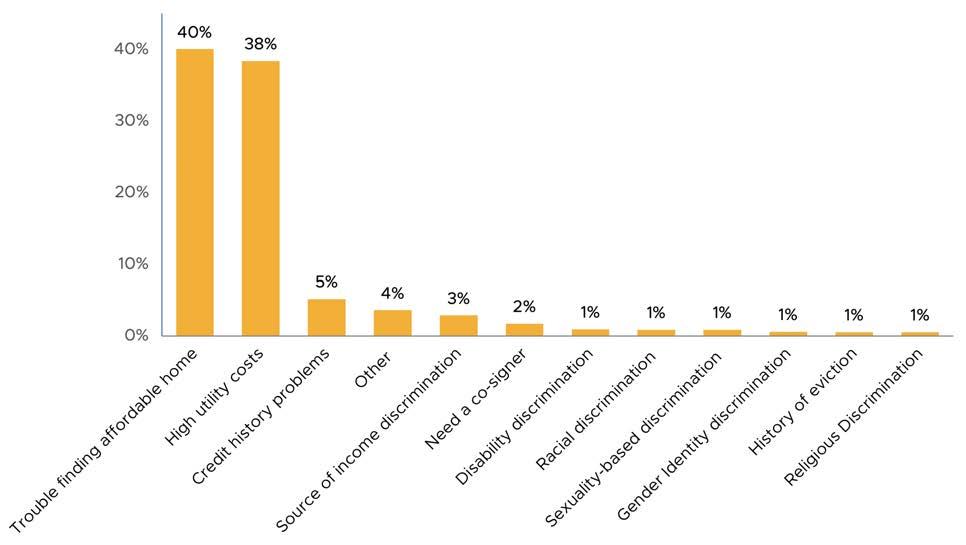
Have you ever encountered any of the following location issues when trying to find suitable housing in Edmond?
(Select all that apply.)
Answer Choices:
• None of the above
• I have had difficulty finding a suitable home in Edmond within the time I have been searching
• I have had difficulty finding housing in a location where I could find reliable transportation to work, school, and/or other everyday commitments
• I have had difficulty finding a home in a walkable environment
• I have had difficulty finding a home near my work
• I have had difficulty finding a home near amenities, like a park, schools, shops, etc.
• I have had difficulty finding a home near recreational amenities
• I have had difficulty finding a home in a neighborhood with the character I want
• Other (please specify)
Answer Breakdown:
• 47% of respondents did NOT encounter location issues when trying to find housing
• 53% of respondents encountered location issues when trying to find housing
The following graph is a breakdown of the location issues respondents encountered when trying to find housing in Edmond.
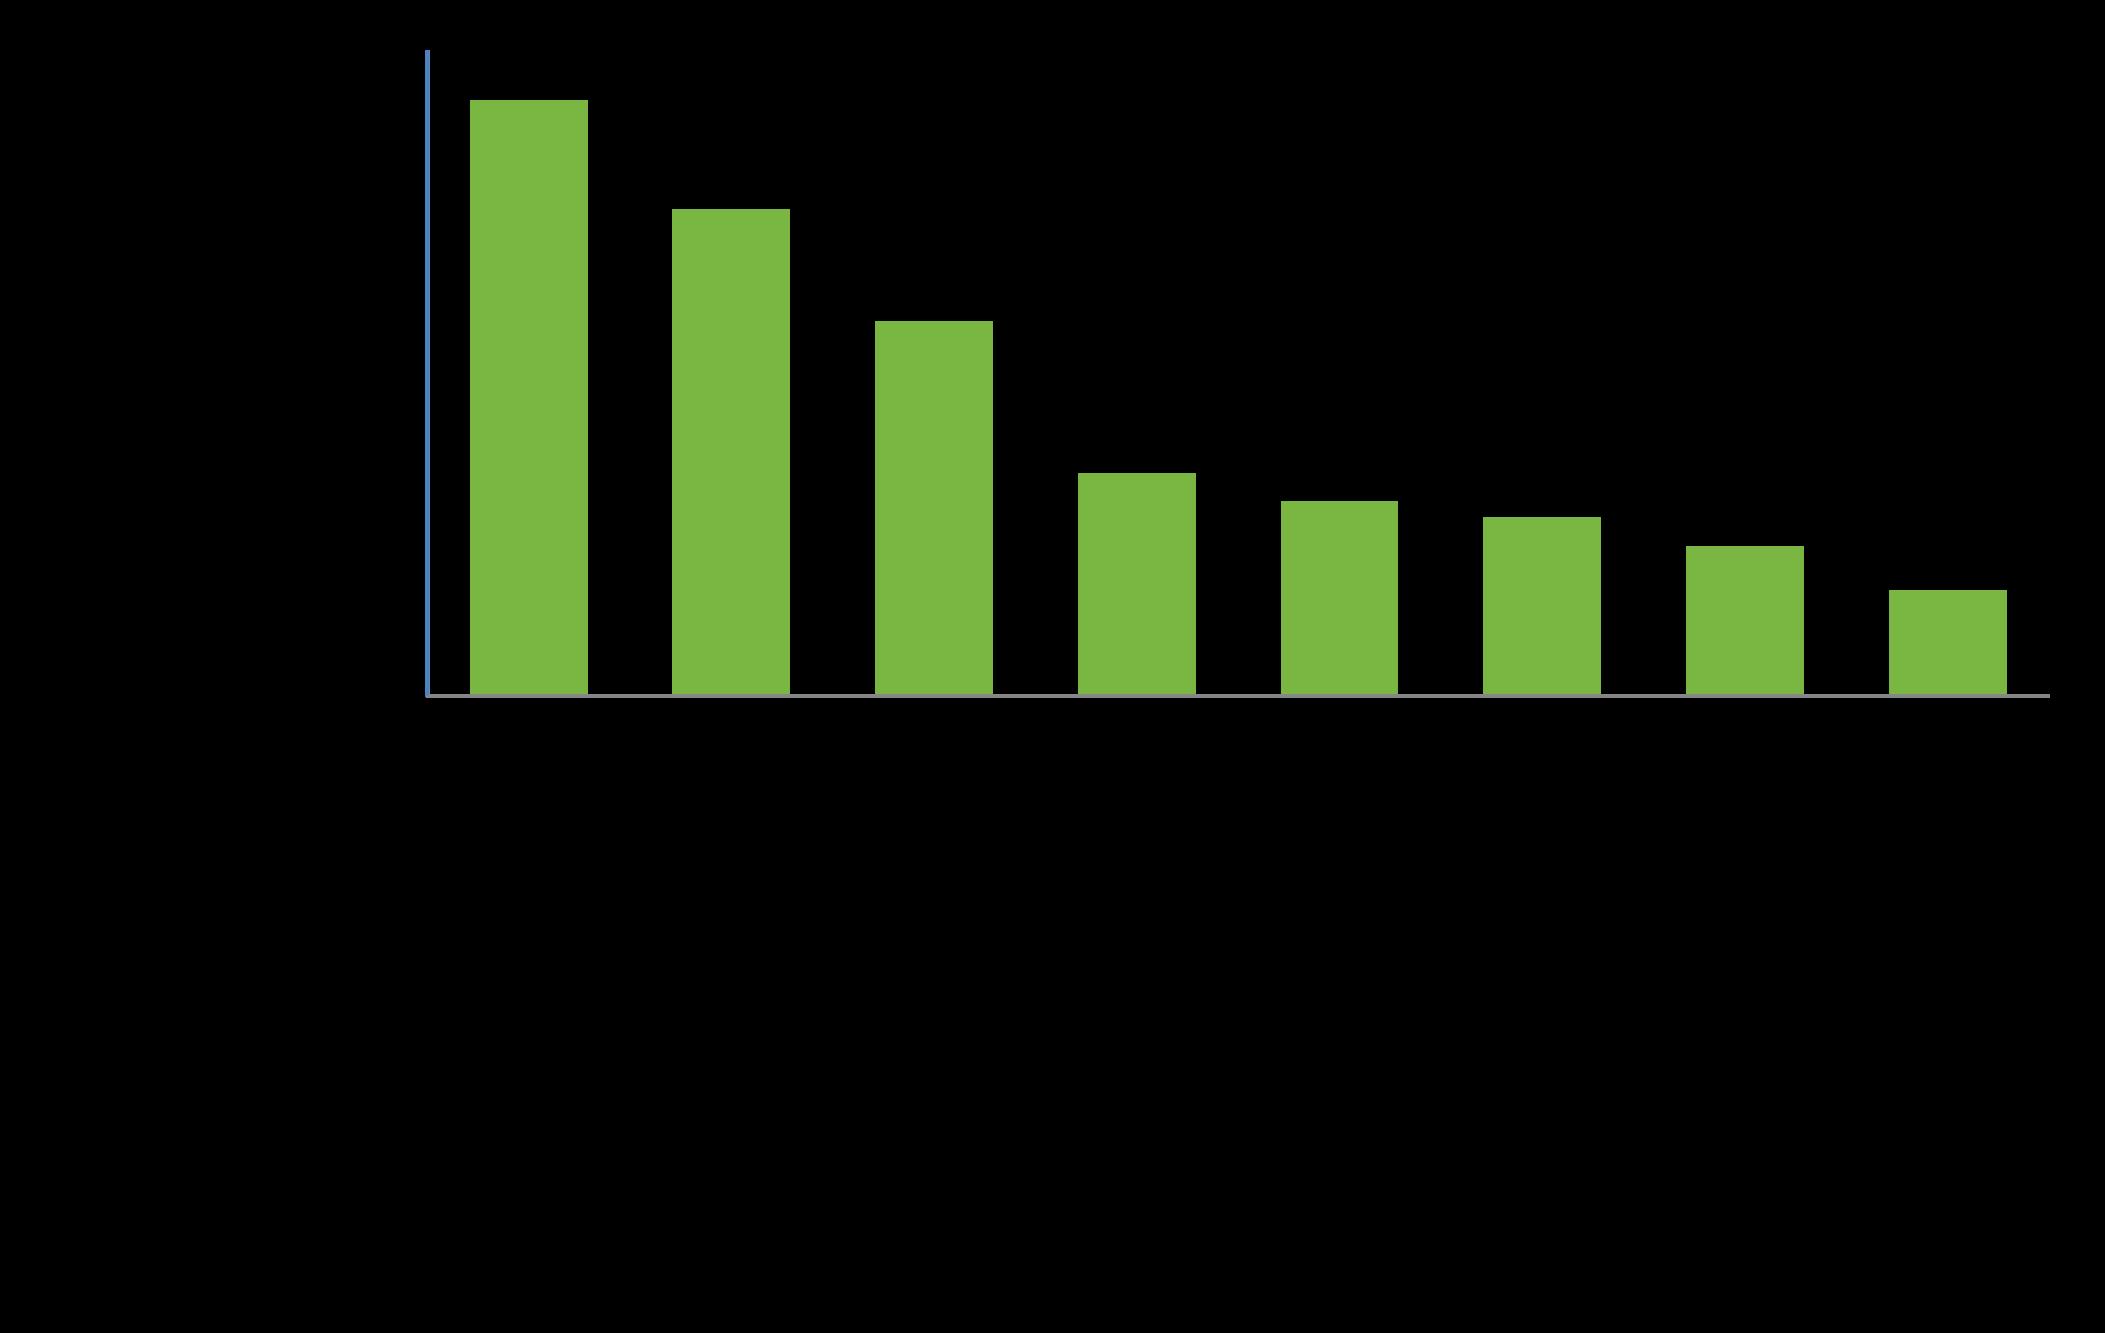
What are your housing goals for the next 3 to 5 years?
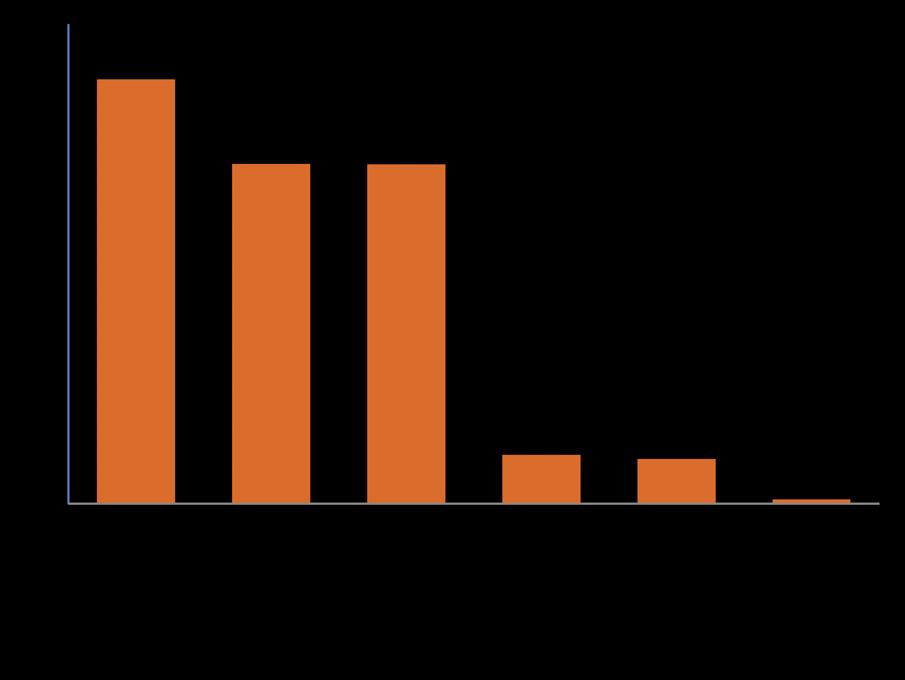
Branching Question:
This answer a respondent chose for this question would determine the next question the respondent would be asked. Questions 14 through 17 are sequenced so that a respondent would have only answered one of the questions based on their answer to Question 13.
Answer Choices:
• I would like to stay in my current home as it is
• I would like to stay in my current home, but make significant improvements and/or additions
• I would like to buy, and move to, a different home
• I would like to rent, and move to, a different home
• If unhoused, I want to find a stable housing option
• Other (please specify)
You indicated that in the next 3 to 5 years, you would like to stay in your current home, but make significant improvements and/or additions. What types of improvements and/or additions are you hoping to make?
(Select all that apply.)
Branching Question:
Only the 28 percent of respondents who indicated “I would like to stay in my current home, but make significant improvements and/or additions” were displayed this question.
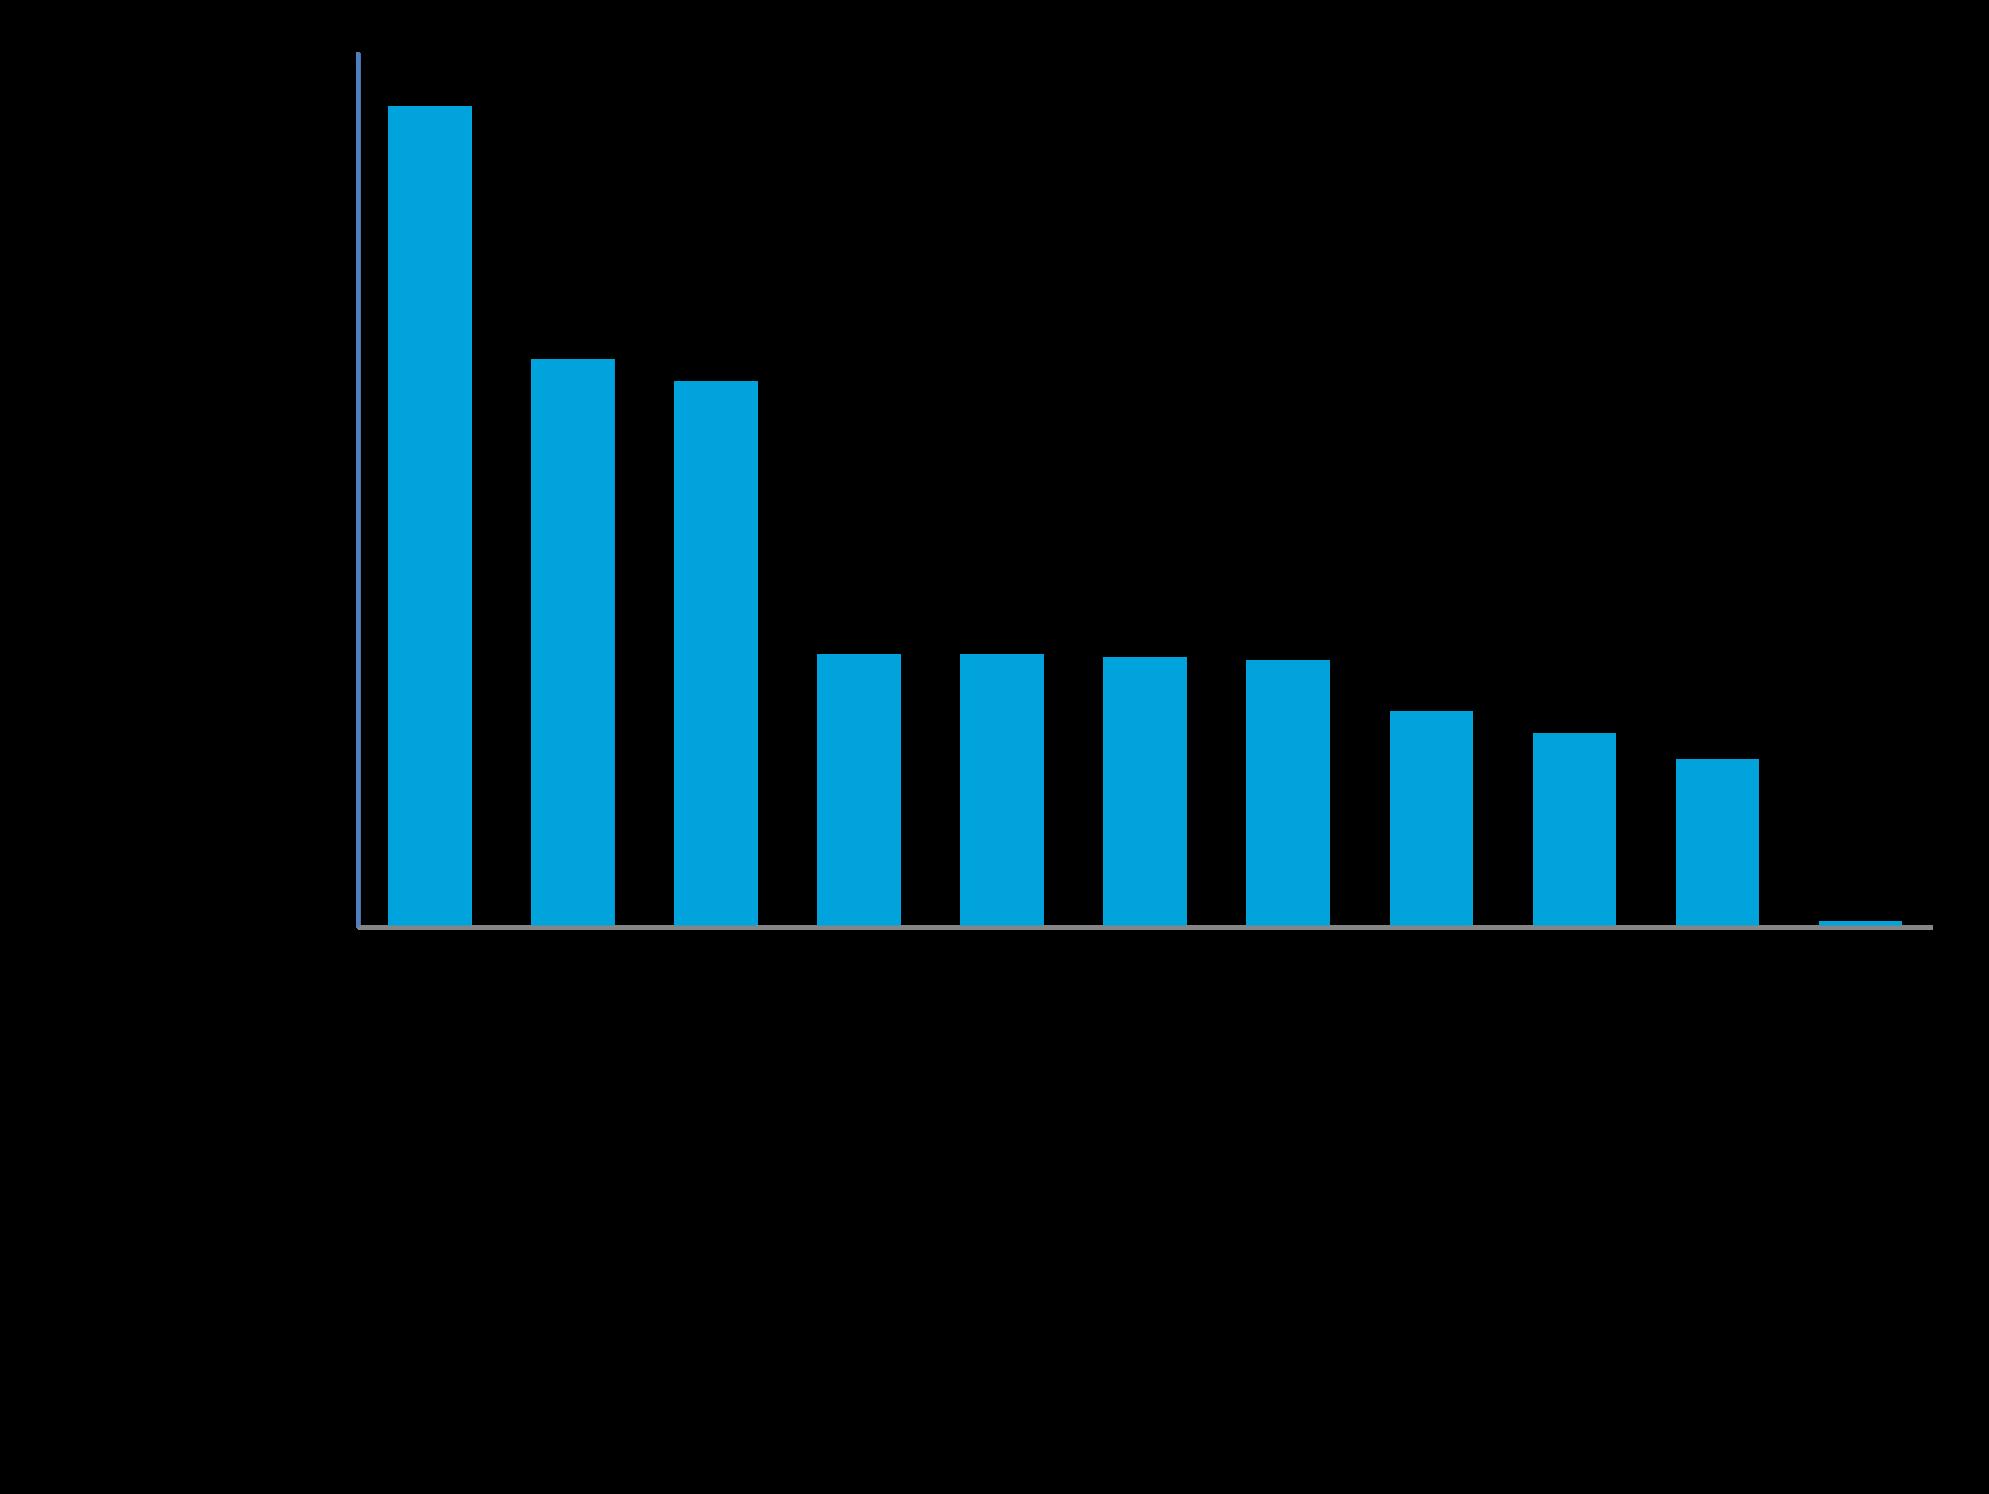
Answer Choices:
• Bathroom upgrade/remodel
• Addition of more indoor space (e.g., another room or bathroom)
• Finish basement
• Add deck or patio
• New windows and/or doors
• New roof
• New exterior siding
• Major landscaping and/or concrete work
• Major plumbing or electrical upgrade
• Add energy generation options (e.g., solar panels)
• Other (please specify)
You indicated that in the next 3 to 5 years, you would like to buy and move to a different home. Which of the following are important for you to have with your new home? (Select all that apply.)
Branching Question:
Only the 28 percent of respondents who indicated “I would like to buy, and move to, a different home” were displayed this question.

Answer Choices:
• I need a bigger home / more space
• I need a smaller home (I want to downsize)
• I want more land
• I want less land
• I want to be located in a better school district
• I want to lower my monthly expenses
• I want to be closer to high-quality employment opportunities
• I want more peace and quiet (i.e., away from city life)
• I want to be closer to interesting things to do / more active district(s)
• I want more varied transportation options, like walking, biking, transit, etc. (i.e., I want to rely on my car less)
• Other (please specify)
You indicated that in the next 3 to 5 years, you would like to rent and move to a different home. Which of the following are important for you to have with your new home? (Select all that apply.)
Branching Question:
Only the 4 percent of respondents who indicated “I would like to rent, and move to, a different home,” were displayed this question.

Answer Choices:
• I need a bigger home / more space
• I need a smaller home (I want to downsize)
• I want more land
• I want less land
• I want to be located in a better school district
• I want to lower my monthly expenses
• I want to be closer to high-quality employment opportunities
• I want more peace and quiet (i.e., away from city life)
• I want to be closer to interesting things to do / more active district(s)
• I want more varied transportation options, like walking, biking, transit, etc. (i.e., I want to rely on my car less)
• Other (please specify)
You indicated that in the next 3 to 5 years, you want to find a stable housing option. What will you need in order to accomplish that goal? (Select all that apply.)
Branching Question:
Only the 0.3 percent of respondents who indicated “If unhoused, I want to find a stable housing option” were displayed this question.
Answer Choices:
• An apartment unit with rental assistance
• Funds for downpayment
• Funds for closing costs

• Utility deposit
• Security deposit funds
• Better paying job
• Housing in better condition at the same price
• Larger home in same price range
• Repairs to my existing unit/home
• Other (please specify)
Which amenities/services are most important to have near your home? (Select all that apply.)
Answer Choices:
• Daycare
• Quality schools
• Library
• Transit access
• Sidewalks
• Access to healthcare
• Nice park and trees/green space
• Essential retail and services, like grocery stores, pharmacies, and banks

• Other retail and services, like entertainment, dining, and recreational options
• My workplace
• Other (please specify)
• None of the above
What would you most like to see in Edmond’s housing market?
Options:
• Different home styles/designs (e.g., townhomes, small multifamily homes, singlefamily homes with different design options)
• More accessible options for financing home improvements
• Homes built more quickly and efficiently
• New financing options for home purchase
• More housing that is accessible for people with physical limitations or disabilities
• Housing options (for-sale or rental) at price points that are not currently available
• Other (please specify)
Respondents were able to rate each of these options on a 5-point Likert Scale ranging from Not At All Important (1) to Most Important (5).
Results displayed show the overall weighted average of the responses selected.

How much would you be comfortable spending on a home you would rent? (Select all that apply.)

Answer Choices:
• Less than $100,000
• $100,000 to $149,999
• $150,000 to $199,999
• $200,000 to $249,999
• $250,000 to $299,999
• $300,000 to $349,999
• $350,000 to $399,999
• $400,000 to $449,999
• $450,000 to $499,999
• $500,000 or more
• Not sure
How much would you be comfortable spending on a home you would own? (Select all that apply.)

Answer Choices:
• No mortgage/rent
• Less than $400
• $400 to $499
• $500 to $599
• $600 to $699
• $700 to $799
• $800 to $899
• $900 to $999
• $1,000 to $1,250
• $1,250 to $1,499
• $1,500 to $1,999
• $2,000 to $2,499
• $2,500 or more
• Not sure
What is your current employment status? (Select all that apply.)
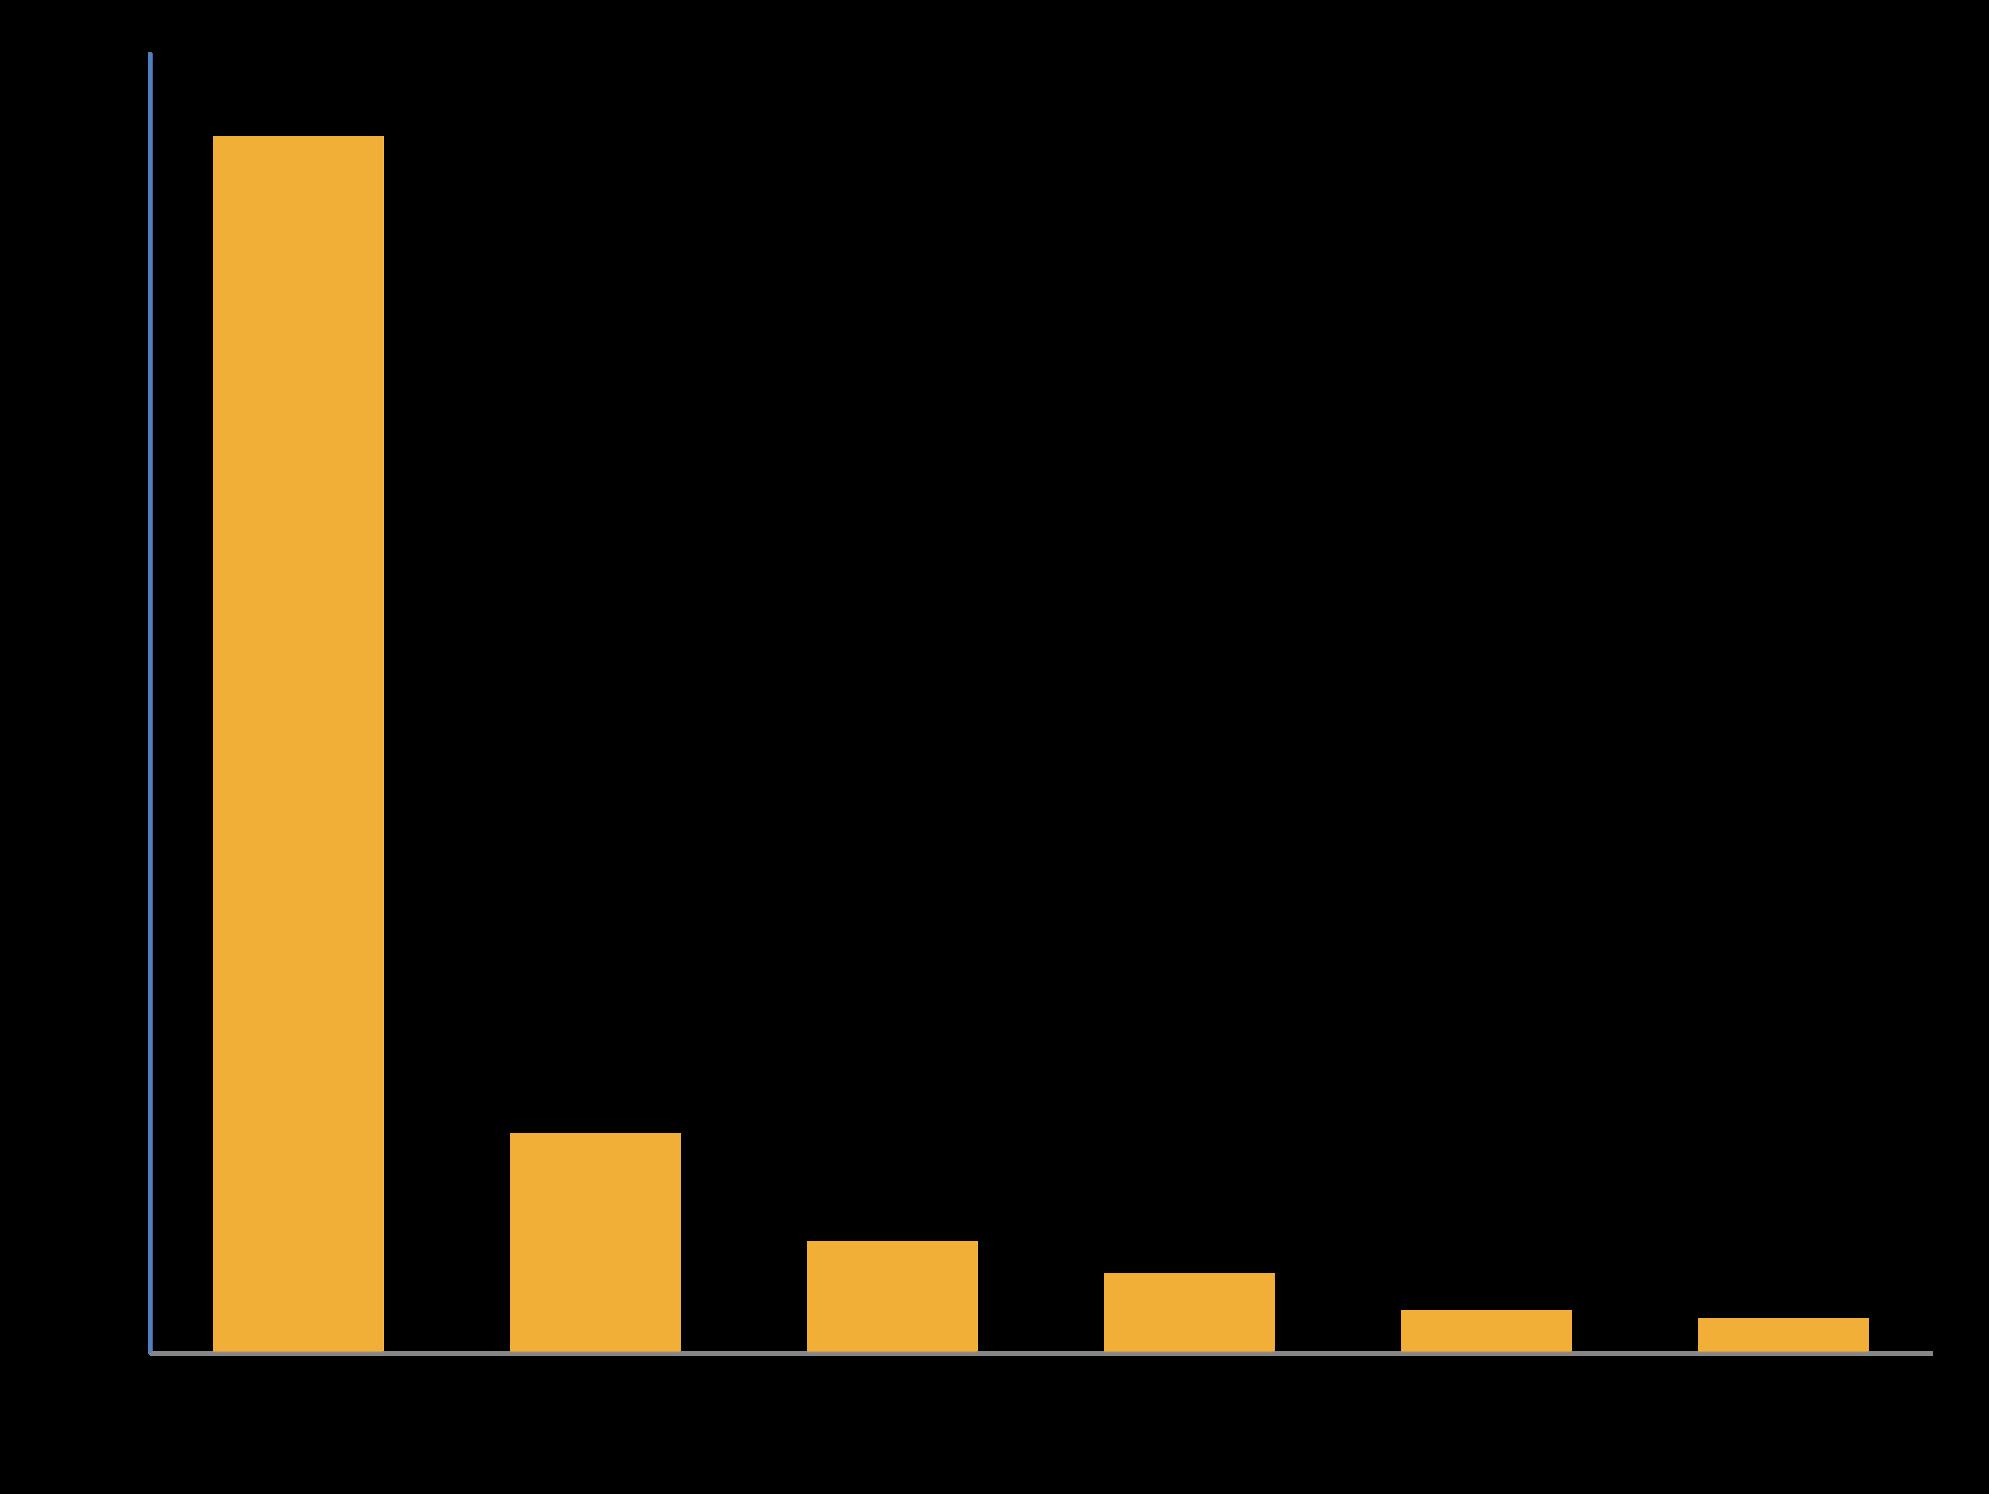
Answer Choices:
• Student
• Employed, full-time
• Employed, part-time
• Unemployed
• Retired
• Other (please specify)
If you are currently employed or a student, do you work or attend school in Edmond?

Answer Choices:
• Yes
• No
• Unsure
• I am not currently employed or a student
What is your average commute time to work or school?
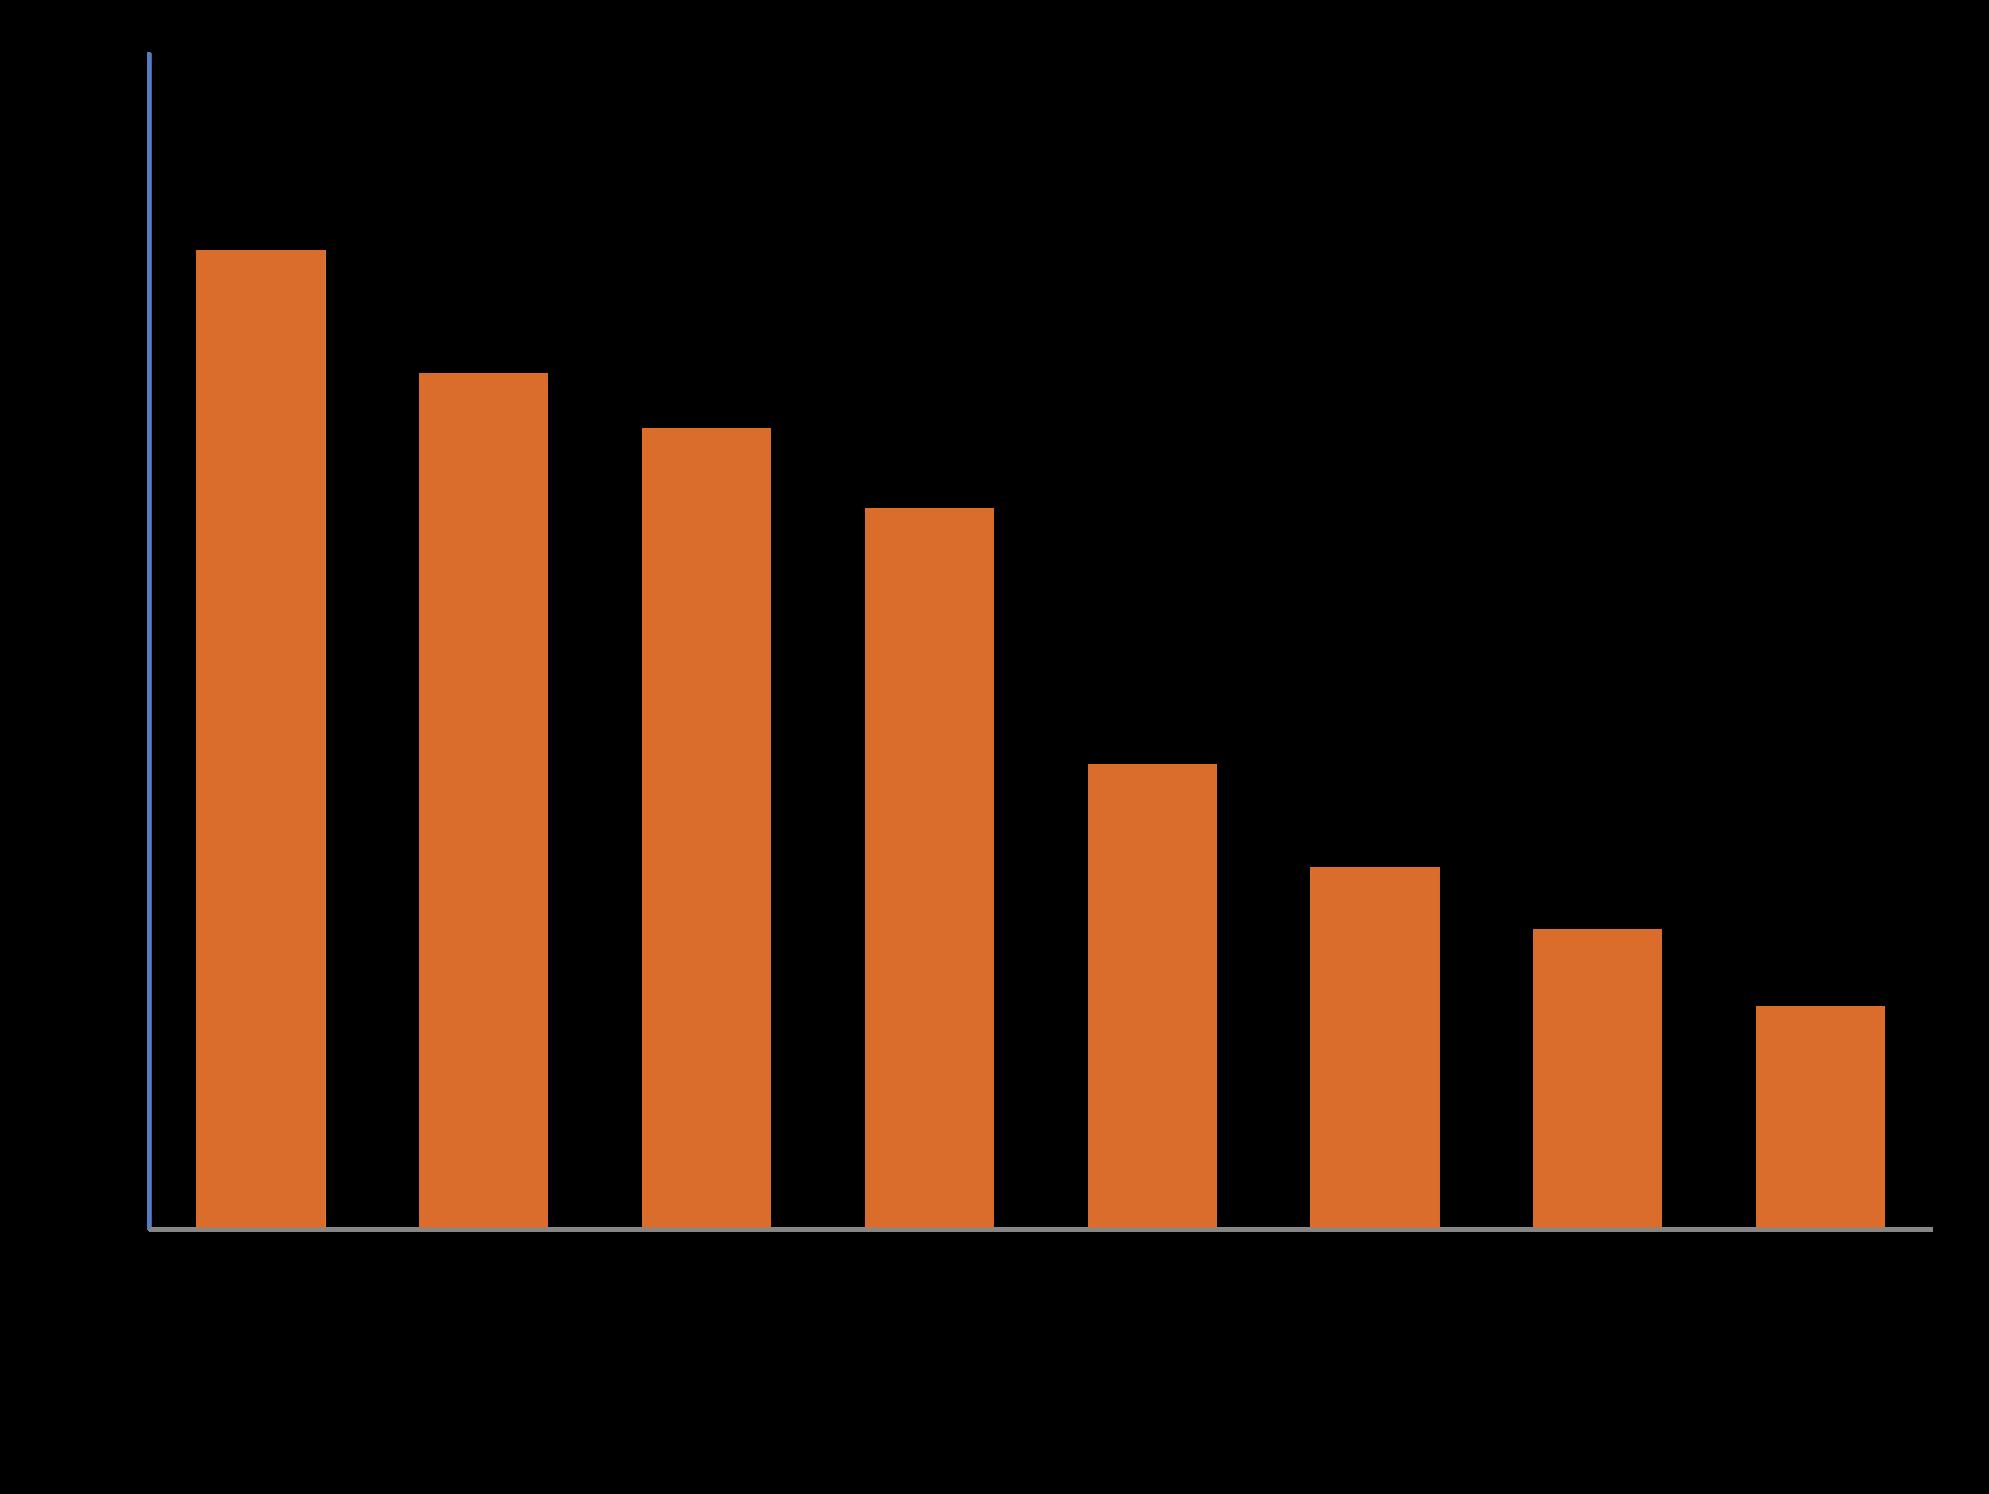
Answer Choices:
• Less than 5 minutes
• 5-10 minutes
• 10-15 minutes
• 15-20 minutes
• 20-25 minutes
• 25-30 minutes
• 30 minutes or more
• I do not have a commute outside of the home
Do you have easy and continuous access to an operable car?
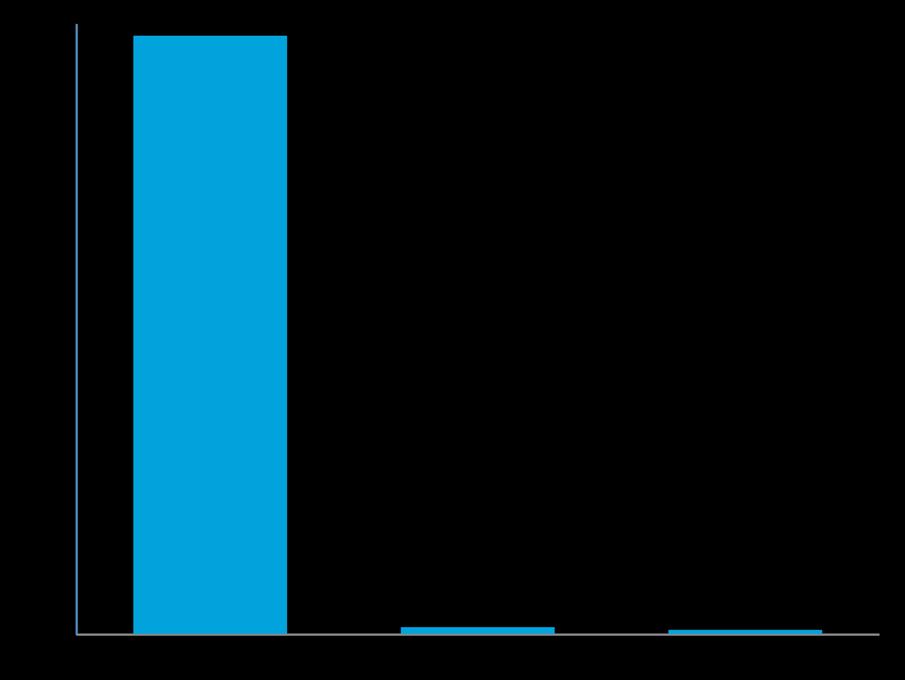
Answer Choices:
• Yes
• No
• Other (please specify)
How many people live in your household (including yourself)?

Answer Choices:
• One (1)
• Two (2)
• Three (3)
• Four (4)
• Five (5)
• Six or more (6+)
The Housing Assessment used two public surveys to complement other community engagement and research. This section summarizes key findings from the Housing Preferences Survey.
The survey allowed respondents to react to and rate a variety of visual housing type examples. These included single-family homes, missing middle housing types, multifamily options, and others. Additionally, the survey sought to understand what housing features and design elements are and are not acceptable to Edmond residents.
The survey included 10 questions organized into two sections.
This section asked respondents to rate different housing types, what design elements they would find acceptable to create more housing price points in Edmond, and what types of housing they would like to see more of in the community.
This section asked respondents to share their personal and demographic information. All questions were optional:
• Age range
• Racial/ethnic identity
• Household income
• Housing tenure
The survey was made available in English and was administered through the web-based survey platform SurveyMonkey.
The survey was promoted through the City’s social media channels and website, a press release for local media, and Steering Committee members and other local stakeholders.
Overall, 480 people participated in the survey, While survey respondents were not perfectly representative of the City of Edmond, the responses to the survey provided a more well-rounded understanding of local housing preferences.
The following tables provide the demographic information about the survey respondents compared to the City of Edmond.
Please rate each housing type using the scale shown below.
Answer Options:
Respondents were shown the images and asked to rate each of these options on a 5-point Likert Scale:
1. I strongly dislike it
2. I dislike it
3. I feel neutral about it
4. I like it
5. I like it a lot
Results displayed on the following page show the overall weighted average of the respondents.
8,000Single-familyhomeonamediumlot,squarefeetto1/2acreSingle-familyhomeonalargelot, morethan1/2acre
Mixed-use(e.g.,residentialaboveretail)
ADUdetachedfrommainstructurelessSingle-familyhomeonasmalllot, than8,000squarefeet


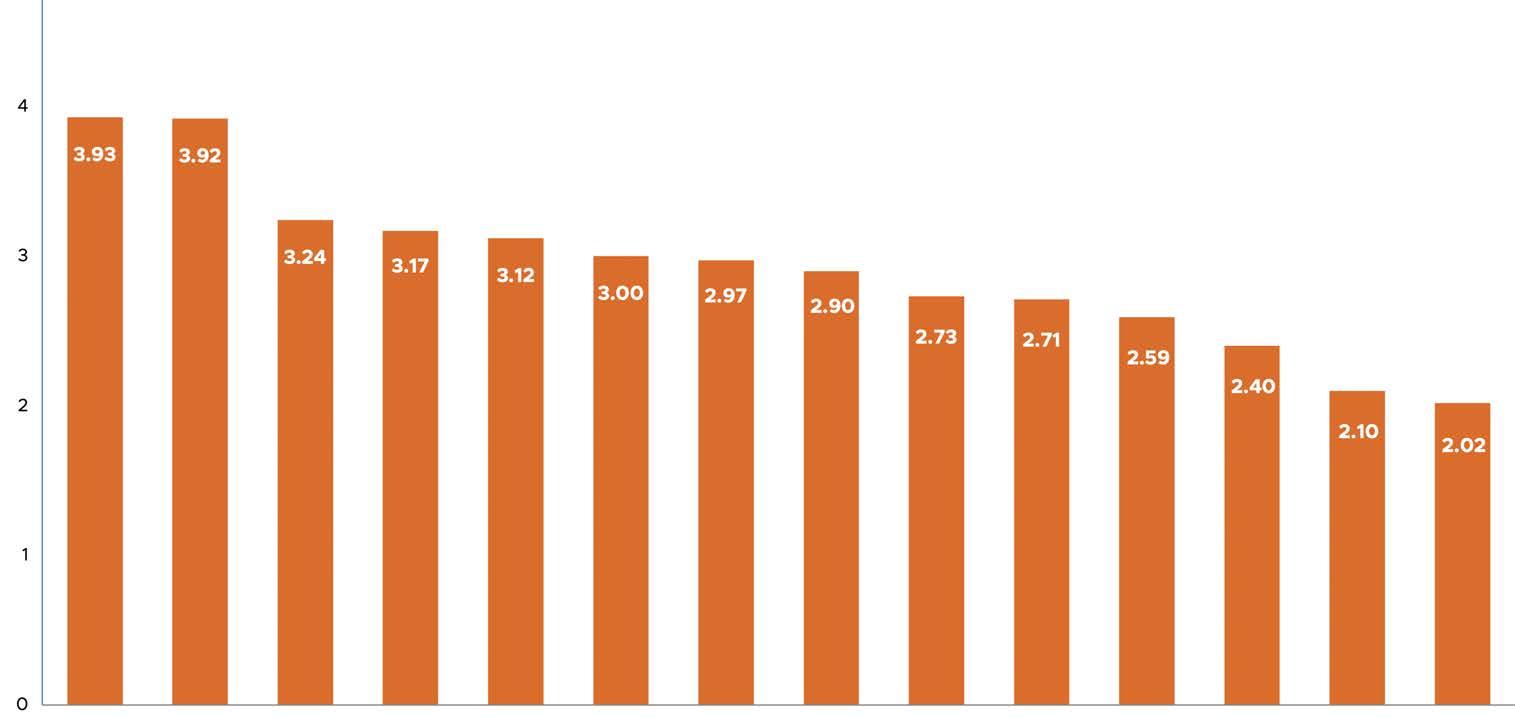
ADUabovedetachedgarageCottage/tinyhomesTownhouse/rowhouse

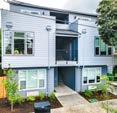
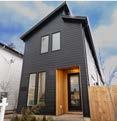


thanSmallapartmentbuilding(less 6homes)
Mediumapartmentbuilding(6-17homes)
co-opCo-housing,sharedhousing,or housing (18Largeapartmentbuilding ormorehomes)Mobile/manufactured
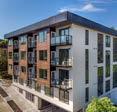
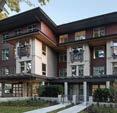
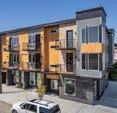
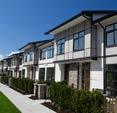
We heard through stakeholder conversations and the feedback from the housing needs survey that a wider variety of price points of housing are needed in Edmond. One way this can be accomplished is through housing design, specifically related to the size of homes, features, and other aspects. Which of the following design elements would you accept to have more home price options? (Select all that apply.)
Answer Choices:
• A smaller home (i.e., less square footage) with the same number of bedrooms
• A smaller garage (e.g., space for one car rather than three cars)

• A carport instead of a garage
• A smaller lot/yard
• Attached homes (e.g., duplex, triplex, quadplex, condominium, etc.)
• One less bedroom
• One less half bath or full bath
• Less expensive finishes
• Home positioned closer to the street (I.e. less front yard and driveway)
• Factory-built home
What types of new housing would you like to see in the community? (Select all that apply.)
Answer Choices:
• Single-family home on a lot smaller than 8,000 sq. ft.
• Single-family home on a lot between 8,000 sq. ft. and 1/2 acre
• Single-family home on a lot larger than 1/2 acre
• Duplex
• Townhouse/row house
• Small apartment building (fewer than 6 homes)
• Medium apartment building (6 to 17 homes)
• Larger apartment building (18 homes or more per building)
• Co-housing, shared housing, group housing, or co-op housing
• Cottage/tiny homes
• Mixed-use (e.g., with residential above commercial/retail)

• Accessory Dwelling Units
• Mobile/manufactured homes
• Other (please specify)
The Housing Assessment used public pop-up events to complement the surveys and other research. This section summarizes what was learned from residents who participated in two popup events held in April 2023.
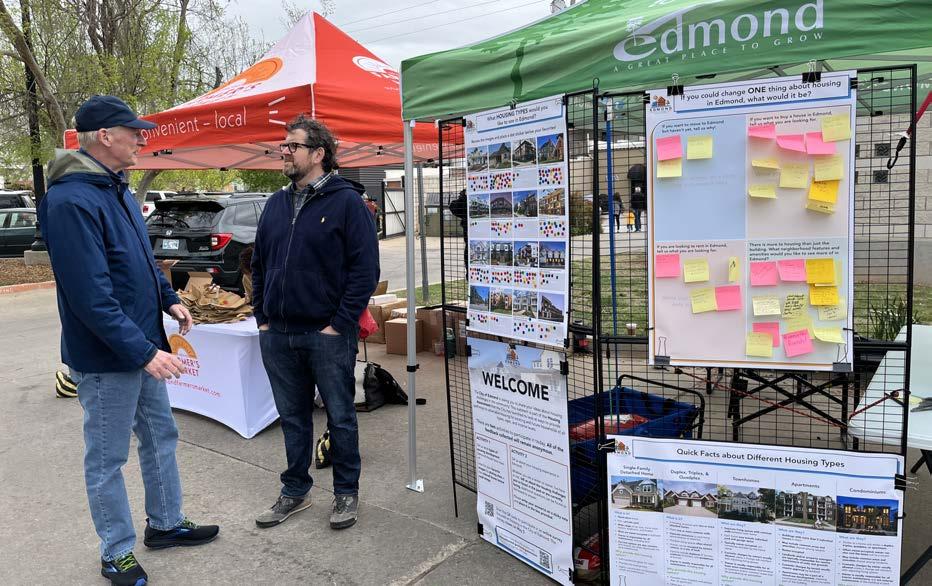
Pop-up events were held to share what had been learned over the course of the housing assessment so far, answer questions about the process, and to encourage people to engage with questions around housing preferences in Edmond.
Two pop-up events occurred on April 15, 2023 at the Edmond Farmer’s Market and Heard on the Hurd, a monthly street and music festival held in downtown Edmond between March and October.
At the pop-up events, the project team displayed two boards: a Housing Preference image board that asked,“What housing types would you like to see in Edmond?”, and a Post-It note board that asked, “If you could change ONE thing about housing in Edmond, what would it be?”
The project team had an opportunity to meet and talk with many Edmond community members from all walks of life. Some shared what they love about living in Edmond; others shared their frustrations; many shared both along with their hopes for the future.
At the pop-up events, the team displayed boards with pictures of 16 housing type options and asked participants to vote for their favorite housing types using dot stickers. The results are displayed on the following page at right.
The top housing preference was a single-family detached home in an established neighborhood, with 51 votes or over 11 percent of all votes. This was followed by single-family detached housing in urban infill style (9.6 percent), low-rise mixed use housing in the town center (8.7 percent), and single-family attached housing (8.2 percent).
The least popular housing preferences were lowrise multifamily apartments off the highway (1.6 percent), low-rise multifamily apartments in a suburban area (2 percent), single-family detached housing on a small urban infill lot (3 percent), and low-rise multifamily apartments within an urban neighborhood (3 percent).

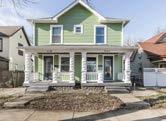

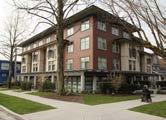

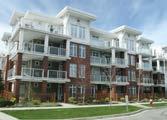


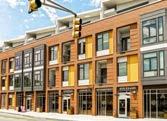
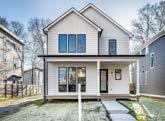
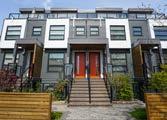
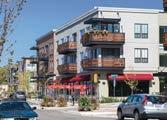
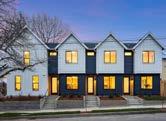
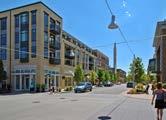


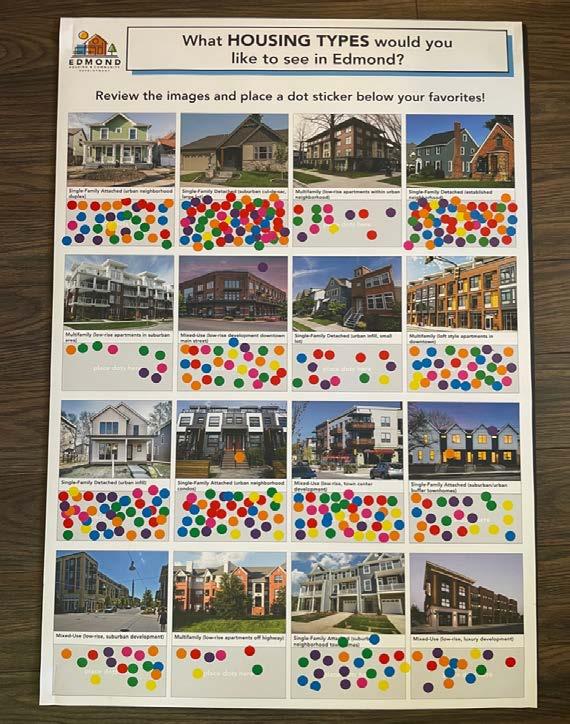

The Post-It note board asked participants to engage with a broad question: “If you could change ONE thing about housing in Edmond, what would it be?”
Underneath the broad question, four quadrants asked more targeted questions based on the individual participant’s housing situation and desires:
• If you want to move to Edmond but haven’t yet, tell us why!
• If you want to buy a house in Edmond, tell us what you are looking for.
• If you are looking to rent in Edmond, tell us what you are looking for.
• There is more to housing than just the building. What neighborhood features and amenities would you like to see more of in Edmond?
Participants were able to use sticky notes to write and place their answers under the corresponding question. Team members also used sticky notes to summarize verbal conversations they had with community members who stopped by the popup booths. The results from this activity at the Farmer’s Market pop-up event are displayed on the right. All responses from each question can be viewed on the following pages.
 Image of the Sticky Note Housing Question Board at a pop-up event
If you want to move to Edmond, but haven’t yet, tell us why!
Housing everyone can afford
Higher utility costs.
Need affordable housing. Too expensive.
“I don’t care what it looks like – I just want to be able to afford it.”
Moving back to Arizona – weather is too extreme in the Plains States
Affordable apartments for students.
If you are looking to rent in Edmond, tell us what you are looking for.
We need them to be affordable. More parks. (+1)*
Apartments people can afford – currently $1,100 for a 1 bedroom. Affordability (+1)*
More accessible housing – for people outside college ages –pushes other people out.
Current affordable apartments are old/ drafty.
Apartment living for seniors (+1)
More apartment communities that aren’t directed at students.
No more negative attitudes and characterizations of people who rent.
*“+ [number]” indicates that one or more additional participants expressed similar sentiments.
If you want to buy a house in Edmond, tell us what you are looking for.
Building materials and inspections are a challenge for developers.
Single-family, singlestory duplex (buy + rent).
Can’t afford to live here.
Housing for seniors –especially full-service
Houses with yards
More affordable! (+3)
Affordable housing approximately $150k-$175k; singlefamily detached with yard; varying types of architecture, less cookie cutter houses.
Support for the homeless.
Affordable single family.
Tiny house community, 55+, affordable, in rural setting, with shared amenities.
Tiny home community.
One story condos for seniors with no straight through traffic – cul-de-sac.
Lots with more land like 1 acre.
If you want to buy a house in Edmond, tell us what you are looking for.
Traffic flow needs to be improved.
Already crowded.
I would like more investment opportunities; perhaps smaller investment groups; more businesses/restaurants co-mingled with residential – like old Chicago neighborhoods.
More public transportation (+1) More bike lanes. Tiny home community.
Housing close to transit (or transit more often/more accessible).
164th and Fenwicle Blvd –need a stoplight
Love the parks
Denser in the downtown area Reno what you can, replace some.
Sidewalks in East Edmond.
Too expensive [unknown] 70’, want to buy; can’t; teacher.
Location is EVERYTHING. Different types in different places.
Public pool.
The parking structure and apartment buildings are distracting from the small town, railroad historic town vibe I loved when I moved here.
Bigger parks; more greenery; sense of community where you can be on a first name basis with your neighbors; more lighting; a range of size lots for tiny home owners; ability to grow crops and be selfsufficient.
What about smaller lots with single family homes – with casitas – think elderly parents.
Remove the racists!
*“+ [number]” indicates that one or more additional participants expressed similar sentiments.

Social media engagement is an effective tool for starting a conversation and sharing information.
Along with meetings, the Edmond Housing Assessment process had a project website (housed within the City of Edmond’s website) and extensive social media marketing strategy. These tools allowed the City to advertise the study, post information about upcoming meetings, push out surveys to the community, and share findings that came from the study.
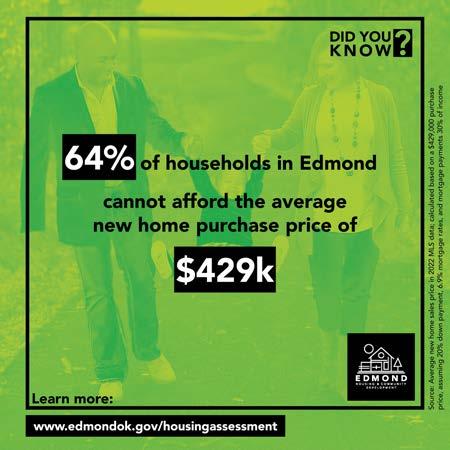
The infographics featured at right are selected from a larger series of posts that highlighted findings from the assessment’s market study and results from the Housing Needs Survey. The infographics were shared to the City’s website, Twitter, Instagram, and Facebook over the course of the project.
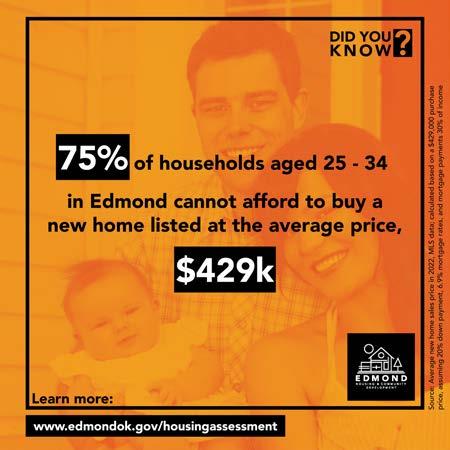
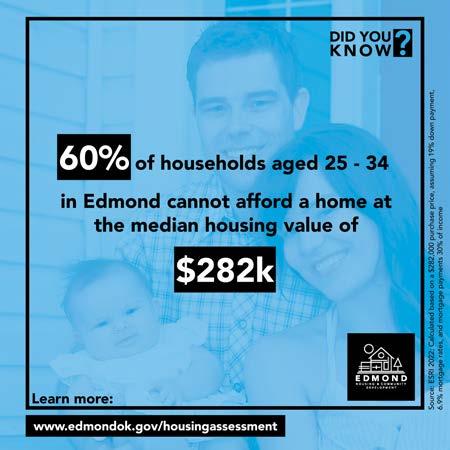
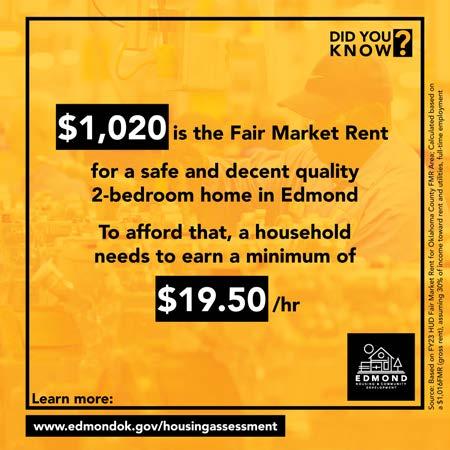
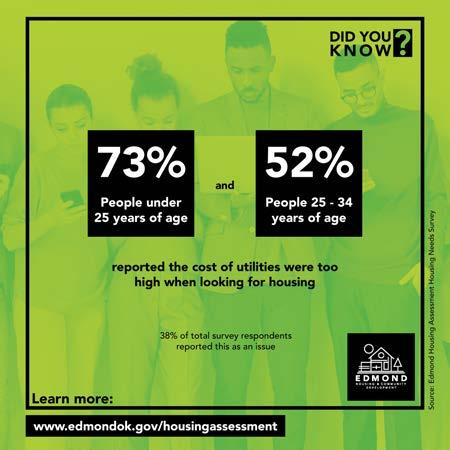
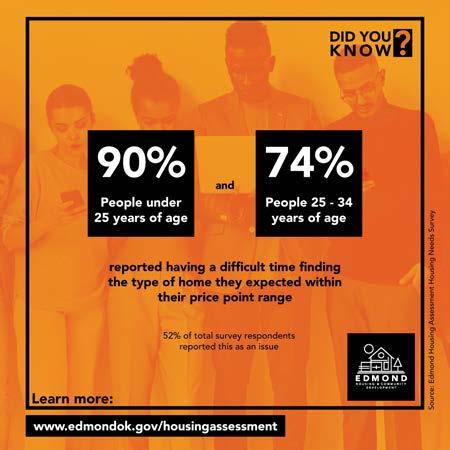
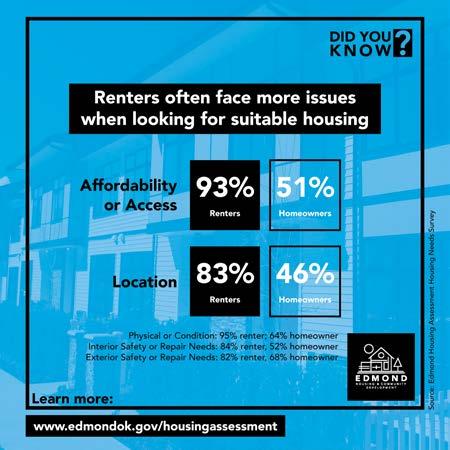
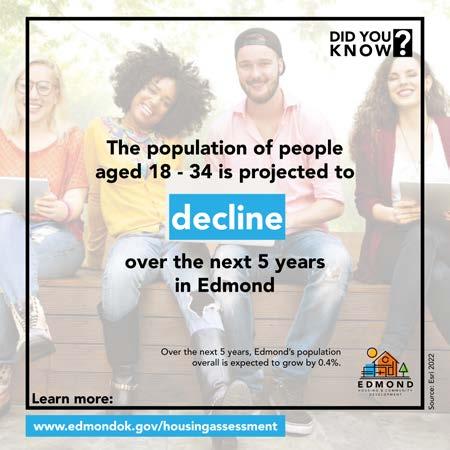
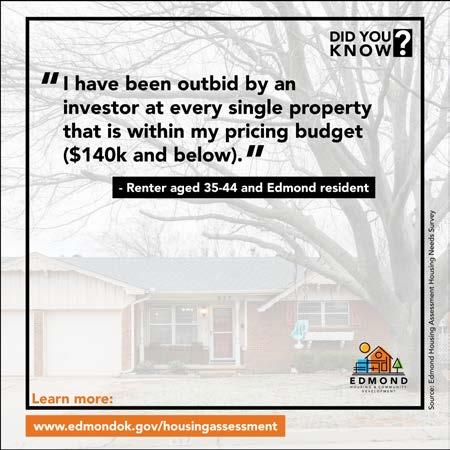
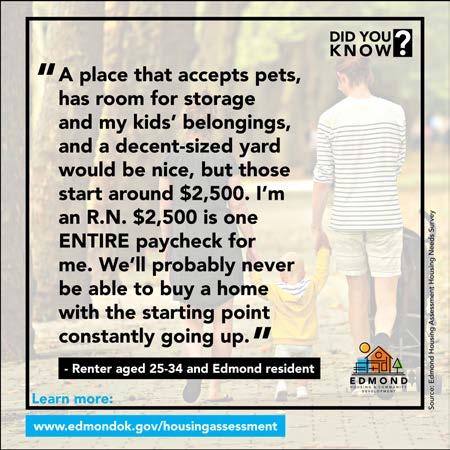
A continuation from the implementation matrix found in Chapter 5, this portion of the matrix will provide additional information that shows what housing the tactics will target based on the age of the structure, and what goals the tactic will help address.
1.1 Use funding tools, such as TIF or impact fees, to help pay for infrastructure improvements that support affordable and workforce housing development
1.2 Leverage City-owned assets to support affordable, workforce, mixedincome, and mixed-use development
1.3 Work with other City departments to reduce time required for the development review and approval process for housing that meets goals
1.4 Update zoning code to allow more housing types-by-right, incorporate other incentives and inclusionary zoning/affordability set-asides, and include flexible design standards
1.5 Work with partners to expand homeownership supports like down payment assistance/loan programs, credit counseling, and homebuyer/ homeowner training
2.1 Create a “look book” of housing typologies and share type-specific resources
2.2 Keep track of housing trends based on type, demographic markets, renter vs. ownership patterns, foreclosures/ vacancies, and available lots for development/ redevelopment
2.3 Work with architects and builders/ developers to create pre-approved plans for new housing types
2.4 Market development opportunities to the local, regional, and national development community using results of this study
2.5 Evaluate and revise building codes related to certain requirements, such as fire sprinklers, while maintaining the safety of the units p p p
2.6 Expand Edmond’s ability to secure additional federal resources and participate in the real estate market p p p
STRATEGY 3: Facilitate the improvement of older housing stock condition while preserving affordability
3.1 Expand Edmond Builds to include exploration of protections for existing residents in neighborhoods targeted for revitalization p p p
3.2 Continue to support homeowner renovations and weatherization through Edmond’s Owner-Occupied Housing Rehabilitation (OOHR) program
p p
3.3 Adopt a more proactive approach to code enforcement of problem properties p p
3.4 Create and fund new housing programs to encourage reinvestment in older rental properties while maintaining attainable rents
3.5 Work with partners and other governmental staff to explore creating a tax abatement program
STRATEGY 4: Support employers, economy, and workers through workforce housing
4.1 Map/update employment concentrations and housing options within a 15-minute drive to show mismatch between what’s available and what the growing workforce needs
4.2 Identify key development sites within employment shed(s) for workforceattainable housing
4.3 Support the creation and funding of a workforce housing program to facilitate development of moderatelypriced for-sale and rental housing
4.4 Advocate for state and federal workforce housing programs
1 Explore how development costs are impacted by expenditures related to city infrastructure
2 Regularly update local research on housing topics, such as multifamily impacts on property value, crime trends, etc.
3 Include key housing research in staff reports on housing projects to keep the messaging consistent, including economic and fiscal impacts
4 Partner with area organizations and advocates to regularly publish housing-related trends to encourage broad support for diverse housing types and price points
5 Work with partners, area organizations, and advocates to create an education campaign about housing trends and its importance
6 Continue to address concepts of growth, land use, density, transportation, sustainability, and fiscal health through broader planning efforts

1 Redfin. (2023). 1200 Chain Bridge Ct, Edmond, OK 73034. Redfin. https://www.redfin.com/ OK/Edmond/1200-Chain-Bridge-Ct-73034/ home/78459018
2 Zillow. (2023). 1517 Mesa Trl, Edmond, OK 73025. Zillow. https://www.zillow.com/homedetails/1517Mesa-Trl-Edmond-OK-73025/22024647_zpid/
3 LoopNet. (2017). 3810 SE Division St, Portland, OR 97202. LoopNet; CoStar Group. https:// www.loopnet.com/Listing/3810-SE-Division-StPortland-OR/8020957/
4 Zillow. (2022). 1725 Ryan Way, Edmond, OK 73003. Zillow. https://www.zillow.com/ homedetails/1725-Ryan-Way-EdmondOK-73003/21932441_zpid/
5 Adobe Stock
6 Adobe Stock
7 Zillow. (2023). 12095 SE Oak St, Portland, OR 97216. Zillow. https://www.zillow.com/ homedetails/12095-SE-Oak-St-PortlandOR-97216/53975246_zpid/
8 Adobe Stock
9 Adobe Stock
10 Redfin. (2023). 7206 N Saint Louis Ave, Portland, OR 97203. Redfin. https://www. redfin.com/OR/Portland/7206-N-Saint-LouisAve-97203/home/26312676
11 LoopNet. (2022). 1515 N Simpson St, Portland, OR 97217 - Overlook Lofts | LoopNet.
LoopNet; CoStar Group. https://www.loopnet. com/Listing/1515-N-Simpson-St-PortlandOR/27691649/
12 CPA Development Consultants. (n.d.). Linden Tree Place - Vancouver, BC. CPA Development Consultants. Retrieved 2023, from https:// cpadevelopment.ca/portfolio-item/linden-treeplace/
13 Commercial Real Estate Exchange, Inc. (Crexi). (2023, April 5). 2615 S Water Ave, Portland, OR 97201. Crexi. https://www.crexi.com/ properties/1090387/oregon-acqua-apartments
14 Adobe Stock
