This year’s annual update to 10-Year Capital Plan (Capital Plan) details the City's planned infrastructure investment to support growth, improve services, and renew existing assets for the coming decade (2025 – 2034).
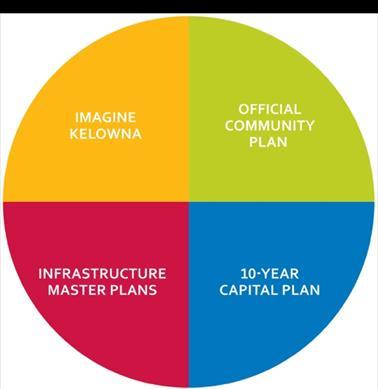
The City has many competing infrastructure demands, necessitating tough decisions to optimize spending, maximize community value, and balance wants versus needs. To guide these decisions, the City maintains a rigorous capital planning process that aligns with Council Priorities 2023-2026, Imagine Kelowna, the Official Community Plan and infrastructure master plans.
The Capital Plan projects a total expenditure of $2.57 billion over the next decade. 70% percent of this investment will enhance services and support growth in the community and 30% will maintain services and renew existing assets.
Guided by Council and Corporate Priorities, capital investment will focus on the following:
• Maintaining direction set by Council in last year’s Capital Plan,
• Accelerating transportation & mobility infrastructure making it easier for people to get around by vehicle, transit, cycling and walking.
• Building community amenities like recreation and community centres to keep pace with Kelowna’s population growth and the evolving needs of its residents.
• Parks acquisition and development with big investment plans for recreation and waterfront parks
• Airport development.
• Reducing environmental footprint and future-proofing infrastructure to be more resilient in the face of changing climate
• Increased investment in stormwater infrastructure and flood protection
• Renewal of critical infrastructure.
There are several projects not in the Capital Plan for a variety of reasons These projects require additional planning and design before being prioritized, funded, and included in subsequent capital planning cycles
The City continues to deliver world-class infrastructure and services. Many capital projects continue to be completed; delivering on Council priorities and meeting the needs of the community.
$2.57 Billion To enhance & maintain public infrastructure services
TERRITORY ACKNOWLEDGEMENT
We acknowledge that our community is located on the traditional, ancestral, and unceded territory of the syilx/Okanagan people.
1 OVERVIEW
The 10-Year Capital Plan (the Capital Plan) is part of the City of Kelowna’s rigorous capital planning process. It aligns with Council priorities, Imagine Kelowna and the Official Community Plan and provides the framework for long-term planning and fiscal management. It is updated annually to respond to evolving community needs, maintain alignment with Council priorities and adapt to external factors like the pandemic, rapidly rising inflation, shortage of contractors and supply chain challenges.
The Capital Plan allows the City of Kelowna (the City) to look ahead and answer four fundamental questions:
• “What do we need?”
• “Why do we need it?”
• “How are we going to pay for it?”
• “How much will it cost to operate and maintain?”
Answering these questions allows the City to anticipate current and future cost pressures, stretch the limits of revenues by source, and make the necessary decisions to put in place essential infrastructure to support a future Kelowna. By doing so, this plan will help maximize infrastructure investment in the community where and when it is most needed.
CONSIDERATIONS
The Capital Plan contains infrastructure projects and programs for all 12 capital cost centres for the 10years from 2023-2032. Several documents have been used in its preparation. These include:
• Council priorities 2023 – 2026
• 10-Year Capital Plan 2023– 2032 (last year’s plan)
• 2040 Official Community Plan
• Imagine Kelowna
• 2040 Transportation Master Plan
• 20 – Year Servicing Plan & Financing Strategy
• Principles & Strategies for Financial Strength & Stability
• Infrastructure Master Plans and Asset Management Plans
• 2045 Airport Master Plan and Airport 10-Year Capital Plan
FOCUS AREAS
Guided by Council and Corporate Priorities, capital investment will focus on the following areas:
• Maintaining direction set by Council in last year’s Capital Plan
• Accelerating transportation & mobility infrastructure making it easier for people to get around by vehicle, transit, cycling and walking.
• Providing community amenities like recreation and community centres to keep pace with Kelowna’s population growth and the evolving needs of its residents.
• Parks acquisition and development with big investment plans for recreation and waterfront parks.
• Airport development.
• Reducing environmental footprint and future-proofing infrastructure to be more resilient in the face of changing climate.
• Increased investment in stormwater infrastructure and flood protection.
• Renewal of critical infrastructure.
INFLUENCING FACTORS & EMERGING ISSUES
Rapid Growth. Kelowna continues to be one of the fastest growing cities in Canada. It’s rapidly evolving, its economy is diversifying, neighbourhoods are changing, and people are choosing new ways to move around. By 2040, Kelowna is expected to be home to another 50,000 people. This transition is exciting, bringing new energy, amenities, employment, and educational opportunities. Signs indicate this pace will continue.
Rapid growth puts pressure on the capital program as demands increase for more infrastructure to support growth. That is why this Capital Plan focuses 70% of the investment in enhancing infrastructure that will increase or improve service levels
Renewal of Aging Assets. In this era of rapid growth and change, there are complex choices to be made. The City must find a balance between funding to support growth and improve services and funding to support renewal of existing infrastructure to maintain services. These choices are rarely easy and often involve making difficult trade-offs.
The City has a robust asset management program that tracks the age and condition of City owned assets (i.e. civic buildings, roads, bridges, sewer, water infrastructure, etc.). Some of these assets are nearing the end of their service life and will need to be renewed to maintain service levels. The City will invest 30% of the Capital Plan in infrastructure to maintain service levels. This will need to increase in the future as assets age and their condition deteriorates.
Inflation & Borrowing Costs There are many factors influencing the Capital Plan that are beyond the City’s control. These include labour shortages, supply chain challenges, inflation, and higher interest rates Infrastructure construction costs and interest rates have increased significantly in the past few years and this places pressure on the capital program. Inflation and interest rates are reducing, but time will tell if construction costs decrease.
WHAT WE ARE DOING
Listening to Council. Since this Council took office in 2022, more time has been dedicated to informing them about the process used to develop the Capital Plan and hearing from them about what is important to the community.
Alternative Funding through Partnerships, Grants & Advocacy. The City continues to pursue non-tax revenue, grants, partnerships, and advocacy to advance Council and corporate priorities. The City’s Intergovernmental Relations program focuses on advocacy through the strategic development of relationships with senior levels of government to advance investments and policy changes that supports Council’s priorities and City projects. Through advocacy, the City ensures priority infrastructure projects and program initiatives are consistently and proactively in front of provincial and federal ministers and their staff. As one of Canada’s fastest growing communities, advocacy work includes positioning Kelowna as a leading municipality and a strong partner for senior governments to invest in.
The City’s Partnerships Program is centered on building relationships and forming partnerships with a diverse array of external organizations, including businesses, non-profits, government agencies, and academic institutions. While each partnership is unique, they generally fall into one or more of the following categories: providing community facilities, programs, and services; operating and maintaining City-owned assets; and administering City funding. Through these collaborations, the City aims to enhance the quality of life for its residents and more effectively address community needs.
Planning for the Future. The Capital Plan is supported by a foundation of good planning, including:
Official Community Plan (OCP) The 2040 OCP optimizes infrastructure investment through more compact development where services can be more efficiently used by a greater percentage of the community population.
Transportation Master Plan (TMP). The 2040 TMP works with the OCP to support growth, and help residents make more efficient and sustainable transportation choices through the development of reliable transit, improved road connections, comfortable bicycle routes and walkable neighbourhoods.
Parks Master Plan (in-progress). This Master Plan will establish priorities between five park types: city-wide, recreation, community, neighbourhood and linear. As well as identify needs of different stakeholder groups and create a plan for future park development and renewal moving forward.
Strategic Facilities Master Plan (in-progress). This Master Plan will create a vision and model to assess both infrastructure renewal and new construction to match growth, assess provision and distribution of built services and amenities across the City as well as prioritize needs between the different building types.
Asset Management & Data-Driven Decisions. The City owns and operates approximately $7.5 billion in infrastructure assets. Efficient operation and timely renewal are critical to continued service delivery and financial sustainability. The City has advanced its asset management program and is considered one of the leaders in BC. The implementation of a computerized asset management system (Cityworks) supports service-based budgeting through data-driven decisions and inform infrastructure planning, improve operational efficiency, and extend asset service life. Small improvements make a big financial impact when you own and operate $7.5 billion in infrastructure.
Infrastructure Standards. It is important that new infrastructure the City is building today is high quality, long lasting and state-of-art. That is why the City actively maintains its design and construction standards. The Subdivision, Development and Servicing Bylaw (Bylaw 7900) outlines these standards, and a dedicated working group continuously reviews and updates them in consultation with key stakeholders and the community.
2 FUNDED PROJECTS
INFRASTRUCTURE INVESTMENT
This Capital Plan forecasts $2.57 billion infrastructure investment to enhance and maintain service levels
Enhance comprises of infrastructure projects aimed at supporting growth and improving services. Maintain refers to the infrastructure needed to sustain current service levels through the renewal of existing assets.
Infrastructure required to enhance services accounts for 70% of total investment Investment of approximately 30% is allocated to maintain existing services.
COST CENTRE FORECAST
The Capital Plan forecasts $2.57 billion of capital investment across 12 cost centres.
• Transportation, Parks and Buildings cost centres account for 59% of overall investment to deliver on Council Priorities, invest in infrastructure renewal and meet community expectations.
• Water, Wastewater, Storm Drainage and Solid Waste is 21% to meet regulatory requirements.
• Airport is 13%.
• The remaining 7% supports Fire, Vehicles, Information Services and Real Estate &Parking.
Figure 2. Investment for each cost centre.
MAJOR CHANGES FOR FUNDED PROJECTS
Overall, the City’s infrastructure investment has increased $517 million from the previous plan across 12 capital cost centres. The primary drivers for the change include:
• Doubling investment in Transportation to align with this Council Priority,
• Including current approved budgets in the Capital Plan,
• Construction inflation
The following table shows the City’s total investment for funded projects in each cost centre in this Capital Plan compared to the previous plan.
Table 1. Summary of changes from the previous plan and this Capital Plan for funded projects ($ million).
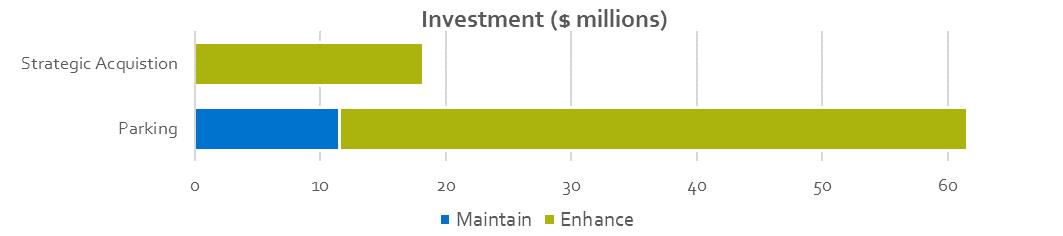
Real Estate & Parking. Investment focuses on strategic land acquisition and providing state-of-the-art, well-maintained parking facilities. New parkades are planned for South Pandosy and Downtown in response to rapid growth. Overall, investment in Real Estate & Parking infrastructure is $80 million with large investment in:
• General Land Acquisition - $18 million
• Parking Infrastructure including Electric Vehicles infrastructure - $12 million
• Downtown Parkade - $35 million
• South Pandosy Parkade - $15 million
Table 2. Real Estate & Parking Capital Programs and Projects summary for 2025-2034.
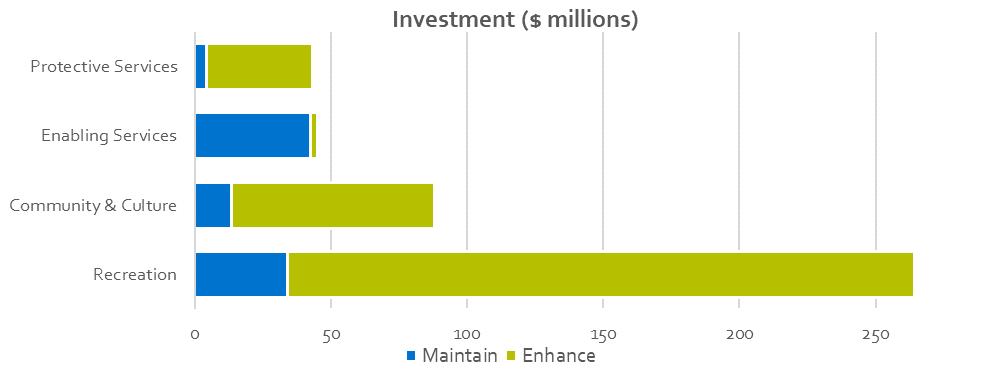
Buildings. This is a large investment area with a total forecast at $441 million. There are big investment plans to expand recreational, cultural, and protective services facilities to support a growing community. As well, the existing Building portfolio will see significant investment in renewal and modernization. Big projects include:
• PRC Redevelopment - $189 million
• Building Renewal - $80 million
• MNP Expansion - $43 million
• Glenmore Protective Services Building- $39 million
• Mission Activity Centre - $28 million
• Glenmore Activity Centre - $24 million
• Rutland Lions Activity Centre - $23 million
Table 3. Buildings Capital Programs and Projects summary for 2025-2034.
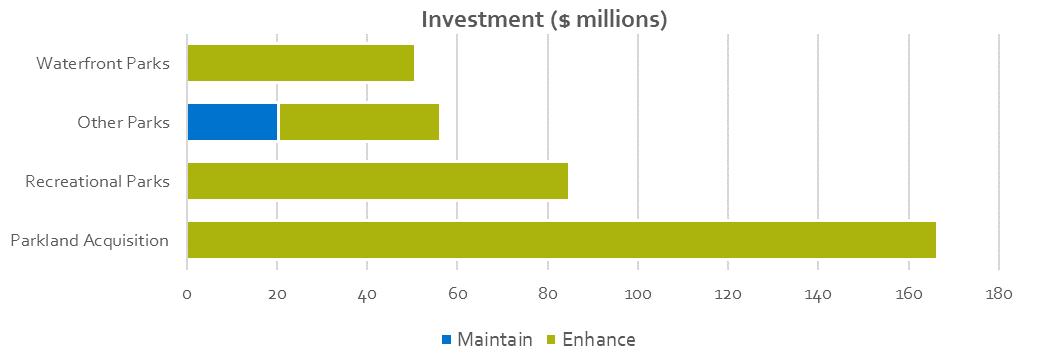
Parks. In the next 10-years, the City plans to invest $358 million in parks creating vibrant, animated spaces for the community to connect, enjoy and experience. Big Park projects in the next 10-years include:
• Parkland Acquisition - $166 million
• Parkinson Recreation Park - $41 million
• Glenmore Recreation – Future Phases - $41 million
• Dehart Park - $11 million
• Rutland Recreation Park - $8 million
• Neighbourhood Parks – approximately 1 per year - $4 million/park
Table 4. Parks Capital Programs and Projects summary for 2025-2034.
Transportation. Transportation is a Council priority and the largest infrastructure investment area at $726 million. The City is doubling its investment to make it easier for people to get around by vehicle, transit, cycling and walking. Notable projects include:
• Highway 33 / Clement Extension - $135 million
• Burtch Rd - $58 million
• Sutherland Rd - $52 million
• Active Transportation Corridors - $47 million
• Glenmore Rd - $43 million
• Hollywood Rd - $35 million
• Lakeshore Rd - $29 million
• Richter St - $24 million
• KLO Bridge Replacement - $18 million
• Orchard Park Transit Exchange - $17 million
• Frost Rd Ext. to Chute Lake - $5 million
Table 5. Transportation Capital Programs and Projects summary for 2025-2034.
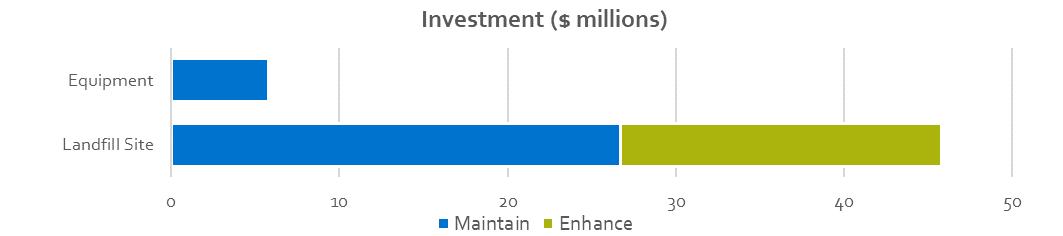
Solid Waste. Efficient and effective daily operations and long-range capital planning ensures the Glenmore Landfill will continue to serve Kelowna and surrounding communities well into the future. That is why $52 million worth of capital investment is planned in the next 10 years to ensure the site is futureready and there are continued plans to:
• Expand the landfill footprint.
• Manage the Stockpile and Reprocessing Areas
• Implement a new stormwater management program
6. Solid Waste Capital Programs and Projects summary for 2025-2034.
Table
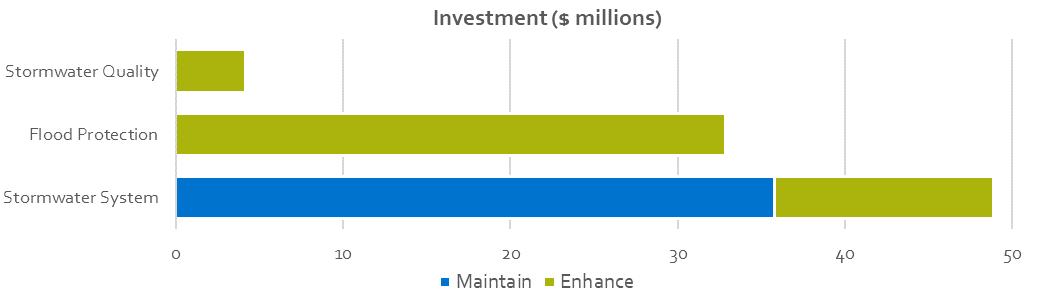
Storm Drainage. Investment in drainage infrastructure will utilize natural and engineered solutions to improve resiliency, flood mitigation and water quality which are increasingly important in the face of a changing climate. Recent capital investment to improve Mill Creek capacity and divert more flow to Mission Creek through an upgraded diversion structure prevents Mill Creek from spilling its banks during periods of heavy rainfall. To keep going with this critical work, Storm Drainage plans to invest $86 million in the next 10 years.
• Mill Creek Flood - $51 million.
• Renewal of aging drainage infrastructure
Table 7. Storm Drainage Capital Programs and Projects summary for 2025-2034.
PROGRAMS
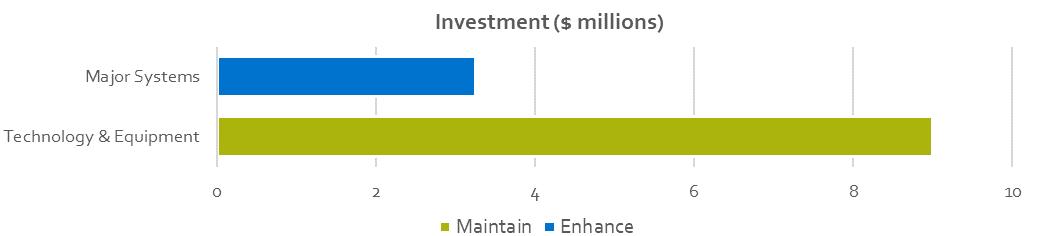
Information Services. Information services is a small but important investment area as the City continues its digital-first transformation. To get there, investment of $12 million is planned in the next 10 years. As the City embraces more cloud-based technology, the focus is n:
• Major systems projects to eliminate legacy systems.
• Refreshing the user-experience by streamlining the access to information
• Enabling staff to be more mobile by purchasing hardware that allows for greater flexibility.
Table 8 Information Services Capital Programs and Projects summary for 2025-2034.
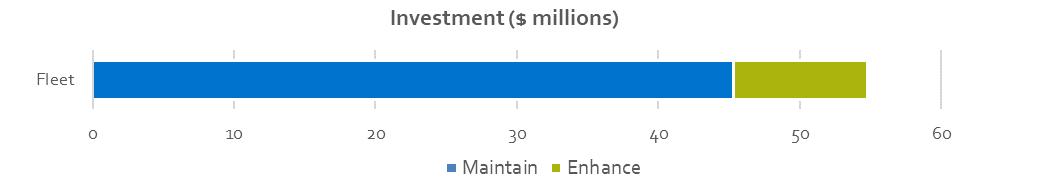
Vehicle or Mobile Equipment. This cost centre funds all the City’s vehicles and equipment except for fire trucks and equipment. The City maintains a reliable, sustainable fleet and continues to modernize it by going Green to reduce GHGs by purchasing EV, hybrid or hydrogen vehicles where available. The $55 million capital investment will go towards:
• Replacing aging vehicles and adding to the fleet to accommodate growth.
Table 9 Vehicles or Mobile Equipment Capital Programs and Projects summary for 2025-2034.
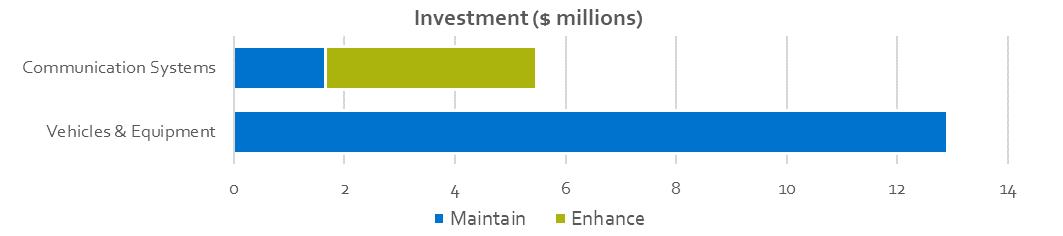
Fire. The well-established capital program at the Fire Department ensures fire trucks, equipment and communication systems remain up-to-date in order to keep firefighters and the community safe. It is a relatively small capital program as most costs are operational and fire stations are accounted for in the Buildings cost centre. Investment in the Fire cost centre is forecasted at $18 million. Big projects include:
• Vehicle/Equipment Renewal
• Communication Systems
• New Fire trucks and equipment to support growth
Table 10. Fire Capital Programs and Projects summary for 2025-2034.
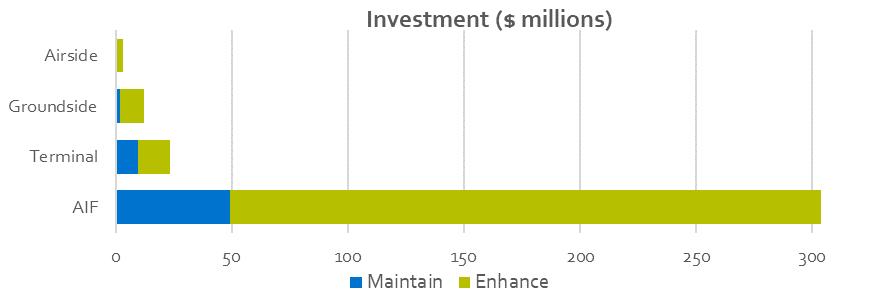
Airport. Anticipated investment in infrastructure and equipment over the next 10 years of $342 million ensures additional air service can be accepted to support the continued growth of the regional economy. Significant projects over the next 10 years include:
• Airport Terminal Building Expansion - $139.0 million
• Airside Pavement Rehabilitation and Expansion - $94.6 million
• Airport Airside Equipment - $27.2 million
• Airport Combined Operations Building - $15.1 million
• Airport Passenger Boarding Bridges - $11.9 million
Table 11 Airport Capital Programs and Projects summary for 2025-2034.
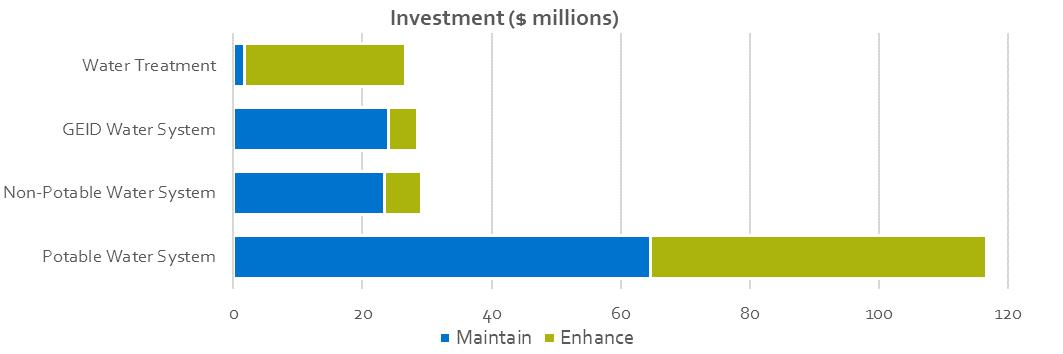
Water. Infrastructure investment is forecasted at $201 million that focuses on delivering high-quality drinking water and reliable irrigation water to all City customers. This is evident in the upcoming planned transition of the Glenmore Ellison Improvement District (GEID) to the City’s water utility which improves supply and resiliency through better interconnectivity and interoperability of both systems. In the next 10 years, infrastructure to:
• Support growth - $97 million
• Renew existing infrastructure - $34 million.
Table 12. Water Capital Programs and Projects summary for 2025-2034.
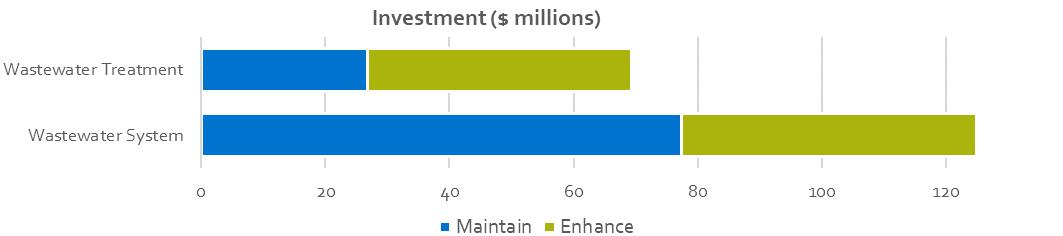
Wastewater. The City treats close to 40 million litres of wastewater from homes, businesses, and industry each day. With the community’s expected growth, this volume will continue to increase. The focus is to ensure environmental stewardship, community preparedness and resiliency while meeting regulatory requirements. That is why the City plans to invest $194 million in the next 10 years. Major investment includes:
• Infrastructure to support growth and renewal of aging assets.
• Septic removal projects to provide wastewater service to the remaining areas of the City that are still on aging septic systems.
13 Wastewater Capital Programs and Projects summary for 2025-2034.
Table
OPERATIONS & MAINTENANCE IMPACTS
Infrastructure investment decisions consider asset lifecycle costs which includes both capital and operating expenses. Municipal infrastructure is designed to last a long time, varying from 20 – 100 years, and the operating expense can amount to 70 - 80% of the lifecycle cost. This is why it is important to consider operational impacts when making capital investment decisions.
The Capital Plan forecasts $1.5 billion in infrastructure to enhance service levels and accommodate growth. This enhanced infrastructure may require additional funding to operate and maintain. The operational impacts for the General Fund and Utilities will require approximately $30.05 million and $11.35 million respectively of additional annual funding by 2034. The General Fund cost centres will be primarily funded by taxation while Utilities and Solid Waste will be accounted for in their respective utility funding models.
Renewal of existing infrastructure is assumed to have no operational impacts because operational budgets are currently in place to support existing infrastructure.
Table 14. Forecasted operational and maintenance (O&M) impacts for each service area based on historical data.
Information for Airport and Fire cost centres not included.
3 FUNDING SOURCES
FUNDING SOURCES
Funding for the Capital Plan comes from 4 primary sources totaling $2.57 billion. Approximately 35% of funding is from external sources comprised of Development Cost Charges and Grants from senior governments City funding sources include General Taxation and Reserves and Borrowing totaling approximately 65%.
General Taxation and Reserves
General Taxation and Reserves fund approximately $994 million (39%) of the plan. These sources are grouped due to similarities in funding flexibility permitting the City discretion in meeting its strategic financial plan to help ensure equity between current and future taxpayers. The primary sources in the Reserve category include the General Fund, Restricted Reserves and the user pay funded Water, Wastewater and Airport Utilities.
Development Cost Charges
Figure 3. Funding sources for 10-Year Capital Plan ($ millions). Total $2.57 billion.
Development cost charge (DCC) funding accounts for $665 million (26%) of all capital investment. Eligible road, storm, sewer, water and park projects align with the 20-Year Servicing Plan & Financing Strategy and growth forecast in the 2040 Official Community Plan.
Borrowing
Debenture borrowing of $677 million (26%) is forecasted to fund major one-time capital projects such as the Building Stronger Kelowna suite of recreation projects The exact timing and allocation of debt will be evaluated continually as projects near phases of significant cash outlay and monitored against targeted Council approved debt limits and prevailing interest rates.
Grants
A total of $229 million (9%) in this Capital Plan is project to fund the plan from various provincial and federal grant programs; these includes project specific grants such as the Disaster Mitigation Assistance Fund for works along Mill Creek, to the more generalized Federal infrastructure funding streams like the Housing Accelerator Fund and Community Works Fund (previously known as “gas tax”) and Provincial Growing Communities Fund Grants will only be pursued for the City’s priority projects and grant funding will not increase the scope of a project without Council endorsement. This plan’s long-term financial strategy relies on unconditional grant opportunities only.
4 PROJECTS NOT IN THE PLAN
FUTURE CAPITAL PLANS
The Capital Plan is Council’s funded and approved projects. These have certainty and help achieve defined service levels. In addition to the Capital Plan-ready projects, there are a number of other projects in the pre-planning stages Many of these are being identified in the City’s infrastructure Master Plans and other initiatives that are currently in-progress Following completion of this critical step, these projects will then go through a prioritization filter, relative to service level obligations, and brought forward to Council for funding approval and inclusion in the Capital Plan The following table summarizes major projects not in the Capital Plan and outlines anticipated outcomes
Table 15. Major projects details currently not in the Capital Plan.
Transit Operations & Maintenance Facility
Rotary Centre for the Arts - Expansion
Community Theatre Replacement
Kelowna Art Gallery Envelope Replacement
Planning & design led by Infrastructure BC, in partnership with the City & BC Transit
Third Party Leased Facilities Master Plan inprogress. Completion Q4 2024.
Community Task Force on the Performing Arts inprogress. Completion Q4 2024
Third Party Leased Facilities Plan in-progress. Completion Q4 2024.
KLO Fire Hall – New Construction Fire Service Master Plan update in-progress. Completion Q4 2024.
Rutland Fire HallRenovation Fire Service Master Plan update in-progress. Completion Q4 2024.
Civic Yards Replacement
Parks Operations Yard Renewal
Kelowna Police Services Building Expansion
North Glenmore Policing Office
Rutland Community Policing Office
Water Treatment Facility
Wastewater Digester Facility
Capital Project Delivery
Operational Facility Master Plan in-progress. Completion Q1 2025.
Operational Facility Master Plan in-progress. Completion Q2 2025.
Police Services Master Plan in-progress. Completion Q1 2025
Police Services Master Plan in-progress. Completion Q1 2025
Police Services Master Plan in-progress.
Completion Q1 2025
Land purchase planned in 2028.
Determined by Partners. Include in Operating Budget.
Construct of Hollywood Rd.
Informed by Master Plan.
Determined by Task Force.
Informed by Master Plan.
Informed by Master Plan.
Informed by Master Plan.
Informed by Master Plan
Informed by Master Plan.
Informed by Master Plan.
Informed by Master Plan.
Informed by Master Plan.
Purchase land. Ongoing monitoring.
Actively working with partners to expand biosolid management. Ongoing monitoring.
The Capital Plan focuses on delivering more infrastructure and the next few years will see infrastructure investment at historic highs. The Capital Plan is ambitious, and we’ll need to increase delivery capacity significantly to execute the Plan. This will require innovative procurement strategies to balance delivery capacity with the planned projects.
As shown in Figure 4 below, capital investment is higher in the first few years of the Capital Plan and lower in the second half. This strategy supports the City’s goal to deliver more infrastructure faster while also leaving capacity in future years to bring in the projects noted above.
$500,000,000
$450,000,000
$400,000,000
$350,000,000
$300,000,000
$250,000,000
$200,000,000
$150,000,000
$100,000,000
$50,000,000
$0
10 Yr Capital Plan
Historic Annual Average Capital Spend
Figure 4. Forecasted Capital Plan investment by year compared to historic annual average capital expenditure
Determining the Deficit
Previously, the Capital Plan presented Priority 1 projects (funded) and Priority 2 projects (unfunded). Priority 2 projects were used to calculate the Infrastructure Deficit (ID), annually reported to the Council. The ID quantifies the City's funding responsibility for all P2 projects after deducting contributions from external sources like DCCs, grants, utilities, or partnerships. Staff are currently reassessing the methodology for determining the ID, as it encompasses several variables. The following table is from last year’s Capital Plan and is reported here for reference.
Table 16. Summary of Infrastructure Deficit (ID) by year ($ million).