


March 2024

There is a growing consensus that the world must reach net zero carbon dioxide (CO2) emissions by mid-century to avoid the worst effects of anthropogenic climate change (IPCC, 2021, 2022a). Achieving net zero emissions will require transformational changes to energy systems, expansive deployment of carbon dioxide removal (CDR) technologies, supporting public policies, and unprecedented global coordination (IPCC, 2022b).
The United States plays a key role in achieving carbon neutrality. The U.S. provides 16% of the global primary energy supply and emits 12% of global emissions (EIA, 2024 and Friedrich et al., 2023). Despite the rapid growth of renewable energy, fossil fuels accounted for 79% of U.S. primary energy consumption in 2021 (EIA, 2023), highlighting the substantial changes required to achieve net zero emissions.
This study uses an energy systems model to demonstrate the energy sources and technologies that collectively minimize the costs of decarbonizing the U.S. energy system. Energy systems models provide unique and indispensable insight into decarbonization, given they capture much of the complexity in the energy system. We developed the Open Energy Outlook (OEO) database and applied it to the Tools for Energy Model Optimization and Analysis (TEMOA) to model the U.S. energy system and related emissions. The OEO database reflects essential characteristics of myriad energy sources (fossil fuels, renewables, biomass, nuclear, hydrogen), carbon sequestration technologies, and 83,000 technologies representing the conversions of raw sources through end-uses. Taken together, OEO and TEMOA provide powerful data- and model-driven insights into decarbonization strategies that meet U.S. energy demands through 2054.
TEMOA is a multi-sector capacity expansion optimization model with several advantages in modeling U.S. decarbonization strategies. It offers considerable flexibility in assessing which technologies minimize the cost of decarbonization, selecting from a relatively broad range of end-use, storage, and energy carrier technologies. As such, TEMOA better captures decarbonization opportunities from electrification, end-use efficiency, and energy source switching. OEO and TEMOA are also unique in that both are pub lished openly and free of charge. The OEO team believes that open resources promote the transparency, accessibility, and replicability needed to foster consensus -based decisions.
Our first OEO report highlighted transition pathways for U.S. energy systems for five scenarios: current policy (previously called “no policy”), planned emissions management policies from select states, emission reduction commitments made as part of the Co nference of Parties (26), and net zero emissions by 2050 (Venkatesh et al., 2022). Exemplary takeaways from our 2022 report include:
• Emissions targets in 23 states partly contribute to a 60% reduction in national coal and petroleum between 2020 to 2050; a 30% increase in natural gas between 2020 and 2050; and substantial increases in renewable energy generation;
• Achieving net zero emissions by 2050 will require capturing approximately 80 times the amount of carbon emissions relative to the current policy scenario;
• To meet net zero CO2 emissions in the energy sector by 2050, electrification of end uses will need to double relative to current policy, and most expected electrification occurs in the transportation and industrial sectors; and
• The present value of the costs of achieving net zero emissions by 2050 is comparable to an energy system expected under current policies
In August 2022, the U.S. Congress passed the Inflation Reduction Act (IRA), which allocated $385 billion in funding for climate mitigation activities between 2022 and 2031 (H.R.5376). In 2023, the OEO team integrated the IRA into our Current Policy scenario. This report summarizes the respective transition pathways, which suggests the IRA will reduce emissions but that these reductions are both temporary and insufficient to achieve net zero emissions. Thus, this report also includes an energy and emissions pathway that meets net zero emissions, starting with emissions estimated upon the expiration of the IRA at the end of 2032, ramping down to net zero by 2050.
In summary, this report answers two questions:
1. What energy sources and technologies contribute to emissions reductions achieved by the IRA?
2. What energy sources and technologies achieve net zero emissions after the IRA expires?

This report analyzes two policy scenarios: the inclusion of the IRA into our ‘Current Policy’ scenario and a scenario assuming net zero emissions are achieved by 2050 without specifying the underlying policy driver, called the policy-neutral ‘Net-Zero’ scenario.
1. ‘Current Policy’ Scenario that Includes the Inflation Reduction Act of 2022
Existing policy scenarios - also called “baseline,” “reference,” or “business-as-usual” scenarios - provide valuable results for comparisons with other policy assumptions. Prior to the IRA, OEO’s Current Policy scenario included only policies enacted by 2021, including state-level Renewable Portfolio Standards (RPS), the CrossState Air Pollution Rule (CSAPR), the California cap -and-trade program, and the federal Investment Tax Credit (ITC). In 2023, we added the IRA to our Current Policy scenario. Specific ally, we include the following IRA provisions: the production and investment tax credits for renewable electricity generating technologies (45Y, 45E); tax credits for carbon capture (45Q); the production tax credit for existing nuclear (45U); the production tax credit for clean hydrogen (45V), light-duty passenger vehicle tax credits (30D), and commercial vehicle tax credits (45W).
2. P olicy N
The Net Zero scenario inherits the above Current Policy assumptions but further assumes that the United States will reach net zero CO2 emissions by 2050. This scenario linearly reduces emissions from levels projected for 2032 (when the IRA expires) to net zero by 2050. The ‘net’ term indicates that the model can balance any residual CO2 emissions with carbon dioxide removal (CDR) technologies that draw CO2 directly out of the atmosphere. CDR technologies represented in the model include biomass energy with carbon capture and sequestration (BECCS) and direct air capture (DAC). The results from this scenario provide a prescriptive look at the energy system transformation to net zero without assuming specific supporting policy mechanisms.
The scenarios in the report collectively represent a full range of emissions pathways. The Current Policy and Net Zero scenarios form upper and lower bounds on the emissions trajectories.
Our analysis uses fuel prices reported in the Annual Energy Outlook 2022 published by the Energy Information Administration (EIA) (EIA, 2022). The Current Policy and Net Zero Scenarios assume the reference and low fuel prices, respectively, as reported by the AEO. The difference in fuel prices used in the scenarios is meant to represent the price elasticity of supply associated with substantial reductions in fossil fuel demand in the Net Zero scenario.
3.1 Model structure
This project relies on TEMOA, an open-source energy system optimization model. TEMOA represents the energy system as a process-based network in which flows of energy commodities link technologies together. Each process is defined by an exogenously specified set of techno-economic parameters such as investment costs, operations and maintenance costs, conversion efficiencies, emission rates, and availability factors. TEMOA uses linear optimization to minimize the present value of the total system cost of energy supply over the user-specified time horizon, subject to both system-level and user-defined constraints. The complete algebraic formulation of TEMOA is presented in Hunter et al. (2013), with updates provided in the TEMOA documentation (TEMOA, 2021). The model source code is publicly available in the TEMOA GitHub repository (TEMOA, 2022).
3.2 Open Energy Outlook energy system representation
TEMOA represents an abstract algebraic model formulation of the energy system capacity expansion problem that requires external inputs for simulation. We develop and apply the OEO database to parameterize TEMOA to represent the U.S. energy system. The OEO database is available in a separate OEO GitHub repository (Venkatesh et al., 2022) and includes extensive sector-by-sector documentation in the form of Jupyter notebooks.
Regional differences in fuel supply, renewable resources, end-use demands, and existing capacities are key determinants of how the future U.S. energy system may evolve. While it would be helpful to model all 50 states (so we can capture state-level energy and climate policies), such a spatial resolution would be computationally intractable, given the other modeling requirements. Thus, the OEO database groups states to approximate the North American Electric Reliability Corporation (NERC) regions to capture influential aspects of the bulk power system. Figure 1 shows the regions in the database based on state-level aggregations.
OEO currently models a planning horizon from 2020 through 2050 at five-year periods beginning at the start and middle of each decade (e.g., 2020 and 2025). The model assumes that all years within a given five-year period are identical. For example, the 2020 model period represents the years 2020 through 2024. To capture sub-annual change, the model relies on a ‘representative days’ approach where eight days, modeled at an hourly resolution, represent an entire year’s operations. We use a machine learning algorithm, k-means clustering, to select a subset of eight days from annual datasets that include energy demands and renewable energy availability. These days are chosen by grouping historical data into representative periods that collectively capture the characteristics of the entire year (Teichgraeber and Brandt, 2019). Existing technologies within a specific model period are operated to satisfy end-user demands at each one of the representative days.
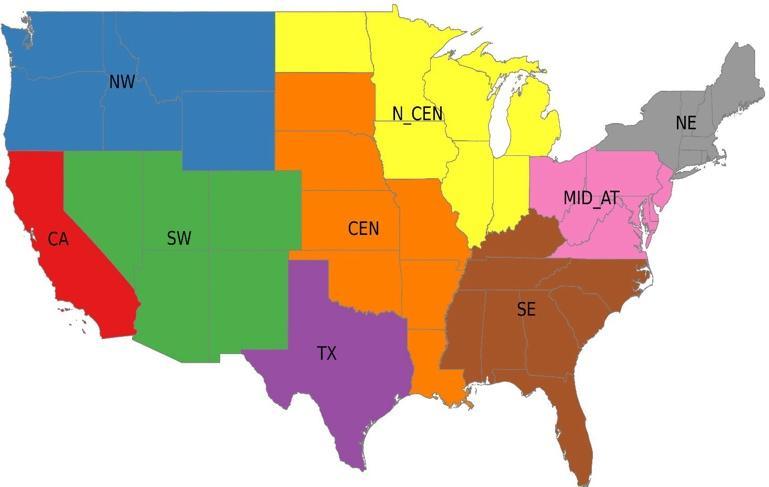
Figure 1: OEO modeled regions include CA (California), NW (Northwestern US), SW (Southwestern US), TX (Texas), N_CEN (Northcentral US), CEN (Central US), SE (Southeastern US), MID_AT (Mid-Atlantic US), NE (Northeastern US).
Energy system optimization models make assumptions related to technology adoption. One such assumption relates to how much future information informs least-cost criteria, which relates to whether decisions are assumed to be ‘myopic’ or reflect ‘perfect foresight.’ Perfect foresight assumes all decision variables corresponding to installed capacity and commodity flows are optimized simultaneously across all future periods. In other words, perfect foresight assumes the future is well understood. Such assumptions introduce computational complexity. A myopic approach is an alternative, less computationally complex method that limits the future period over which costs are optimized to one model period (or five years). Results in this report reflect myopic assumptions.

Technologies in the TEMOA database are represented by engineering-economic parameters, including capital costs, fixed and variable operations and maintenance costs, conversion efficiencies, and emissions coefficients. End-use service demands, such as demand for light- and heavy-duty transport, space heating and cooling, and industrial processes, are specified exogenously. The strength of models such as TEMOA is their ability to capture these detailed cost and performance characteristics. While high granularity in technology representation can be an asset, unnecessary detail degrades computational performance and makes the model results harder to interpret. Across the sectors modeled in this project, we have applied transparent assumptions informed by expert judgment regarding technology representation and service demands. The descriptions in the documentation notebooks in the GitHub repository present all these assumptions in detail (Venkatesh et al., 2022; Jordan et al., 2023; Sinha et al., 2023). The project Roadmap (DeCarolis et al., 2022) guided these assumptions.
Figure 2 shows carbon dioxide emissions in tons across sectors and years for the Current Policy and Net-Zero scenarios. In the Current Policy scenario, emissions initially decline during the active IRA period. However, if no further policies are implemented after the IRA expires in 2033, emissions begin to rise again until the end of the modeling time horizon (2050). The electric sector emerges as a large contributor to this increase, with increased use of natural gas plants to meet electricity needs. In this scenario, the transportation sector experiences modest adoption of electric vehicles, resulting in slightly reduced emissions compared to present levels. The industrial and building sectors largely maintain the status quo throughout the modeling time horizon. Although small amounts of carbon dioxide removal technologies are deployed during the IRA period, without subsidies, these technologies are not utilized in later time periods.
In the Net Zero scenario, the electric sector leads in decarbonization, illustrating a sharp contrast to the Current Policy scenario. Emissions reductions are observed across all sectors throughout the modeling horizon. However, complete decarbonization is not achieved within these sectors, necessitating the use of carbon dioxide removal technologies to attain net zero emissions by 2050. During the IRA period, bio-energy carbon capture and storage is used, generating secondary energy carriers such as electricity and hydrogen for use in other parts of the energy system. In 2050, direct air capture is employed to mitigate hard-to-decarbonize processes like aviation.
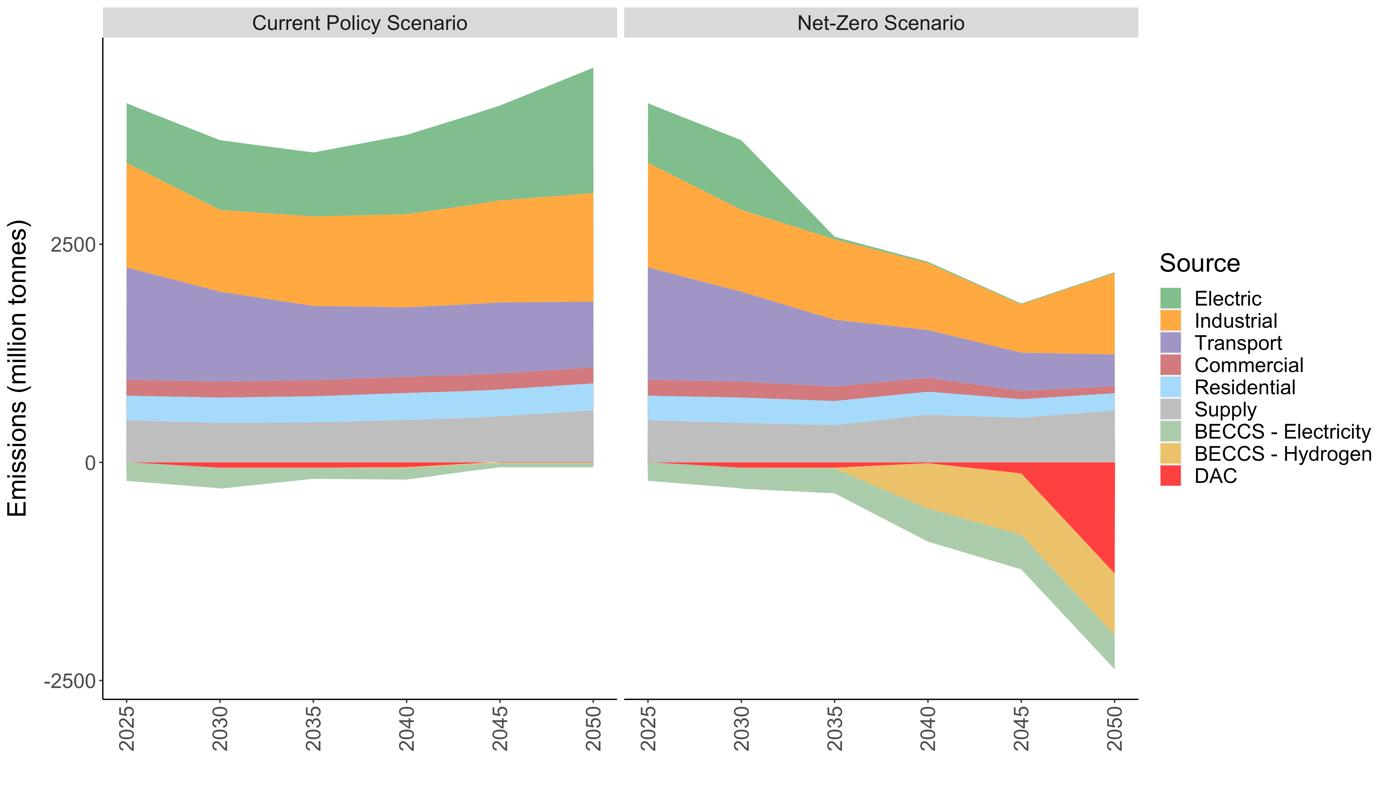

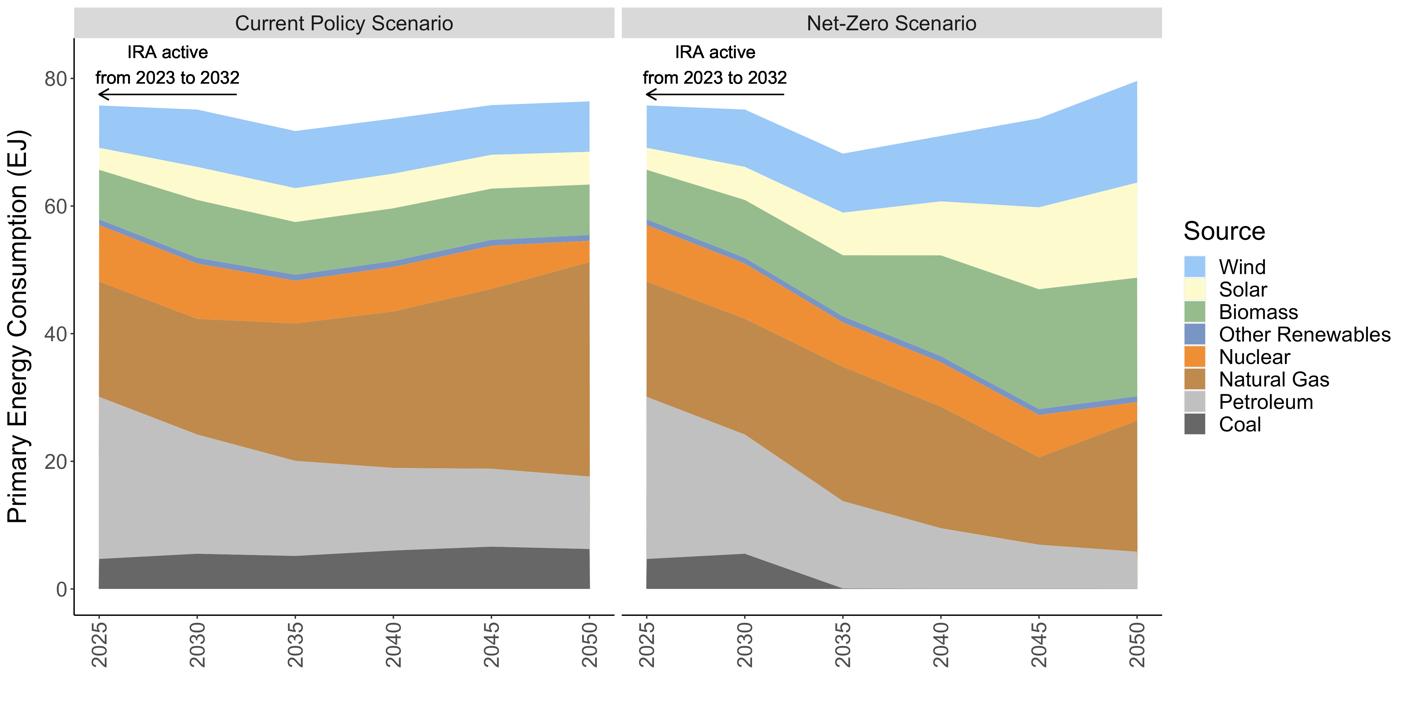
Figure 3 shows the variation in energy consumption by scenario, source, and year. The Current Policy scenario exhibits a moderate decrease in total energy consumption over the active IRA period, driven mostly by decreased petroleum use and increased energy efficiency. Energy produced by wind and solar resources slightly increases over the active IRA period. In the Current Policy scenario, energy consumption rebounds after the IRA expires, reaching current (2020) levels by 2050. While petroleum consumption consistently declines under the Current Policy scenario, natural gas use increases substantially, and coal consumption remains relatively consistent. In contrast, the Net Zero scenario shows consistent reductions in fossil fuel consumption over the modeled horizon, though natural gas use rebounds in 2050 to power DAC facilities. The Net Zero scenario projects about a 140% increase in the consumption of wind and biomass resources and a 330% increase in solar energy.
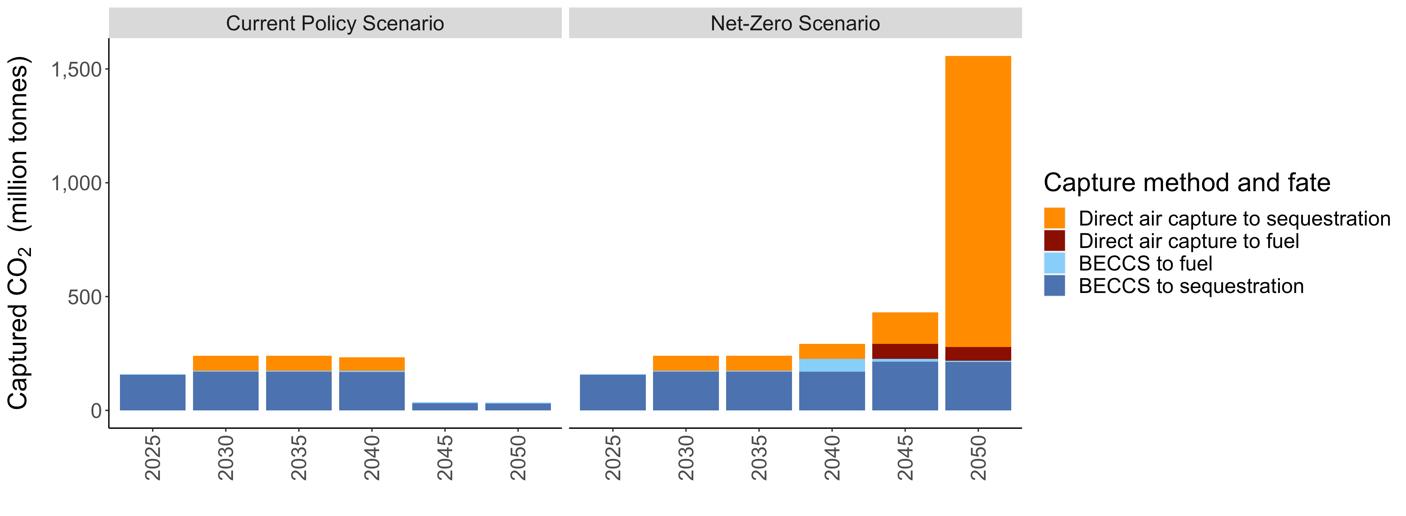
Continuing fossil fuel combustion under Net Zero conditions requires deploying carbon dioxide removal (CDR) technologies. Figure 4 highlights carbon captured through CDR by scenario, year, capture method, and fate. Carbon captured and sequestered under the Current Policy scenario is mostly due to IRA incentives (both 45V and 45Q). Some DAC is also deployed to meet emission limits in California in this scenario. These subsidized assets retire by the 2045 period, leading to very little CDR in the subsequent periods under the Current Policy Scenario. The Net Zero scenario shows consistently increased CDR deployments over the model period to meet increasingly tight net zero emission limits. In approaching net zero limits in 2050, bioenergy with carbon capture and storage (BECCS) becomes limited by feedstock, moderate amounts of captured carbon are used to produce liquid fuels, and DAC becomes the predominant removal method at projected cost learning rates.

Figures 5, 6, and 7 illustrate electric power capacity, electricity generation, and electricity consumption, respectively, by scenario, year, and source. Under the Current Policy scenario, renewable energy generation capacity increases slightly during the active IRA period, followed by the eventual retirement of some of these assets after the IRA expires. Changes to capacities for non-renewable generators are modest to negligible under this scenario. Generation (Figure 6) and consumption (Figure 7) mirror the trends in capacity (Figure 5) for the Current Policy scenario, except for the model period 2050. During this year, a decrease in nuclear generation, resulting from plant retirements, is offset by an uptick in natural gas generation.
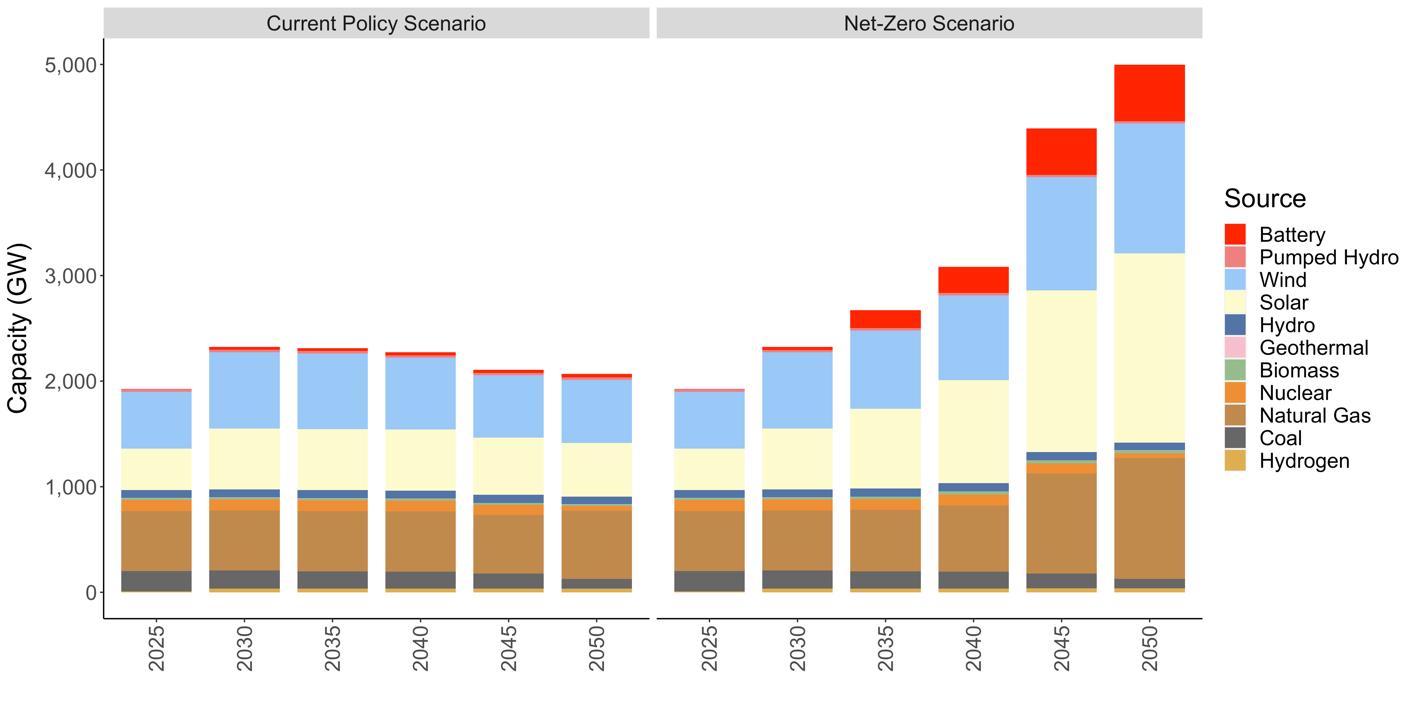
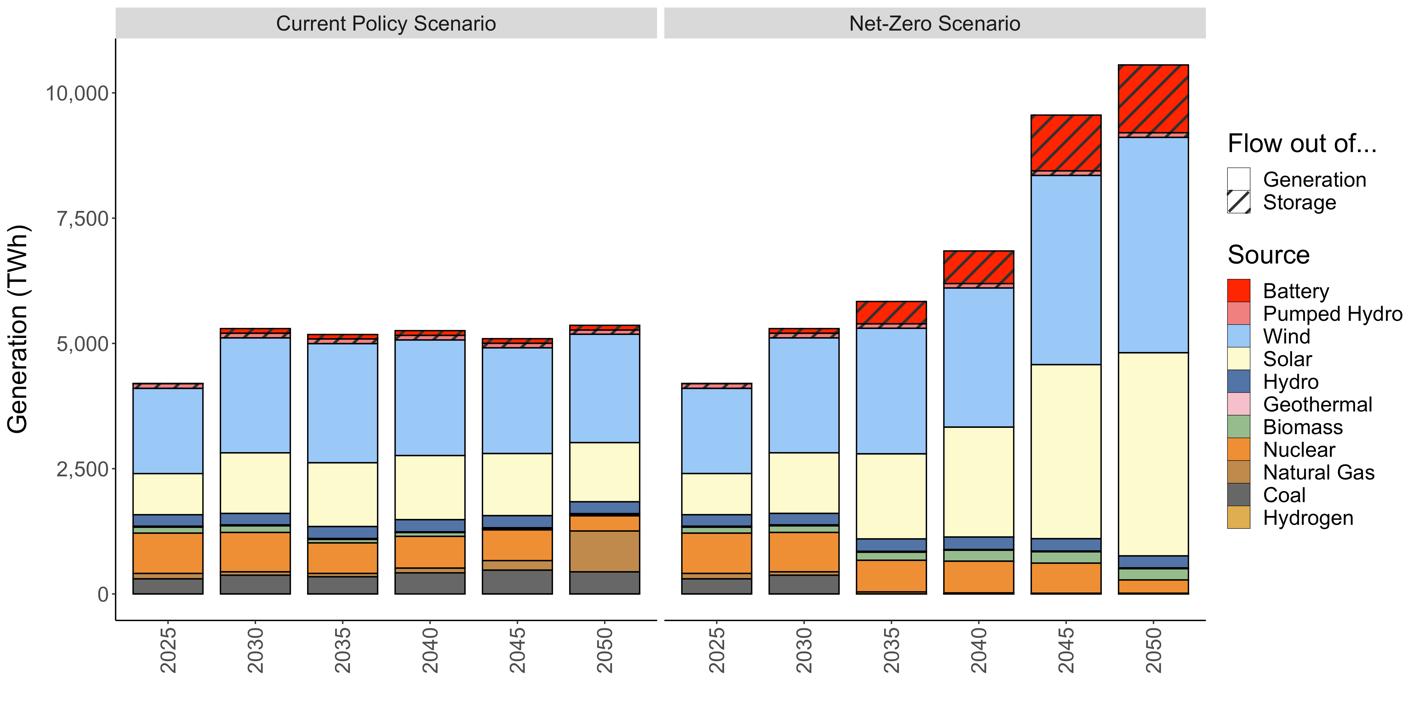

In contrast, the Net Zero scenario demonstrates consistent increases in capacity and the use of renewable generators and storage, alongside decreases in generation from fossil fuel sources, with coal generation eliminated by 2040. However, the Net Zero scenario also exhibits increased generation from natural gas, partly serving as a dispatchable resource to complement the growth in renewable energy. CDR deployments compensate for the residual emissions associated with such natural gas use.
In both scenarios, there is considerably less generation from natural gas relative to today’s generation mix. There are several reasons for this. First, the IRA subsidizes additional low-cost wind and solar generation. These variable resources are balanced by interregional transmission and, to a lesser extent, load-following coal and nuclear resources. Second, computational constraints limit the degree of temporal variability captured by energy systems models. TEMOA currently models electric power generator dispatch over a limited set of eight representative days and does not include unit-level operational constraints such as minimum up and down times. Addressing these issues is a priority for future work, as described later in this report.
Figure 7 shows electricity consumption for transportation and industry increases modestly when IRA subsidies are available. Electric-powered transportation continues to rise throughout the model horizon in both scenarios but more pronouncedly in the Net Zero scenario. Conversely, industrial electricity consumption decreases after the IRA period in the Current Policy scenario but experiences a substantial increase after 2035 in the Net Zero scenario. Limited and moderate building electrification occurs in the Current Policy and Net Zero scenarios, respectively.
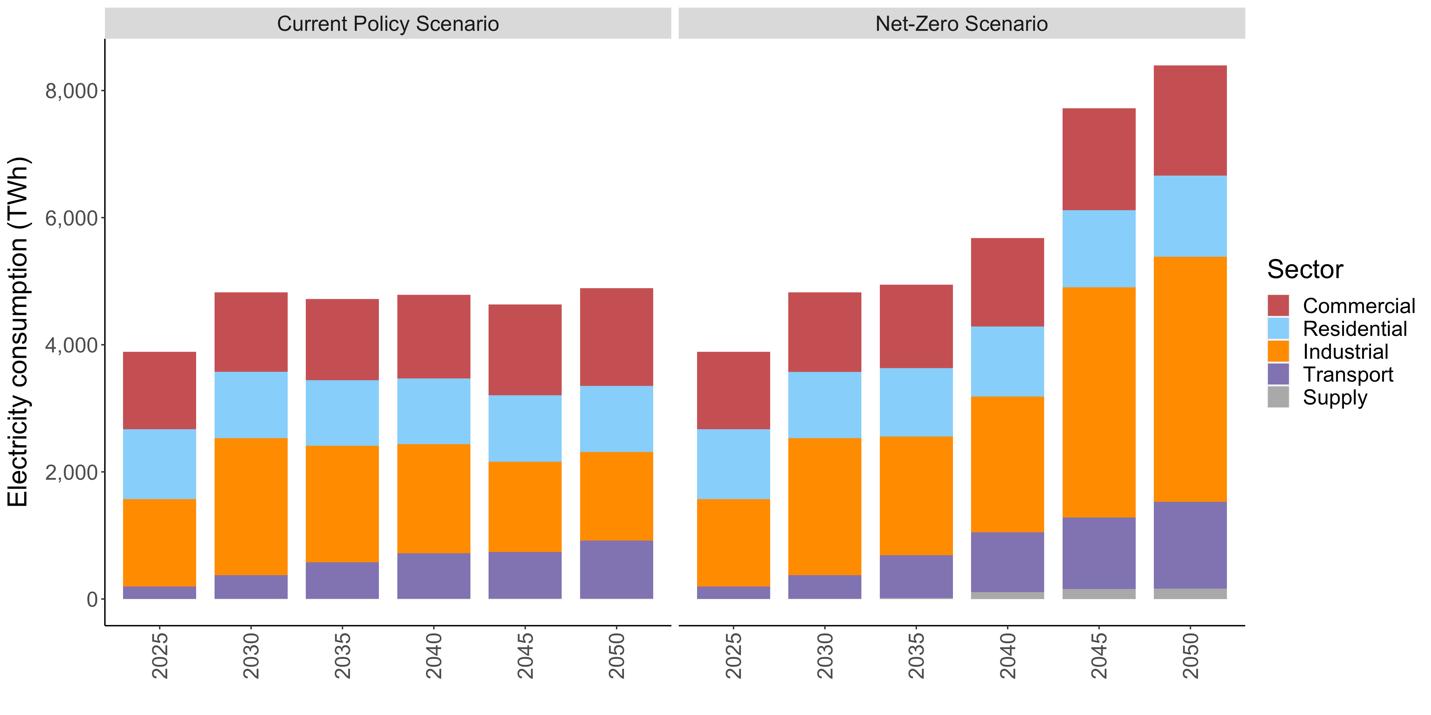

Figure 8 depicts hydrogen consumption by year, end-use sector, and scenario. Relatively little hydrogen is deployed in the Current Policy scenario, all of which is subsidized by the IRA. For reference, the U.S. currently consumes about 106 EJ of energy, meaning that the projected 200 PJ of hydrogen in 2050 constitutes approximately 0.2% of current total energy consumption. In contrast, hydrogen consumption increases substantially throughout the model period in the Net Zero scenario, albeit at levels that are still modest relative to total energy use. Hydrogen usage notably increases after 2040 in the Net Zero scenario to meet increasingly stringent carbon constraints.

Figure 8: System wide hydrogen (in PJ of lower heating value) consumption by H2 used in existing oil refineries and ammonia production is not included.
Figure 9 illustrates that energy consumption for transportation decreases while IRA subsidies are available but then stabilizes from 2035 to 2050, after subsidies for electric vehicles disappear. Source switching to biofuels and hydrogen is also modest in the Current Policy scenario between 2035 and 2050. The Net Zero scenario increases electrification and hydrogen utilization after 2035, primarily displacing gasoline and diesel. Additionally, electric vehicle adoption enhances end-use efficiency, leading to continued declines in secondary energy demands for transportation under the Net Zero scenario.
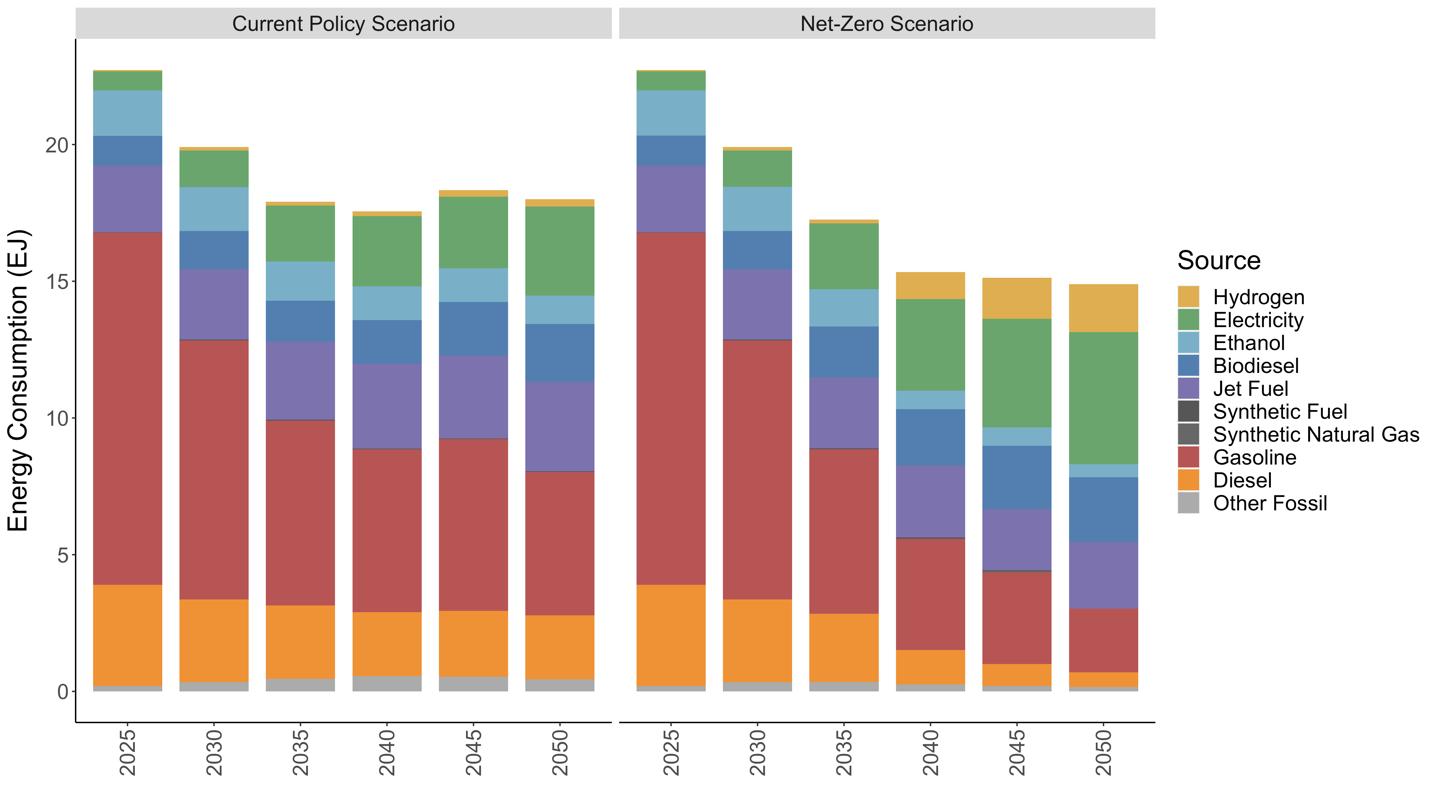

Figure 10 illustrates substantial reductions in industrial fossil fuel consumption when IRA subsidies are available, primarily attributable to subsidized electrification. However, natural gas usage experiences an uptick after IRA subsidies expire in the Current Policy scenario. In contrast, industrial electrification and hydrogen utilization continue to rise throughout the model period in the Net Zero scenario, ultimately phasing out industrial reliance on coal, diesel, and other fossil sources.


Figure 11 indicates that building energy use is less influenced by IRA or scenario assumptions relative to other sectors. The results suggest modest changes to building end uses and sources while IRA subsidies are available. Net zero emissions constraints drive slight increases in building electrification, displacing some fossil fuel use and reducing overall demands through increased efficiency.
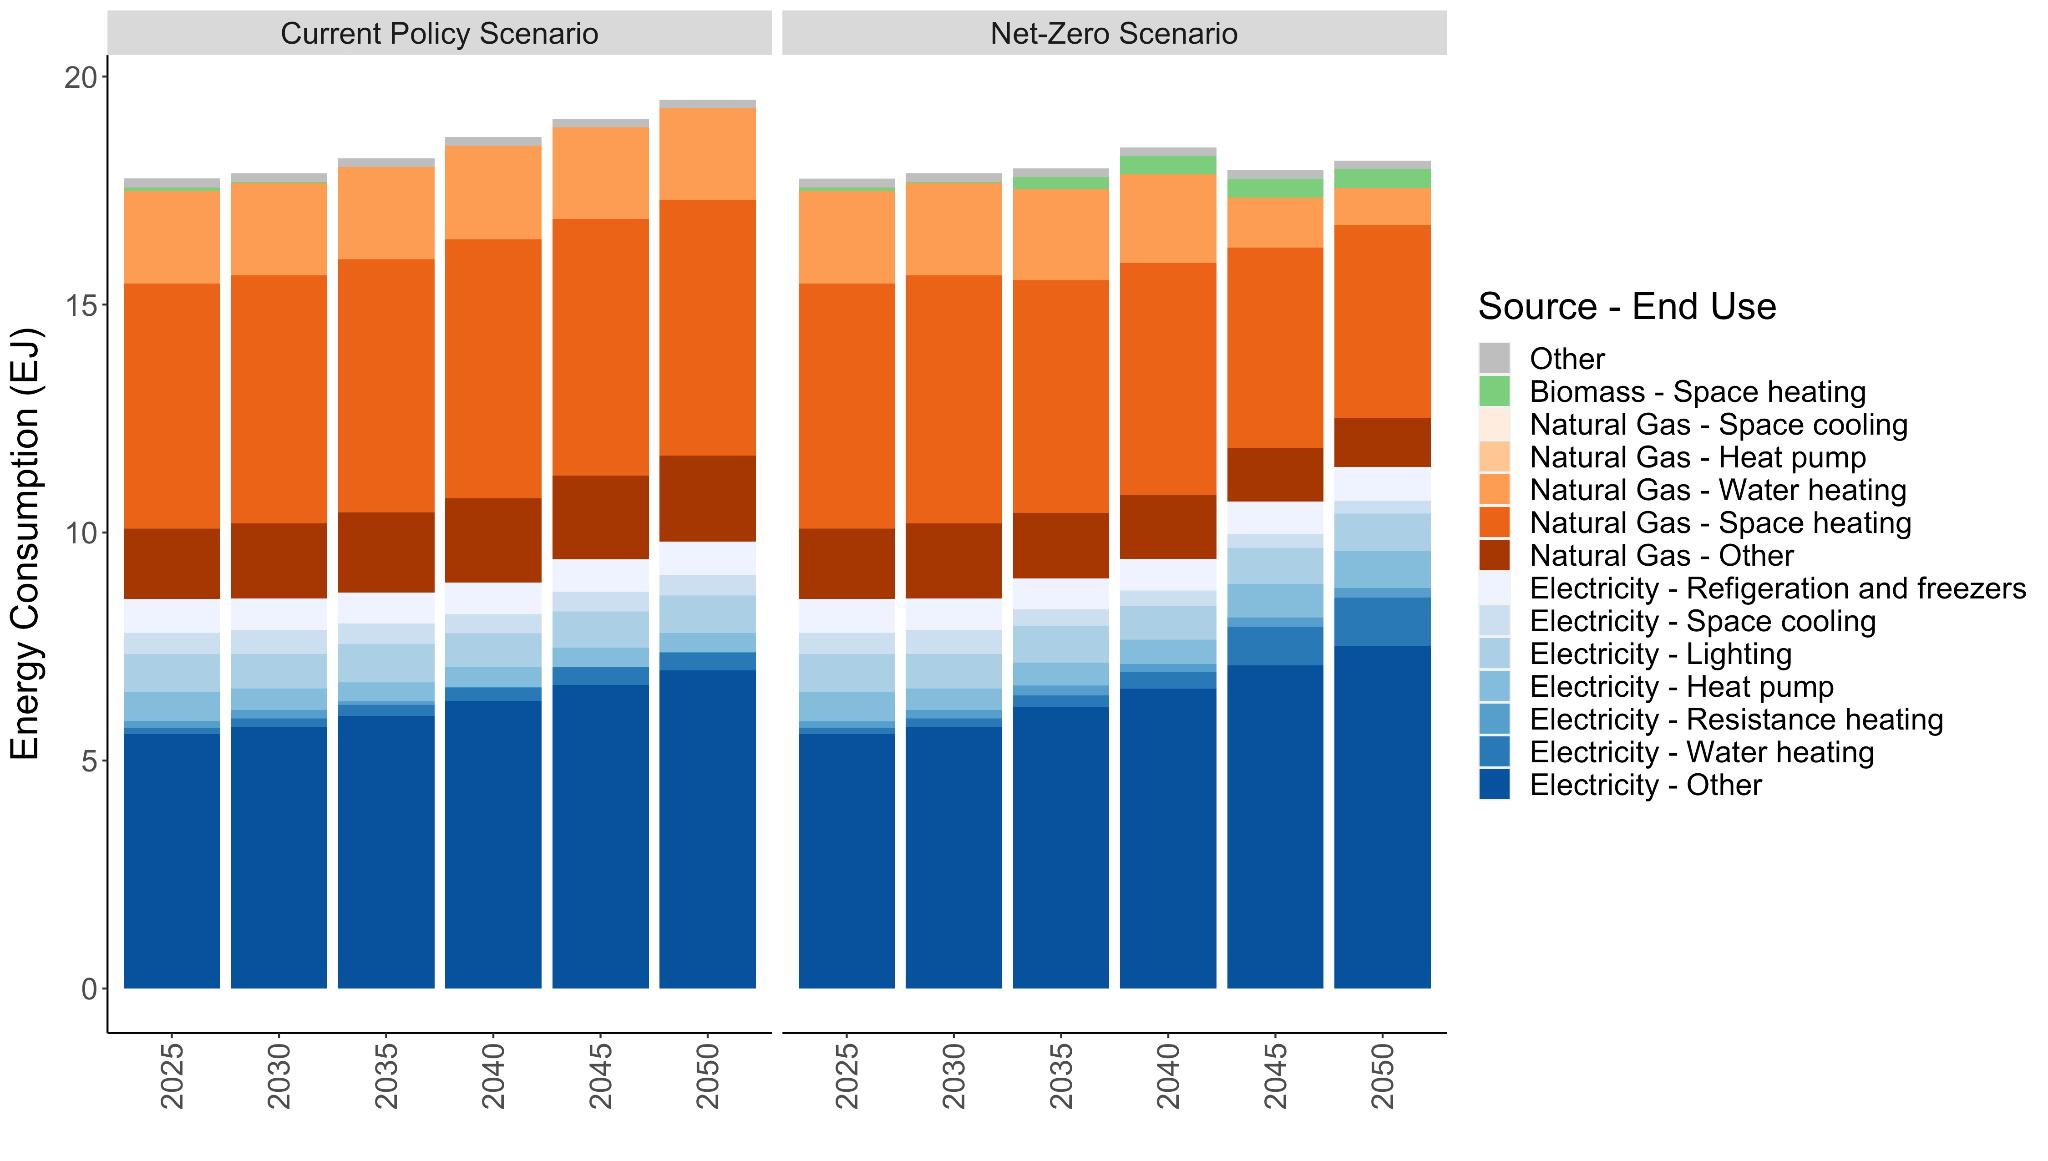
Figure 11: Energy consumed in buildings by fuel type and end-use in each modeled scenario.
In summary, this report delineates the potential impact of the IRA, which could lead to a 40% reduction in annual system-wide emissions between 2020 and 2035. However, this report underscores the need for continued interventions beyond the IRA to achieve net zero emissions by 2050. Beyond 2035, we find that expanding renewable energy sources, end-use electrification, moderate fuel switching to hydrogen, and carbon CDR technologies are the predominant cost-minimizing strategies to achieve net-zero emissions. Notably, source switching, both to electricity and hydrogen, in the transportation and industrial sectors are focal points for divergence between the Current Policy and Net Zero scenarios. However, CDR technologies are necessary to achieve netzero given residual emissions from these sectors. These results highlight the essential role that energy systems models play in developing a national decarbonization strategy.
Energy system models like TEMOA are essential tools for comparing future scenarios under a set of shared and transparent assumptions. They provide valuable insights into the potential impacts of policies like the IRA on fuel demand, electricity consumption, and emissions across the entire energy system. However, these models inherently cannot capture all real-world dynamics influencing outcomes. Factors such as the behavior of individuals and firms and unforeseen market shifts are often outside the scope of these models. This limitation underscores the unpredictability of results derived from such analyses, highlighting the challenge of applying concepts like causality or counterfactuals within this modeling context.
One specific limitation worth noting for this analysis is the representation of the power system in Temoa. As noted earlier, the simulations presented in this report rely on a representative day framework for modeling the power system. Specifically, this analysis relies on eight representative days selected via hierarchical clustering methods to represent the intra-annual temporal variability under which the power system would operate. However, the model does not account for important considerations that could affect the reliability of the power system, such as unplanned plant outages, extreme weather events, security-constrained economic dispatch, or AC power flow. In future work, the OEO Initiative aims to expand modeling capabilities to enable stress-test analysis of the power system TEMOA simulates, as described below in Ongoing and Future Work.
Finally, it is important to remind readers that the outputs of the simulations presented in this report are not forecasts of what will happen. Instead, they represent ‘if, then’ scenarios that “provide a systematic way to examine future decarbonization pathways, evaluate technology choices, test the effects and consequences of proposed policies, and explore decisions under future uncertainty.” (DeCarolis, 2020)
The TEMOA modeling framework is currently undergoing a significant upgrade and modernization effort that includes, but is not limited to, upgrading core dependencies, consolidating and coordinating legacy and duplicative extensions, providing select quality control features, and database improvements. These features will be released in Version 3 of TEMOA, which we aim to make available in the spring of 2024. Consistent with OEO’s commitment to developing open-source resources and reproducible research, Version 3 will not only make the model more performant but should also appeal to a broader user base.
Understanding the critical role of power systems in driving decarbonization efforts, the OEO team is currently working to enhance the TEMOA framework with a dedicated module for power system analysis. This effort addresses a known gap in long-term energy system optimization models: their limited ability to simulate detailed power system operations. The module will resemble a production cost model and will be soft-linked with TEMOA, allowing it to perform power system operational simulations based on the model’s capacity decisions. This approach will make it possible to evaluate power system performance across a full year, focusing on aspects like resource adequacy, system reliability, and the economics of electricity production.
Similarly, the OEO team is working on protocols and computational resources to produce model results in standards familiar to a broader community. These include improving our database schema to create more intuitive and consistent labels, providing tools for users to aggregate results, and publishing results in a format consistent with other commonly published energy datasets.
H.R.5376: Inflation Reduction Act of 2022, (2022) (testimony of 117th Congress). https://www.congress.gov/ bill/117thcongress/house-bill/5376
DeCarolis, Joseph F., Paulina Jaramillo, Jeremiah X. Johnson, David L. McCollum, Evelina Trutnevyte, David C. Daniels, Gökçe Akın-Olçum, et al. “Leveraging Open-Source Tools for Collaborative Macro-Energy System Modeling Efforts.” Joule 4, no. 12 (November 23, 2020): 2523–26. https://doi.org/10.1016/j.joule.2020.11.002.
DeCarolis, J., Jaramillo, P., Eshraghi, H., Trutnevyte, E., de Queiroz, A. R., Patankar, N., Nock, D., Yeh, S., Johansson, D., McCollum, D., Lin, Z., Jenn, A., Hoque, S., Choi, J.-H., Zhou, Y., Cho, S., Bergerson, J., Siddiqui, S., MacLean, H., … Smith, A. (2022). Roadmap: Open Energy Outlook for the United States. https://github.com/TEMOAProject/oeo/blob/3d22fb79e7216fc98b4eb85b3ea764fe2acd41d8/OEO_Roadmap.md (Original work published 2020)
EIA. (2022). Annual Energy Outlook 2022. https://www.eia.gov/outlooks/aeo/ EIA. (2023). U.S. energy facts explained. https://www.eia.gov/energyexplained/us-energy-facts/ EIA. (2024). What is the United States’ share of world energy consumption. Frequently Asked Question (FAQ). https://www.eia.gov/tools/faqs/
Friedrich, J., Ge, M., Pickens, A, Vigna, L. (2023). This Interactive Chart Shows Changes in the World’s Top 10 Emitters. https://www.wri.org/insights/interactive-chart-shows-changes-worlds-top-10-emitters
Groissböck, Markus. “Are Open Source Energy System Optimization Tools Mature Enough for Serious Use?” Renewable and Sustainable Energy Reviews 102, no. April 2018 (2019): 234–48. https://doi.org/10.1016/j.rser.2018.11.020. Hunter, K., Sreepathi, S., & Decarolis, J. F. (2013). Modeling for Insight Using Tools for Energy Model Optimization and Analysis (TEMOA). Energy Economics, 40, 339–349. https://TEMOAcloud.com/ wpcontent/uploads/2019/12/Hunter_etal_2013.pdf
IPCC. (2021). Climate Change 2021: The Physical Science Basis. Contribution of Working Group I to the Sixth Assessment Report of the Intergovernmental Panel on Climate Change (V., Masson-Delmotte, P. Zhai, A. Pirani, S.L. Connors, C. Péan, S. Berger, N. Caud, Y. Chen, L. Goldfarb, M.I. Gomis, M. Huang, K. Leitzell, E. Lonnoy, J.B.R. Matthews, T.K. Maycock, T. Waterfield, O. Yelekçi, & B. Z. R. Yu, Eds.). Cambridge University Press. https://doi.org/doi:10.1017/9781009157896
IPCC. (2022a). Climate Change 2022: Impacts, Adaptation, and Vulnerability. Contribution of Working Group II to the Sixth Assessment Report of the Intergovernmental Panel on Climate Change (H.-O. Pörtner, D.C. Roberts, M. Tignor, E.S. Poloczanska, K. Mintenbeck, A. Alegría, M. Craig, S. Langsdorf, S. Löschke, v. Möller, A. Okem, & B. Rama, Eds.). Cambridge University Press.
IPCC. (2022b). Climate Change 2022: Mitigation of Climate Change. Contribution of Working Group III to the Sixth Assessment Report of the Intergovernmental Panel on Climate Change (P.R. Shukla, J. Skea, R. Slade, A. Al Khourdajie, R. van Diemen, D. McCollum, M. Pathak, S. Some, P. Vyas, R. Fradera, M. Belkacemi, A. Hasija, G. Lisboa, S. Luz, & J. Malley, Eds.). Cambridge University Press.
Jordan, K., Adams, P., Jaramillo, P., & Muller, N. (2023). Closing the Gap: Achieving U.S. climate goals beyond the Inflation Reduction Act. Renewable and Sustainable Energy Transition, 4, 100065. https://doi.org/10.1016/j.rset.2023.100065
Sinha, A., Venkatesh, A., Jordan, K., Wade, C., Eshraghi, H., de Queiroz, A., Jaramillo, P., Johnson, J. Diverse Decarbonization Pathways Under Near Cost-Optimal Futures, 02 December 2023, PREPRINT (Version 1) available at Research Square [https://doi.org/10.21203/rs.3.rs-3678640/v1]
Teichgraeber, H., & Brandt, A. R. (2019). Clustering methods to find representative periods for the optimization of energy systems: An initial framework and comparison. Applied Energy, 239, 1283–1293. https://doi.org/10.1016/j.apenergy.2019.02.012
TEMOA. (2021). Tools for Energy Model Optimization and Analysis (TEMOA). https://TEMOAcloud.com/ TEMOAproject/ TEMOA. (2022). GitHub - TEMOAProject/TEMOA: Tools for Energy Model Optimization and Analysis. https://github.com/TEMOAProject/TEMOA
Venkatesh, A., Sinha, A., & Jordan, K. (2022). GitHub TEMOAProject/oeo: Open Energy Outlook for the United States. https://github.com/TEMOAProject/oeo
Venkatesh, A., Jordan, K., Sinha, A., Johnson, J. X., & Jaramillo, P. (2022). An Open Energy Outlook: Decarbonization Pathways for the USA. Open Energy Outlook Initiative. https://www.cmu.edu/energy/key-initiatives/open-energyoutlook/oeo-report-2022.html
The Open Energy Outlook (OEO) Initiative is a collaboration between the Scott Institute for Energy Innovation at Carnegie Mellon University and North Carolina State University. The Sloan Foundation and the Scott Institute provided invaluable seed funding to support this initiative.
What is the Open Energy Outlook Initiative? The OEO Initiative examines the technologies and policies influencing U.S. energy futures, simulating energy technologies deployments, sources, costs, and respective emissions associated with meeting energy demands. We conduct rigorous research using open-source models that promote transparency, accessibility, and replicability. We also collaborate with diverse stakeholders to identify consensus-based strategies to meet energy and climate goals.
Why do we need energy systems models? Energy systems are complex, involving millions of interconnected technologies influenced by markets, policy, and consumer and firm behavior. Energy systems models excel at capturing technology performance and interconnectedness under different policy designs. Results provide robust insight into the costs, risks, and tradeoffs of alternative energy futures. Evaluating strategies to reduce the impacts of climate change is an exemplary model application.
How does OEO conduct analyses? OEO maintains a database describing 3,000 end uses and 80,000 processes shaping the U.S. energy system. Employing the Tools for Energy Model Optimization and Analysis (TEMOA), the team builds models that simulate the least-cost set of energy sources and technologies that meet future demands, emission goals, and other potential criteria of interest.
What makes TEMOA/OEO different? TEMOA and OEO are both fully “open” and freely available on GitHub. An academic review of 31 open-source models found TEMOA among the best for long-term energy systems planning (Groissböck, 2019). Most competing models assume a fixed set of future end-use technologies, limiting opportunities to identify beneficial fuel switching (e.g., electrification). TEMOA stands out by selecting end-use technologies dynamically. TEMOA has the capability to model the entire energy system, including energy source extraction, fuel transportation and storage, electrification, and energy consumption in buildings, transportation, and industry. TEMOA can also model uncertainty and variability, making it a more robust decision support system. Importantly, OEO is more than just a model. OEO is an initiative committed to transparency, replicability, and building a user community. We published our first Open Energy Outlook report in 2022.
What kinds of scenarios are evaluated by TEMOA/OEO? Recent or ongoing OEO studies include simulations of net zero emissions pathways, estimating the impacts of the Inflation Reduction Act, exploring alternatives for incentivizing hydrogen, and simulating a carbon price. We are also applying novel techniques to identify near leastcost strategies to achieve Net Zero emissions to introduce flexibility into decarbonization decisions.
Could you benefit from OEO? Climate change and decarbonization introduce deep and new uncertainties into the decisions made by diverse stakeholders. The stakes are particularly high for organizations like energy utilities, clean energy and end-use technology companies, non-governmental organizations, policymakers, and large energy users. The OEO framework offers lots of possibilities for related analysis. We are actively seeking members to join our corporate partnership. Contact OEO at mfb@andrew.cmu.edu if you are interested.
We are also always eager to collaborate with others that can complement our work. While least-cost energy transitions provide an important guidepost, they are not always realistic. Achieving our energy and climate goals requires understanding which energy transition pathways are feasible and acceptable, to whom, and why. We are particularly interested in collaborations related to labor, equity, material flow analysis, behavior, and risk analysis.
Who supports OEO? The Sloan Foundation provides financial support for OEO. We also appreciate the support from and collaborations with staff and faculty at the Wilton E. Scott Institute for Energy Innovation at Carnegie Mellon University.
How can I learn more? Learn more about OEO by visiting our website at www.openenergyoutlook.org. Our website lists our staff, profiles our blog, and includes other details related to OEO.
This report was written by:
Paulina Jaramillo, Carnegie Mellon University
Jeremiah Johnson, North Carolina State University
Aditya Sinha, North Carolina State University
Cameron Wade, Sutubra Research
Katherine Jordan, Carnegie Mellon University
Mike Blackhurst, Carnegie Mellon University
Jeff Hyink, Western Spark
Anderson de Queiroz, North Carolina State University
I Daniel Posen, University of Toronto
The authors are solely responsible for the contents of this report.
A special thank you to Joseph DeCarolis, who is the original developer of TEMOA and was an original Co-PI of the Open Energy Outlook Initiative. Joe is a professor at North Carolina State University and is currently on leave as Administrator of the Energy Information Administration. The contents of this report do not represent Joe’s views and are the sole responsibility of the report authors.
OEO invites leaders from industry, government, and nonprofit organizations to join our corporate partners. Partners will shape the future of energy in the U.S. by:
• planning energy transitions that meet environmental and other societal goals;
• identifying strategies to integrate new technologies and sources into energy systems;
• exploring relationships between energy policy and technology; and
• democratizing understanding of energy system operations and modeling; and devising least-cost pathways to meet U.S. energy demands.
Partners will have access to the following benefits:
• sponsor recognition through select OEO products;
• participation in the annual OEO Initiative meeting and other period events;
• early access to OEO Initiative publications;
• opportunities to author blog articles on the OEO website;
• individualized visits to the Wilton E. Scott Institute for Energy Innovation; and
• opportunities to participate in OEO ideation activities that could facilitate targeted sponsored research.
Contact mfb@andrew.cmu.edu to learn more.
