Oglala Lakota College
Enrollment Management Plan: Recruitment, Retention, Persistence, & Completion
Working Document
May 8, 2023
2 Table of Contents List of Tables .................................................................................................................................. 3 List of Figures ................................................................................................................................. 3 INTRODUCTION 4 Oglala Lakota College Retention History ................................................................................... 4 Ongoing progress 9 ENROLLMENT MANAGEMENT DEPARTMENT, COMMITTEE & STAKEHOLDERS ... 13 Enrollment Management Director Responsibilities .................................................................. 13 Student Success Committee 13 Current Student Success Committee members ......................................................................... 13 CHALLENGES IN RECRUITMENT, RETENTION, PERSISTENCE, AND COMPLETION 15 Recruitment and Student Attraction 18 Persistence ................................................................................................................................. 19 Retention ................................................................................................................................... 21 Completion 22 ENROLLMENT MANAGEMENT APPROACH ....................................................................... 23 WOLAKOLKICIYAPI CONCEPTUAL FRAMEWORK MODEL ....................................... 25 DEFINITIONS, METHODS AND ANALYSIS 27 Recruiting and Attracting Students........................................................................................ 27 Retention ................................................................................................................................ 28 Persistence 30 Graduation Rates ................................................................................................................... 31 STRATEGIC ACTION PLAN ..................................................................................................... 33
3
Table 1: OLC 4-, 6-, and 8-Year Graduation Rates as reported to IPEDS ..................................... 6 Table 2: OLC 2-, 3-, and 4-Year Graduation with Associate Degree 6 Table 3: Factors Affecting Student Success: 2013 and 2022 11 Table 4: OLC Logic Model for Analyzing Recruiting and Attracting Students 28 Table 5: OLC Logic Model for Analyzing Retention 29 Table 6: OLC Logic Model for Analyzing Persistence 30 Table 7: OLC Logic Model for Analyzing Graduation Rates 32 List of Figures Figure 1: Fall 2022 Enrollment by Gender and Class Code ......................................................... 15 Figure 2: Fall 2022 Enrollment by Age ........................................................................................ 16 Figure 3: Marital Status by Tribal Enrollment Status - Fall 2022 ................................................ 16 Figure 4: Median Annual Household Income - Fall 2021 Students ............................................. 17 Figure 5: Percentage of Fall 2021 Students Categorized as Low Income (based on household income and number of household members) ................................................................................ 17 Figure 6: Enrollment in Math 093 Basic Math II and RW 093 Reading and Writing II by Academic Year 17 Figure 7: Entering Freshmen by Academic Year (Summer-Fall-Spring) 19 Figure 8: Semester-to-Semester Persistence of Degree-Seeking Students 20 Figure 9: Cohort Persistence: Percentage of Students Still Enrolled or Graduated 21 Figure 10: Fall-to-Fall Retention of Entering Freshmen by Degree Level and Enrollment Intensity 22
List of Tables
INTRODUCTION
The need for an Enrollment Management Plan and Policy was reaffirmed by the Enrollment Management Committee in August of 2013. The Enrollment Management Plan and Policy was determined as the best course of action for Oglala Lakota College, to ensure that all components of recruitment, enrollment, persistence, retention, and completion are addressed and continually reviewed. Thus this plan remains a working document. The Enrollment Management Policy is:
Enrollment Management Policy
Oglala Lakota College will develop, implement, monitor and evaluate a comprehensive enrollment management plan that includes student recruitment, retention, persistence, and completion. The Oglala Lakota College implements enrollment management through a holistic approach that fully embraces student recruitment, persistence, retention, and completion.
This document will provide a history of Oglala Lakota College’s retention efforts, review of ongoing progress, current challenges, and Enrollment Management approach.
Oglala Lakota College Retention History
In 1971, Oglala Lakota College was established as a chartered organization under the Oglala Sioux Tribe to provide quality education to the Lakota people. The Oglala Sioux Tribe believed that “Lakota control of education is also control of its destiny” (OLC, 2001). The application of Tribal Sovereignty through education for tribal members by tribal members has been a guiding principle in the Tribal College Movement. With this understanding, Oglala Lakota College was intentionally designed with an open door policy and a decentralized system to ensure equal opportunity and access for native and nonnative people on the Pine Ridge Reservation and surrounding communities.
From the time of inception, Oglala Lakota College has provided a wide range of educational opportunities from community service offerings, various certificates, to undergraduate and graduate degrees (OLC mission 2006). These efforts called for specific strategies to build a more rounded student emphasizing the four purposes of OLC to meet diverse needs: tribal, academic, culture and community.
The Oglala Lakota College vision and mission were enhanced in 2012 as part of continuous improvement practices to better address the needs of our stakeholders. The vision of Oglala Lakota College is to Rebuild the Lakota Nation Through Education. The Oglala Lakota College mission is to educate students for professional and vocational employment opportunities in Lakota country. The College will graduate well-rounded students grounded in Wolakolkiciyapi-learning Lakota ways of life in the community-by teaching Lakota culture and language as part of preparing students to participate in a multicultural world.
4
Oglala Lakota College is tailored to support student success by providing a college center in each district to deliver higher education opportunities closer to the student rather than expecting the student to go to the higher education facility such as a central campus. Each district center is rooted within the community to adhere to the social context of the community, and to meet the student’s geographical and socioeconomic needs by providing ease of access and an intimate studentcentered environment.
The decentralized college system complements the Lakota social organization and the structure of the Oglala Sioux Tribe. The Oglala Sioux tribe has nine districts that make up the Pine Ridge Indian Reservation. However, Oglala Lakota College has expanded the delivery of services to include urban native communities and the Cheyenne River Sioux Tribe. The decentralized organizational structure consists of one main campus Piya Wiconi, and eleven district centers including Eagle Nest, East Wakpamni, LaCreek, Pahin Sinte, Pass Creek, Pejuta Haka, Pine Ridge, Oglala, Wounded Knee, HeSapa, and Cheyenne River.
Student retention, persistence and completion is thus embedded within this unique social structure of Oglala Lakota College. Therefore, the focus of recruitment, retention, persistence, and completion is concentrated within our district centers. Consequently, it is a priority for each of our center directors and counselors to facilitate retention efforts by working directly and individually with students. Activities by center staff include follow up with students when classes are missed as well as nurturing and mentoring. OLC has determined that an immediate individualized approach is necessary to have immediate impact on student retention (Levitz, Beth, & Richter, 1998). This allows for rapid interventions by district staff. These processes are reliant on personal relationships, are essentially informal and therefore have not been historically documented in a formal written retention plan. Although not formally reported, Oglala Lakota College has made efforts in student success since 1993, beginning with the Guide to Creating Student Success: in classes we know and love.
In 2004 Oglala Lakota College participated in the Building Engagement and Attainment for Minority Students (BEAMS) initiative that resulted in the development of a model that targeted retention as one of the four critical areas identified to “have a positive impact on students at the college” (DelRios & Leegwater, 2008. pg.41). The four critical areas were: student recruitment, advising and mentoring, retention, learning outcomes, and faculty development.
In 2005 the Faculty Development Committee conducted an online survey of OLC faculty to determine priorities and identify issues in relation to student learning. The response rate was “slightly under half of the full-time faculty responded to the survey” (OLC Bush Grant, 2005). The results of this survey are listed below:
In 2005 OLC completed a fact book that reflected a six-year graduation rate of 3.8% and a retention rate of 13.5% to represent the years of 1999-2005. The low graduation rate sparked the development of retention strategies to increase the graduation rates.
5
The following table provides a four, five, and six year graduation/retention cohort to establish a baseline rate for the Oglala Lakota College in 2005. Retention rates for entering freshmen from a six year cohort (1999-2005) indicate the graduation rate was 3.8% in 2005. The current average graduation rate is 12% (see page 10 for table).
Table 1: OLC 4-, 6-, and 8-Year Graduation Rates as reported to IPEDS IPEDS Cohort
6 years: Transferout
Exclusions:
Table 2: OLC 2-, 3-, and 4-Year Graduation with Associate Degree
(FT)
6
Year # of EF FullTime BA/BS-
cohort Graduated
2009 91 1 (1%) 5 (5%) 6
not available
2010 68 4 (6%) 5 (7%) 8 (12%) not available
available 2011 95 0 (0%) 2 (2%) 5 (5%) 11 (12%) 1 (1%) 2012 99 0 (0%) 6 (6%) 7 (7%) 13 (13%) 14 (14%) 2013 82 1 (1%) 4 (5%) 5 (6%) 7 (9%) 5 (6%) 2014 70 0 (0%) 2 (3%) 3 (4%) 11 (16%) 10 (14%) 2015 61 (1 exclusion*) 0 (0%) 4 (7%) 12 (20%) 13 (21%) 2016 49 0 (0%) 2 (4%) 10 (20%) 9 (18%) 2017 46 0 (0%)** 2018 57 1 (2%)**
yet reported to IPEDS
degree-seeking
in 0-4 years –BA/BS Degrees Only Graduated in 0-6 years –BA/BS Degree Only Graduated in 0-8 years – BA/BS Degree Only Status after 6 years: still enrolled Status after
(7%)
not available
not
*
Student deceased ** Data not
Fall EF AA/AAS Cohort
100% - 2yrs 150% - 3yrs 200% - 4yrs N # % # % # % 2009 134 1 1.0% 6 4.0% 12 9.0% 2010 115 0 0.0% 5 4.0% 8 7.0% 2011 85 1 1.0% 2 2.0% 3 4.0% 2012 74 0 0.0% 3 4.0% 3 4.0% 2013 103 0 0.0% 1 1.0% 6 6.0% 2014 47 0 0.0% 3 6.0% 5 11.0% 2015 47 1 2.0% 4 8.7% 6 13.0% 2016 29 1 3.4% 4 13.8% 5 17.2% 2017 37 0 0.0% 7 18.9% 11 29.7% 2018 36 0 0.0% 0 0.0% 3 8.3% 2019 45 0 0.0% 0 0.0% 2020 22 0 0%
The BEAMS initiative prompted the enhancement of the 2005 OLC student handbook and at the same time a 2005 retention plan was developed to focus on student retention issues such as travel, child care, personal issues, faculty involvement, and academic problems.
To complement the student initiatives, an OLC Faculty Handbook (revised 2020), and a culturally based faculty orientation, and faculty development sessions were created. The faculty orientation helped to guide faculty on differing methods of incorporating the Lakota perspective within the class room. In addition, Oglala Lakota College has conducted faculty development training sessions each semester, which is a practice that continues into the present day. Faculty handbooks, orientation, and development training sessions provide a strong foundation and common understanding throughout the college community regarding recruitment, persistence, retention, and completion.
In 2006 Oglala Lakota College created and piloted a Quality Enhancement Plan (QEP). The QEP was implemented in 2007. The vision of the quality enhancement plan was:
Vision: OLC will excel in recruiting, retaining and graduating students
Mission: OLC will develop and implement a comprehensive recruitment, retention, and completion plan.
Project Goals:
Goal 1: Develop student recruitment plan
Goal 2: Develop student retention ideas
Goal 3: Organize faculty and student orientation training
Goal 4: Brainstorm strategies for successful student completion/graduation
OLC selected several instruments to measure the effectiveness of the QEP goals for student engagement and retention including: National Survey of Student Engagement (NSSE) administered in 2005, Student Advisory Committee (SAC) survey administered in 2006 and 2008, Collegiate Assessment of Academic Proficiency (CAAP) administered every spring semester for sophomores and exiting seniors, retreat surveys administered each year, Integrated Postsecondary Education Data System (IPEDS) submit four times yearly, and Holistic scoring of student writing administered each semester from the 1990’s to the spring of 2011.
OLC utilized NSSE and SAC data sets as performance measures in directing the four project goals. SAC data collected for 2006 and 2008 revealed that students viewed center counselors as key personnel who are most helpful during their college career (27% for 2006 and 29% for 2008). Faculty and family were identified as equal factors in student success (20% in 2006, 28% in 2008).
Based on these results OLC identified advising as a critical component in long-term retention.
7
Oglala Lakota College implemented and continually reviewed the general education curriculum to measure student learning. Through continual review, Oglala Lakota College has changed the general education measuring tools, and is currently using the Proficiency Profile.
In 2006, Oglala Lakota College identified that “Less than half of OLC’s students come to us with the skills they need to be successful in college. Moreover, OLC serves a large number of nontraditional students who need refresher courses and students whose primary language is Lakota who may need English language instruction. To address this need for specialized development of basic academic skills, OLC has launched a pre-emptive testing and placement program in reading, writing, and math” (OLC Bush Grant, 2006). In 2006, the Foundational Studies Department was created to assist with developmental education to oversee and institutionalize this process and administer placement testing such as Accuplacer.
Through these steps, Oglala Lakota College continued to stand by their belief that the teaching and learning process must continue to improve in order to increase OLC’s student retention rate. Therefore, Oglala Lakota College wrote a grant to the Bush foundation to support faculty development in the areas of retention. “OLC faculty’s primary role in the retention program will be to focus on improving retention at the Course level. We will target our efforts to enhancing developmental programs and engaging faculty across the institution in a continuous effort to reinforce students' recently acquired core competencies” (OLC Bush Grant, 2006, pg. 3.)
The Faculty Development Committee has remained active and is funded through the Instructional Division office. Faculty members are provided financial support to receive terminal degrees, and professional development in teaching and advising. Faculty members attend instructional division meetings and faculty retreats. Faculty retreats focus on pedagogy while instructional division meetings focus on administrative tasks. Department chairs, center directors and counselors attend divisional meeting which are held annually and consist of procedural and policy updates. In addition, all staff meetings are held on a monthly basis at the main campus.
Faculty development, staff development, student support services, and financial aid opportunities have contributed to a 7% increase in graduation rates from 2005-2010. However, the Graduation Rates have remained constant at 12% for the past two years.
In 2008, Oglala Lakota College identified a need to motivate OLC community toward institutional vision” to address the need to work together and guide students in their Wolakolkiciyapi experience meaning Learning Lakota Ways of Life in community. Oglala Lakota College BEAMS Team created an Action plan with the following priorities;
Priority1. To develop an annual action plan for faculty development related to Wolakolkiciyapi development within class content.
Priority 2. To develop an out of classroom plan for student and faculty interaction as a part of OLC Community life.
Priority 3. Disseminate information about commitment to Wolakolkiciyapi
8
Priority 4. Provide orientations and orientation materials for all students and faculty.
During the 2009-2010 academic year a Student Advising Committee was proposed as a separate standing committee, but was determined at the time to be most effective as a subcommittee under the Instructional Affairs committee. Today, retention continues to be an integral part of the college, but has grown to encompass other critical areas that affect retention, such as recruitment, enrollment, persistence and completion.
With the implementation of baseline recruitment, retention, and persistence efforts in place, academic departments shifted to focus on strengthening programs of study and assessment activities between 2010 and 2013.
2014-2022
-Transportation System (Gas vouchers)
-Meals program
-CARS and CARF (Foundational Studies)
-Textbook Loan program (students who couldn't get PELL)
-Additional scholarships
-Attendance initiative
-Encouragement Incentive
-Max-Pell/LEU Scholarships
- Cares Act Payments
-Orientations (College Wide - 2017)
Ongoing progress
Oglala Lakota College continues to advance their previous work to include recruitment, have a strong focus on retention and persistence in order to increase the overall graduation rate.
Admissions activities take place in each of the eleven college centers. Formerly, students would fill out the “Application for Registration” form, which included demographic and course registration information for the semester. These forms were then sent to the registrar’s office for processing. Students also provided HS/GED transcripts, degree of Indian blood, college transcripts, social security card, and completed placement testing. The Registrar’s Office entered the information in Jenzabar, including the students’ courses and add/drop card information through the third week of classes. The Registrar then printed class lists and faxed them to district centers so that the center staff and faculty would have updated class lists.
Beginning in 2005-2006, with the new retention efforts, Oglala Lakota College began to use the JICS online system associated with Jenzabar, which changed the registration process for all students. The application was updated so that more demographic information was captured and students were then able to register online.
This change in process created a new awareness of pre-requisites and placement testing policies. Oglala Lakota College then started monitoring prerequisites and placement tests and updated
9
policies so that the process would work. At this time, advising also became a large focus. Faculty were provided with training and began advising students with more emphasis on degree completion.
Formerly, scheduling was completed manually. District centers allowed students to fill out a survey course form and entered names on hardcopy class lists at the center. The JICS system changed that process. Students began enrolling online, and faculty and counselors also enrolled students online. Early registration was implemented as part of the retention efforts. Scheduling needs also changed during this time. A policy was created with scheduling timelines and procedures. The policy provided deadlines for the proposed schedule, addition of full-time faculty to the schedule, addition of adjunct faculty to the schedule, and for the final schedule. The final schedule is then entered in Jenzabar and pre-registration is opened. Various other rules were also updated, such as time limitations for transferring classes and the degree audit.
In 2013 the Oglala Lakota College determined that an enrollment management process needed to be developed to further enhance previous retention initiatives. In July of 2013 an Enrollment Management Director position was created. In August of 2013 an Enrollment Management Director was hired and a Enrollment Management Committee was formed to oversee and ensure a reliable process that meets Oglala Lakota College student needs. The Enrollment Management Committee revised its name to Retention Committee and as of 2023, this committee is now known as the Student Success Committee.
In the Fall 2013, the Enrollment Management Director conducted informal focus visits to all eleven district centers and interviewed the Center Staff, within a one-week period. The purpose of the focus visit and interviews was to document and determine past and current retention practices of the Oglala Lakota College Centers. Data was gathered using qualitative strategies: observation notes, interview notes, and a review of existing student orientation and admission packet materials. Content analysis strategies were used to identify common priorities within all eleven district centers. The findings of the focus visits and interviews suggest several factors that affect student retention, persistence and completion. These factors include personal, institutional, and program elements that will be emphasized within the current Enrollment Management Plan.
OLC plans to develop and implement focus groups for students, staff, and faculty that will be conducted annually to gauge the progress and outcome of programs, services, and overall academic success for students. This was planned and scheduled to be conducted prior to COVID-19 halted due to the pandemic. In Spring 2022, however, OLC reached out to current and former degreeseeking students (Fall 2019-Spring 2022) to ask them about factors that made it difficult for them to complete a semester or to re-enroll the next term, as well as about factors that helped them succeed. This Student Support Survey was completed by 207 students. Table 3 summarizes factors affecting student success in 2013 (in the view of center staff) and in 2022 (student view).
10
Table 3: Factors Affecting Student Success: 2013 and 2022
2013 Factors
Challenging Student Success (center staff view)
Personal factors
1. Lack of financial resources
2. Housing insecurity; homelessness
3. Lack of childcare
4. Lack of transportation
5. Lack of college readiness
2022 Factors Challenging Student Success (students’ view)
2022 Factors Supporting Student Success (students’ view)
Institutional factors
1. Inconsistent delivery of mentoring and tutoring services for success in core requirements of English and Math
2. Scheduling
3. Course offerings
1. Lack of resources (45): Lack of financial resources (20), lack of childcare (12), lack of transportation (8), lack of time, lack of access to technlogy, lack of family support, homelessnes
2. Physical and mental health of student and family (33): Health issues family members (17), Health issues students (11), Mental health issues (9)
3. Employment obligations (28): Job demands (26)
4. Family or personal issues (24): issues not specified, domestic violence, uncpredictable events
5. Family obligations (22): Raising children, homeschooling, single parenthood
6. Other (21): Lack of effort (7), lack of study and time management skills (5), lack of motivation (4), distractions (3)
1. Detrimental policies: academic probation and suspension; Service Area Residency; loss of financial aid after bad semester (7)
2. Lack of in-person classes (3)
3. Other: Challenging requesting support due to information overload; lack of DL in the past; OLC not a “real” college (3)
Program factors 1. Inconsistent advising 1. Course scheduling issues: Course locations, conflicting
1. Motivation (58 mentions)
2. Family support (29)
3. Dedication, effort (16)
4. Resources (12): Having own transportation, being employed, support by employer, not being employed/having time
5. Skills (11): Study skills, time management, being able to focus, communicating well with counselors and faculty
1. Availability of distance learning: no childcare or travel needed, compatibility with work schedule (51)
2. Financial support (32): Cares Funding, scholarships
3. Technology access provided by OLC (16)
4. Staff support and encouragement (9)
5. Tutoring and mentoring (8)
6. In-person classes (6)
1. Faculty support and encouragement, Department
11
College center factors
2. Lack of clear program expectations and objectives of degree program
3. Lack of program handbook for students
4. Ineffective methods of instruction
with work schedule, impossibility to travel to different location by 5pm (4)
2. Expectations too high: Deadlines too strict, difficulty catching up (3)
3. Lack of faculty support (3)
4. Low quality of instruction: Lack of instructor presence, Syllabus and Moodle not matching (3)
support, Caring about students (48)
2. Faculty (no further explanation) (12)
3. High-quality instruction (11): Substantive interaction, substantive feedback, clear expectations, interesting classes, sending reminders
4. Course scheduling (8): Offering evening classes, GRCs, increased local availability of required courses
1. Center staff discouraging enrollment (2)
2. Incorrect guidance from center staff (1)
1. Center staff support and encouragement (31)
2. Center staff (no further explanation) (6)
3. Center staff providing information (3)
4. Other (3): cultural activities, study space, genuine interest in students
Oglala Lakota College adopted an enrollment management policy, implemented an Institutional Effectiveness Model, and developed an Enrollment Management Plan to support student success and meet the Higher Learning Commission Criteria. Oglala Lakota College will continue to follow their promising practices which include an immediate individualized approach and long term planning. One example of the immediate individualized approach is the Early Alert System, which was piloted in Fall 2013. Early Alerts are required to be activated based on student attendance, grades, and general status of a student if a concern should arise. Faculty are required to submit an early alert notification for attendance if a student misses one or two classes. Students are to be dropped from courses after missing three consecutive or five scattered scheduled classes. Early alerts are also supposed to be issued for grades when a student does not turn in assignments or their course work puts them in a “fail” stage. Once alerts are issued by the faculty, the Enrollment Management Office assigns them to a counselor who then works with the instructor and student to formulate a plan.
The immediate individualized approach proved to have some benefit over the years. For the past 10 years, an average of 217 new entering students enrolled each academic year, for the past 3 years, 49% of entering freshman continued to enroll in the second academic year, and OLC has produced an average of 142 graduates per year over the past 7 years.
12
ENROLLMENT MANAGEMENT DEPARTMENT, COMMITTEE AND STAKEHOLDERS
All academic and nonacademic units share the responsibility for student success.
Enrollment Management Director Responsibilities
Oglala Lakota College has an Enrollment Management Director (EMD) who reports to the College President and has the primary responsibility for documenting, maintaining, and assessing a comprehensive enrollment management plan for retention, persistence and completion at Oglala Lakota College. The Enrollment Management Director coordinates institution-wide retention programs and activities, interfacing with academic and nonacademic programs and other service areas across the OLC. The EMD oversees and evaluates district College Center Directors and district operations under the direct supervision of the President. The EMD develops and implements the plan and provides reports to the Student Success Committee.
Student Success Committee
The Student Success Committee reviews and oversees all aspects of enrollment management: recruitment, retention, persistence, and completion. They develop policies and procedures relevant to enrollment management, review and recommend actions based on annual data and institutional performance; collaborate with institutional stakeholders and other committees. The policy and procedure are channeled through the governance system of Oglala Lakota College. The committee consists of a diverse group of faculty, staff, and Chairs across the institution. The Vice President of Instruction and Director of Institutional Research and Assessment serve on this committee.
Current Student Success Committee members
Megan White Face, MSE, Enrollment Management Director
Susanne Auer-Osborn, Director of Institutional Research & Assessment
Karla Witt, MS, Vice President of Instruction
Jonnie Clifford, BS, Assistant to Vice President of Instruction
Marry Monroe, MBA, Business Department Chair
Thedna Zimiga, BS, Foundational Studies Department Chair
Lena Goings, MA, Pine Ridge Center Director
Avanelle No Braid, BS, Pahin Sinte Center Director
Jackie Alcantar, MA, He Sapa Center Director
Alec Knight, BS, Cheyenne River Center Director
Stepahnie Sorbel, BS, Pejuta Haka Center Director
Monica Spider, BSW, Pahin Sinte Counselor
Don Giago, BS, EAP Director/Coordinator of Student Affairs
Anthony Barajas, AA, Registrar
Bobbi White, MS,Wellness Coordinator
13
The following grants and programs have been implemented between 2014 and 2022 and contribute to student retention, persistence, and completion rates:
- CNSS Grant
-MST - National Science Foundation PEEC (ended)
-Woksape (ending this year) MST
-Tribal Colleges Equity grant
-Speak with chairs to get grant information
-GED grant - Kellog Dollar Grant
-Iwankapiya Grant (2015) - Monique Apple
- WOUNSPEKIYA UNSPEWICAKIYAPI: NATIVE TEACHER EDUCATION; American Indian College Fund; MAY 1, 2022 TO MAY 31, 2024 (Pre-Education and State Certification strategies directly related to Praxis teacher licensure exams);
- Waonspekiya Waste 21-26 (Wah ohn’ spay kee ya Wash dtay') Good Teachers; US DOE Office of Indian Education Program - Indian Professional Development Program; Oct 1, 2021 - Sept 30, 2026 (Designed to support 12 juniors and seniors to complete their program, become licensed teachers, be placed in schools as teachers, and receive induction support during the project period); and
-Waonspekiya Waste (Good Teachers) 2023 Preservice Teacher Development; US DOE Office of Indian Education Program - Indian Professional Development Program; Oct 1, 2018 - Sept 30, 2023 (Same as above except focused on preparing 12 special education teachers and included certified teachers working towards licensure in special education. We only had 1 undergraduate in the project).
-During the last 10 years we also had the following US DOE Office of Indian Education, Indian Professional Development Projects (supporting juniors and seniors in completing their degrees, becoming licensed and placed in Pk-12 classrooms, and receiving induction support):
1) Waonspekiya Waste (Good Teachers) 2020; 10/01/2016 - 09/30/2020; (Designed to support 18 participants); and
2) Waonspekiya Waste (Good Teachers) 2017; 7/1/2013 - 6/30/2017 (Designed to support 15 participants).
-Add synopsis, link to grant, or appendix for each grant to show where we are at instead of explaining them all.
-Center wide orientations, college wide, department wide orientations need to be added.
14
CHALLENGES IN RECRUITMENT, RETENTION, PERSISTENCE,
AND COMPLETION
Oglala Lakota College has had success since the implementation of the BEAMS initiative and Student Advisory Committee from 2005- 2010. A qualitative study of district centers found students dealt with personal, institutional and program factors. Personal factors include financial resources, housing, childcare, and transportation problems and also a lack of college readiness. Institutional factors include inconsistent delivery of tutoring and mentoring services, scheduling, and inconsistent course offerings. Program factors include inconsistent advising, vague or absent program expectations, and methods of instruction.
The decline in Foundational Studies pass rates in reading and writing, inconsistency in Foundational Studies Math pass rates from 2009 to 2012, student demographics, overall low retention rate, low persistence rate in lower and upper division courses and stagnant graduation rates for three years frames the challenges for student success at Oglala Lakota College. In addition, Oglala Lakota College provides services in a decentralized system that must meet the cultural context of student’s family, community, spirituality, and tribal commitments.
Oglala Lakota College, like other Tribal Colleges, has a unique student population. In Fall 2022, 1,136 of 1,177 students (97%) were Native American, and more than two-thirds (830, 71%) were female (Figure 1).
Figure 1: Fall 2022 Enrollment by Gender and Class Code
15
90% 51% 69% 69% 73% 75% 79% 78% 10% 48% 30% 31% 26% 25% 21% 22% 0% 1% 1% 0% 0% 0% 0% 0% 0% 10% 20% 30% 40% 50% 60% 70% 80% 90% 100% Female Male Other
Figure 2: Fall 2022 Enrollment by Age
Figure 3 shows the marital status of Fall 2022 students by tribal enrollment status. Close to half of the tribal members reported that they are single with dependent children (45%). Among non-tribal members, only 22% are single with dependent children (OIRA).
Figure 3: Marital Status by Tribal Enrollment Status - Fall 2022
Figure 4 illustrates the median annual household income of Fall 2021 students disaggregated by gender and ethnicity (American Indian or Alaska Natives (AIAN) vs. Non-Natives (all other ethnic groups) (OIRA). The median is used instead of the average to limit the impact of outliers (50% of students have a lower income, 50% have a higher income). Non-Native students have a higher median household income than Native students. Income data was unavailable for 86 of 1,451 Fall 2021 students. Almost three of four Native Fall 2021 students fell into the low-income category as defined for TRIO programs by the U.S. Department of Education (Figure 5).
Many of OLC’s students require remedial coursework in Reading/Writing and/or Math. However, the number of students enrolling in the remedial courses decreased in the past ten years, first in Math, then in Reading/Writing (Figure 6).
16
9% 25% 17% 27% 14% 6% 2% 0% 10% 20% 30% 40% 50% 19 or younger 20-24 25-29 30-39 40-49 50-59 60 or older 1% 10% 44% 45% 4% 29% 44% 22% 0% 20% 40% 60% 80% 100% Married - No Children Married - With Children Single - No Children Single - With Children Enrolled
Not Tribal
Tribal Members (N=1119)
Member (N=45)
Figure 4: Median Annual Household Income - Fall 2021 Students
$30,000
$25,000
$20,000
$15,000
$10,000
$5,000
$-
Figure 5: Percentage of Fall 2021 Students Categorized as Low Income (based on household income and number of household members)
Figure 6: Enrollment in Math 093 Basic Math II and RW 093 Reading and Writing II by Academic Year
17
$20,505 $18,380 $18,350 $26,673 $23,863
AIAN Female (N=933) AIAN Male (N=367) AIAN Other Gender (N=5) Non-Native Female (N=39) Non-Native Male (N=21) 74% 73% 100% 65% 57% 0% 20% 40% 60% 80% 100% AIAN Male (N=329) AIAN Female (N=850) AIAN Other (N=4) Non-Native Male (N=20) Non-Native Famale (N=35) 2011-12 2012-13 2013-14 2014-15 2015-16 2016-17 2017-18 2018-19 2019-20 2020-21 2021-22 2022-23 Fa only Math 093 249 225 225 163 167 123 103 93 104 102 115 39 RW 093 174 154 175 154 191 204 207 204 90 84 95 37 0 50 100 150 200 250 300 Math 093 RW 093
COVID -19= Outreach was limited
Changes in the Foundational Studies structures - CARS/CARF, 093 sections are the only point of entry courses.
Voluntary vs. Mandatory activities. How do we get more involvement from students
Outreach to encourage students to do their admissions, registration, and other things like testing done in a timely manner.
Stressing deadlines is very important. We need to hold students accountable for deadlines.
Advertising is a big thing. How can we improve marketing here at OLC. What avenues can we pursue (marquee lights) can we get smaller ones for the buildings?
Persistence, retention and completion rates are lower among part time students and will need to be looked at.
Modes of delivery for classes and how that relates to warnings, probations, and suspensions. This also impacts how students approach classes in a zoom setting vs. face to face situations.
College Success course may be a valuable resource for students coming into college now. How do we put this back into class rotations and how do we get students to come to it if it’s a voluntary class.
How do we incorporate motivation and a sense of purpose for students? In classes, in a college success course, a series of meetings for students?
We need to reestablish the college mass orientation (preview days) with the high schools.
Recruitment and Student Attraction
Oglala Lakota College has an open-door policy and provides an equal opportunity for all students to succeed. Oglala Lakota College’s recruiting efforts have been historically informal using specific efforts and relying primarily on word of mouth to recruit Native American students from reservation communities and urban Native communities. Specific recruiting efforts include: fliers, advertisements in local and Native newspapers, local radio and television announcements, social media, and K-12 outreach including career fairs, STEM outreach programs, and financial aid information nights, library outreach programs, and athletics. However these specific efforts have been primarily at the program and district level.
18
Oglala Lakota College enrollment data indicates a consistent enrollment of new, first-time-incollege students (entering freshmen) between 2015-16 and 2019-20, followed by a decrease 202021, likely primarily due to the COVID-19 pandemic. The numbers recovered slightly in 2021-22, but are still below the usual.
Figure 7: Entering Freshmen by Academic Year (Summer-Fall-Spring)
Persistence
Oglala Lakota College views persistence as associated to student behavior; some challenges OLC students face are family and economic situations which cause them to stop out. Center staff play a key role in retention and persistence, since they have the most direct contact with the student population. Center staff advise and mentor students to address their personal factors and work closely with department chairs, faculty and administration to address the programmatic and institutional factors to ensure student success. Center staff maintain individual student files and track the student course needs for meeting degree requirements. Center staff coordinate community and college-based activities; including workshops to support student learning, foundation studies preparation sessions, financial aid workshops, and student orientation on a semester basis. Center staff participates in college-wide recruitment efforts at the local area high schools and job fairs.
Over the years Oglala Lakota College did not separate persistence from retention. The academic departments sporadically recorded attrition rates per semester; however, this data is sporadic and is found at the program level. The data was not analyzed to reflect the current institutional data on persistence. Institutional data for 6 year retention/persistence rates indicate that we need to separate the two factors and develop clear definitions to identify the quality of advisement, academic and social integration of students through their intent to persist within their degree.
The Office of Institutional Research and Assessment (OIRA) monitors persistence of students from one semester to another, both fall-to-spring and spring-to-fall. During the spring semester, the OIRA provides college centers and academic departments persistence data specific to their
19
410 270 220 206 212 222 206 108 169 146 0 50 100 150 200 250 300 350 400 450 2013-14 2014-15 2015-16 2016-17 2017-18 2018-19 2019-20 2020-21 2021-22 2022-23
unit. The units include and discuss that information in their annual reports. As Figure 8 shows, full-time students persist to the next semester at a much higher right than part-time students. Another pattern used to be that persistence from fall-to-spring was higher than spring-to-fall, though the Spring 2021 to Fall 2021 was an outlier.
8: Semester-to-Semester Persistence of Degree-Seeking Students
Fa16Sp17 Sp17Fa17 Fa17Sp18 Sp18Fa18 Fa18Sp19 Sp19Fa19 Fa19Sp20 Sp20Fa20 Fa20Sp21 Sp21Fa21 Fa21Sp22 Sp22Fa22
Additionally, OLC uses a cohort-based approach to look at what happens to students who start at the same time term after term. Figure 9 shows the Fall 2014 to Fall 2021 full-time entering freshmen cohorts and the percentage who were still enrolled or who graduated in the subsequent semesters.
20
Figure
All 66% 60% 70% 60% 69% 62% 66% 67% 70% 75% 71% 66% Full-time 73% 68% 79% 67% 78% 66% 75% 71% 78% 81% 81% 76% Part-time 55% 48% 54% 50% 56% 54% 52% 60% 61% 68% 63% 57% 0% 20% 40% 60% 80% 100% All Full-time Part-time
Figure 9: Cohort Persistence:
Percentage of Students Still Enrolled or Graduated
Fa14 (N=117)
Fa15 (N=111)
Fa16 (N=91)
Fa17 (N=83)
Fa18 (N=93)
Fa19 (N=99)
Fa20 (N=41)
Fa21 (N=69)
Fa14 (N=117)
Fa15
Fa17 (N=83)
Fa18 (N=93)
Fa19 (N=99)
Fa20
Retention
Retention rates are perceived as indicators of academic quality and student success. Retention rates are commonly measured as the percentage of freshman that re-enroll the next year as sophomores (TGSLC, 1999). Socio-economic factors and the open enrollment policy of OLC present challenges in cross-institutional comparisons of retention, as the typical OLC student is a single female with dependent children. However, retention of full-time bachelor’s-degree-seeking entering freshmen increased from 40% in Fall 2013-Fall 2014 to 66% in Fall 2021-Fall 2022 (Figure 10). As with persistence, part-time students are return the following fall at a lower rate than full-time students.
21
1 2 3 4 5 6 7 8 9 10 11 12 13 14 15 16 17
100% 68% 47% 43% 26% 30% 26% 26% 24% 23% 23% 19% 21% 19% 18% 16% 20%
(N=111) 100% 81% 54% 45% 42% 39% 32% 26% 29% 25% 28% 25% 28% 25% 27% Fa16 (N=91) 100% 77% 51% 54% 41% 36% 26% 26% 23% 26% 27% 25% 23%
100% 67% 57% 48% 45% 37% 37% 28% 30% 29% 25%
100% 81% 61% 51% 44% 38% 32% 28% 30%
100% 74% 55% 41% 34% 31% 25%
(N=41) 100% 80% 59% 46% 32%
100% 86% 62% 0% 10% 20% 30% 40% 50% 60% 70% 80% 90% 100%
Fa21 (N=69)
Figure 10: Fall-to-Fall Retention of Entering Freshmen by Degree Level and Enrollment Intensity
Entering Freshmen FT, BA/BS
Entering Freshmen FT, AA/AAS
Entering Freshmen PT, BA/BS
Entering Freshmen PT, AA/AAS
Completion
OLC has identified six types of students who apply for admission: special projects, non-degree seeking students, certification or recertification, internal transfer, external transfer, and a degree seeking. Students who apply to take a special projects course are not seeking a degree and need this for professional development or continuing education within their field. Organizations or affiliated institutions request special project courses to meet their institutional professional development needs specific to their staff or topic. Students seeking certification or recertification on an alternative educational track through their accredited body i.e. an individual who wishes to receive an endorsement in a concentrated area. Non-degree seeking students are seeking personal growth and development.
Graduation rates are calculated as the percentage of 1) for first-time entering, bachelor’s-degreeseeking students who complete a bachelor’s degree within 4-, 6-, 8-, and 10+ years (Table 1), and 2) for first-time entering, associate-degree-seeking students who complete an associate degree within 2-, 3-, 4-, and +4 years (Table 2). OLC tracks graduation rates over a longer period of time because our open door policy accommodates the diverse needs of our student population.
22
0% 10% 20% 30% 40% 50% 60% 70% 80% 90% 100% Fa13 - Fa14 Fa14 - Fa15 Fa15 - Fa16 Fa16 - Fa17 Fa17 - Fa18 Fa18 - Fa19 Fa19 - Fa20 Fa20 - Fa21 Fa21 - Fa22
ENROLLMENT MANAGEMENT APPROACH
The purpose of the enrollment management plan is to provide an empirically designed comprehensive and systematic enrollment management plan to attract, recruit, and retain students. The plan will connect academic and non-academic units together and connect the units to the Mission of the college. The plan will help create a sustained retention system that allows the units to track student success, persistence and retention. The results of the data will help to determine if the institutional strategies have been successful. The results of the data will help units develop strategies for improvement. In addition the results will help allocate resources to critical areas within the institution to support the student learning environment.
Oglala Lakota College defines enrollment management as a strategic and comprehensive approach that encompasses Oglala Lakota College’s unique vision, mission, and Institutional Effectiveness Plans of academic and non-academic units, to ensure that the data is used to obtain desired recruitment, retention, persistence, and graduation rates of students.
The Enrollment Management Plan guides the process through a combination of immediate action and short-term efforts to meet the needs of the current students. The outcome data will identify trends to help long term planning and establish appropriate performance indicators for future goals.
The contextual issues that surround tribal colleges are distinct in comparison to mainstream institutions. Peer reviewers for accrediting bodies find tribal colleges to be a challenge when “applying and interpreting the Eligibility Requirements and Criteria in the unique history, mission, culture and circumstances of the TCUs (HLC, pg. 3). Therefore, the common thread in higher education is the necessity to provide an empirically designed comprehensive and systematic enrollment management plan to attract, recruit, and retain students.
Oglala Lakota College strives to adhere to the guiding values of the Higher Learning Commission: 1) Focus on student learning 2) Education as a purpose 3) Education for a diverse, technological, globally connected world 4) A culture of continuous improvement 5) Evidence-based institutional learning and self-presentation 6) Integrity, transparency, and ethical behavior 7) Governance for the well-being of the institution 8) Planning and management resources to ensure institutional sustainability 9) Mission-centered evaluation and 10) Accreditation through Peer Review (HLC, 2013).
This enrollment management plan is aligned to and addresses criterion four: Teaching and Learning Evaluation:
Core Components
4.C. The institution demonstrates a commitment to educational improvement through ongoing attention to retention, persistence, and completion rates in its degree and certificate programs.
23
1. The institution had defined goals for student retention persistence, and completion that are ambitions but attainable and appropriate to its mission, student populations, and educational offering.
2. The institution collects and analyzes information on student retention, persistence, and completion of its programs.
3. The institution uses information on student retention, persistence and completion of programs to make improvements as warranted by data.
4. The institutions’ processes and methodologies for collecting and analyzing information on student retention, persistence, and completion of programs reflect good practice. (Institutions are not required to use IPEDS definitions in their determination of persistence or completion rates. Institutions are encouraged to choose measures that are suitable to their student population, but institutions are accountable for validity of their measures (HLC, 2013).
Oglala Lakota College determined that a twofold approach is the best and most effective way to enrollment management, considering our faculty, student, and resource capacity. The current promising practices for student recruitment, retention, and persistence will encompasses both approaches, the Immediate Individualized approach and the and longer term planning (Noel, Levitz, & Richter). This blended approach will ensure that students are recruited, enter into college and complete in a timely manner, with the ultimate outcome of student success geared toward success within the community, as defined by the community.
Based on OLC’s unique decentralized design, student population, student socioeconomic status, geographical location, and direct link to the tribal community, culture, history and language, it is imperative to have a plan that is holistic, comprehensive and that engages all academic and nonacademic units within the college environment.
Therefore, Oglala Lakota College has determined that an enrollment management plan is necessary to make sure that the past promising practices are integrated and achieved with the data to support the direction, continuously improve, and addressing the immediate needs of students and ensure that the long term goals are met.
Oglala Lakota College views recruitment, retention, and persistence as interrelated and dependent upon one another to increase the graduation rate. Thus, the enrollment management plan will have four components: recruitment, retention, persistence, and completion.
Chenault (2008) challenges tribal colleges to utilize ancestral knowledge “to develop the best and most fruitful techniques” (pg.10) that emulate current challenges that tribal colleges face for continuous improvement. Oglala Lakota College rises to meet this challenge through this Wolakolkiciyapi model.
24
The enrollment management plan is guided by Lakota Belief, values through the concept of Wolakolkiciyapi as represented in the Wolakolkiciyapi framework model.
WOLAKOLKICIYAPI CONCEPTUAL FRAMEWORK MODEL
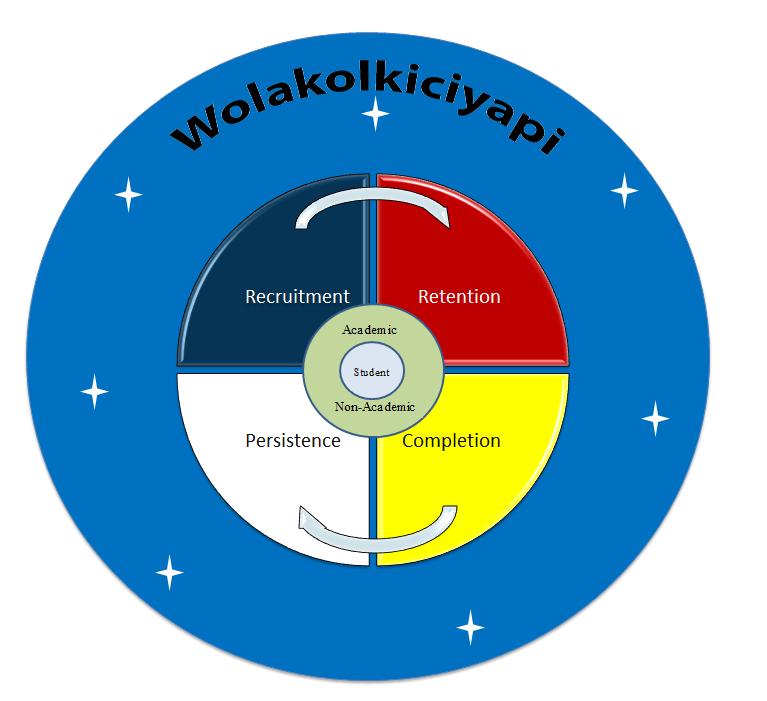
Figure 10 - Oglala Lakota College’s Wolakolkiciyapi Model
Oglala Lakota College emphasizes Lakota beliefs: “To see the world from the Lakota perspective is to understand that one must live each day guided by these values” (OLC website, 2013, October 17, 2013).
Oglala Lakota College’s Wolakolkiciyapi model is culturally responsive and student centered. Wolakolkiciyapi means learning Lakota ways of life in the community (OLC, 2013) and being Lakota and living the Lakota way of life in harmony with others (S. Tobacco, personal communication, October 9, 2013). Wolakolkiciyapi embraces Wotakuye meaning kinship being related and having a close relationship with everyone (S. Tobacco, personal communication, October 9, 2013).
The Wolakolkiciyapi model encourages faculty, staff, and students to treat one another as relatives and help one another progress through their educational journey. One Feather (1972) suggested that every Lakota person is born having many relatives to support the person as they develop and grow, with the intention to produce a respectful and responsible person that will help others when necessary. This mutual relationship is the life line for student engagement, motivation, persistence, and retention, once they enter into the college.
The Wolakolkiciyapi Model demonstrates the four colors that represent the four dimensions of human development and therefore correspond to the development of students and student success.
25
The four colors are in order: 1) Wiyohpeyata, meaning West and represented by black; 2) Waziyata, meaning North represented by red; 3) Wiyohinyanpata meaning East represented by yellow 4) Itokagata, meaning the South represented by White. (OLC Graduate Studies Conceptual Framework, 2006). “All directions correspond equally to the four stages of growth, which include the spiritual, physical, intellectual and emotional components of development. These stages balance an individual and progress in a clockwise motion. Therefore, the Four Direction Conceptual Framework Model is grounded in Lakota world view and cannot be separate from the intellectual component of human development.” (OLC Graduate Studies Conceptual Framework, 2006, pg. 10).
The stars represent the customary, natural and spiritual laws that guide the students day to day interactions with one another, their instructors, and community. The stars also represent the guiding principles and values of the Oglala Lakota College and the Accrediting bodies such as the Higher Learning Commission.
Oglala Lakota College promotes a culturally relevant environment that is conducive to the Lakota philosophy. We provide a Lakota experience to all students, staff, and faculty through the application of Lakota spirituality, promotion of the Lakota language, Lakota culture, and ceremony. We have a core curriculum that includes coursework in Lakota history, culture and language. Our decentralized campus system mimics the traditional Lakota structure, empowering communities to meet the diverse needs of their student population. Having college centers within each district and satellite site enables us to provide support services and opportunities to help students succeed including: low student to instructor ratio, tutoring, mentoring, personal advisement, and promoting the use of the Lakota ways of Knowing and Doing (a kinesthetic approach to learning). These unique characteristics attract students to the college, encourages an atmosphere of persistence, which ultimately increases retention and completion rates.
Vision
Oglala Lakota College Retention Department strives to provide quality opportunities and support services to rebuild the Lakota Nation through education
Mission
Oglala Lakota College Retention Department embraces Wolakolkiciyapi to increase recruitment, retention, persistence, and completion. Oglala Lakota College accomplishes this task through the implementation of a comprehensive Enrollment Management Plan through collaboration and unity.
Goal: Improve Student Success at Oglala Lakota College
Objective 1: Increase recruitment by 2% per year (10% over five years)
26
Objective 2: Increase retention by 2% per year (10% over five years)
Objective 3: Increase persistence by 2% per year (10% over five years)
Objective 4: Increase completion rates by 2% per year (10% over five years)
Rationale:
The objectives are established based on prior year data. The two (2) percent increase in all areas will stabilize the current rates and set yearly goals for institutional performance. Persistence is an indicator of effective retention strategies and ultimately, persistence and retention combined help to increase the graduation rate.
DEFINITIONS, METHODS AND ANALYSIS
The following methodology incorporates data sharing and feedback from academic and nonacademic units. Our strategic foci are: 1) to better coordinate and disseminate the results of retention activities as we have already put many best practices into place, 2) to understand critical junctures and at-risk populations of students in order to better allocate resources.
Recruiting and Attracting Students
The process for evaluating recruitment relies on inputs as annual reports from academic departments and college centers to enumerate: 1) the number of recruiting activities, 2) the number of prospects encountered during recruiting activities, and 3) the number of materials provided, as well as data collected by the Registrar to enumerate: 1) applications received from the registrar, 2) applications approved by the registrar, and 3) first-time students enrolled in courses. The Institutional Research and Assessment Office compiles the inputs from academic and non-academic departments by the following cohorts: overall student body, college center, gender, degree program. The Enrollment Management Director analyzes the raw data to identify changes in semester to semester, spring to spring enrollments by cohort, correlations between recruitment activities and changes in enrollment, and how changes in enrollment levels are measured against strategic objective one. The results will be published in the annual institutional effectiveness report that aligns to AIMS/AKIS, NSLDS, IPEDS. Raw data and data compiled by cohort will be made available to President, Vice President of Instruction, chairs, directors, and Principle Investigators (PI) to write annual reports, develop contingency plans, if needed, and/or plan resource allocations.
27
Table
4: OLC Logic Model for Analyzing Recruiting and Attracting Students
1. #Recruitment activities and events from academic and non-academic reports
2. #Prospects encountered from academic and non-academic reports
3. # Materials provided from academic and non-academic reports
4. #Applications received from Registrar
5. #Applications approved from Registrar
6. #Enrolled from Registrar
1. Compile inputs from academic and nonacademic annual reports by cohort
2. Cohorts include: overall student body, college center, gender, and degree program
1-6. Gather data used for AIMS/ AKIS, NSLDS, IPEDS, OLC IEP annual report.
1. Assessment and Research Department provides the raw and compiled data
2. Enrollment Management Director analyzes the data for annual institutional effectiveness report
1. Ratio of semesterto-semester and yearto-year enrollment
2. Heuristic analysis of inputs
1. Change in enrollment levels measured against Objectives
2. Raw data, compiled data and results are disseminated to President, VPI, chairs, directors, and PIs to write annual reports, develop contingency plans, if needed, and/or plan resource allocations.
Retention
Retention rates are calculated as fall-to-fall retention for: 1) for first-time degree-seeking students and re-enrolling as sophomores, juniors, and seniors and 2) first-time full-time degreeseeking students enrolled in Math 103 and English 103 and re-enrolling as sophomores, juniors, and seniors. The former calculation of retention provides a cross-institutional comparison, while the later calculation provides an indicator of how institutional retention efforts are affecting retention rates for students at greater risk for stopping out. Retention rates are calculated for the overall student body, and by college center, by gender, and by degree program.
28
Methodology Responsibilities Analysis Indicators / Dissemination
Inputs
The process for evaluating retention relies on inputs from Jenzabar provided by The Institutional Research and Assessment Office. The Institutional Research and Assessment Office tracks the following cohorts on a fall-to-fall basis for 12 years: overall student body, college center, gender, and degree program. The Enrollment Management Director analyzes the compiled data to identify changes in semester to in retention from year to year and by cohort, and how changes in retention are measured against strategic objective 2. The results will be published in the annual institutional effectiveness report. Raw data and data compiled by cohort will be made available to President, Vice President of Instruction, chairs, directors, and PIs to write annual reports, develop contingency plans, if needed, and/or plan resource allocations.
Table 5: OLC Logic Model for Analyzing Retention
Inputs Method
1. # First-time degree-seeking students from Jenzabar
2. # First-time degree-seeking students who have enrolled in Math 103 and English 103 from Jenzabar
1. Track cohorts in Jenzabar on a fall-tofall basis for 12 years.
2. Cohorts include: overall student body, college center, gender, and degree program
1 & 2 Gather data used for AIMS/AKIS, NSLDS, IPEDS, OLC IEP annual report.
Responsibilities Analysis Indicators / Dissemination
1. Assessment and Research Department provides and compiles the raw data
2. Enrollment Management Director analyzes the data for annual institutional effectiveness report
1. Ratio of the number in the cohort reenrolling the fall of time t+1 to the cohort of the fall of time t, where t is the academic year
1. Change in enrollment levels and measured against objectives
2. Raw data, compiled data and results are disseminated to President, VPI, chairs, directors, and PIs to write annual reports, develop contingency plans, if needed, and/or plan resource allocations.
29
Persistence
Persistence is a measure of student behaviors that lead to graduation (TGSLC 1999). Persistence indicators provide information on the quality of advisement, student academic integration, and social integration. Persistence at OLC may be a more reliable indicator of academic quality and student success than retention as our student population, which has a high percentage of at-risk students, tends to stop out for economic and other family-related reasons and stop in once a student’s immediate family needs are met.
The process for evaluating persistence relies on inputs such as annual reports from academic departments and college centers to enumerate co-curricular activities and on inputs from Jenzabar provided by The Institutional Research and Assessment Office. The Institutional Research and Assessment Office compiles the following persistence indicators by grade level on a semester-to-semester basis: 1) cumulative GPA greater than 2.00, 2) total completion rate, 3) completion rate over the last three years, 4) percentage of freshmen participating in student orientation, and 5) percentage of students participating in co-curricular activities (e.g. internships, athletic programs, clubs including AIBL, AISES, Student Organization, Student Senate) by co-curricular activity. Persistence indicators are calculated for the overall student body, by college center, by gender, and by degree program. The Enrollment Management Director analyzes the compiled data on a semester basis to identify changes in persistence by grade level, correlations between persistence activities and persistence indicators, and how changes in indicators are measured against strategic objective 3. The results will be published in the annual institutional effectiveness report. Raw data and data compiled by cohort will be made available to President, Vice President of Instruction, chairs, directors, and PIs to write annual reports, develop contingency plans, if needed, and/or plan resource allocations.
1. #Students by grade level from Jenzabar
2. Student GPA from Jenzabar
3. Student total completion rate from Jenzabar
4. Student 3-year completion rate from Jenzabar
1. Track students by grade level on a semester basis.
2. Compile inputs from academic and nonacademic annual reports by cohort
1. Assessment and Research Department provides and compiles the raw data
2. Enrollment Management Director analyzes the data for annual institutional
1. Ratio of the number in the cohort reenrolling in semester t+1 to the cohort of semester t, where t is the academic semester
2. Heuristic analysis of inputs
1. Change in persistence levels measured against objective 3
2. Raw data, compiled data and results are disseminated to President, VPI, chairs, directors, and PIs to write annual reports, develop
30
Table 6: OLC Logic Model for Analyzing Persistence
Responsibilities Analysis Indicators /
Inputs Methodology
Dissemination
5. #Students in cocurricular activities from academic and non-academic reports
3. Cohorts include: GPA > 2.0, total completion rate, 3-year completion rate, %Freshman completing orientation, overall student body, students participating in cocurricular activities by type. 1-5. Gather data used for AIMS/AKIS, NSLDS, IPEDS, OLC IEP annual report.
Graduation Rates
effectiveness report contingency plans, if needed, and/or plan resource allocations.
Because OLC has an open door policy students are tracked for longer periods of time. The process for evaluating graduation rates relies on inputs from Jenzabar provided by The Institutional Research and Assessment Office. The Institutional Research and Assessment Office compiles the following graduation rates for 1) first-time degree-seeking students graduating in 6years, 8-years, 10-years, and 12-year for the overall student body, by college center, by gender, and by degree program and 2) first-time degree-seeking students who have enrolled in Math 103 and English 103 graduating in 6-years, 8-years, 10-years, and 12-year for the overall student body, by college center, by gender, and by degree program. The Enrollment Management Director analyzes the compiled data on a semester basis to identify changes in persistence by grade level, correlations between persistence activities and persistence indicators, and how changes in indicators are measured against strategic objective 3. The results will be published in the annual institutional effectiveness report. Raw data and data compiled by cohort will be made
31
available to President, Vice President of Instruction, chairs, directors, and PIs to write annual reports, develop contingency plans, if needed, and/or plan resource allocations.
Table 7: OLC Logic Model for Analyzing Graduation Rates
Inputs
1. #Students by cohort from Jenzabar
2. #Graduating students by cohort from Jenzabar
1. Track students by grade level in Jenzabar to on a semester basis.
2. Compile inputs from academic and non-academic annual reports by cohort
3. Cohorts include: overall student body, college center, gender, degree program
1-2. Gather data used for AIMS/AKIS, NSLDS, IPEDS, OLC IEP annual report.
1. Assessment and Research Department provides the raw data
2. Enrollment Management Director analyzes the data for annual institutional effectiveness report
1. Ratio of the number in the cohort graduating at 6-years, 8-years, 10years, and 12-years to the total number in the original cohort
1. Graduation rate measured against objective 4
2. Raw data, compiled data and results are disseminated to President, VPI, chairs, directors, and PIs to write annual reports, develop contingency plans, if needed, and/or plan resource allocations.
32
Methodology Responsibilities Analysis Indicator/
Dissemination
STRATEGIC ACTION PLAN
Oglala Lakota Colleges’ enrollment management plan was approved in the Fall of 2013. At the same time of development individualized approaches continued to address the immediate needs of students. Support systems were developed such as the early alert systems, and department specific orientation for faculty and adjunct faculty. Academic departments began to develop clear process for program expectations and requirements. Policies are being developed to outline OLC expectations for faculty and department chairs that support Institutional effectiveness, enrollment management, and faculty development. Faculty evaluations are being revised to have clear performance indicators. Centers began the development of consistent student orientations and prep session. These are just a few examples of activities.
Strategic Action Plan
Action Plan - AY 2013-2014
Goal 1: Increase Recruitment by 2% per year for over five years 10%
Strategy 1: Plan and facilitate recruiting activities in local area schools that serve Native American populations
Fall and Spring semesters
Enrollment Management Director, in collaboration with Student Support Services, Center Staff, faculty, Financial Aid office, and Foundational Studies.
Pamphlets brochures, pens, etc.
Visit all area target schools and institutions and disseminate OLC information to target group; increase knowledge about OLC to participants.
33
OGLALA LAKOTA COLLEGE
Strategies Anticipated Completion Date Responsibility Required Resources Anticipated Outcome
Strategy 2: Create a Student Centered website
Strategy 3
Plan and facilitate Open Houses throughout the academic year at various centers.
Strategy 4
Plan and facilitate an Advertising campaign for both print and electronic medias.
November 1, 2013
Spring and Fall Open Houses in May and August.
Enrollment Management Director, Data Base Administrator
Content for website Increase student enrollment, better access to OLC information and programs.
Enrollment Management Director, Center Directors, Ag. Extension, Financial Aid,
Signs, banners, food & drinks, admission packets, degree program information,
Spring and Fall semesters in October and May
Enrollment Management Director, Development Director, financial aid office,
KOLC, KILI, local newspapers, posters, money, etc.
Increase student enrollment; disseminate OLC information to target group; increase knowledge about OLC to participants.
Increase enrollment; disseminate OLC information to target group; increase knowledge about OLC to participants.
34
Goal 2: Increase Retention by 2% per year over five years 10%
Strategy 1:
Implement the early alert system
Strategy 2:
Strengthen advising and mentoring, including student orientations
Strategy 3:
Systematically Collect and analyze student data and use information to improve processes
Strategy 4:
Strengthen teaching methods
Spring 2014
August 2014.
Enrollment Management Director, Data Base Manager, IT Director, VP of Instruction and all faculty and chairs, center staff
Money, professional development, software programs.
Enrollment Management Director, VPI, Center personnel, faculty. Professional development for faculty and staff, consultants, related materials
System to provide necessary student information to advise students.
Ongoing and throughout academic year.
Enrollment Management Director, Database Manager, Assessment Director, Foundational Studies Chair
Student related data from student information system
Effective and meaningful advising and mentoring system will be implemented;
Secure necessary and essential data to effectively manage enrollment and retention activities.
May 2014
Chairs, Faculty Development Committee, VP of
Money and experts
Increase student success rates.
35
Strategies Anticipated Completion Date Responsibility Required Resources Anticipated Outcome
Instruction, Enrollment Management Director
Goal 3: Increase persistence by 2% per year over five years 10%
Strategy 1:
Create an “At-Risk Plan” (Writing Workshops, Refresher Sessions, Learning Labs)
Strategy 2:
Improve overall morale and increase expectations to student learning with faculty, center directors, staff and students
Strategy 3
Provide social gatherings that allow faculty, center directors, staff and students
December 2013 Foundational Studies Chair/Faculty, College Center Staff, Student Services, and GED Program, Foundational Studies Advisory Committee
Each Department is working on a plan which is due next week
Centers have had many workshops where students, faculty and staff can participate
Money, professional development and college center assistance
Increase in Foundational Studies pass rates by 5% per year
36
Anticipated Completion
Responsibility Required Resources Anticipated Outcome
Strategies
Date
to embrace the vision and mission of Oglala Lakota College along with our annual graduation pow-wow and Wazi Paha festival but the vision and mission needs to be clear and understand by everyone and the activities could be centered around this concept
Strategy 4
Integrate community Spirit & Connections with college environment, communities we serve and families
Disseminate information on how a college student can have an effect on one family and how important is it to support and embrace the individual who chooses this path
37
Goal 4: Increase Completion rate by 2% per year over five years 10% Strategies
Strategy 1:
Clarify Instructional Programs and methods
Fall 2014
VP of Instruction, Academic Chairs, Program Directors, and Deans
Brochures, flyers, posters, program handbooks for students, alumni posters and money for transportation and supplies
Students will have clear understanding of program expectations
Strategy 2:
Improve scheduling process
Fall 2014
VP of Instruction, academic chairs, center staff
Training programs, policy review, early alert software
Fewer stop out students, increase graduation rate, increase retention and persistence in lower and upper division courses
38
Anticipated Completion Date Responsibility Required Resources Anticipated Outcome
39
REFERENCES
Del Rios, M. & Leegwater, L. (2008). Increasing Student Success at Minority Serving institutions: findings from the BEAMS Project, Lumina Foundation for Education.
Deschenie, T. (summer 2008). Tribal Colleges Nurture Seeds today, to reap qualified graduates tomorrow. Tribal College Journal 19 (4)
Higher Learning Commission (2013).The criteria for accreditation. Chicago, IL, Higher Learning Commission.
Higher Learning Commission (June 2013). Distinctive and Connected: Tribal colleges and universities and Higher Learning Commission Accreditation- considerations for HLC Peer Reviewers. Chicago, IL, Higher Learning Commission.
Levitz, R. Noel, L. & Richter, B. (1999). Strategic moves for retention success. New Directions for Higher Education, 108. Jossey-Bass Publisher.
Oglala Lakota College (December 2005 ) Oglala Lakota College fact book 2005-2006, Kyle, SD. Oglala Lakota College Institutional Assessment and Reach Office.
Oglala Lakota College (2006) Oglala Lakota college Team Plan , Kyle, SD. BEAMS Team
Oglala Lakota College (2006) Oyate Okiya Wounspe: Helping the people learn: A proposal for improving student learning through faculty development 2006-2009, presented to Archibald Bush Foundation, Kyle, SD. Oglala Lakota College
Oglala Lakota College (2006) Self study, Kyle, SD. Oglala Lakota College
Oglala Lakota College (2007) Oglala Lakota college Quality Enhancement Plan, Kyle, SD. BEAMS Team
Oglala Lakota College (2008) Oglala Lakota college BEAMS team action plan Summer Academy 2008 (FY 2009), Kyle, SD. BEAMS Team
40
Oglala Lakota College (2008) Oglala Lakota college summer 2008 BEAMS project, Kyle, SD. BEAMS Team
Oglala Lakota College (2009) Oglala Lakota college student advisory Committee proposal , Kyle, SD. BEAMS Team
Oglala Lakota College (2013) Oglala Lakota college Beams Report, Kyle, SD. Kimberly
Bettelyoun
Oglala Lakota College Graduate Studies Department (n.d ). Four Directional Conceptual Framework Model. Retrieved from http://www.olc.edu/local_links/grad_studies/docs/four_directional_conceptual_framewor k_model.pdf
Oglala Lakota College (n.d.) Help! A guide to creating student success in classes we know and love, Kyle, SD. George Bregier, Elain Murphy, Carolyn Johnston, Gary Jones, Jeanne Smith.
Oglala Lakota College (n.d ). History/Accreditation. Retrieved from www.olc.edu/about/history/
Oglala Lakota College (n.d ).Lakota Perspective. Retrieved from http://www.olc.edu/about/philosophy/
AIKIS – Jason give citation.
Report – Jason give citation.
One Feather, V. (1972). Tiospaye. Black Hills State College, Spearfish, SD.
Texas Guaranteed Student Loan Corporation (March 1999). Retention and Persistence in Post Secondary Education. Andriane Arnold.
41
