CONSOLIDATED FINANCIAL REPORT December 31, 2022 ANNUAL REPORT 2022
COMER INDUSTRIES S.P.A.
Headquarters and Administrative Offices: Via Magellano 27, 42046 Reggiolo (RE), Italy
Reggio Emilia Business Register no. 07210440157
Authorized share capital EUR 18,487,338.60 entirely subscribed and paid-up
Tax Code 07210440157 – VAT code IT 01399270352
Art. 2497 bis of the Italian Civil Code - The company is subject to direction and coordination by Eagles Oak S.r.l., headquartered at 5 Via del Sagittario, 41126 Modena (MO), Italy
Share Capital EUR 2,000,000 fully paid-up - Modena Business Register no. 03699500363
CONTENTS Letter from the President General information 1. Directors' report 1.1 Significant events in the 2022 financial year 1.2 The global macroeconomic scenario and the reference market 1.3 Comments on key performance indicators 1.4 Unaudited 2021 pro-forma income statement 1.5 Investments 1.6 Research and Development 1.7 Social responsibility 1.8 Environment, health and safety 1.9 Intergroup relations and dealings with related parties. 1.10 The companies in the Group 1.11 Non-financial information 1.12 Significant events after the close of the year and business outlook 1.13 Proposal for the allocation of profit 2. Consolidated financial statements and explanatory notes 2.1 General information 2.2 Scope of consolidation 2.3 Accounting standards adopted 2.4 Financial and non-financial risk management 2.5 Corporate information and industry-related information. 2.6 Notes to the consolidated financial statements 3. Report of the board of statutory auditors 4. Report of the audit firm 4 7 10 42 110 116 3 Comer Industries
LETTER FROM THE PRESIDENT
Dear shareholders,
After a 2021 that saw us making an important strategic move with the acquisition of Walterscheid, 2022 is destined to be remembered for our company having achieved its best results ever.
At the same time, I am proud to announce that Benevelli and Sitem, acquired in January 2023, have given rise to e-comer, the new green-tech division of Comer Industries with which we will make a major leap forward by offering the market the excellence of Italian technology applied to the Off-Highway segment.
With e-comer we are looking to tomorrow even though we are already ready today, expanding the selection of products in our ranges and increasing our target market. It is a choice that confirms our vision of the future: the growth of a company that is firmly rooted in its native land and at the same time looking to compete in an increasingly challenging global market.
The goal we pursue every day: sustainable growth. Growth understood not only as a mere goal of increasing volumes and profitability but as a strategic vision of the future, in a market where size and solidity represent a true competitive advantage, as well as a prerequisite for continuing to invest and innovate over time.
Sustainable toward our customers, who demand solutions that are always efficient. Sustainable in its attention to its stakeholders.
Sustainable with respect to the planet.
We are facing an ever-changing market, so now more than ever we want to be an international Group, listed on the stock exchange, attentive to the countries it competes in, always contemporary, open to the new needs of young people and new ideas.
This is our vision and way of doing business at Comer Industries.
We want to preserve and develop this position, which makes us proud and is at the same time precious, especially in those markets around the world that recognize great value in Italian ingenuity.
Strategy and investments reflected in the results of the 2022 Financial Statements that follow. These are important numbers, which take on tremendous significance when considered in a context of national and international uncertainty, which speak of a solid, healthy Comer Industries.
Results expressing strong growth in volume and profitability, the result of major reorganizations and investments completed in recent years.
Numbers that are the result of the daily efforts of all those who are a part of our world and to whom go my sincerest thanks. An important 2022, with extraordinary results generated by the many people who, through their daily commitment or by believing and investing in Comer Industries, have enabled us to make it so.
Reggiolo, March 21, 2023
4 2022 Annual Report
Matteo Storchi

5 Comer Industries
From the right Matteo Storchi and Cristian Storchi.

GENERAL INFORMATION
BOARD OF DIRECTORS
Matteo Storchi
President & CEO
Cristian Storchi
Vice President and Director
Arnaldo Camuffo
Independent Director
Luca Gaiani Director
Lee M. Gardner Director
Joseph P. Huffsmith Director
Matteo Nobili Director
Paola Pizzetti
Independent Director
Marco Storchi Director
BOARD OF STATUTORY AUDITORS
Luigi Gesaldi Chairman
Corrado Baldini
Standing Statutory Auditor
Massimiliano Fontani
Standing Statutory Auditor
AUDIT FIRM
Deloitte & Touche S.p.A.
7 Comer Industries

SUMMARY OF THE RESULTS OF COMER INDUSTRIES GROUP
(*) The figure as of 2021 was adjusted to include "Impairment of receivables and other Provisions for risks" to make it consistent with the 2022 figure in light of the new representation of this indicator.
(**) Operating income adjusted for depreciation and amortization related to the WPG acquisition and resulting from the accounting of the Purchase Price Allocation.
(***) Profit adjusted for depreciation and amortization and related theoretical tax effects attributable to the WPG acquisition and resulting from the accounting of the Purchase Price Allocation.
(MILLION EUROS) 2022 2021 CHANGE IN % SALES REVENUES 1,237.6 598.1 106.9% EBITDA % of sales revenue 180.0 14.5% 77.6 (*) 13.0% 132.0% EBIT % of revenues 127.5 10.3% 56.8 9.5% 124.4% NET PROFIT % of sales revenue 90.7 7.3% 39.4 6.6% 130.1% Adjusted EBIT (**) % of sales revenue 142.8 11.5% 56.8 9.5% 151.2% Adjusted NET PROFIT (***) % of sales revenue 101.8 8.2% 39.4 6.6% 158.2% COMMERCIAL WORKING CAPITAL % of sales revenue 254.2 20.5% 203.1 34.0% INVESTED CAPITAL 592.8 522.7 NET FINANCIAL POSITION (148.9) (177.0) NET FINANCIAL POSITION / EBITDA 0.8 2.3 EBITDA / NET FINANCIAL EXPENSES 69.6 38.9 FREE CASH FLOW 60.0 46.6 CASH CONVERSION RATE 33.3% 60.0% CAPEX % of sales revenue 34.1 2.8% 18.8 3.1% SHAREHOLDERS’ EQUITY NET FINANCIAL POSITION / SHAREHOLDERS' EQUITY 443.9 0.3 345.6 0.5 ROI [EBIT / INVESTED CAPITAL (%)] 21.5% 10.9% ROE [NET PROFIT / NET EQUITY (%)] 20.4% 11.9% EPS [NET PROFIT / NO. OF SHARES] 3.2 1.4 AVERAGE PERSONNEL EMPLOYED IN THE PERIOD 3,668 3,505
10 2022 Annual Report
SIGNIFICANT EVENTS IN THE 2022 FINANCIAL YEAR
2022 was marked by geopolitical factors that increased the market volatility that began during the year 2021.
Inflation is a global phenomenon, brought about by supply chain disruptions and the impact of the Russia-Ukraine conflict on the prices of food, energy and raw materials among others, with consequences for economies around the world. Note that the Group has no significant exposure in the areas affected by the conflict, as further detailed in Section 2.6.7.
Demand has been particularly strong, especially in the Agriculture sector where the Group holds a position of note. This context has forced everyone to approach situations differently, to ask some new questions and to question the status quo in order to adapt to the new context.
In 2022, actions aimed at integrating Comer Industries and Walterscheid Powertrain Group (hereinafter "WPG") began and are still ongoing. The two companies have long histories – 50 years for Comer, 100 for Walterscheid – and, as a result, established traditions need to be brought back to a common vision, respecting cultural differences.
On July 28, 2022 the deed of merger of the subsidiary WPG Holdco B.V. (non-operating parent company of WPG) into Comer Industries S.p.A. was signed, which had already been resolved by the Shareholders' Meeting of April 27, 2022. The transaction took effect on August 2, 2022 upon the registration of the deed of Merger with the relevant company register of Reggio Emilia. Moreover, this transaction did not have any accounting impact on the consolidated financial statements.
On December 6, 2022 the parent company Comer Industries S.p.A. purchased the shares representing 100% of the share capital of Walterscheid Monguelfo S.p.A. owned by the subsidiary Powertrain Services UK Ltd at a price of 19 million euros in order to pursue the goal of integrating and simplifying the entire Comer Industries Group (hereinafter the "Group") after the acquisition of WPG. This transaction did not have any accounting impact on the consolidated financial statements.

1.1
11 Comer Industries
1.2 THE GLOBAL MACROECONOMIC SCENARIO AND THE REFERENCE MARKET
1.2.1 MACROECONOMIC LANDSCAPE
The year that just ended was a turbulent one. After the pandemic there was a belief that we were on the road to recovery, but the geopolitical crisis and the resulting economic consequences further complicated the international landscape. In a world where the economic crisis related to
the Covid-19 pandemic continues still (especially in China), the repercussions of the war between Russia and Ukraine (first and foremost rising energy and commodity prices) and the related uncertainty have further impacted the global economy. The table below shows the forecast published by the Organization for Economic Co-operation and Development (OECD)1 in its latest Market Outlook of November 2022.
AVERAGE 2013-2019 2021 2022 2023 2024 Real GDP growth Percent World 3.4 5.9 3.1 2.2 2.7 G20 3.5 6.2 3.0 2.2 2.7 OECD 2.2 5.6 2.8 0.8 1.4 United States 2.4 5.9 1.8 0.5 1.0 Euro area 1.9 5.3 3.3 0.5 1.4 Japan 0.8 1.6 1.6 1.8 0.9 Non-OECD 4.4 6.2 3.4 3.3 3.8 China 6.8 8.1 3.3 4.6 India 6.8 8.7 6.6 5.7 6.9 Brazil -0.4 4.9 2.8 1.2 1.4 OECD unemployment rate 6.5 6.2 5.0 5.3 5.5 Inflation G20 3.0 3.9 8.1 6.0 5.4 OECD 1.6 3.8 9.4 6.5 5.1 United States 1.4 4.0 6.2 3.5 2.6 Euro area 0.9 2.6 8.3 6.8 3.4 Japan 0.9 -0.2 2.3 2.0 1.7
12 2022 Annual Report
Source: OECD Economic Outlook, November 22, 2022
1
OECD Economic Outlook November 22, 2022
In this particular economic environment, the OECD estimates that the growth rate of the world Gross Domestic Product (GDP) for 2022 will decrease by 2.8 p.p., compared to the 5.9% growth recorded in 2021.
One of the main factors in the global macroeconomic landscape is the rate of price growth, which has not been so high in advanced countries in decades. The average inflation in OECD countries expected in 2022 is 9.4%, nearly six times the average of 1.6% for the 2013-2019 period. Inflation weighs on
the economic outlook because it corresponds to higher production costs for businesses and lower real income for households, and because it forces central banks to tighten monetary policies, resulting in slower economic activity in order to pursue their statutory monetary policy objectives. The global economy faces 2023 in an environment in which growth has lost momentum, high inflation is proving persistent, confidence is weakened, and uncertainty high.
November 2022 30 22,5 15 7,5 0 -7,5 Jan-25 Feb-25 Mar-25 Apr-25 May-25 Jun-25 Jul-25 Aug-25 Sep-25 Oct-25 Nov-25 Dec-25 Jan-26 Feb-26 Mar-26 Apr-26 May-26 Jun-26 Jul-26 Aug-26 Sep-26 Retail sales Industrial production Trade 103 100,75 98,5 96,25 94 01-01 2021 02-01 2021 03-01 2021 04-01 2021 05-01 2021 06-01 2021 07-01 2021 08-01 2021 09-01 2021 10-01 2021 01-01 2022 02-01 2022 03-01 2022 04-01 2022 05-01 2022 06-01 2022 07-01 2022 08-01 2022 09-01 2022 10-01 2022 11-01 2021 12-01 2021 OECD United States Euro area 13 Comer Industries
Source: OECD Global activity indicator, November 2022 Source: OECD Consumer Confidence,
Based on these assumptions, world GDP growth for 2023 is projected by the OECD to be 2.2%, slowing from the 3.1% estimated for the year just ended.
Annual inflation in OECD economies is expected to decline, from 9.4% in 2022 to 6.5% in 2023. However, consumer price inflation in many economies will remain higher for longer than previously expected despite a broader and faster tightening of monetary policy in much of the world, and the gradual loosening of some supply chain bottlenecks. This partly reflects the war in Ukraine, especially in Europe, where the implications of the sharp increase in the price of imported natural gas in 2022 will continue to be felt in 2023. However, with official interest rates generally rising in 2023 and energy price inflation slowing, inflation is expected to decline.
In contrast, price pressures are expected to ease significantly in 2023 in the United States, Canada, Australia and Korea and remain moderate in Japan. However, the economic outlook for 2023 will be different for individual major economies.
NORTH AMERICA
In the United States, real wages have fallen and tightening monetary policy has pushed up interest rates on all maturities, thus weakening investment, especially in the housing market. Rising interest rates have also led to a strengthening of the dollar, braking exports. GDP growth is expected to slow from 1.8% in 2022 to 0.5% in 2023. Slower growth will ease the strain on labor markets by weakening
inflationary pressures from demand, and the easing of supply chain bottlenecks will allow inflationary pressures to gradually decline. Core inflation is expected to return close to the Federal Reserve's 2% target in late 2024, allowing for an easing of monetary policy.
The Canadian economy is subject to many of the same forces and is expected to see growth and inflation curves similar to those of the United States.
EUROPE
Growth in Europe slowed sharply in late 2022 due to the war in Ukraine and weak external demand, with production expected to decline in several countries over the winter. Restrained by high energy and food prices, low household and business confidence, continued supply bottlenecks and the initial impact of tighter monetary policy, annual growth in the Eurozone in 2023 is expected to stand at 0.5%, after having reached 3.3% in 2022. However, the implementation of Next Generation EU plans is expected to sustain investment in the coming years. Modest demand growth will help moderate inflation, but this effect will be offset by tensions in labor markets and the prospect that surging wholesale energy prices will continue to be more expensive than in the past, thus keeping inflation higher than in recent years.
6% 5% 4% 3% 2% 0 -2% -5% 2019 2020 2021 2022 2023 2024 November 2022 projection 2,8% -3,2% 5,9% 3,1% 2,2% 2,7% 14 2022 Annual Report
Source: OECD Global GDP growth, November 2022
ASIA
In China, waves of lockdowns put in place due to the implementation of the zero Covid policy enforced by the Beijing government disrupted economic activity in 2022. With weaker real estate investment remaining a significant obstacle to recovery, growth in 2023 will be supported by infrastructure investment and other economic measures put in place by the government to moderate the correction in real estate. After the 3.3% in 2022, GDP growth is expected to rise to 4.6% in 2023. However, China will still be far from the 2013-2019 average growth rates of 6.8%. Consumer price inflation is expected to remain moderate, helped by the government's energy and food price management policies.
Growth in Japan is expected to remain above potential, but slowing gradually. Higher energy prices have hampered real household income growth and dented business confidence and investment, and a loss of economic momentum in major trading partners is dampening export growth. GDP growth is expected to be 1.8% in 2023 after recording 1.6% in 2022.
In India, growth is expected to fall from 6.6% in the current fiscal year to 5.7% in 2023 before rebounding to 6.9% in fiscal 2024, broadly in line with prepandemic trends.
BRAZIL AND EMERGING COUNTRIES
Brazil's GDP is expected to grow 2.8% in 2022 and 1.2% in 2023. Household consumption, private investment and exports will remain the main drivers of growth, although export growth is expected to slow in 2023. Inflation is expected to decline as the effects of rising energy and food prices fade. Expectations for other major emerging market economies, which are more resilient to global headwinds, are relatively positive next year and will experience only modest and short-lived peaks overshooting inflation targets. Finally, with regard to labor market conditions, these remain generally tense. Wage increases have not kept pace with price inflation, weakening real incomes despite actions taken by governments to cushion the impact of rising food and energy prices on households and businesses that have seen their purchasing power significantly eroded. OECD expects the unemployment rate to rise to about 5.5%, about 0.5 percentage points above the low recorded in mid-2022.
12,00% 9,00% 6,00% 3,00% 0,00% 2022 2023 2024 OECD 9,4% 6,5% 5,1% 15 Comer Industries
Source: OECD Inflation, November 2022
1.2.2 MAJOR RISKS IN 2023 RISING ENERGY PRICES
European economies continue to face significant challenges due to ongoing and planned embargoes of Russian seaborne coal and oil imports and the diminishing supply of gas from Russia to the European market. A key risk related to the projections is that the associated rise in energy prices will prove much more disruptive and persistent than assumed
TIGHTENING OF MONETARY POLICY
There are growing risks that rapidly rising interest rates, tighter global financial conditions and significant asset repricing could expose longstanding financial vulnerabilities in advanced and emerging economies. Rising private sector debt service burdens and lower bond market liquidity are key risks in advanced economies.
FINANCIAL VULNERABILITIES IN EMERGING MARKET ECONOMIES
Tighter financing conditions, rising debt, the sharp appreciation of the US dollar and slowing export market growth are exacerbating vulnerabilities in emerging market economies. Risk premiums have increased, capital outflows have accelerated, and international reserves have declined in many
countries. In China, the resurgence of Covid-19 outbreaks or the contagion of financial fragilities in the heavily indebted real estate sector spreading to the rest of the economy could result in a sharperthan-expected slowdown in growth. Several developing and emerging market economies also face food security risks due to high food, energy and fertilizer prices and supply shortages.
Source: OECD Policy interest rate, November 2022
6 4,5 3 1,5 0 -1,5 2020 2021 2022 2020 2024
16 2022 Annual Report
United States Euro area Japan
1.2.3 TARGET MARKET AGRICULTURAL SECTOR
The overall business climate index for the agricultural machinery industry in Europe (CEMA's
December business climate index) closed 2022 at +30 (on a scale of -100 to +100), showing a significant upward trend after sharp declines in the first part of 2022, particularly adversely affected by the start of the Russia-Ukraine conflict.
BUSINESS CLIMATE INDEX DEVELOPMENT
Regarding expectations for 2023, while early indications in January remain consistent with the year-end values thus confirming the ongoing recovery, European industry representatives nevertheless remain cautious about future prospects. Forty-five percent of survey respondents expect stable sales in the first six months of 2023, while in terms of order intake over the same period 48% expect the same level as in 2022, as current new and used machinery dealer inventories remain low across Europe and may still be below optimal levels in some markets. As for the US market, data released in December 2022 by the Association of Equipment Manufacturers (AEM) for 2022 saw a contraction of the overall market in terms of units sold by 14.8% compared to 2021. In the tractor
range, those with 100+ hp are the only models that recorded a positive performance of 11.3% year on year. Harvester production also showed 15.8% growth in 2022 compared to 2021.
Forecasts for 2023 released in November by John Deere, one of the world's leading agricultural equipment companies along with CNH Industrial and AGCO, paint a two-speed North American market for 2023: growth between 5% and 10% for the Large agriculture segment, while the Small agriculture segment is expected to remain unchanged or down 5%. As for Europe and South America, expectations are between a stable or slightly growing market in the range of 5%. In contrast, the Asian market is expected to shrink slightly in 2023 compared to the year just ended.
2
60 20 -20 -60 80 40 0 -40 -80 Fonte: CEMA Business Barometer 30 CBI Present situation Future expectation
from −100
positive
for 1)
positive index for 2) =
Tractors with more than 100 horsepower
CBI = geometric mean of 1) evaluation of the current business situation and 2) turnover expectation; Index scale
to +100;
index
= majority of respondents evaluates the current situation as favourable and vice versa;
majority of respondents expects for the next six months an increasing turnover and vice versa (respectively compared to the previous year’s level) CEMA Business Climate Index (CBI) – Total
17 Comer Industries
INDUSTRY OUTLOOK (IN UNITS) - FY 2023
INDUSTRIAL SECTOR AND WIND POWER
The Industrial sector in 2022 was characterized by concerns about a global recession caused by geopolitical tensions and soaring input prices in the first part of the year, while there has been a gradual recovery in recent months. About half of the participants in the December 2022 Committee for the European Construction Equipment (CECE) Business Barometer expect to see a 3% to 10% increase in construction equipment sales in 2023 over 2022 driven by demand from countries such as North America, Latin America and the Middle East.
Uncertainties due to the macroeconomic environment for 2023 are significant, particularly for residential and nonresidential construction due to higher interest rates and recession fears that foreshadow a significant slowdown in construction investment next year. Housing investment benefited from the availability of low-cost mortgages and the accumulation of savings during the pandemic. However, rising interest rates, higher cost to build
and falling real incomes are expected to reduce affordability and reduce demand for private housing. These negative effects could be offset by support from the Next Generation EU program, the push for energy-saving green buildings, and the gradual reduction of the backlog built up in 2022. Overall, the CECE macroeconomic bulletin released in November 2022 forecasts a slowdown in construction investment growth from 5.1% in 2021 to 2.8% in 2022, followed by a significant decline of 0.1% in 2023.
Finally, regarding the Wind Power sector, after a record year of new offshore installations (in terms of megawatts) in 2021, 2022 saw a sharp deceleration mainly due to the economic slowdown. Medium to long-term growth prospects remain positive driven by the need to increase the use of sustainable energy sources to combat climate change, while the sector is significantly impacted by environmental policies and related regulation that could slow its development.
5-10%
Flat to up 5%
U.S and CANADA LARGE
AG
EUROPE AG
Flat to down 5%
U.S and CANADA SMALL AG and TURF
Flat to up 5%
SOUTH AMERICA AG (tractors and combine)
Down moderately
ASIA AG
18 2022 Annual Report
Source: Deere & Company forecast as of 23 November 2022

19 Comer Industries
1.3 COMMENTS ON KEY PERFORMANCE INDICATORS
The Group monitors its performance using various indicators that may not be comparable to similar measurements adopted by other groups. Group Management considers that these indicators provide a comparable measurement of the results on the basis of standardized performance factors, facilitating the identification of operating trends and allowing management to take action also during the year with swift corrective actions whenever necessary.
1.3.1 DEFINITION OF THE INDICATORS
The performance indicators used by the Group and reported herein are based on the following definitions, revised this year resulting in a restatement of comparative data:
"EBITDA": represents the value of Operating Profit (EBIT) adjusted by the amount of the following entries:
(+) Amortization, Depreciation and other write-downs of fixed assets, in particular:
• Amortization of intangible fixed assets;
• Depreciation of tangible fixed assets;
• Other write-downs of fixed assets;
"EBIT": is the Operating Profit in the Consolidated Income Statement.
"Net profit": indicates the result of the Consolidated Income Statement.
"Adjusted EBIT": indicates the item Operating Income in the Consolidated Income Statement adjusted for depreciation and amortization resulting from the accounting – as required by IFRS 3 – of the purchase price in connection with the business combination transaction that took place at the
end of 2021 and related to the acquisition of WPG.
"Adjusted Net Income": represents the Net Profit in the Consolidated Income Statement adjusted for depreciation and amortization and the related theoretical tax effects arising from the accounting – as required by IFRS 3 – of the purchase price in connection with the business combination transaction that took place at the end of 2021 and related to the acquisition of WPG.
"Commercial working capital": indicates the algebraic sum of the following balance sheet items:
(+) current asset items: Inventories;
Trade Receivables;
(-) current liability items:
Trade payables.
"Invested capital": is the algebraic sum of the following items:
(+) Commercial working capital,
(+) Tangible (including Rights of use), intangible and financial fixed assets
(+) Tax assets and deferred tax assets, current tax assets
(+) Other short and long-term receivables, of a non-financial nature;
( - ) Other short and long-term payables, of a non-financial nature;
(+) Current and deferred tax liabilities
( - ) Severance Indemnity Fund (TFR) and provisions for risks and charges.
"Net financial position": indicates the difference between cash and cash equivalents and debt of a financial nature as follows:
(+) Current Asset items (A):
• Other short-term financial receivables
• Marketable securities at fair value
• Cash and cash equivalents
20 2022 Annual Report
(-)
Non-current and current liabilities (B):
• Long-term loans
• Long-term derivative financial instruments
• Short-term loans
• Short-term derivative financial instruments
• Other short- and long-term financial payables (including payables relating to lease contracts recognized in accordance with IFRS 16)
• Non-current trade payables
The Net financial position, as represented, achieved the same results that would have been obtained according with recommendation reported in Reminder no. 5/21 of April 29, 2021 issued by Consob, which refers to ESMA Guideline 32-382-1138 of March 4, 2021.
"Free cash flow": Cash flow generated (absorbed) by operations + Net cash flow from investing/ disinvesting activities.
"Cash conversion rate": represents the ratio of Free Cash Flow to EBITDA.
"Capex": indicates the increase occurring in investments in tangible and intangible fixed assets (net of revaluations, capital grants and the effects of currency conversion) which, following International Accounting Standards, are recorded in the corresponding heading in equity, reduced by disinvestments and excluding the equity effects (i) of internal capitalizations of costs for internally generated development activities, excluding the impacts related to the application of IFRS 16.
"Equity": indicates the algebraic sum of Share capital, Statutory reserves, Profits/losses and Other similar reserves corresponding to the total of the "Share capital and reserves" heading.
"ROI (return on investment)": ratio of EBIT to invested capital.
ROE (return on equity)": ratio of Net Profit to Net Equity.
"EPS (Earnings per share)": ratio of Net Profit to total number of shares outstanding as of December 31, 2022.
Average staff in the year": simple average on the basis of the workforce employed by the Group, including temporary workers.
The Group prepares the income statement according to the nature of costs and the Cash flow statement with the indirect method.
1.3.2 COMMENTS ON THE INDICATORS
For a better representation of the change in economic results between 2022 and 2021, please refer to the following section on the Proforma 2021 unaudited data, as in 2021 WPG's economic data were included in the consolidated financial statements for the month of December only. Despite the market environment it operates in, the Group achieved consolidated revenues of 1,237.6 million euros (up 106.9% from the previous year, a year that includes WPG's only for December), which includes revenues from the Comer Industries brands of 643.9 million euros and revenues from the Walterscheid brands of 593.7 million euros. Revenues generated abroad represent 91% of the total.
This performance has also been positively affected by the revaluation of the main reference currencies in which Comer Industries operates. More specifically, the appreciation of the US dollar and the Chinese yuan positively affected this figure by 38.7 million euros. The amount of revenues on a constant currency basis compared to the previous year would have been 1,198.9 million euros (+100.5%).
Thanks to the consolidation of Walterscheid brands for 12 months, the Agricultural sector recorded a 152% increase in sales. The Industrial sector, on the other hand, closed the year with a +59% over the previous year.
Therefore the Group demonstrated its ability to fully seize market opportunities in addition to benefiting from the consolidation of the new brand acquired at the end of the previous year.
EBITDA stood at 180.0 million euros or 14.5% of sales compared to 77.6 million euros (figure adjusted to include the item "Write-downs of receivables and other risk provisions" to make it consistent with the new representation applied on 2022) in the previous year (equal to 13.0% of sales), an improvement of 132.0%, again pointing out that the 2021 figure included WPG only for the month of December.
The net financial position shows a negative balance of 148.9 million euros, an improvement over the
21 Comer Industries
previous year of 28.1 million euros. The balance as of December 31, 2022 includes 151.3 million euros of cash, gross of loans for 242.5 million euros and 57.8 million euros of financial payables arising from the accounting treatment of leases in accordance with IFRS 16. The Group generated cash from operations of 94.1 million euros, which net of capital expenditures of 34.1 million euros produced free cash flow of 60.0 million euros. The Cash Conversion rate was 33.3% in the fiscal year just ended. In a year marked by tensions throughout the supply chain and particularly sustained demand, the Group chose to protect relationships with key suppliers by significantly reducing payment terms compared to the previous year. Inventories also increased to better ensure on-time delivery.
The parent company Comer Industries S.p.A. distributed dividends in the amount of 14.3 million euros in fiscal 2022.
Net profit reached 90.7 million euros, corresponding to 7.3% of turnover compared to 39.4 million euros in the previous year (6.6% of sales). The adjusted net profit for 2022, which excludes depreciation, amortization and related theoretical tax effects attributable to the acquisition of WPG according to the Purchase Price Allocation accounting treatment, is 101.8 million euros.
ROE, calculated on net profit, stands at 20.4% compared to 11.9% in the previous year and benefited from the growth in operating income.
Earnings per share stand at 3.2 euros per share (1.4 euros per share in 2021).
22 2022 Annual Report

23 Comer Industries
1.4
UNAUDITED 2021 PRO-FORMA INCOME STATEMENT
Below is the Group's unaudited proforma income statement for fiscal year 2021, which is intended to retroactively represent the WPG acquisition as if it had occurred on January 1, 2021.
The unaudited 2021 proforma income statement was prepared based on the following historical data:
• Consolidated income statement included in the Consolidated financial statements for 2021 of the Comer Industries Group, prepared in accordance with International Financial Reporting Standards as adopted by the European Union;
• Income statement as of January 1 - December 31, 2021 of WPG, prepared according to the International Financial Reporting Standards adopted by the European Union. WPG's consolidated income statement of January 1 - December 31, 2021 was prepared for internal purposes since there is no legal obligation in this regard, and has not been audited.
The unaudited 2021 proforma income statement was not examined by the audit firm Deloitte & Touche S.p.A., as there is no requirement to do so.
The unaudited 2021 proforma income statement was prepared solely for illustrative purposes by making appropriate proforma adjustments to the historical data described above to retroactively reflect the significant effects of the acquisition. The following aspects must be considered for proper interpretation:
• Given that these are historical and virtual
accounting representations based on assumptions, if the WPG acquisition had actually been carried out on the date taken as reference for the preparation of the 2021 proforma income statement, rather than on the effective date, the historical data would not necessarily have been the same as those reflected in the proforma income statement.
• The data of the 2021 proforma income statement do not in any way intend to represent a forecast of future results and therefore should not be used in this sense. The proforma data do not reflect the prospective data as they are prepared in such a way as to represent only the effects of the Transaction that can be isolated and objectively measured, without taking into account the potential effects due to changes in the policies of the Comer Industries Group Management, which have a high component of discretionary power, and operational decisions resulting from the outcome of the WPG acquisition.
The accounting standards adopted for the preparation of the unaudited 2021 proforma income statement are the same as those used for the preparation of the Comer Industries Group's 2021 consolidated financial statements, specifically the International Financial Reporting Standards adopted by the European Union, it being understood that this income statement does not represent a "complete set of financial statements" under IAS 1.
24 2022 Annual Report
Some recalculated indicators considering proforma economic data are summarized below unaudited 2021 compared with the 2022 indicators discussed above.
(*) The figure as of 2021 was adjusted to include "Impairment of receivables and other Provisions for risks" to make it consistent with the 2022 figure in light of the new representation of this indicator.
(**) Operating income adjusted for depreciation and amortization related to the WPG acquisition and resulting from the accounting of the Purchase Price Allocation.
(***) Profit adjusted for depreciation and amortization and related theoretical tax effects attributable to the WPG acquisition and resulting from the accounting of the Purchase Price Allocation.
UNAUDITED CONSOLIDATED INCOME STATEMENT (THOUSAND EUROS) PROFORMA DECEMBER 31, 2021 Revenue from contracts with customers 1,048,486 Other operating revenues 7,623 Change in inventories of semi-finished and finished goods and WIP 72,009 Purchase costs (664,486) Personnel costs (227,463) Other operating costs (105,132) Write-downs of receivables and high risk provisions (818) Amortization (49,142) EBIT 81,077 Net financial income / (charges) (8,655) Profit before Tax 72,423 Income taxes (22,523) NET PROFIT 49,900
(MILLION EUROS) DECEMBER 31, 2022 PROFORMA DECEMBER 31, 2021 CHANGE IN % SALES REVENUES 1,237.6 1,048.5 18.0% EBITDA % of sales revenue 180.0 14.5% 130.2 (*) 12.4% 38.2% EBIT % of sales revenue 127.5 10.3% 81.1 7.7% 57.3% Adjusted EBIT (**) % of sales revenue 142.8 11.5% 87.0 8.3% 64.2% NET PROFIT % of sales revenue 90.7 7.3% 49.9 4.8% 81.8% Adjusted NET PROFIT (***) % of sales revenue 101.8 8.2% 48.4 4.6% 110.2% INVESTED CAPITAL 592.8 522.7 NET FINANCIAL POSITION (148.9) (177.0) NET FINANCIAL POSITION / EBITDA 0.8 1.4 EBITDA / NET FINANCIAL EXPENSES 69.6 15.0 ROI [EBIT / INVESTED CAPITAL (%)] 21.5% 15.5% ROE [NET PROFIT / NET EQUITY (%)] 20.4% 14.5% EPS [NET PROFIT / NO. OF SHARES] 3.2 1.7
25 Comer Industries
The following table shows Sales Revenues by segment:
Revenue growth during 2022 was driven by both the Agriculture (+23.4%) and Industrial (+10.0%) segments. The Agricultural sector (accounting for 62.7% of Total Revenues) was positively affected by both the increased demand for agricultural products as a result of population growth and the rise in agricultural commodity prices that prompted farmers to invest more in machinery and equipment. The Industrial sector performed well despite the fact that rising interest rates hurt the construction sector and reduced investment.
The following table shows Sales Revenues by geographical area:
The EMEA market, which is the Group's main target market with a 56.1% share of total revenues, grew 25.8% year-on-year despite the fact that the region saw a slowdown in the growth of economic activity due to the outbreak of the Russia-Ukraine conflict and rising energy prices.
The North American market, whose impact reached 21.4%, was up 21.1% due to strong domestic demand and favorable macroeconomic conditions. China suffered from the zero-Covid policy implemented by the Chinese government, the policy then being abandoned in early 2023.
The Latin American market, while still marginal at the Group level, grew 33.7% aided by the Group's presence there.
EBITDA
Operating profitability for the year was up both in absolute values and as a percentage of Sales Revenues. EBITDA stood at 180.0 million euros compared to 130.2 million euros in the previous year, achieving 38.2% year-on-year growth.
EBITDA as a percentage of Sales Revenues was 14.5%, an improvement of 2.1 percentage points from the previous year, due to the implementation of processes and synergies resulting from the integration of WPG in 2022, higher absorption of fixed costs due to increased sales volumes, and the Group's timely price adjustment policy.
DESCRIPTION (MILLION EUROS) DECEMBER 31, 2022 INC. % PROFORMA DECEMBER 31, 2021 INC. % CHANGE IN % Agricultural sector 776.3 62.7% 629.1 60.0% 23.4% Industrial Sector 461.3 37.3% 419.4 40.0% 10.0% Total sales by segment 1,237.6 100% 1,048.5 100% 18.0%
DESCRIPTION (MILLION EUROS) DECEMBER 31, 2022 INC. % PROFORMA DECEMBER 31, 2021 INC. % CHANGE IN % EMEA 694.6 56.1% 552.3 52.7% 25.8% NORTH AMERICA 265.3 21.4% 219.1 20.9% 21.1% ASIA PACIFIC 208.8 16.9% 225.6 21.5% -7.5% LATIN AMERICA 68.9 5.6% 51.5 4.9% 33.7% Total turnover by geographic area 1,237.6 100% 1,048.5 100% 18.0% 26 2022 Annual Report
ADJUSTED EBIT
Adjusted EBIT, adjusted for depreciation and amortization emerging from the Purchase Price Allocation (PPA) resulting from the acquisition of WPG, stood at 142.8 million euros compared to 87.0 million euros in the previous year, representing 64.2% year-on-year growth.
NET PROFIT
FY 2022 closed with a Net Profit of 90.7 million euros, up 81.8% from the previous year. Adjusted Net Profit, adjusted for depreciation and amortization emerging from the Purchase Price Allocation (PPA) and the related theoretical tax effect, stood at 101.8 million euros compared to 48.4 million euros in the previous year, representing 110.2% year-on-year growth.

27 Comer Industries
1.5 INVESTMENTS
During the year, the Group invested 33.9 million euros in tangible and intangible fixed assets acquired from third parties, net of internal capitalizations and excluding the impact of the IFRS 16 accounting standard.
During fiscal year 2022, two new horizontal machining centers for the cast iron flow and a gear hobbing machining center came on line at the Italian plant in Reggiolo. Also as part of the multi-year plan to renew and upgrade the machine inventory, two additional horizontal machining centers for cast iron flow and a new robot cell for gear processing flow were purchased. The latter is equipped with an anthropomorphic robot and a numerically controlled lubricant-free gear cutting machine, confirming the choice of environmentally friendly technologies for working steel. These latter assets will come into operation in Q2 2023.
Additional Industry 4.0 investments were also made to optimize production processes and logistics flows at the assembly and painting plant. Specifically, a new semiautomatic assembly line equipped with cyber-physical systems went into operation, and new vertical automated warehouses fully interconnected with factory logistics systems were purchased.
With regard to the Italian plant in Monguelfo, two automated machining centers for processing steel components have come into operation.
Also worth mentioning is the green, sustainable investment in the purchase and installation of electric vehicle charging stations. The columns were installed in the last quarter of 2022 in plants in the northern and southern parts of Italy.
During FY 2022, the German plants in Sohland and Lohmar underwent several investments in production. Specifically, the former saw the arrival of an automated machining center for working steel components, the latter the commissioning of a complex robotic cell, and the purchase of two special process plants that will come on line during the next fiscal year.
In 2022 in the Jiaxing plant in China, investments were made involving masonry works and general plant engineering related to the production building. In the manufacturing area, semiautomatic assembly lines for the production of industrial axles and agricultural gearboxes and a new vertical warehouse were also purchased and installed.
A new production plant was built in India during 2022, and therefore investments were made concerning masonry and general plant works related to process industrialization.
28 2022 Annual Report
RESEARCH AND DEVELOPMENT
In 2022, following the WPG acquisition, the Comer Industries Group significantly increased its research and development capabilities for new products and services. These include a new axle for hay balers with a capacity of up to 5 tons for the Agricultural market, a new generation of gimbals –the result of a collaboration between Walterscheid and Comer Industries – with a static load capacity increased by 15% and a maximum utilization length increased by 20%, and the design for a new front axle for tractors up to 120 kW power. In the Industrial sector, on the other hand, of note is the completion of a new transmission for electrically driven axles with power up to 45 kW, and the market launch of the new size 17C industrial gimbals for torques up to 120,000 Nm.
Finally, in the field of digitization of the Group's products, a new app for smartphones was launched that enables real-time monitoring of the use of agricultural gimbals equipped with sensors developed entirely in-house. Comer Industries Group's advanced systems are developed in design offices located in Italy, Germany and the United States, which are then validated and approved in four different specialized validation centers located in Reggiolo and WelsbergMonguelfo in Italy, Lohmar in Germany and Rockford in the United States.

1.6
29 Comer Industries
SOCIAL RESPONSIBILITY
For some years now, when talking about sustainability reference was made to a concept that encompasses a variety of policy areas that companies are called upon to approach proactively and imperatively. Education, Community, Innovation, Sports and Culture are the key words underpinning Comer Industries' social responsibility, all areas with one common denominator: people. In keeping with the United Nations Sustainable Development Goals, Comer Industries' concrete commitment begins with the awareness of having an important responsibility towards the environment and society. The regions the Company operates in and the communities within are the starting point for programs, support initiatives and partnerships related to creating value for ourselves and future generations. Realizing that only starting from one's roots can one continue to grow, Comer Industries invests first and foremost in the resources of the local area to foster economic, social and cultural development. Examples include the project to upgrade Palazzo Sartoretti in Reggiolo, the seat of the municipal government, and its adjacent park, and support for associations in the Lohmar area and North RhineWestphalia, where Walterscheid has its offices. In Reggiolo, home of Comer Industries headquarters, the partnership between the company, the Municipality of Reggiolo, the Reggio Children Foundation and Azienda Servizi Bassa Reggiana has created a place where a variety of initiatives and disciplines converge through the creation of true "Ateliers" for children, young people and adults: a complete educational program created with the aim of investigating the phenomena of mechanics and gears, welcoming various other collateral disciplines (graphic, digital, etc.) that merge within workshops and embrace numerous aspects of education and experimentation. In Lohmar, with the "Hearts of Gold" project, which started in 2006, Walterscheid supported 13 social organizations in North Rhine-Westphalia with a donation of 65,000 euros in 2022. Walterscheid
employees took part in the initiative by waiving their overtime pay for the cause, while company management contributed to the project with cash donations. Additional funds were raised through various company initiatives, such as raffles and scrap metal collection and sales. From counseling to medical care and creative activities, these social organizations impact the local communities around Comer Industries and Walterscheid. The educational and training projects that the company believes in go beyond the places where Comer Industries has its roots, as evidenced by the now long-standing collaboration with the Volunteer Organization "Namaste, Honor to You," through which the company provides concrete support to the community in Bangalore, India, by paying for the room, board, university expenses and all necessary resources so that some deserving girls can cultivate their talents and become nurses. There is no shortage of collaborations with Italian and international universities and projects that espouse educational and social objectives, such as "ÜFA," the training company first established in August 1985 at the Walterscheid - Lohmar headquarters, supported by a well-established flow of money and goods. Unlike normal companies that operate economically, the profit generated at the end of the business year is donated to a social project in the area. Thanks to the ÜFA project, young men and women have the opportunity to learn about personal responsibility much more quickly than usual and then transfer what they have learned to real life.
The company's commitment to sustainability is also evident in its support for projects that reflect a true culture of innovation. Examples include Comer Industries' participation in Le Village by Crédit Agricole in Parma, one of the first European innovation hubs to receive such recognition, and the development of the Deep Tier platform in partnership with Iungo and Gellify. Le Village is an incubator that favors knowledge and interaction between local start-ups, financial institutions and
1.7
30 2022 Annual Report
industrial businesses and offers opportunities for development and reciprocal exchange; Deep Tier is a fintech platform model that supports the entire supply chain, from supply chain leaders to subsuppliers, both local and abroad, allowing every player in the chain to access a number of forms of advances and financing from financial institutions rapidly and under advantageous conditions. In the area of sports, incentivizing its employees to enjoy their leisure time in a healthy way is the objective behind the two partnerships put in place by Comer Industries with the Padel Club of Reggiolo
and the Sessantallora amateur sports association of Carpi, which promotes various activities in the areas of cycling, mountain biking and triathlon. Sustainability also means preserving the scenic, artistic and cultural beauty of our country, therefore for years now Comer Industries has been supporting FAI by participating in the Corporate Golden Donor membership program. For Comer Industries, sustainability is a key factor in long-term value creation and is increasingly an integral part of the way it does business.
31 Comer Industries
ENVIRONMENT, HEALTH AND SAFETY
Faced with a dynamic environment characterized by rapid changes in production configurations following the acquisition of Walterscheid, the Comer Industries Group has maintained high standards in protecting the health and safety of people in the workplace. In fact, in 2022 the value of the employee injury frequency indicator across the new consolidated scope stood at 2.2, the same as in 2021. Of note is the performance of the Bangalore plant, which recorded no injuries for the third consecutive year.
Despite the uncertain albeit improving health situation for much of the year, the Group continued to implement the company's Protocol for countering the spread of the Covid-19 virus, updating it based on the changing environment and government regulations, and always ensuring a safe environment for all workers. With regard to the commitment to the well-being of its people, the company's policy on teleworking was made official after the emergency, with important benefits in terms of work-life balance and commuting. In parallel, a human rights risk assessment was conducted, involving internal offices and the supply chain, laying the groundwork for the subsequent definition and dissemination of an Integrated Human Rights Policy, also published on the company website.
In continuity with the process started in previous years, the Group has initiated a road map on a two-year horizon for the integration of the Health and Safety Management System according to the ISO 45001:2018 standard in all locations in the new scope ensuring uniform management of all health and safety aspects.
The Company's commitment to environmental sustainability was developed throughout the year through various energy efficiency and environmental impact reduction projects Specifically, the machine inventory renewal program continued with the introduction of production units that are more efficient in their use of energy and lubricants. At the same time, to optimize energy consumption, the Group benefited from the digital monitoring systems installed in previous periods, enabling real-time analysis of trends and peaks and implementing timely corrective actions where necessary. These actions resulted in energy savings of more than 15% throughout Comer Industries. Moreover, in 2022 the Group significantly increased the share of electricity from renewable sources used to power its manufacturing processes by extending the supply of green energy to the Reggiolo and Pegognaga plants.
In 2022 the Group contributed to the development of sustainable mobility through the inclusion of hybrid and electric models in the company fleet and through the development of products for electric vehicles that are innovative in terms of weight reduction, lubrication, and noise. Furthermore, areas equipped with dual charging stations for electric cars were set up within the company's perimeter .
No critical issues have emerged during the year with relation to the environment.
1.8
32 2022 Annual Report

33 Comer Industries
1.9 INTERGROUP RELATIONS AND DEALINGS WITH RELATED PARTIES.
COMPANY (THOUSAND EUROS) REVENUE FROM CONTRACTS WITH CUSTOMERS PURCHASE AND OTHER OPERATING COSTS FINANCIAL INCOME FINANCIAL EXPENSES ROYALTIES DIVIDENDS Comer Industries S.p.A. 91,261 109,189 6,711 212 6,934 0 Comer Industries Components S.r.l. 106,132 7,280 0 39 0 1,900 Comer Industries INC 52 109,883 49 0 0 3,358 Comer Industries (Shaoxing) Co. Ltd. 5,944 0 20 47 0 6,916 Comer Industries (Jiaxing) Co. Ltd. 41,696 4,201 210 19 (6,048) 0 Comer Industries UK Ltd. 253 2,951 0 0 0 295 Comer Industries GmbH 0 0 0 0 0 0 Comer Industries India Pvt Ltd. 1,283 721 0 0 (886) 0 Comer Industries do Brasil EIRELI 107 12,609 0 0 0 0 WPG German Holdco GmbH 0 0 710 2,095 0 10,436 WPG UK Holdco Ltd. 0 0 497 194 0 0 WPG US Holdco LLC. 0 0 0 4,421 0 0 Off-Highway Powertrain Services Germany GmbH 1,983 3,047 0 470 0 0 Walterscheid GmbH 13,618 5,270 251 98 0 (9,566) Walterscheid Getriebe GmbH 183 2,788 0 226 0 (870) Walterscheid Brasil Industria de Equipamentos Agricolas Ltda. 0 647 0 403 0 0 Walterscheid Powertrain (China) Co. Ltd. 274 1,086 0 0 0 0 Powertrain Services France SAS 1,448 1,224 0 0 0 0 Walterscheid Monguelfo S.p.A. 2,824 2,142 0 14 0 0 Walterscheid Russia LLC. 0 79 0 0 0 0 Powertrain Services UK Limited 0 0 446 679 0 0 Powertrain Services (UK Newco) Ltd. 0 0 0 41 0 0 Walterscheid Inc. Woodridge 759 2,054 11 0 0 0 Powertrain Rockford Inc. 1,084 3,370 124 70 0 0 Walterscheid Cardan GmbH 0 359 0 0 0 0 Total 268,900 268,900 9,028 9,028 0 12,469 34 2022 Annual Report
COMPANY (THOUSAND EUROS) TRADE RECEIVABLES TRADE PAYABLES OTHER RECEIVABLES OTHER PAYABLES FINANCIAL RECEIVABLES FINANCIAL PAYABLES Comer Industries S.p.A. 27,541 25,109 4 0 159,206 15,342 Comer Industries Components S.r.l. 12,480 2,936 0 0 0 6,100 Comer Industries INC 137 26,507 0 0 7,008 0 Comer Industries (Shaoxing) Co. Ltd. 1,780 0 0 0 0 4,533 Comer Industries (Jiaxing) Co. Ltd. 19,563 2,401 0 0 12,867 0 Comer Industries UK Ltd. 34 556 0 0 0 0 Comer Industries GmbH 100 0 0 0 0 0 Comer Industries India Pvt Ltd. 691 1,018 0 4 0 0 Comer Industries do Brasil EIRELI 22 3,716 0 0 0 0 WPG German Holdco GmbH 0 0 0 30 18,473 113,925 WPG UK Holdco Ltd. 0 0 0 0 19,412 19,270 WPG US Holdco LLC. 0 0 0 0 0 127,918 Off-Highway Powertrain Services Germany GmbH 1,752 2,320 5 53 5,913 12,898 Walterscheid GmbH 14,422 2,014 614 0 65,404 382 Walterscheid Getriebe GmbH 165 2,120 0 318 160 4,764 Walterscheid Brasil Industria de Equipamentos Agricolas Ltda. 0 6,392 0 0 0 7,373 Walterscheid Powertrain (China) Co. Ltd. 532 3,005 0 0 0 0 Powertrain Services France SAS 57 1,419 0 0 11,615 0 Walterscheid Monguelfo S.p.A. 3,483 156 0 0 0 812 Walterscheid Russia LLC. 0 29 0 0 0 0 Powertrain Services UK Limited 0 0 0 0 8,938 25,612 Powertrain Services (UK Newco) Ltd. 0 0 0 0 0 1,565 Walterscheid Inc. Woodridge 2,929 6,660 0 272 5,945 0 Powertrain Rockford Inc. 3,996 2,881 0 0 32,890 4,387 Walterscheid Cardan GmbH 11 455 54 0 0 2,950 Total 89,694 89,694 677 677 347,831 347,831 35 Comer Industries
The Group has dealings with subsidiaries and other related parties at market conditions considered as normal in the respective reference market, taking account of the characteristics of the assets and the services provided.
Transactions between Comer Industries S.p.A. and its consolidated subsidiaries, which are entities related to the Company, are eliminated in the consolidated financial statements, and in compliance with IAS 24.
The "Financial income" heading refers mainly to interest accruing in the period on intra-group loans. At December 31, 2022 the following intragroup loans were outstanding:
• Loan to Comer Industries (Shaoxing) Co. Ltd. by Comer Industries (Jiaxing) Co. Ltd. for 4.5 million euros;
• Loan to Comer Industries S.p.A. from Comer Industries (Jiaxing) Co. Ltd. for 8.0 million euros;
• Loan to Comer Industries S.p.A. from WPG German Holdco GmbH in the amount of 10.9 million euros (resulting from the merger by incorporation of WPG Holdco B.V.);
• Financial payable to Comer Industries S.p.A. from Powertrain Services UK in the amount of 18 million euros (arising from the sale of the investment in the subsidiary Walterscheid Monguelfo S.p.A.);
• Loan to WPG German Holdco GmbH from Comer Industries S.p.A. for 39.8 million euros;
• Loan to WPG US Holdco LLC from Comer Industries S.p.A. for 91.8 million euros;
• Loan to WPG UK Holdco Ltd from Comer Industries S.p.A. in the amount of 18.2 million euros (arising from the merger by incorporation of WPG Holdco B.V.);
• Loan to Comer Industries Components s.r.l. in the amount of 6.1 million euros.
DEALINGS WITH PARENT COMPANIES
The Group does not have commercial dealings with the majority shareholder, Eagles Oak S.r.l.
RELATIONS WITH OTHER RELATED PARTIES
It is disclosed that the "Other operating costs" heading includes professional consultancy provided by three Directors of the parent company Comer Industries S.p.A. for non-significant amounts.
36 2022 Annual Report
THE COMPANIES IN THE GROUP
As of December 31, 2022, the Group is organized in a structure with Comer Industries S.p.A. at the top, possessing directly or indirectly 100% of 26 Italian and foreign subsidiaries that constitute the scope of consolidation.
The key figures of the consolidated subsidiary companies are summarized in the table below:
* Values derived from individual financial statements translated into euros at the consolidation exchange rate. The share capital of all Group companies is fully paid up.
1.10
COMPANY COUNTRY % OF CONTROL MAIN ACTIVITY SHARE CAPITAL DECEMBER 31, 2022 REVENUES DECEMBER 31, 2022 EUROS/MN* NET EQUITY DECEMBER 31, 2022 EUROS/MN* HEADCOUNT DECEMBER 31, 2022 Comer Industries S.p.A. Italy Parent company Design, production and sales € 18,487,339 427.46 301.34 947 Comer Industries Components S.r.l. Italy 100% Production and sales € 7,125,000 104.04 16.35 272 Walterscheid Monguelfo S.p.A. Italy 100% Design, production and sales € 2,580,000 53.63 20.80 196 Evoluzione Comer S.r.l. Italy 100% Inactive € 10,000 - 0.10 0 Comer GmbH Germany 100% Sales € 205,000 n.a. 0.33 0 WPG German Holdco GmbH Germany 100% Holding company € 10,495,000 - 0.12 0 Off-Highway Powertrain Services Germany GmbH Germany 100% Sales and aftersales service € 2,050,000 112.46 25.58 358 Walterscheid GmbH Germany 100% Design, production and sales € 17,895,000 194.60 82.60 779 Walterscheid Getriebe GmbH Germany 100% Design, production and sales € 26,000 64.29 7.87 261 Walterscheid Cardan GmbH Germany 100% Production and sales € 25,000 8.24 - 0.16 31 Comer Industries UK Ltd. UK 100% Sales £ 265,000 3.08 0.98 4 WPG UK Holdco Ltd. UK 100% Holding company £ 3,093,000 - 3.39 0 Powertrain Services UK Limited UK 100% Holding company £ 14,231,000 - 4.26 3 Powertrain Services (UK Newco) Ltd. UK 100% Holding company £ 0 - - 0.61 0 Powertrain Services France SAS France 100% Sales and aftersales service € 2,139,000 16.14 11.44 28 Walterscheid Russia LLC. Russia 100% Sales RUB 10,000 1.04 1.40 3 Comer Industries INC United States 100% Sales $ 13,281,000 118.00 26.30 30 WPG US Holdco LLC. United States 100% Holding company $ 58,546,000 - 14.87 0 Walterscheid Inc. Woodridge United States 100% Production and sales $ 2,000,000 68.56 27.16 199 Powertrain Rockford Inc. United States 100% Design, production and sales $ 1,000 86.28 61.39 170 Comer Industries do Brasil EIRELI Brazil 100% Sales BRL 6,112,000 18.35 8.23 8 Walterscheid Brasil Industria de Equipamentos Agricolas Ltda. Brazil 100% Production and sales BRL 8,410,000 17.31 0.19 96 Comer Industries (Jiaxing) Co Ltd. China 100% Production and sales € 11,700,000 185.38 70.29 241 Comer Industries (Shaoxing) Co Ltd. China 100% Production and sales € 6,720,000 5.94 5.17 2 Walterscheid Powertrain (China) Co. Ltd. China 100% Production and sales CNY 162,618,000 30.30 18.34 113 Comer Industries India Pvt Ltd India 100% Production and sales INR 145,090,000 20.61 8.50 67
37 Comer Industries
NON-FINANCIAL INFORMATION
Launched in 2019, Comer Industries Group's Our Bright Impact sustainable development program is based on a commitment to contribute to the achievement of the Sustainable Development Goals, an integral part of the United Nations 2030 Agenda and a point of reference for building a strategy based on sustainability.
In declaring this commitment, the Comer Industries Group has chosen the path of progressive integration of programs and actions within its business model, applying criteria based on sustainability to its strategic choices and operations. Moreover, in order to give greater prominence to its commitment to a sustainable business model, while not falling under the
implementation obligations of Directive 2014/95/ EU (Non-Financial Reporting Directive), it decided to communicate its sustainability performance in a structured manner through the publication of the Non-Financial Statement in accordance with the provisions of Italian Legislative Decree no. 254/2016 and the Global Reporting Initiative Sustainability Standards.
The 2022 Non-Financial Statement contains information relating to environmental, social, personnel-related, respect for human rights, and the fight against corruption, useful to ensure an understanding of the activities carried out by the Comer Industries Group, its performance, its results, and their impact.
1.11
38 2022 Annual Report

39 Comer Industries
SIGNIFICANT EVENTS AFTER THE CLOSE OF THE YEAR AND BUSINESS OUTLOOK
At the end of December 2022 the governing bodies of the subsidiary Comer Industries Components S.r.l. (hereinafter also "Acquirer") and the subsidiary Walterscheid Monguelfo S.p.A (hereinafter also "Acquiree") drew up and approved the merger plan to be implemented through the incorporation of Walterscheid Monguelfo S.p.A into Comer Industries Components S.r.l. pursuant to Art. 2501ter of the Italian Civil Code. The Acquirer and the Acquiree are both wholly and directly owned by the sole shareholder Comer Industries S.p.A. In March 2023 the deed of merger by incorporation of Walterscheid Monguelfo S.p.A. into Comer Components S.r.l. will be signed, with legal effect as of April 1, 2023 and with accounting and tax effects backdated to January 1, 2023.
As previously discussed in the section on significant events in FY 2022, the prospective merger is justified by the need to simplify the Group's corporate structure following the acquisition of WPG.
On January 9, 2023, the parent company Comer Industries S.p.A. concluded the acquisition of e-comer S.r.l., a newly established company that on December 27, 2022 absorbed the business units of Benevelli Electric Powertrain Solutions and Sitem Electric Motors, for an Enterprise Value of 54 million euros plus a variable component (so-called earn out).
E-comer S.r.l. is the new division dedicated to the market of engines and transmissions for electric vehicles, a sector that the Comer Industries Group intends to focus its growth and innovation in by expanding the range of products offered to the market.
This transaction, which resulted in a cash-out at the closing date of 50 million euros, is perfectly in keeping with the Group's strategy to enter the fastgrowing market for electric vehicle engines and transmissions, expanding the range of products offered and further strengthening its leadership position in the market.
The consideration paid for the transaction at closing was financed by resorting to a medium- to long-term bank loan provided by Crédit Agricole Italia of the same amount. The remaining 4 million euros will be paid in four interest-free annual installments starting from the 12th month following the closing date. The newly acquired e-comer S.r.l. will be consolidated from January 1, 2023.
The current macroeconomic landscape is characterized by a high degree of uncertainty resulting from several factors such as i) the unfolding of the Russia-Ukraine conflict and consequent rise in energy prices; ii) tightening of restrictive monetary policies by major Central Banks to slow the rise in inflation; and iii) a global economic slowdown with consequent impact on demand.
Taking into account the current changing environment, management is focused on the Group's main strategic development directives: i) integration of WPG and streamlining the business model in order to optimize synergies; ii) development of e-comer, the Group's newly established greentech division dedicated to the electric vehicle engine and transmission market; and iii) continued R&D in order to always offer innovative solutions and be at the forefront of the market.
No other specific significant events occurred after the close of the year.
1.12
40 2022 Annual Report
1.13 PROPOSAL FOR THE ALLOCATION OF PROFIT

The Board of Directors proposes the Shareholder’s Meeting to approve, in conjunction with the first coupon, the distribution of a dividend of 0.75 euros for each share held at the date of approval. The dividend will be payable next May 17, 2023 (payment date) with an ex-date of May 15, 2023. In this case, all those registered as Comer Industries S.p.A. shareholders at the end of the accounting day of May 16, 2023 (the so-called record date) will
be entitled to the dividend.
The remainder of the profit for the year of the parent company Comer Industries S.p.A. will be allocated to the Legal Reserve in the amount of 281,422.40 euros, as envisaged by Art. 2430 of the Italian Civil Code, 4,199,664.90 euros to the Reserve for unrealized exchange gains, and the remainder to the Extraordinary Reserve.
Reggiolo, March 21, 2023
For the Board of Directors
41 Comer Industries


CONSOLIDATED BALANCE SHEET
(*) Values restated in accordance with IFRS 3 to retrospectively take into account the effects resulting from the final measurement at fair value of WPG's assets and liabilities as of the acquisition date (Purchase Price Allocation), with respect to the provisional accounting carried out as of December 31, 2021. For more details see Section 2.5.1
ASSETS (THOUSAND EUROS) NOTES DECEMBER 31, 2022 DECEMBER 31, 2021 RESTATED Non-current assets Tangible fixed assets 2.6.1 211,514 204,735 Intangible fixed assets 2.6.2 357,272 372,070 (*) Equity investments in other companies 2.6.3 1,523 1,279 Tax assets and deferred tax assets 2.6.4 35,695 42,132 (*) Other long-term receivables 2.6.5 1,407 829 Total 607,411 621,045 Current assets Inventories 2.6.6 244,906 225,628 (*) Trade receivables 2.6.7 207,961 196,130 Other short-term receivables 2.6.7 8,250 8,896 Current tax assets 2.6.8 29,327 17,264 Other short-term financial receivables 0 202 Short-term derivative financial instruments 2.6.9 0 601 Cash and cash equivalents 2.6.9 151,328 85,744 Total 641,772 534,464 TOTAL ASSETS 1,249,183 1,155,509
44 2022 Annual Report
EQUITY AND LIABILITIES (THOUSAND EUROS) NOTES DECEMBER 31, 2022 DECEMBER 31, 2021 RESTATED Share capital and reserves Issued capital 18,487 18,487 Share premium reserve 187,881 187,881 Other reserves 54,495 32,071 Accumulated profit (loss) 183,021 107,173 - Retained earnings 92,305 67,744 - Net profit 90,716 39,429 Total 2.6.10 443,884 345,612 Portion pertaining to minority interests -Total equity 2.6.10 443,884 345,612 Non-current liabilities Long-term loans 2.6.9 190,669 177,743 Other long-term financial payables 2.6.9 48,048 47,592 Deferred tax liabilities 2.6.11 62,371 62,524 (*) Post-employment benefits 2.6.12 118,416 157,800 Other long-term payables 2.6.14 19,697 9,768 Long-term provisions 2.6.13 14,563 9,845 Total 453,764 465,273 Current liabilities Trade payables 2.6.14 198,630 218,611 Other short-term payables 2.6.14 34,758 40,375 Tax liabilities 2.6.15 23,173 21,816 Short-term loans 2.6.9 51,580 29,203 Short-term derivative financial instruments 2.6.9 234 114 Post-employment benefits short-term 2.6.12 5,792 7,379 Other short-term financial payables 2.6.9 9,744 8,739 Short-term provisions 2.6.13 27,624 18,387 Total 351,535 344,624 TOTAL LIABILITIES 1,249,183 1,155,509 45 Comer Industries
CONSOLIDATED INCOME STATEMENT
Other components of the comprehensive income/(loss) statement that will be reclassified to the profit/(loss) in subsequent periods (net of taxes):
Total other components of the comprehensive income/(loss) statement that may be reclassified to the profit / (loss) in subsequent periods, net of taxes
Other components of the comprehensive income/(loss) statement that will not be reclassified to the profit / (loss) in subsequent periods, (net of taxes):
Total other components of the comprehensive income/(loss) statement that will not be reclassified to the profit / (loss) in subsequent periods, net of taxes
CONSOLIDATED INCOME STATEMENT (THOUSAND EUROS) NOTES DECEMBER 31, 2022 DECEMBER 31, 2021 Sales revenues 2.6.17 1,237,576 598,110 Other operating revenues 2.6.18 6,929 5,778 Change in inventories of semi-finished and finished goods and WIP 19,279 45,090 Purchase costs (724,009) (424,237) Personnel costs 2.6.19 (243,644) (86,810) Other operating costs 2.6.21 (114,369) (59,710) Write-downs of receivables and high risk provisions (1,754) (627) Amortization 2.6.1 – 2.6.2 (52,491) (20,764) EBIT 2.6.22 127,517 56,831 Net financial income / (charges) 2.6.23 (2,588) (1,996) Profit before Tax 124,929 54,835 Income taxes 2.6.24 (34,213) (15,406) NET PROFIT 90,716 39,429 of which pertaining to minority interests -of which pertaining to the Group 90,716 39,429 Basic earnings/(loss) per share (in euros) 2.6.25 3.16 1.37 CONSOLIDATED STATEMENT OF COMPREHENSIVE INCOME (THOUSAND EUROS) NOTES DECEMBER 31, 2022 DECEMBER 31, 2021 Net profit 90,716 39,429
Net (loss)/gain on cash flow hedges (963) (743) of which fiscal effect 231 178 Translation differences on foreign financial statements (3,866) 6,333
(4,598) 5,768
Gain/(loss) on revaluation of defined benefit plans 2.6.12 39,320 (316) of which fiscal effect 2.6.12 (12,828) 50
26,492 (265) Total comprehensive profit/(loss) net of taxes 112,610 44,932
46 2022 Annual Report
47 Comer Industries
(THOUSAND
NOTES DECEMBER 31, 2022 DECEMBER 31, 2021 CASH FLOW FROM OPERATING ACTIVITIES: Profit (Loss) for the year 90,716 39,429 Adjustments for: Financial income and expenses and valuation exchange differences 2,588 1,996 Amortization of intangible fixed assets 2.6.2 17,942 2,390 Depreciation of tangible fixed assets 2.6.1 34,549 13,823 Impairment losses on assets 0 0 Other non-monetary items 2,194 Capital gains from asset disposals 0 0 Net change in provisions for risks and charges 2.6.13 13,954 8,649 Net change in post-employment benefits 2.6.12 (1,651) (58) Net change in deferred taxes (6,544) (3,007) Operating cash flow before changes in working capital 151,554 65,415 Change in inventories 2.6.6 (19,278) (45,090) Change in trade receivables 2.6.7 (11,832) (33,098) Change in trade payables 2.6.14 (19,981) 75,528 Change in other receivables (including current tax receivables) (11,416) (2,083) Change in other payables (including current tax payables) (4,260) 7,630 Net change in other non-current assets and liabilities 9,350 (799) Cash flow generated (absorbed) by changes in working capital (57,417) 2,087 Cash flow generated (absorbed) by operations 94,137 67,502 CASH FLOW FROM INVESTMENT ACTIVITIES: (Investments)/Divestments in intangible fixed assets 2.6.2 (3,144) (1,788) (Investments)/Divestments in tangible fixed assets 2.6.1 (30,735) (19,150) 48 2022 Annual Report
STATEMENT OF CASH FLOWS
EUROS)
STATEMENT OF CASH FLOWS (THOUSAND EUROS) NOTES DECEMBER 31, 2022 DECEMBER 31, 2021 (Investments)/Divestments in equity investments 2.6.3 (244) 0 Net cash flow from investment/disinvestment activities (34,123) (20,938) Free cash flow 60,014 46,564 Net increases from business acquisition net of cash acquired 2.5.1 (190,514) Business combinations 0 (190,514) CASH FLOW FROM FINANCING ACTIVITIES: Net change in current financial assets 803 411 Net change in non-current financial assets 0 Change in current payables due to banks and other lenders 2.6.9 12,910 20,505 Change in non-current payables due to banks and other lenders 2.6.9 13,382 174,866 Financial income and expenses and valuation exchange differences (2,588) (1,996) Dividends paid 2.6.10 (14,339) (10,205) Change in equity for translation reserve and other impacts 2.6.10 (4,598) 7,936 Cash flow generated (absorbed) by financial operations 5,570 191,516 Increase (Decrease) in cash and cash equivalents 65,584 47,567 Net cash and cash equivalents at the start of the year 85,744 38,177 Cash and cash equivalents at the end of the year 2.6.9 151,328 85,744 Change in cash and cash equivalents 65,584 47,567 49 Comer Industries
CONSOLIDATED STATEMENT OF CHANGES IN EQUITY
Profit/(Loss) for the period
Components of the comprehensive profit/(loss): IAS 19.93A - Actuarial gains
Components of the comprehensive profit/(loss): Changes in conversion reserve
Components of the comprehensive profit/(loss): Change in CFH reserve
Subtotal: Result of comprehensive income/(loss) statement
(THOUSAND
SHARE CAPITAL SHARE PREMIUM RESERVE STOCK GRANT RESERVE LEGAL RESERVE Net equity at January 01, 2021 13,109 27,944 5,987 2,622
EUROS)
Distribution of dividends Allocation of 2020 profit Capital increase resulting from the exercise of warrants 239 Share premium reserves from exercise of warrants 2,151 Effects of the acquisition: capital increase 5,139 Share premium reserves arising from the acquisition 157,787 Notional stock grant cost 2,194 Net equity at December 31, 2021 18,487 187,881 8,181 2,622
Distribution of dividends Allocation of 2021 profit 794 Effects of the acquisition: capital increase Share premium reserves arising from the acquisition Net equity at December 31, 2022 18,487 187,881 8,181 3,416
50 2022 Annual Report
OTHER RESERVES RETAINED EARNINGS PROFIT/ LOSS FOR THE YEAR TOTAL NET EQUITY EXTRAORD. RESERVE TRANSLATION RESERVE IAS 19 RESERVE F.T.A. RESERVE C.F.H. RESERVE CONSOLIDATION RESERVE 19,225 (2,256) (5,923) 910 3,543 56,448 21,765 143,375 39,429 39,429 (265) (265) 6,333 6,333 (565) (565) 6,333 (565) (265) 39,429 44,932 (10,205) (10,205) 21,765 (21,765) 239 2,151 5,139 157,787 2,194 19,225 4,078 (5,923) 345 3,543 67,744 39,429 345,612 90,716 90,716 26,227 265 26,492 (3,866) (3,866) (732) (732) (3,866) 26,227 (732) 265 90,716 112,611 (14,339) (14,339) 38,635 (39,429) 19,225 212 26,227 (5,923) (387) 3,543 92,305 90,716 443,884 51 Comer Industries
2.1 GENERAL INFORMATION
Comer Industries S.p.A. is an Italian company with headquarters and administrative offices in Via Magellano 27 in Reggiolo (RE), tax code and registration in the Company Register no. 07210440157 with resolved Share Capital of 18,487,338.60 euros fully subscribed and paid up as of December 31, 2022, divided into 28,678,090 ordinary shares.

Comer Industries is the leading global player in the design and manufacture of advanced engineering systems and mechatronics solutions for power transmissions. It operates in the agricultural machinery, construction and forestry equipment, energy and industrial sectors. The Group consists of 26 companies, including 12 production companies located in Italy, Germany, the United States, China and India, 8 trading companies operating in Germany, France, the UK, Russia, China, Brazil and the United States, and 6 holding companies.
Pursuant to Art. 2497 bis of the Italian Civil Code, note that Comer Industries S.p.A. is subject to direction and coordination by Eagles Oak S.r.l., with registered office in Modena, Viale del Sagittario 5, Share Capital 2,000,000 euros entirely paid-up, tax code and registration in the Company Register no. 03699500363, which has control over it, as holder of the absolute majority of its shares.
The consolidated financial statements as of December 31, 2022, drafted on a going concern basis, with respect to which there are no aspects of uncertainty, were approved by the Board of Directors on March 21, 2023. At the date of approval of these financial statements the share capital amounts to 18,487,338.60 euros subdivided into 28,678,090 shares.
52 2022 Annual Report
2.2 SCOPE OF CONSOLIDATION
Below are the main changes that took place in 2022.
On July 28, 2022 the deed of merger of the subsidiary WPG Holdco B.V. (non-operating parent company of the newly acquired Walterscheid Group) into Comer Industries S.p.A. was signed, which had already been resolved by the Shareholders' Meeting of April 27, 2022. The transaction took effect on August 2, 2022 upon the registration of the deed of Merger with the relevant company register of Reggio Emilia. This transaction did not have any accounting impact on the consolidated financial statements.
On December 6, 2022, the parent company Comer Industries S.p.A. purchased the shares representing 100% of the share capital of Walterscheid Monguelfo S.p.A. owned by the subsidiary Powertrain Services UK Ltd at a price of 19 million euros. Moreover, this transaction did not have any accounting impact on the consolidated financial statements.
On December 16, 2022, 0.001% of Walterscheid Brasil Industria de Equipamentos Agricolas LTDA. was transferred from Powertrain Services (UK NEWCO) Limited to Powertrain Services UK Limited, which becomes the sole shareholder, at a value of R$1.00 (1 Real). This transaction did not have any accounting
impact on the consolidated financial statements. In 2022 the process of closing subsidiaries GKN Ohio Inc. and Walterscheid A/S began as they were no longer operational.
At the end of 2022, Evoluzione Comer S.r.l. was established with share capital of 10,000 euros, wholly owned by parent company Comer Industries S.p.A. The company will close its first fiscal year on December 31, 2023 and is currently not operational, therefore it was excluded from consolidation as of December 31, 2022.
Walterscheid Russia LLC has been inactive since April 2022.
At the reference date of these consolidated financial statements the parent company Comer Industries S.p.A. is held by Eagles OAK S.r.l.
With regards to the summary of economic-asset/ liability relations with related parties of the Group, reference should be made to the details in the Management Report.
The scope of consolidation as at December 31, 2022 includes the Parent company and the following subsidiaries:
53 Comer Industries
ENTITY NAME REGISTERED OFFICE CURRENCY SHARE CAPITAL AUTHORIZED % OF CONTROL PARENT COMPANY Comer Industries S.p.A. Reggiolo (RE) – Italy KEUR 18,487 Holding company Eagles Oak S.r.l. Comer GmbH Pfullendorf – Germany KEUR 205 100 Comer Industries S.p.A. Comer Industries Inc. Charlotte, NC – U.S.A. KUSD 13,281 100 Comer Industries S.p.A. Comer Industries U.K. Ltd. Leicester - United Kingdom KGBP 265 100 Comer Industries S.p.A. Comer Industries Components S.r.l. Matera - Italy KEUR 7,125 100 Comer Industries S.p.A. Comer Industries (Shaoxing) Co. Ltd. Shaoxing – P.R.C. KEUR 6,720 100 Comer Industries S.p.A. Comer Industries do Brasil EIRELI Limeira (SP) - Brazil KBRL 6,112 100 Comer Industries S.p.A. Comer Industries India Pvt Ltd. Bangalore – India KINR 145,090 95 Comer Industries S.p.A. 5 Comer Ind. Com. S.r.l. Comer Industries (Jiaxing) Co. Ltd. Jiaxing – P.R.C. KEUR 11,700 65.8 Comer Industries (Shaoxing) Co. Ltd. 34.2 Comer Industries S.p.A. Walterscheid Monguelfo S.p.A. Monguelfo - Tesido, Italy KEUR 2,580 100 Comer Industries S.p.A. Evoluzione Comer S.r.l. Reggiolo (RE) – Italy KEUR 10 100 Comer Industries S.p.A. WPG German Holdco GmbH Lohmar, Germany KEUR 10,495 100 Walterscheid Powertrain Holdco B.V. WPG UK Holdco Ltd. Leek, United Kingdom KGBP 3,093 100 Walterscheid Powertrain Holdco B.V. WPG US Holdco LLC. Rockford, IL, USA KUSD 58,546 100 Walterscheid Powertrain Holdco B.V. Off-Highway Powertrain Services Germany GmbH Lohmar, Germany KEUR 2,050 89.9 Walterscheid GmbH 10.1 WPG German Holdco GmbH Walterscheid GmbH Lohmar, Germany KEUR 17,895 100 Walterscheid Powertrain Holdco B.V. Walterscheid Getriebe GmbH Sohland, Germany KEUR 26 89.84 Walterscheid GmbH 10.16 WPG German Holdco GmbH Walterscheid Brasil Industria de Equipamentos Agricolas Ltda. Cachoeirinha, Brazil KBRL 8,410 100 Powertrain Services UK Limited Walterscheid Powertrain (China) Co. Ltd. Jiangsu, China KCNY 162,618 100 WPG UK Holdco Ltd. Powertrain Services France SAS Chanteloup-les-Vignes, France KEUR 2,139 100 Off-Highway Powertrain Services Germany GmbH Walterscheid Russia LLC Moscow, Russian Federation KRUB 10 50 WPG UK Holdco Ltd. 50 Powertrain Services UK Limited Powertrain Services UK Limited Leek, United Kingdom KGBP 14,231 100 WPG UK Holdco Ltd. Powertrain Services (UK Newco) Ltd. Leek, United Kingdom KGBP - 100 Powertrain Services UK Limited Walterscheid Inc. Woodridge Woodridge, IL, USA KUSD 2,000 100 WPG US Holdco LLC. Powertrain Rockford Inc. Rockford, IL, USA KUSD 1 100 WPG US Holdco LLC. Walterscheid Cardan GmbH Hohe Börde OT Irxleben, Germany KEUR 25 100 Walterscheid GmbH Matsui Walterscheid Ltd. Koga, Japan KJPY - 40 Walterscheid GmbH 54 2022 Annual Report
2.3
ACCOUNTING STANDARDS ADOPTED
2.3.1 EXPRESSION OF COMPLIANCE WITH IFRS
The consolidated financial statements of Comer Industries have been drawn up in compliance with the International Financial Reporting Standards (IFRS), issued by the International Accounting Standards Board ("IASB") and approved by the European Union and in force at the balance sheet date. The notes to the consolidated financial statements have been integrated, on a voluntary basis, with the additional information required by Consob and by the provisions issued by it in implementation of Art. 9 of Italian Leg. Dec. 38/2005 (resolutions 15519 and 15520) of July 27, 2006 and the DEM/6064293 communication of July 28, 2006, pursuant to Art. 78 of the Issuers’ Regulations, the EC document of November 2003 and, where applicable, the Italian Civil Code. "IFRS" also refers to the International Accounting Standards ("IAS") still in force, as well as all the interpretive documents issued by the IFRS Interpretations Committee, previously called the International Financial Reporting Interpretations Committee ("IFRIC") and before that, the Standing Interpretations Committee ("SIC").
2.3.2 CONTENTS AND FORM OF THE CONSOLIDATED FINANCIAL STATEMENTS
The unit of currency used is the Euro, and all values are expressed in thousands of euro unless otherwise indicated.
The presentation layout for the consolidated balance sheet makes a distinction between current and non-current assets and liabilities, in which:
• non-current assets include balances of assets realizable after more than one year and include intangible, tangible and financial assets and deferred tax assets;
• current assets include the balances of assets realizable within 1 year;
• non-current liabilities include payables falling due after more than 1 year, including financial debts, provisions for liabilities and charges and liabilities for employee benefits and deferred tax liabilities;
• current liabilities include payables falling due within 1 year, including the short-term portion of medium-long-term loans and of provisions for liabilities and charges and liabilities for employee benefits.
The consolidated income statement is presented according to a "costs by nature" classification. The cash flow statement has been drawn up on the basis of the indirect method and is presented in compliance with IAS 7, classifying cash flows between operating, investment and financing activities.
It should be noted that, with reference to Consob resolution no. 15519 of July 27, 2006 and the DEM/6064293 communication of July 28, 2006, details of significant dealings with related parties are disclosed on the financial statements on a voluntary basis in order to provide more complete information.
2.3.3 RELEVANT ACCOUNTING STANDARDS
The Comer Industries S.p.A. Group adopted International Accounting Standards and International Financial Reporting Standards as of 2007, with the transition date to IFRS effective January 1, 2006.
Continuing these principles, the consolidated financial statements as of December 31, 2022, were therefore drawn up according to the IAS / IFRS adopted by the European Union. The consolidated financial statements are presented in thousands of euros. The financial statements are prepared on a cost basis, except
55 Comer Industries
for financial instruments that are measured at fair value.
The preparation of the financial statements in accordance with IFRS (International Financial Reporting Standards) requires judgments, estimates and assumptions that have an effect on the assets, liabilities, income and expenses. The actual results may differ from the results obtained using these estimates.
The accounting policies have been applied consistently in all Group companies and for all periods presented.
2.3.4 PRINCIPLES OF CONSOLIDATION
(i) Subsidiaries
Companies are defined subsidiaries when the parent company has the authority, directly or indirectly, to conduct business so as to obtain benefits from such activities. In defining control, consideration is also given to potential voting rights that can currently be freely exercised or converted. These potential voting rights are not taken into account for the purposes of the consolidation process upon allocation to minority shareholders of the results of operations and the share of capital and reserves they are entitled to. The financial statements of subsidiaries are consolidated from the date on which the Group gains control and de-consolidated from the date that this controlling interest ceases.
The global integration method is adopted for the consolidation of subsidiaries, involving undertaking the total amount of assets and liabilities and all costs and revenues, irrespective of the extent of the Group's interest. The book value of consolidated equity investments is therefore offset against any relative capital and reserves. The shares of capital and reserves and profits pertaining to minority shareholders are shown separately under a specific capital and reserve item and on a separate line of the consolidated income statement. Intercompany dividends distributed by foreign subsidiaries are eliminated in the consolidation process using the proportionate approach provided for by IAS 21, since, even in the case of distribution of profit reserves generated in previous years, the investor’s percentage equity ownership is not considered to be affected.
(ii) Related companies
Related companies are those companies over which the Group has considerable influence but in which it does not exercise any control over the management. The consolidated financial statements include the accrued share of the profits and losses of related companies, measured using the equity method from the date on which any such significant influence on operation started until its termination. Similar to that described above for the subsidiaries, the acquisition of related companies is also recorded under the purchase method; in this case, any acquisition cost in excess of the Group's share of the fair value of net assets acquired is included in the value of the equity investment.
(iii) Transactions eliminated in the consolidation process
Intercompany balances and profits and losses resulting from intercompany transactions are eliminated in the consolidated financial statements. Profits arising from intercompany transactions with associated companies are eliminated as part of the valuation of the equity investment using the equity method. Intercompany losses are eliminated only if there is evidence that these were realized in detriment to third parties.
2.3.5 SECTORAL INFORMATION
Industry-related information is given with reference to sectors of activity. The information includes both costs directly attributable and costs allocated according to reasonable assumptions. General and administrative costs, ICT and HR services, fees for directors, statutory auditors and Group management departments, as well as costs relating to the global sourcing area (organized according to purchasing group of product category) have been allocated to sectors on the basis of turnover.
The Group operates in the following sectors:
- Agricultural sector. This mainly consists of speed increasers, speed reducers, bevel gearboxes, PTO driveshafts, wheel drives and axles for agricultural use, especially manufacturers of combine harvesters and tractors, haymaking, harvesting, irrigation and mixing, and land preparation and working machines.
- Industrial sector. This includes products such as modular planetary drives, travel and hoist drives, slew drives and rigid and steering axles for construction
56 2022 Annual Report
and forestry machinery manufacturers, from the shipbuilding to the airport building and mining industries. Components for municipalities, for the extraction industry and material handling sectors.


Products for the wind power and renewable energy sector as well as for driving the augers of biogas machines.


57 Comer Industries
2.3.6 TREATMENT OF FOREIGN CURRENCY TRANSACTIONS
(i) Foreign currency transaction
The functional currency and reporting currency adopted by Comer Industries Group is the Euro. Transactions in foreign currencies are converted into Euro on the basis of the exchange rate at the transaction date. The monetary assets and liabilities are converted at the exchange rate on the balance sheet date. Any exchange rate differences arising out of conversion are recognized in the income statement. Non-monetary assets and liabilities measured at historical cost are converted at the exchange rate at the transaction date. The monetary assets and liabilities measured under fair value are converted into euro at the exchange rate on the date the fair value was determined.
(ii) Conversion of financial statements drawn up in foreign currencies
The assets and liabilities of companies based in non-EU countries, including adjustments arising from the consolidation process, relating to goodwill and fair value adjustments arising from the acquisition of a non-EU company, are converted at the exchange rate prevailing on the closing date of the balance sheet. Revenues and costs of these companies are converted at the average exchange rate for the period, closest to the exchange rates on the dates on which the individual transactions took place. Foreign exchange differences arising from the conversion process are recorded directly in a special provision under capital and reserve called the conversion reserve.
Below is the table with the exchange rates applied for the conversion of financial statements:
EXCHANGE RATES
SPOT EXCHANGE RATES AVERAGE ANNUAL EXCHANGE RATES DECEMBER 31, 2022 DECEMBER 31, 2021 2022 2021 €/GBP 0.887 0.840 0.853 0.860 €/USD 1.067 1.133 1.053 1.183 €/CNY 7.358 7.195 7.079 7.628 €/BRL 5.639 6.310 5.440 6.378 €/INR 88.171 84.229 82.686 87.439 €/CHF 0.985 1.033 1.005 1.081 €/CZK 24.116 24.858 24.566 25.640 €/DKK 7.437 7.436 7.440 7.437 €/JPY 140.660 130.380 138.027 129.877 €/NOK 10.514 9.989 10.103 10.163 €/RUB 115.484 85.300 88.397 87.153 €/SEK 11.122 10.250 10.630 10.147 €/HUF 400.870 369.190 391.287 358.516 €/PLN 4.681 4.597 4.686 4.565
Source: Bank of Italy
58 2022 Annual Report
The latest available exchange rates were used for the €/RUB exchange rate.
2.3.7 ACQUISITIONS
Business combinations are recognized according to the acquisition method.
According to this method, the consideration transferred in a business combination is measured at fair value, calculated as the sum of the fair values of the assets transferred and the liabilities assumed by the Group at the acquisition date. Any transaction costs are recognized in the income statement at the time they are incurred. Goodwill is determined as the excess of the sum of the consideration transferred in the business combination, the value of shareholders' equity pertaining to minority interests, and the fair value of any equity investment previously held in the acquired company over the fair value of the net assets acquired and liabilities assumed at the acquisition date. If the value of the net assets acquired and liabilities assumed at the date of acquisition exceeds the sum of the consideration transferred, the value of shareholders' equity pertaining to minority interests, and the fair value of any equity investment previously held in the acquired company, this excess is immediately recognized in the income statement as income from the transaction concluded. The portions of shareholders' equity of non-controlling interests at the date of acquisition may be measured at fair value or at the pro-rata value of the net assets recognized for the acquired company. The choice of valuation method is made on a transaction-bytransaction basis. If the initial values of a business combination are incomplete at the balance sheet date that the business combination occurred on, in its consolidated financial statements the Group reports the provisional values of the items for which recognition cannot be completed. These provisional values are adjusted during the measurement period to reflect new information gathered about facts and circumstances existing at the acquisition date which, if known, would have affected the value of the assets and liabilities recognized at that date.
2.3.8 PROPERTY, PLANT AND EQUIPMENT (i) Owned fixed assets
Property, plant and equipment are measured at historical cost and are reported net of depreciation (see next point (iv)) and impairment losses (see para. 2.3.10). The cost of fixed assets manufactured internally includes materials, direct labor and a share of indirect manufacturing costs. The cost of fixed assets, whether purchased externally or manufactured internally, includes incidental costs directly chargeable and necessary to operate the asset and, when relevant and subject to contractual obligations, the current value of the estimated cost for the dismantling and removal of fixed assets.
Financial charges relating to specific loans used for the acquisition of tangible fixed assets are charged to the income statement on an accruals basis. According to the provisions of IAS 20, any capital grants obtained as a result of investment incentives granted by the public administration are deducted from the historical cost of any related capitalized fixed assets, when put into operation. No fixed assets are available for sale.
(ii) Fixed assets under finance leases
Assets held by the Group under leasing contracts, including operating leases, in accordance with the IFRS 16 standard in force since January 1, 2019, are recognized as assets with a balancing entry in financial payables. In particular, assets are recognized at a value equal to the current value of future payments at the date of signing the contract, discounted using the applicable incremental borrowing rate for each contract.
(iii) Subsequent costs
The costs of replacing certain parts of the fixed assets are capitalized when it is probable that these costs will result in future economic benefits and can be reliably measured. All other costs, including the costs of maintenance and repairs, are attributed to the income statement as incurred.
59 Comer Industries
(iv) Depreciation
Depreciation is charged to the income statement on a straight-line basis and on the estimated useful life of fixed assets and their residual possible use. Land is not depreciated. The estimated useful life results in the following depreciation rates by homogeneous category:
The estimated useful life of assets is revised annually and any changes in rates, where necessary, are made prospectively.
For assets purchased and/or that became operational during the year, depreciation is calculated using the rates set out above, but adapted pro-rata temporis to any such set-up date.
2.3.9 OTHER INTANGIBLE FIXED ASSETS
(i) Research and development costs
The costs of research with the aim of acquiring new technical knowledge are charged in the income statement when incurred.
The development costs incurred for the creation of new products, versions, accessories or new production processes are capitalized when:
o these costs can be reliably determined;
o these products, versions or processes are technically and commercially feasible;
o the expected volumes and realization values indicate that the costs incurred for development will generate future economic benefits;
o the resources to complete the development project exist.
The capitalized cost includes the materials and the mere cost of direct labor. Other development costs are charged to the income statement when incurred. The capitalized development costs are measured at cost, net of accumulated amortization, (see next point (iv)) and impairment losses (see para. 2.3.10)
(ii) Other intangible fixed assets
Other intangible fixed assets, which all have finite useful lives, are measured at cost and are recorded net of accumulated amortization, (see next point iv) and impairment losses (see para. 2.3.10)
The use of software licenses is amortized over their period of use (3-5 years).
The costs incurred internally for the creation of trademarks or goodwill are charged to the income statement when incurred.
(iii) Subsequent costs
Subsequent costs incurred for intangible fixed assets are capitalized only if they increase the future financial benefits of the specific capitalized fixed asset, otherwise they are charged in the income statement as incurred. Incidental financing costs
Buildings 2.5%-3% Light construction, general and specific equipment 10 – 15.5% Equipment, models and molds 20 – 25% Furniture and furnishings 12% Electronic office equipment 18 – 20% Motor vehicles and internal transport 20 – 25%
60 2022 Annual Report
(iv) Amortization
Amortization is charged to the income statement on a straight-line basis based on the estimated useful life of the capitalized fixed assets. The estimated useful lives are as follows:
The useful life is reviewed annually and any changes in rates, where necessary, are made prospectively.
2.3.10 IMPAIRMENT OF ASSETS
The book values of the assets, except for stocks, financial assets regulated by IFRS 9 and deferred tax assets, are subject to review at the balance sheet date, in order to determine if any impairment indicators exist. If the assessment reveals the presence of such indicators, the estimated realizable value of the asset is calculated in the manner indicated below. Please note that the estimated realizable value of goodwill and intangible fixed assets not yet used is estimated at least once per year, or more frequently if events indicate the possibility of a loss of value. A tangible or intangible asset, including rights of use (as defined by IFRS 16), suffers an impairment if it is not able to recover the book value at which the asset is recorded in the financial statements through the use or sale thereof. The purpose of the verification (impairment test) provided by IAS 36, is to ensure that tangible and intangible fixed assets are not carried at a value higher than their realizable value, consisting of the net realizable value or value in use, whichever is higher. The value in use is the current value of future financial flows that are expected to be generated by the asset or by the cash generating unit to which the asset belongs. Expected cash flows are discounted using a pre-tax discount that reflects the current market estimate of the cost of money
reported at the time and risks specific to the asset. If the book value is higher that the realizable value, the assets or cash-generating unit to which they belong are written down to reflect the realizable value. These impairment losses are recognized in the income statement.
If the conditions that led to the impairment cease to exist, the assets previously written down are proportionally reversed until reaching at most the value that the assets would have had in the absence of previous impairments, net of amortization calculated on the historical cost. Restorations of value are recognized in the income statement. The goodwill value previously written down can never be reinstated.
2.3.11 EQUITY INVESTMENTS
Equity investments in associates are measured using the equity method, as required by IAS 28. If impairment with respect to the amount determined using the above method is detected, the equity investment is written down accordingly.
2.3.12 CASH AND CASH EQUIVALENTS
Cash and cash equivalents include cash on hand, bank and postal deposits and securities with an original maturity of less than three months.
Patents and trademarks 5 years Development costs 3-5 years Licensing of software 5 years
61 Comer Industries
2.3.13 CURRENT FINANCIAL ASSETS, RECEIVABLES AND OTHER ASSETS
Financial assets, as provided for by the new IFRS 9 – "Financial Instruments: recognition and measurement" (as revised in July 2014) which replaces IAS 39 - "Financial Instruments: Recognition and Measurement", are classified, on the basis of the Group's management methods and the related contractual cash flow characteristics, in the following categories:
• Amortized cost: financial assets held exclusively for the purpose of collecting the contractual cash flows are classified in the Amortized cost category. They are valued using the amortized cost method, recording the income in the income statement using the effective interest rate method;
• Fair value through other comprehensive income ("FVOCI"): financial assets whose contractual cash flows are represented exclusively by the payment of principal and interest and which are held in order to collect the contractual cash flows as well as the flows deriving from the sale of the same are classified in the FVOCI category. They are measured at fair value. Interest income, exchange rate gains/losses, impairment losses (and related write-backs) of financial assets classified in the category FVOCI, are recorded in the income statement; other changes in the fair value of assets are recorded among the other components of OCI. When these financial assets are sold or reclassified to other categories, due to a change in the business model, the cumulative gains or losses recognized in OCI are reclassified to the income statement;
• Fair value through profit or loss ("FVTPL"): the FVTPL category is residual in nature by collecting financial assets that do not fall under the Amortized cost and FVOCI categories, such as financial assets purchased for trading or derivatives, or assets designated as FVTPL by management at the date of initial recognition. They are measured at fair value. Gains or losses resulting from this measurement are recognized in the income statement;
• FVOCI for equity instruments: financial assets represented by equity instruments of other entities (i.e. investments in companies other than
subsidiaries, associates and joint ventures), not held for trading purposes, can be classified in the FVOCI category. This choice can be made instrument by instrument and requires changes in the fair value of these instruments to be recognized in the OCI and not to be reversed to the income statement either on sale or on impairment of the same. Only dividends from these instruments will be recognized in the income statement. The fair value of financial assets is determined on the basis of quoted bid prices or through the use of financial models. The fair value of unlisted financial assets is estimated using specific valuation techniques adapted to the specific situation. Valuations are regularly carried out in order to verify whether there is objective evidence that a financial asset or group of assets may be impaired. If there is objective evidence, the impairment loss is recognized as a cost in the income statement for the period.
2.3.14 DERIVATIVE FINANCIAL INSTRUMENTS
The Group holds derivative financial instruments subscribed for hedging purposes; however, in cases in which the derivative financial instruments do not meet all the conditions applicable to hedge accounting as per IFRS 9, the changes in fair value of these instruments are recorded in the income statement as financial charges and/or income.
Therefore, the derivative financial instruments are recorded in compliance with the hedge accounting regulations when:
o the hedge ratio is formally designated and documented at the beginning of the hedge;
o it is presumed that the hedge is highly effective;
o the effectiveness can be reliably measured and the hedge itself is highly effective during the designated periods.
The fair value of derivative financial instruments against exchange risks (forward) is their market value on the balance sheet date, which coincides with the discounted market value of the forward. The accounting method for derivative financial instruments varies depending on whether or not the conditions and requirements of IAS 9 are met.
Specifically:
62 2022 Annual Report
(i) Cash flow hedges
In the case of a derivative financial instrument for which the hedging ratio to variations in cash flows generated by an asset or liability or a future transaction (underlying hedged item) believed to be highly probable and that could affect the income statement is formally documented, the effective portion, originating from the adjustment of the derivative financial instrument to the fair value, is charged directly to a reserve under capital and reserves. When the underlying hedged cash flow occurs, any such reserve is removed from capital and reserves and assigned to the income statement as operating charges and revenues, while any non-effective portion or overhedging, portion is immediately allocated to the income statement as financial charges and/or income. When a hedging instrument reaches maturity, is sold or exercised, or the company changes the relationship with the underlying hedged item, and the forecast transaction, though it has yet to take place, is still considered likely, the resulting profits or losses originating from the adjustment of the financial instrument to the fair value remain under capital and reserves and are charged to income statement when the transaction takes place as described above. If the probability of the underlying transaction occurring is no longer likely, the related profits or losses from the derivative contract, originally recorded under capital and reserves, are immediately charged to the income statement.
(ii) Hedges of monetary assets and liabilities (Fair value hedges)
Where a derivative financial instrument is used to hedge changes in value of monetary assets or liabilities already recorded in the financial statements that could affect the income statement, profits and losses related to changes in fair value of the derivative financial instruments are immediately recorded in the income statement. Likewise, the profits and losses relating to the hedged item modify the carrying amount of any such item and are recorded in the profit and loss account.
2.3.15 INVENTORIES
Stocks are recorded, in each homogeneous category, at the purchase cost, including incidental and production costs and the corresponding net realizable or market value at year-end, whichever is lowest. The cost is determined according to the weighted average cost method.
As far as goods manufactured by the Company (semi-finished, work in progress and finished goods) are concerned, the cost of production includes all directly chargeable costs (raw materials, consumables, energy utilities, direct labor), and the cost of manufacturing (indirect labor, depreciation, etc.) in the amount reasonably attributable to the products.
Any stock impairment risks are hedged by the relevant stock depreciation allowance recorded as an adjustment to the corresponding assets item. Amounts thus obtained do not differ significantly from current costs on the closing date of accounts.
2.3.16 INTEREST-BEARING FINANCIAL PAYABLES
All interest-bearing financial liabilities are valued as per the amortized cost method; the difference between this value and the settlement value is charged to the income statement during the term of the loan.
63 Comer Industries
2.3.17 LIABILITIES FOR EMPLOYEE BENEFITS
(i) Defined contribution plans
The Group participates in public or privately defined contribution pension schemes on a mandatory, contractual or voluntary basis. The payment of contributions fulfills the Group's obligation towards its employees. The contributions are costs recognized in the period in which they are due.
(ii) Defined benefit plans for employees for Italian companies
The defined benefit plans for employees are payable on or after the termination of the period of employment in the Group. These mainly include the severance indemnities which are calculated separately for each plan using actuarial methods to estimate the amount of future benefit accrued to employees during the year and in previous years. The resulting benefit is discounted and recorded net of the fair value of any related assets. The interest rate used to calculate the present value of the obligation was determined in accordance with para. 78 IAS 19, of the Iboxx Corporate A index with duration 7-10 determined at the date of valuation. To this end, the yield for a duration comparable to the overall duration of the worker's covered by the assessment was chosen.
In the case of increases in plan benefits, the portion of the increase relating to the previous employment period is charged to the income statement on a straight line basis over the period in which the related rights will be acquired. If the rights are acquired immediately, the increase is immediately recorded in the income statement. The expected present value of benefits payable in the future related to the length of employment in the current period, conceptually similar to the accrued share of the employee severance indemnity (TFR), is classified under personnel costs in the income statement while the implicit financial charges are reclassified in the applicable financial section.
(iii) Employee defined benefit plans for German and American subsidiaries
Certain group companies offer defined benefit, post-employment, and other long-term pension plans. The cost of providing benefits under the
plan is determined using the projected unit credit method. The companies' net obligation is calculated separately for each plan by estimating the amount of future benefit that employees have accrued in the current and prior periods, discounting that amount and deducting the fair value of any plan assets.
Measurements, including actuarial gains and losses and the return on plan assets (excluding interest), are recognized immediately in the balance sheet, with a corresponding debit or credit to retained earnings, through comprehensive income for the period they occur in. Remeasurements are not reclassified to earnings in subsequent periods. Costs for past services are recognized in earnings on the date of the plan amendment or reduction. Interest is calculated by applying the discount rate to the defined benefit liability.
The companies' obligation with respect to other long-term employee benefits is equal to the future benefit that employees have received in exchange for their current work and in prior periods. This benefit is discounted to determine its present value.
2.3.18 INCOME TAXES
Income taxes recognized in the income statement include current and deferred taxes. Income taxes are generally charged to the income statement, unless they relate to items recognized directly under capital and reserves. In this case, the income taxes are also charged directly to capital and reserves, as a variation to the amount recorded.
Current taxes are taxes calculated by applying the tax rate in effect on the balance sheet date and adjustments to prior year taxes to taxable income. Deferred taxes are calculated using the so-called liability method on timing differences between the amount of assets and liabilities recorded in the financial statements and the corresponding values recognized for tax purposes. Deferred taxes are calculated according to the designated method of reversal of timing differences, on the basis of realistic estimates of financial charges resulting from the application of the tax legislation in force at the date in which the financial statements were prepared.
Deferred tax assets are recognized only if it is
64 2022 Annual Report
probable that sufficient taxable income will be generated in future years to realize these deferred taxes.
2.3.19 PROVISIONS FOR RISKS AND CHARGES
Provisions for risks and charges relate to costs and charges of a specific nature and certain or likely existence, the amount and date of occurrence of which are not known at the close of the period. Provisions are recognized when:
o the existence of a pending liability arising from a past event is probable;
o it is likely that the obligation will be burdensome;
o the amount of the obligation can be estimated reliably.
Provisions are recorded at the value reflecting the best estimate of the amount the company would reasonably pay to settle the obligation or transfer it to third parties at the end of the period.
The costs that the Group expects to incur to carry out restructuring plans are recorded in the financial year the Company formally defines the plan and the interested parties have a valid expectation that the restructuring will happen.
The provisions are periodically updated to reflect any variations in estimates of costs and realization times. Revisions of the provision estimates are charged in the same income statement item that had previously held the provision. The notes to the consolidated financial statements illustrate the contingent liabilities consisting of:
o possible, but not probable, obligations arising from past events, the existence of which will be confirmed only by the occurrence or nonoccurrence of one or more uncertain future events not wholly under the control of the company;
o present obligations arising from past events the amount of which cannot be reasonably estimated or the fulfillment of which will probably not be burdensome.
2.3.20 CURRENT FINANCIAL LIABILITIES, TRADE PAYABLES AND OTHER PAYABLES
Trade payables and other payables, which mature within the normal commercial terms, are not discounted and are recognized at cost (identified by nominal value) reflecting their settlement value. Current financial liabilities include the shortterm portion of borrowings, including payables for cash advances and other financial liabilities. Financial liabilities are measured at amortized cost by recording charges in the income statement using the effective interest rate method, with the exception of financial liabilities purchased for trading purposes or derivatives, or those designated as FVTPL by management at the date of initial recognition, which instead are measured at fair value through profit or loss (see para. Financial derivatives).
65 Comer Industries
2.3.21 DE-RECOGNITION OF FINANCIAL ASSETS AND LIABILITIES
FINANCIAL ASSETS
A financial asset is derecognized when:
• the rights to receive cash flows from the asset are extinguished;
• the Group retains the right to receive cash flows from the asset, but has assumed the contractual obligation to pay them in full and without delay to a third party;

• the Group has transferred the right to receive cash flows from the asset and has transferred substantially all risks and rewards of ownership of the financial asset or has neither transferred nor retained all risks and rewards of ownership of the asset, but has transferred control of the asset.
In cases where the Group has transferred the rights to receive cash flows from an asset and has neither transferred nor retained all the risks and benefits or has not lost control over it, the asset is recognized in the balance sheet to the extent of its residual involvement in the asset. The residual involvement that takes the form of a guarantee on
the transferred asset is valued at the lower of the initial book value of the asset and the maximum amount that the Group could be required to pay. In cases where the residual involvement takes the form of an option issued and/or purchased on the transferred asset (including options settled in cash or similar), the extent of the Group's involvement corresponds to the amount of the transferred asset that the Group may repurchase; however, in the case of a put option issued on an asset measured at fair value (including options settled in cash or similar), the extent of the Group's residual involvement is limited to the lower of the fair value of the transferred asset and the option exercise price.
Financial liabilities
A financial liability is derecognized when the obligation underlying the liability is extinguished, canceled or discharged.
In cases where an existing financial liability is replaced by another from the same lender, under substantially different conditions, or the conditions of an existing liability are substantially changed, this exchange or change is treated as a de-recognition of the original liability and the recognition of a new liability, with any differences between the carrying
66 2022 Annual Report
amounts recognized in the income statement. In the case of changes to financial liabilities defined as non-substantial, the financial liability is not derecognized and the value of the debt is recalculated keeping the original effective interest rate unchanged, discounting the modified cash flows, thus generating a positive or negative effect on the income statement.
2.3.22 REVENUE

(i) Sales revenues
Revenues are recognized to the extent in which it is probable that the economic benefits will be achieved by the Group and the related amount can be reliably determined, regardless of the date of payment. Revenues are measured at the fair value of the amount received or to be received, taking into account the contractually defined payment terms and excluding taxes and duties. Revenue from the sale of goods is recognized when the Company has transferred control of the goods to the purchaser. Revenue is measured at the fair value of the consideration received or to be received, net of returns and rebates, commercial discounts and volume reductions.
2.3.23 COSTS
Costs are recognized when they relate to goods and services purchased and/or received during the period or by systematic allocation of an expense from which future benefits are spread over time.
2.3.24 FINANCIAL INCOME AND CHARGES
The financial income and charges are reported on an accrual basis based on the interest accrued to the net value of the related financial assets and liabilities by applying the effective interest rate. The financial income and charges include gains and losses on exchange and gains and losses on derivative instruments that must be recognized in the income statement if they fail to meet the requirements to be considered hedging (see para.2.3.13 and following).
67 Comer Industries
2.3.25 SHARE-BASED PAYMENTSTRANSACTIONS WITH PAYMENT SETTLED WITH CAPITAL INSTRUMENTS
The incentive plan based on the Parent Company's ordinary shares (Stock Grant Plan), reserved for CEO of Comer Industries S.p.A., was terminated. The cost of transactions settled with capital instruments is determined by the fair value on the date on which the assignment is made, using an appropriate valuation method. Such cost, corresponding to the increase in shareholders' equity, is recorded under personnel costs over the period in which the conditions relating to the achievement of objectives and/or the provision of the service are met. The cumulative costs recognized for these transactions at the end of each financial year up to the vesting date are commensurate with the expiry of the vesting period and the best estimate of the number of equity instruments that will actually accrue.
Service or performance conditions are not taken into account when the fair value of the plan at the grant date is defined. However, the likelihood that these conditions are met in defining the best estimate of the number of equity instruments that will be accrued is considered. Market conditions are reflected in the fair value at the grant date. Any other condition linked to the plan, which does not involve a service obligation, is not considered as a maturity condition. Non-accruing conditions are reflected in the fair value of the plan and imply the immediate recognition of the cost of the plan, unless there are also service or performance conditions.
No cost is recognized for rights that do not accrue because the performance and/or service conditions are not met. When the rights include a market condition or a non-vesting condition, they are treated as if they had accrued regardless of whether or not the market conditions or other nonvesting conditions to which they are subject are met, it being understood that all other performance and/or service conditions must be met.
If the conditions of the plan are modified, the minimum cost to be recognized is the fair value at the grant date in the absence of the modification, assuming that the original conditions of the plan are satisfied. In addition, a cost is recognized for each change that results in an increase in the total fair value of the payment plan, or is otherwise favorable to employees; this cost is measured with reference to the date of the change. When a plan is derecognized by the entity or the counterparty, any remaining element of the plan's fair value is immediately expensed to the income statement.
2.3.26 USE OF ESTIMATES
The preparation of the consolidated financial statements requires that the Directors apply accounting standards and methods that, in certain circumstances, are based on difficult and subjective valuations and estimates based on past experience and assumptions which are from time to time considered reasonable and realistic depending on the relative circumstances. The application of these estimates and assumptions affect the amounts reported in the financial statements, as well as the information provided. The final values of the accounting items for which these estimates and assumptions were used may differ from those reported in the financial statements due to uncertainties regarding the assumptions and the conditions on which the estimates are based. Estimates and assumptions are reviewed periodically and the effects of each variation recognized in the period in which the estimate is revised if the revision affects only the current period, or even in subsequent periods if the revision affects the current period and those in the future. The financial statement items which, more than others, require a greater degree of discretion by the Directors when making estimates and for which a change underlying the assumptions used could have a significant impact on the financial statements are: deferred taxes, allowance for doubtful accounts, provisions for product warranty risks, other provisions for legal risks, and the inventory write-down provision for semi-finished and finished products.
68 2022 Annual Report
ALLOWANCE FOR DOUBTFUL ACCOUNTS.
The provision reflects the risks calculated on specific positions both in relation to insolvency proceedings in progress and cases for which legal action has been taken, or simply receivables outstanding for more than 360 days, as well as the estimate of expected losses on receivables, also in the absence of events that already indicate clear risks of loss, as provided for by international accounting standard IFRS 9.
PROVISION FOR PRODUCT WARRANTY RISKS.
The provision includes amounts for both specific risks, estimated on the basis of specific technical analyses, and generic risks. The latter are calculated on the production values of single plants, using the average warranty costs as a percentage of turnover in the last 5 years applied to the turnover of the period. The warranties granted are in line with legal provisions.
PROVISION FOR LEGAL RISKS.
These refer to specific cases assigned to legal attorneys with relation to ongoing litigation.
INVENTORY WRITE-DOWN PROVISION.
A generic amount has been set aside, calculated by applying a specific percentage write-down for bands of rotation indices in a systematic fashion, and a specific amount (especially for foreign subsidiaries) relating to the real possibility of disposal of the products.
2.3.27 PUBLIC GRANTS
Public grants are recognized when there is reasonable certainty that they will be received and that all the conditions referring to them have been satisfied. Grants relating to components of cost are recognized as revenues, but are systematically spread over a number of financial periods so as to match the recognition of the costs they are intended to offset. A grant relating to an asset is recognized as a revenue in constant amounts along the expected useful life of the asset in question.
In the event the Group receives a non-monetary grant, the asset and the relative grant are recognized at nominal value and released in the income statement in constant amounts along the expected useful life of the asset in question.
Italian Law 124 of 2017 provides for compulsory disclosure of subsidies, grants, appointments or economic advantages received from the Public Administration or, in any case, involving public resources.
From a systematic reading of the regulation, the facilitating measures aimed at all companies have not been included (by way of example but not limited to tax facilitating measures such as hyper-amortization, super-amortization, tax credit for research and development and facilitating measures such as the Wages Guarantee Fund) as these advantages are not aimed at a specific company.
During the year, the Group Italian companies only received State Aid that targeted all companies, and therefore for any details reference should be made to the National Register of State Aid.
69 Comer Industries
2.3.28 ACCOUNTING STANDARDS
IFRS ACCOUNTING STANDARDS, AMENDMENTS AND INTERPRETATIONS APPLIED FROM JANUARY 1, 2022
The following IFRS accounting standards, amendments and interpretations have been applied for the first time by the Group starting from January 1, 2022:
On May 14, 2020, the IASB published the following amendments:
o Amendments to IFRS 3 Business Combinations: the amendments are intended to update the reference in IFRS 3 to the Conceptual Framework in the revised version, without resulting in any changes to the provisions of the standard.
o Amendments to IAS 16 Property, Plant and Equipment: the purpose of the amendments is not to allow the deduction from the cost of property, plant and equipment of the amount received from the sale of goods produced during the testing phase of the asset itself. These sales revenues and related costs will therefore be recognized in the income statement.
o Amendments to IAS 37 Provisions, Contingent Liabilities and Contingent Assets: the amendment clarifies that all ‘costs that relate directly to the contract’ must be considered when estimating whether a contract is onerous. Accordingly, the assessment of whether a contract is onerous includes not only incremental costs (such as the cost of direct material used in the work), but also all costs that the company cannot avoid because it has entered into the contract (such as the portion of the depreciation of machinery used to fulfill the contract).
o Annual Improvements 2018-2020: amendments were made to IFRS 1 First-time Adoption of International Financial Reporting Standards, IFRS 9 Financial Instruments, IAS 41 Agriculture, and Illustrative Examples of IFRS 16 Leases.
The adoption of these amendments has not had any effect on the Group’s consolidated financial statements.
IFRS ACCOUNTING STANDARDS, AMENDMENTS AND INTERPRETATIONS ENDORSED BY THE EUROPEAN UNION, NOT YET MANDATORY AND NOT EARLY ADOPTED BY THE GROUP AS OF DECEMBER 31, 2022
On May 18, 2017, the IASB published IFRS 17 –Insurance Contracts, which is intended to replace IFRS 4 - Insurance Contracts.
The objective of the new standard is to ensure that an entity provides relevant information that faithfully represents the rights and obligations arising from insurance contracts issued. The IASB has developed the standard to eliminate inconsistencies and weaknesses in existing accounting policies by providing a single principlebased framework for all types of insurance contracts, including reinsurance contracts that an insurer holds.
The new standard also includes presentation and disclosure requirements to improve comparability between entities in this segment.
The new standard measures an insurance contract on the basis of a General Model or a simplified version of it, called the Premium Allocation Approach ("PAA").
The main characteristics of the General Model are:
o the estimates and assumptions of future cash flows are always current;
o the measurement reflects the time value of money;
o the estimates make extensive use of information observable on the market;
o there is a current and explicit measurement of risk;
o the expected profit is deferred and aggregated into groups of insurance contracts at the time of initial recognition; and,
o the expected profit is recognized in the contractual hedging period taking into account the adjustments resulting from changes in the cash flow assumptions relating to each group of contracts.
The PAA method involves measuring the liability for the residual coverage of a group of insurance contracts provided that, at the time of initial recognition, the entity expects the liability to
70 2022 Annual Report
reasonably represent an approximation of the General Model. Contracts with a coverage period of one year or less are automatically eligible for the PAA method. The simplifications arising from the application of the PAA method do not apply to the measurement of liabilities for outstanding claims, which are measured using the General Model However, it is not necessary to discount those cash flows if it is expected that the balance to be paid or collected will occur within one year of the date on which the claim occurred.
An entity shall apply the new standard to insurance contracts issued, including reinsurance contracts issued, reinsurance contracts held and also investment contracts with a discretionary participation feature (DPF).
The standard applies from January 1, 2023 but early application is permitted only for entities that apply IFRS 9 - Financial Instruments and IFRS 15 - Revenue from Contracts with Customers
The Directors do not expect a significant effect in the Group’s consolidated financial statements from the adoption of this standard.
On December 9, 2021, the IASB published an amendment called "Amendments to IFRS 17 Insurance contracts: Initial Application of IFRS 17 and IFRS 9 – Comparative Information". The amendment is a transition option relating to comparative information on financial assets presented at the date of initial application of IFRS 17. The amendment aims to avoid temporary accounting misalignments between financial assets and insurance contract liabilities, and therefore to improve the usefulness of comparative information for readers of financial statements. The modifications will be applied from January 1, 2023 along with the application of IFRS 17. The Directors do not expect a significant effect in the consolidated financial statements of the Group from the adoption of this amendment.
On February 12, 2021, the IASB published two amendments called "Disclosure of Accounting Policies—Amendments to IAS 1 and IFRS Practice Statement 2" and "Definition of Accounting Estimates—Amendments to IAS 8". The amendments are intended to improve disclosure
about accounting policies so as to provide more useful information to investors and other primary users of financial statements as well as to help companies distinguish changes in accounting estimates from changes in accounting policy. The modification will be applied from January 1, 2023, however, early application is permitted. The Directors do not expect a significant effect in the consolidated financial statements of the Group from the adoption of these amendments.
On May 7, 2021, the IASB published an amendment called "Amendments to IAS 12 Income Taxes: Deferred Tax related to Assets and Liabilities arising from a Single Transaction". The document clarifies how deferred taxes should be accounted for on certain transactions that can generate assets and liabilities of equal amounts, such as leases and decommissioning obligations. The modification will be applied from January 1, 2023, however, early application is permitted.
The Directors do not expect a significant effect in the consolidated financial statements of the Group from the adoption of this amendment.
ACCOUNTING STANDARDS, AMENDMENTS AND IFRS INTERPRETATIONS NOT YET APPROVED BY THE EUROPEAN UNION
At the reference date of this document, the competent bodies of the European Union have not yet completed the approval process necessary for the adoption of the amendments and principles described below.
On January 23, 2020, the IASB published an amendment called "Amendments to IAS 1 Presentation of Financial Statements: Classification of Liabilities as Current or Non-current" and on October 31, 2022 published an amendment entitled "Amendments to IAS 1 Presentation of Financial Statements: Non-Current Liabilities with Covenants." The purpose of the documents is to clarify how to classify debt and other short-term or long-term liabilities. The modification applies from January 1, 2024, however early application is permitted. The Directors do not expect a significant effect in the consolidated financial statements of the Group
71 Comer Industries
from the adoption of this amendment.
On September 22, 2022, the IASB published an amendment called "Amendments to IFRS 16 Leases: Lease Liability in a Sale and Leaseback." The document requires the seller-lessee to measure the lease liability arising from a sale-
and-leaseback transaction so as not to recognize income or loss that relates to the retained right of use. The modification will be applied from January 1, 2024, however, early application is permitted. The Directors do not expect a significant effect in the consolidated financial statements of the Group from the adoption of this amendment.
72 2022 Annual Report
73 Comer Industries
FINANCIAL AND NON-FINANCIAL RISK MANAGEMENT
The Group's business is exposed to various financial risks: market risk (including the exchange rate risk and interest rate risk), credit risk, liquidity risk, price and cash flow risk and other non-financial risks such as the risk related to climate change and cybersecurity. The risk management program aims to minimize any negative impacts on the Group's financial performance and is planned by a central function of the Parent Company that coordinates all operating companies, reporting directly to the Chief Executive Officer. Comer Industries uses derivative financial instruments to hedge exposure to currency risk. The Group does not use financial derivatives for speculative purposes.
(a) Market risk (i) Exchange rate risk
The Group operates internationally and is exposed to exchange rate risk due to exposure mainly to the US dollar and the Chinese yuan, and secondarily to the Brazilian real and the British pound. The exchange rate risks are generated by forecasts of future commercial transactions and recognized assets or liabilities.
In order to manage the exchange rate risk generated by forecasts of future commercial transactions and recognized assets or liabilities denominated in a currency other than the functional currency of the Group (euro), the Group companies use repurchase agreements (forward), under the coordination of the central Treasury. The Group's policy is to hedge a portion of future currency transactions that are expected to occur in the next 12 months. Where necessary, derivative contracts previously stipulated are renewed at maturity in relation to the evolution of the business. The Group is exposed to the conversion risk of net assets of subsidiaries in North America, Great Britain, China, India and Brazil. Considering the strategic importance of the subsidiaries for which
the implementation of this activity is foreseen in the short term, the Group did not consider the signing of hedging contracts necessary for this purpose.
(ii) Interest rate risk
The interest rate risk is derived from medium-long term loans at variable rates. The Group's current policy is to use floating rate loans, monitoring the curve of interest rates.
(b) Credit risk
The Group's policy is to sell to customers after an evaluation of their credit capacity and therefore within pre-set credit limits. Historically, the Group has not suffered significant losses on receivables.
(c) Liquidity risk
Prudent management of liquidity risk implies maintaining sufficient available cash and cash equivalents and sufficient credit lines from which to draw. Due to the dynamic nature of the business, the Group's policy is to have revolving standby credit facilities that can be utilized at short notice.
(d) Price and cash flow risk
The Group is subject to the risk of fluctuations in metal prices, in particular aluminum, copper and steel. The Group's policy is to cover the risk where possible, through commitments from suppliers in the medium term, with stockpiling policies when prices are at their lowest and agreements with customers. Furthermore, the Group has no significant interest-generating activities towards third parties and the revenues and the related cash inflows are, therefore, independent of changes in interest rates.
For the operational management of the above risks, please refer to paragraph 2.6.16.
(e) Climate change risk
With the goal of contributing to the fight against
2.4
74 2022 Annual Report
climate change and in keeping with Europeanlevel guidelines on reporting, Comer Industries has embarked on a path of gradual approximation and implementation of the Recommendations of the TCFD - Task Force on Climate-related Financial Disclosures, aimed at developing a harmonized climate change risk mitigation plan in the Integrated Management System.
Compared with the qualitative assessment developed in the previous fiscal year, in 2022 the spectrum of analysis was further broadened and evolved, incorporating instances from the new operating locations in light of the acquisition of Walterscheid Powertrain Group, and evolving in the direction of a scenario study and a mediumto long-term quantitative analysis.
The application of the methodology also led to an assessment of strategy resilience based on a representation of risks and opportunities. The design of the climate change risk analysis followed the guidelines of the Carbon Disclosure Project (according to the CDP Technical Note on the TCFDDisclosing in line with the TCFD's recommendations) and was developed in line with internal procedures and integrated into the Company's existing risk assessment model.
Over the next few years, following the gradual refinement of the methodology and the completion of the mapping of the new consolidated scope, the framework of risks and opportunities will be linked to an assessment of financial impacts based on the models proposed by the relevant guidelines.
(f) Information technology risk
The Group considers the operational continuity of its IT systems to be of great importance and has implemented risk mitigation measures in this regard aimed at ensuring network connectivity, data availability, and data security, while at the same time guaranteeing the processing of personal data in compliance with the European GDPR regulation and the national regulations applicable in individual EU member states. To this end, it has implemented and continues to optimize an Information Security Management System (ISMS).
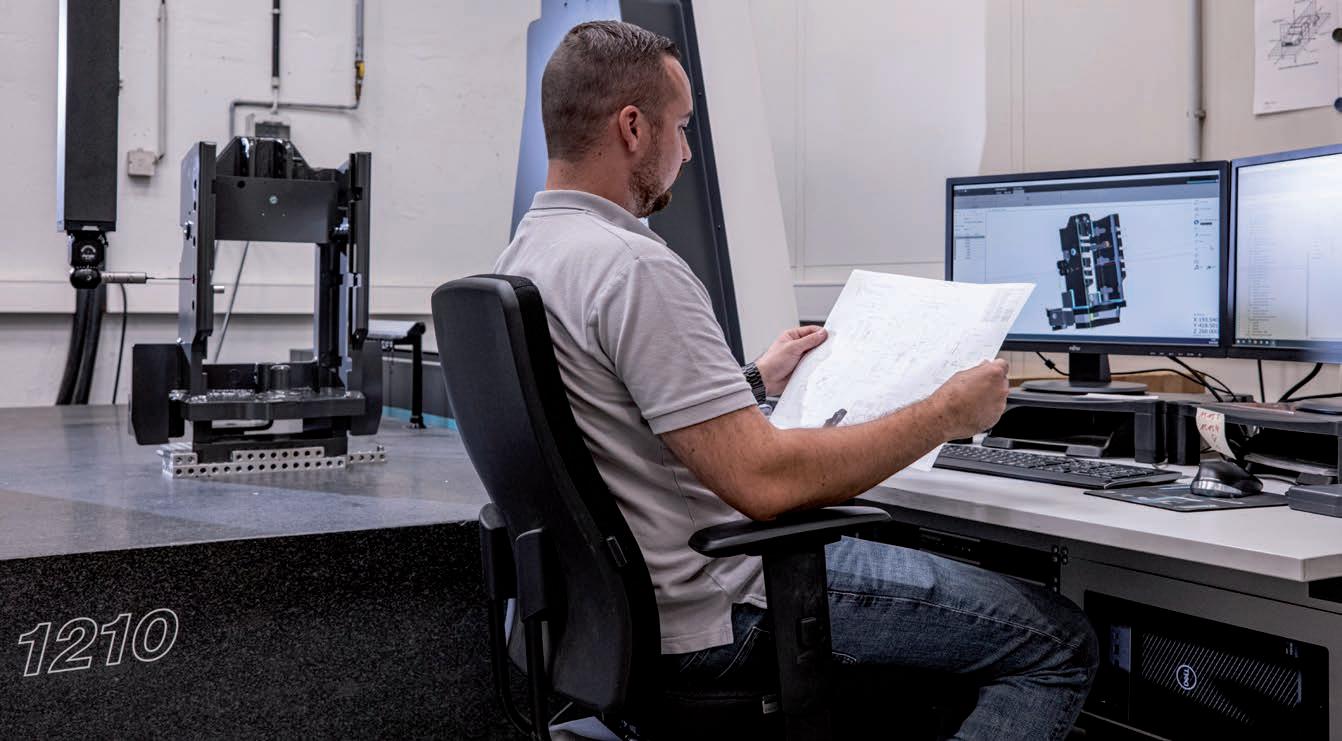
75 Comer Industries
CORPORATE INFORMATION AND INDUSTRY-RELATED INFORMATION
2.5.1 RESTATEMENT OF THE PURCHASE PRICE ALLOCATION RESULTING FROM THE ACQUISITION OF WPG
On December 1, 2021, Comer Industries S.p.A. acquired 100% of WPG Holdco B.V., parent company of Walterscheid Powertrain Group, a leader in the Off-Highway sector (components and drive systems for the agricultural, industrial, construction, and mining equipment sectors), as reported in the section "Significant events in the 2021 financial year" in the consolidated financial statements as of December 31, 2021.
With regard to the acquisition made, note that the Group made use of the option provided by IFRS 3, which allows the final allocation of the acquisition price to the assets, liabilities, and intangible assets not recognized in WPG's financial statements, within the limits of their fair value, within 12 months from the date of acquisition. Therefore, as of December 31, 2021 this allocation was defined as provisional, and based on it there was a "provisional" goodwill of 154,967 thousand euros, increasing the value already present in the financial statements of the acquired group by 108,786 thousand euros, thus bringing the amount of this item to a net value of 263,753 thousand euros.
The allocation process was finally concluded as of June 30, 2022, and all items impacted by this process are summarized below:
• Assets subject to final allocation as early as December 31, 2021:
o The value of inventory, the fair value of which was higher than the book value by 3,004 thousand euros, generating deferred tax liabilities of 822 thousand euros.
• Assets with provisional allocation as of December 31, 2021 and subject to final allocation in the current fiscal year 2022:
o The provision for inventory write-down, the value of which was understated by 4,192 thousand euros, generating deferred tax assets of 1,146 thousand euros (following the final allocation, the amount was increased by other 3,000 thousand euros and the deferred tax assets by 821 thousand euros compared to the provisional allocation as of December 31, 2021).
• Assets not valued for the purpose of provisional allocation as of December 31, 2021 and subject to final allocation in the current fiscal year 2022:
o The list of customers, the fair value of which is equal to 110,839 thousand euros, generating deferred tax liabilities of 30,314 thousand euros.
o The technologies, the fair value of which is equal to 65,589 thousand euros, generating deferred tax liabilities of 17,938 thousand euros.
o The trademarks, the fair value of which is 33,999 thousand euros, generating deferred tax liabilities of 9,299 thousand euros.
As a result of the above, compared to the provisional allocation to goodwill of 263,753 thousand euros as of December 31, 2021, a final allocation to goodwill in the amount of 155,689 thousand euros was determined.
2.5
76 2022 Annual Report
As required by IFRS 3, the comparative balance sheet figures as of December 31, 2021 were restated to retrospectively reflect the effects resulting from the final Purchase Price Allocation ("PPA") process. Below are the changes:
CONSOLIDATED BALANCE SHEET (THOUSAND EUROS)
ASSETS DECEMBER 31, 2021 PUBLISHED FINAL FAIR VALUE MEASUREMENT RESTATEMENT DECEMBER 31, 2021 Non-current assets Tangible fixed assets 204,735 204,735 Intangible fixed assets 328,058 44,012 372,070 of which goodwill 263,968 (108,279) 155,689 Investments 1,279 1,279 Tax assets and deferred tax assets 41,311 821 42,132 Other long-term receivables 829 829 Total 576,212 44,833 621,045 Current assets Inventories 228,628 (3,000) 225,628 Trade receivables 196,130 196,130 Other short-term receivables 8,896 8,896 Current tax assets 17,264 17,264 Other short-term financial receivables 202 202 Short-term derivative financial instruments 601 601 Cash and cash equivalents 85,744 85,744 Total 537,464 (3,000) 534,464 TOTAL ASSETS 1,113,676 41,833 1,155,509 77 Comer Industries
CONSOLIDATED BALANCE SHEET (THOUSAND EUROS)
EQUITY AND LIABILITIES DECEMBER 31, 2021 PUBLISHED FINAL FAIR VALUE MEASUREMENT RESTATEMENT DECEMBER 31, 2021 Share capital and reserves Issued capital 18,487 18,487 Share premium reserve 187,881 187,881 Other reserves 32,071 32,071 Accumulated profit (loss) 107,173 107,173 - Retained earnings 67,744 67,744 - Net profit 39,429 39,429 Total 345,612 0 345,612 Portion pertaining to minority interests -Total equity 345,612 0 345,612 Non-current liabilities Long-term loans 177,743 177,743 Other long-term financial payables 47,592 47,592 Tax liabilities and deferred tax liabilities 20,692 41,833 62,524 Post-employment benefits 157,800 157,800 Other long-term payables 9,768 9,768 Long-term provisions 9,845 9,845 Total 423,440 41,833 465,273 Current liabilities Trade payables 218,611 218,611 Other short-term payables 40,375 40,375 Tax liabilities 21,816 21,816 Short-term loans 29,203 29,203 Short-term derivative financial instruments 114 114 Post-employment benefits short-term 7,379 7,379 Other short-term financial payables 8,739 8,739 Short-term provisions 18,387 18,387 Total 344,624 0 344,624 TOTAL LIABILITIES 1,113,676 41,833 1,155,509 78 2022 Annual Report
The valuation techniques used to determine the fair value of the major assets acquired are shown below.
Assets acquired
Customer list
Trademarks and Technologies
Valuation technique
Multi-period Excess Earnings Method, which considers the present value of the net cash flows expected to be derived from the acquired group's customers
Relief from Royalty Method, on the basis of which flows are linked to the recognition of a royalty percentage applied to the amount of revenue the trademark is able to generate. A defined useful life was considered as the basis for the valuation.
Deferred tax liabilities were calculated on the assets identified in the Purchase Price Allocation, considering a tax rate of 27.35%.
The final Purchase Price Allocation was prepared by Comer Industries S.p.A. with the support of a major consulting firm.
Note that the restatement from data as of December 31, 2021 due to the final allocation only involved the restatement of balance sheet balances, while no adjustments were accounted for on the opening equity as of January 1, 2022 given the insignificance of the amounts with respect to the numerical amounts in the consolidated financial statements of the Comer Industries Group.
79 Comer Industries
2.5.2 SECTORAL INFORMATION
Industry-related information is given with reference to sectors of activity. The information includes both costs directly attributable and costs allocated according to reasonable assumptions. General and administrative costs, ICT and HR services, fees for directors, Statutory Auditors and Group management departments, as well as costs relating to the global sourcing area (organized according to purchasing group of product category) have been allocated to sectors proportionally to the turnover. The Group operates in the following sectors: Agricultural sector. Products mainly consists of speed increasers, speed reducers, bevel gearboxes, PTO driveshafts, wheel drives and axles for agricultural use, especially manufacturers of combine harvesters and tractors, haymaking, harvesting, irrigation and mixing, and land preparation and working machines. Industrial sector. This includes products such as modular planetary drives, travel and hoist drives, slew drives and rigid and steering axles for construction and forestry machinery manufacturers, from the shipbuilding to the airport building and mining industries. Components for municipalities, for the extraction industry and material handling sectors. Products for the wind power and renewable energy sector as well as for driving the augers of biogas machines.
The Agricultural sector, which now accounts for 63% of total revenues (51% in 2021), experienced a 152 percent increase in revenues during the year, with an increase in operating profitability due to both Comer and the consolidation of the German group acquired in December 2021. The performance of the industrial division was also positive, improving its operating profitability (EBITDA) as a result of the growth in business volume (+59%).
AGRICULTURAL SECTOR INDUSTRIAL SECTOR TOTAL Sectoral indicators (thousand euros) December 31, 2022 December 31, 2021 Dev. % December 31, 2022 December 31, 2021 Dev. % December 31, 2022 December 31, 2021 Revenue from contracts with customers 776,262 307,708 152% 461,314 290,402 59% 1,237,576 598,110 EBITDA (*) 109,219 38,875 70,789 38,720 180,008 77,595 EBITDA on revenues (%) 14.1% 12.6% 15.3% 13.3% 14.5% 13.0% Amortization (32,621) (12,221) (19,869) (8,543) (52,491) (20,764) EBIT 76,598 27,265 181% 50,919 29,565 72% 127,517 56,831 EBIT on revenues (%) 9.9% 8.9% 11.0% 10.2% 10.3% 9.5% Net financial income / (expenses) (1,623) (1,027) (964) (969) (2,587) (1,996) Income taxes (20,535) (7,374) (13,679) (8,032) (34,213) (15,406) NET PROFIT 54,440 18,865 189% 36,276 20,564 76% 90,716 39,429 Net profit on revenues (%) 7.0% 6.1% 7.9% 7.1% 7.3% 6.6% (*) The figure as of 12/31/2021 was adjusted for the item Provisions for risks and bad debts to make it consistent with 12/31/2022.
80 2022 Annual Report
2.6 NOTES TO THE CONSOLIDATED FINANCIAL STATEMENTS
2.6.1 TANGIBLE FIXED ASSETS
Changes in technical fixed assets and related accumulated depreciation during FY 2022 are illustrated in the following tables:
The rights of use heading, relating to the application of the IFRS 16 international accounting standard, mainly refers to the renting of the Group’s operating plants and can be broken down as follows:
DESCRIPTION (THOUSAND EUROS) LAND AND BUILDINGS PLANT AND MACHINERY INDUSTRIAL AND COMMERCIAL EQUIPMENT OTHER ASSETS TANGIBLE FIXED ASSETS IN PROGRESS RIGHTS OF USE TOTAL January 01, 2021 9,251 28,594 10,711 3,089 2,252 22,583 76,481 Balances from acquisition 34,021 54,581 2,946 30,132 121,680 Increases 568 7,361 5,561 2,327 2,219 6,175 24,211 Decreases (296) (251) (16) (260) (482) (1,304) Amortization (829) (6,664) (5,419) (910) (4,549) (18,372) Reclassifications 184 2,102 (196) (253) (1,836) (0) Translation reserve 343 1,396 18 180 103 2,040 December 31, 2021 43,241 87,118 10,659 7,119 2,636 53,963 204,736 Increases 569 16,974 6,062 3,999 4,829 10,592 43,025 Decreases (10) (881) (33) (98) (1,437) (170) (2,629) Amortization (2,486) (15,772) (5,176) (1,178) (9,937) (34,549) Reclassifications 1,378 229 (1,093) (514) 0 Translation reserve 178 367 129 99 (184) 342 931 December 31, 2022 41,492 89,184 11,870 8,848 5,330 54,790 211,514
81 Comer Industries
DESCRIPTION (THOUSAND EUROS) LAND AND BUILDINGS OTHER ASSETS TOTAL January 01, 2021 21,371 1,212 22,583 Acquisition balances 27,302 2,832 30,134 Increases 5,892 726 6,618 Decreases (934) (75) (1,009) Amortization (3,774) (691) (4,465) Translation reserve 101 2 103 December 31, 2021 49,959 4,005 53,963 Increases 9,123 1,469 10,592 Decreases (137) (33) (170) Amortization (8,022) (1,915) (9,937) Translation reserve 304 38 342 December 31, 2022 51,227 3,565 54,790 82 2022 Annual Report
2.6.2 INTANGIBLE FIXED ASSETS
Changes in intangible fixed assets are shown below:
The item breaks down as follows:
(i) Goodwill
Goodwill arises from business combinations in accordance with IFRS 3 and represents the excess of the cost of the acquisition over the Group's stake in the fair value of the acquirer's identifiable assets, liabilities and contingent liabilities existing at the time of the acquisition. For further details see paragraph 2.5.1 and following of this document.
(ii) Development and approval costs and intangible fixed assets in progress
These capitalizations are mainly related to internal orders associated with the development of new products. During the period intangible fixed assets in progress have been capitalized development costs of 275 thousand euros; 68 thousand euros however represent the decreases for waived projects. These projects meet the requirements of paragraph 57 of IAS 38, as the Group analyzed the technical feasibility of the same, as well as the intention to complete the project, to introduce new products on the market and the availability of technical and financial resources, as well as a reliable identification of own costs and their ability to produce future economic benefits. These expenses are amortized on the basis of the
DESCRIPTION (THOUSAND EUROS) GOODWILL DEVELOPMENT AND APPROVAL COSTS TRADEMARKS AND KNOWHOW CONCESSIONS, LICENSES AND TRADEMARKS OTHER INTANGIBLE ASSETS INTANGIBLE FIXED ASSETS IN PROGRESS TOTAL January 01, 2021 - 662 44 2,281 3 614 3,605 Balances from acquisition 108,786 1,948 59,337 170,071 Increases 46,903 (*) 23,964 (*) 891 128,327 (*) 709 200,794 Decreases (21) (21) Amortization (362) (13) (1,365) (650) (2,390) Reclassifications 122 421 (543) 0 Translation diff. 0 0 0 13 (1) 0 12 December 31, 2021 155,689 422 23,994 4,189 187,016 758 372,070 Increases 54 2,780 35 275 3,144 Decreases (5) 7 (68) (66) Amortization (232) (1,713) (2,249) (13,747) (17,942) Reclassifications 0 Translation diff. (16) 63 18 65 December 31, 2022 155,673 244 22,281 4,778 173,329 965 357,272
83 Comer Industries
(*) Values restated from December 31, 2021 in accordance with IFRS 3, to retrospectively take into account the effects resulting from the final fair value measurement of WPG's trademarks and customer list, technologies, and brand as of the acquisition date (values previously considered provisional, see Section 2.5 "Acquisition of Walterscheid Powertrain Group").
probable useful life generally estimated to be 3 to 5 years, depending on the sector they are intended for.
(iii) Concessions, licenses and patents
The increases in the period relate to the capitalization of external costs for the realization of projects already described in the report on operations or to software licenses and applications for the logistics and research and development area.
(iv) Other intangible fixed assets
The item includes developed technology, customer relationships, software and other fixed assets with finite useful lives resulting from the acquisition of the German group. These fixed assets are amortized on a straight-line basis over a period defined by the following amortization rates:
- Brand: 20 years
- Technology developed: 13 years
- Relationships with customers: 13 years.
GOODWILL
As of December 31, 2022, this item amounted to 155,673 thousand euros. See Section 2.5.1 of this document for further details.
IMPAIRMENT LOSSES ON INTANGIBLE FIXED ASSETS WITH AN INDEFINITE USEFUL LIFE AND GOODWILL
Goodwill, amounting to 155,673 thousand euros, was not amortized in accordance with IAS 36, but was subject to impairment testing by management. The result of the impairment was approved by the Board of Directors on March 21, 2023, and was carried out using the Discounted Cash Flow (DCF) method after tax, allocating the amount of goodwill to WPG's Agricultural and Industrial sectors. The expected cash flows used in the DCF calculation were determined based on the business plans
(of the Agricultural and Industrial sectors) with a duration of three years. The business plan takes into consideration the various scenarios and development expectations of the various markets, based on the information available at the end of 2022.
These flows were discounted at a discount rate calculated using the Weighted Average Cost of Capital ("WACC"), i.e., by weighting the expected rate of return on invested capital net of the costs of hedging for a sample of companies in the same industry. The average cost of capital (WACC) was calculated as 8.60% and the estimated g rate was conservatively set at a value lower than the expected long-term inflation rate. The performance of the impairment test did not indicate the need to recognize any impairment of goodwill as of December 31, 2022 and the level of coverage is very significant. In confirmation of this, the sensitivity analysis –carried out by increasing the cost of capital used to discount expected cash flows by 100 basis points – did not reveal any need to write down the item, nor a variation of ±10% in expected cash flows.
Note also that the market capitalization of the Company, based on the average Comer Industries share price in 2022, shows a significant positive differential from the Group's book equity.
2.6.3 EQUITY INVESTMENTS IN OTHER COMPANIES
The item mainly refers to the equity valuation in Matsui Walterscheid Ltd., a 40% subsidiary of Walterscheid GmbH.
84 2022 Annual Report
2.6.4 DEFERRED TAX ASSETS
The details are as follows:
(*) Values restated from December 31, 2021 in accordance with IFRS 3, to retrospectively take into account the tax effects resulting from the final accounting of the WPG acquisition transaction (values previously considered provisional, see Section 2.5 "Acquisition of Walterscheid Powertrain Group").
The balance of deferred tax assets decreased by 6,436 thousand euros. For the detailed breakdown of this item please refer to the table below:
(*) Values restated from December 31, 2021 in accordance with IFRS 3, to retrospectively take into account the tax effects resulting from the final accounting of the WPG acquisition transaction (values previously considered provisional, see Section 2.5 "Acquisition of Walterscheid Powertrain Group").
The balance of foreign subsidiary temporary differences is mainly attributable to the pension fund of the acquired German WPG group, and the reduction mainly refers to the reduction in pension funds during the year due to the increase in the discount rate.
The following aspects were taken into account in the calculation of deferred tax assets:
• The tax laws of the countries that the Group operates in and their impact on temporary differences, and any tax benefits from the use of tax loss carryforwards, considering their possible recoverability over a three-year time horizon.
• The Group's profit forecast in the medium and long term.
Based on the above, the Group believes that it can recover the recognized deferred tax assets with reasonable certainty.
DESCRIPTION (THOUSAND EUROS) DECEMBER 31, 2022 DECEMBER 31, 2021 RESTATED Prepaid taxes 35,695 42,132 (*) Deferred tax assets 35,695 42,132
PREPAID TAXES BY COMPANY (THOUSAND EUROS) DECEMBER 31, 2022 DECEMBER 31, 2021 RESTATED (*) 2022 Description Total Prepaid Taxes Total Prepaid Taxes Used (allocated) Inventory write-down provision 5,042 5,846 (805) Provision for product warranty/contract risks 8,344 8,394 (51) Temporary differences – Italian companies 5,291 2,436 2,855 Temporary differences – Foreign subsidiaries 12,722 23,750 (11,027) Total prepaid taxes of the company 31,398 40,427 (9,027) Total prepaid taxes consolidation 4,297 1,706 2,591 Total prepaid taxes in the financial statements 35,695 42,132 (6,436) 85 Comer Industries
2.6.5 OTHER LONG-TERM RECEIVABLES
The item refers to guarantee deposits primarily for real estate in rental agreements and consumption.
2.6.6 INVENTORIES
The changes are as follows:
(*) Values restated from December 31, 2021 in accordance with IFRS 3 to retrospectively take into account the effects resulting from the final valuation of WPG's inventory write-down provision as of the acquisition date (value previously considered provisional, see Section 2.5 "Acquisition of Walterscheid Powertrain Group").
The increase in inventories of 19,278 thousand euros compared to December 31, 2021 is closely related to the increase in sales volumes achieved during the year. In particular, an increase in raw materials is recorded as an effect of the stock procurement campaign as a consequence of the general tension in the supply chain. Inventories are shown net of a provision for obsolescence for a total amount of 25,131 thousand euros, an increase compared to December 31, 2021 by 881 thousand euros net of the use for scrapping.
DESCRIPTION (THOUSAND EUROS) DECEMBER 31, 2022 DECEMBER 31, 2021 Security deposits for foreign rentals 377 177 Other minor receivables including security deposits Italy 287 33 Other long-term receivables 743 619 Other Long-term receivables 1,407 829 DESCRIPTION (THOUSAND EUROS) DECEMBER 31, 2021 RESTATED (*) NET CHANGE/INCREASES TRANSLATION DIFFERENCES DECEMBER 31, 2022 Raw materials and Packaging 80,736 10,219 (203) 90,752 Provision for write-down of raw and ancil. mats. and consumables (6,231) (2,362) 15 (8,578) Raw and ancillary materials and packaging 74,505 7,857 (188) 82,175 Semi-finished products purchased and produced 96,719 6,020 (65) 102,674 Provision for write-down of semi-finished products purchased and produced (5,568) (105) 0 (5,673) Work in progress 91,151 5,915 (65) 97,001 Finished products and Goods 72,422 2,949 1,239 76,610 Provision for write-down of finished products (12,451) 1,647 (76) (10,880) Finished products 59,971 4,596 1,163 65,730 Inventories 225,628 18,368 910 244,906
86 2022 Annual Report
2.6.7 TRADE RECEIVABLES AND OTHER SHORT-TERM RECEIVABLES
The changes are as follows:
The balance of trade receivables is influenced by the trend in turnover, especially in relation to the last few months of the year. Average collection days calculated on aggregate revenues for the last quarter stood at 62 days, an improvement versus the previous year (66 days).
The allowance for doubtful accounts mainly reflects the generic write-down calculated in accordance with IFRS 9, influenced this year by indicators representing greater macroeconomic risk. During the year, the Group did not record any significant losses on receivables or release provisions set aside in previous years.
Note that there are no trade receivables due after the year.
The Group is not particularly exposed to the nations currently involved in the conflict, Russia, Belarus and Ukraine. Note that consolidated revenue from customers residing in these countries corresponds to around 1%, and there are no significant accounts receivable positions as payments are normally made in advance. Note that the Moscow-based commercial branch has been inactive since April 2022.
As of December 31, 2022, the presentation of trade receivables (net of the related allowance for doubtful accounts) by maturity bracket is shown in the following table.
DESCRIPTION (THOUSAND EUROS) DECEMBER 31, 2021 NET CHANGE TRANSLATION DIFFERENCES DECEMBER 31, 2022 Short-term receivables from customers 201,726 11,988 288 214,003 Provision for bad debts (5,597) (436) (9) (6,042) Trade receivables 196,130 11,552 280 207,961 Advances to suppliers 2,454 (2,549) 9 (86) Receivables from Social Security Institutions 35 29 64 Accrued income and prepaid expenses 454 331 (0) 785 Trade receivables from suppliers 26 9 (1) 34 Other short-term receivables 5,927 1,526 (0) 7,453 Other short-term receivables 8,896 (654) 8 8,250
DESCRIPTION (THOUSAND EUROS) DECEMBER 31, 2022 DECEMBER 31, 2021 Not overdue 202,489 190,187 30-60 days past due 5,673 3,107 60-90 days past due 228 2,876 More than 90 days past due 5,613 5,557 Allowance for doubtful accounts (6,042) (5,597) Trade receivables 207,961 196,130 87 Comer Industries
2.6.8 CURRENT TAX ASSETS
The changes are as follows:
The current VAT credit of 20,645 thousand euros is attributable to the parent company Comer Industries S.p.A. for 8,007 thousand euros (it was 3,801 thousand euros on December 31, 2021) and to the subsidiary Comer Industries Components S.r.l. for 7,795 thousand euros (it was 6,024 thousand euros on December 31, 2021). The remaining part relates to foreign companies and in particular to the GST credit held by the Indian subsidiary for 3,175 thousand euros. During the year, the VAT credit of Comer Industries Component S.r.l. for the year 2021 in the amount of 5,000 thousand euros was partially recovered.
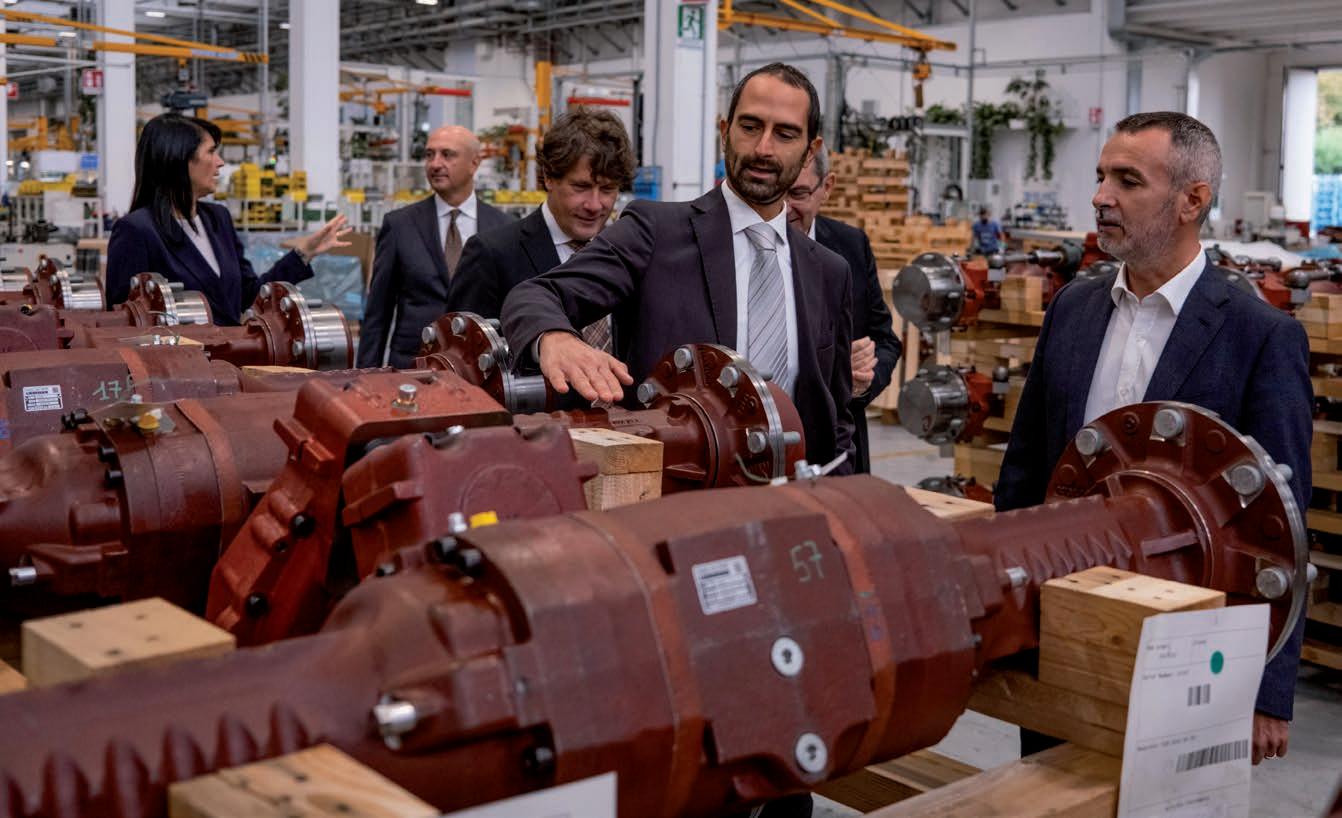
The item Other tax receivables for 8,682 thousand euros mainly represents the excess of advances
paid with respect to current taxes calculated on the profit generated during the year by some companies of the German group. The balance includes a tax credit related to the parent company Comer Industries S.p.A. for investments in new capital goods of 256 thousand euros mostly related to Industry 4.0, and 560 thousand euros related to the estimated energy and gas tax credit for Q4 2022.
In relation to the above mentioned subsidiaries, it should be noted that the tax system provides for the payment of advance payments for income taxes already withheld on commercial transactions, thus unavoidably generating tax credits during the financial period.
DESCRIPTION (THOUSAND EUROS) DECEMBER 31, 2021 NET CHANGE 2022 Italian and foreign VAT 12,831 7,814 20,645 Other tax receivables 4,433 4,250 8,682 Current tax assets 17,264 12,064 29,327 88 2022 Annual Report
2.6.9 FINANCIAL ASSETS AND LIABILITIES, GUARANTEES
The net financial position as of December 31, 2022 was negative and amounted to 148,946 thousand euros.
The value of prepayments deriving from accounting for up-front expenses according to amortized cost amounts to 1,994 thousand euros. The value of other financial liabilities attributable to the accounting treatment of leasing contracts according to IFRS 16 at December 31, 2022 amounts to 57,791 thousand euros, an increase compared to December 31, 2021 (56,331 thousand euros).
Cash and cash equivalents improve by 65,584 thousand euros, moving from 85,744 thousand euros at December 31, 2021 to 151,328 thousand euros at December 31, 2022. The increase is mainly due to the loan agreement signed with Crédit Agricole Italia in December 2022 for a total amount of 50,000 thousand euros, maturing on December 16, 2027. This financing will provide the funding for the acquisition of e-comer, which will be finalized in January 2023.
The breakdown and movements compared to the previous year are shown below:
DESCRIPTION (THOUSAND EUROS) DECEMBER 31, 2021 INCREASES DECREASES DECEMBER 31, 2022 Cash and cash equivalents (85,744) (65,584) 0 (151,328) Short-term loans 29,966 47,013 (24,706) 52,272 Medium/long-term loans 179,602 40,000 (27,631) 191,971 Total net current financial debt to banks 123,824 21,428 (52,338) 92,915 Assets for short MTM derivative financial instruments (601) - 601 0 Liabilities for short-term derivative financial instruments MTM 114 - 120 234 Total Debt including financial instruments 123,337 21,428 (51,617) 93,149 Up-front commissions for structured loans (short-term portion) (763) (692) 763 (692) Up-front commissions for structured loans (M/LT portion) (1,859) (1,302) 1,859 (1,302) Other short-term financial payables IFRS 16 8,739 1,225 (220) 9,744 Other long-term financial payables IFRS 16 47,592 9,706 (9,250) 48,048 Total net financial position 177,046 30,365 (58,465) 148,946
89 Comer Industries
The financial treatment of assets and liabilities broken down by the categories identified by IFRS 9, is summarized in the following table:
It should be noted, as required by paragraph 186 of ESMA Communication 32-382-1138 of March 4, 2021, that there are no material elements in terms of indirect indebtedness to be brought to attention in these consolidated financial statements.
DESCRIPTION (THOUSAND EUROS) AT AMORTIZED COST FAIR VALUE TOTAL BOOK VALUE Assets as at December 31, 2022 Trade receivables 207,961 207,961 Other short-term receivables 8,249 8,249 Current tax assets 29,327 29,327 Short-term derivative financial instruments 0 0 Cash and cash equivalents 151,328 151,328 Total assets 216,211 180,656 396,866 Liabilities at December 31, 2022 Long-term loans (190,669) (190,669) Trade payables (198,630) (198,630) Other short-term payables (34,758) (34,758) Current tax liabilities (23,173) (23,173) Short-term derivative financial instruments (234) (234) Short-term loans (51,580) (51,580) Other short-term financial payables (9,744) (9,744) Other long-term financial payables (48,048) (48,048) Post-employment benefits short-term (5,792) (5,792) Total liabilities (533,429) (29,199) (562,627) Total (317,218) 151,457 (165,761) 90 2022 Annual Report
SHORT-TERM DERIVATIVE FINANCIAL INSTRUMENTS
Details follow:
On December 31, 2022 expected cash flows by Chinese subsidiaries totaling USD 12 million were covered with a negative fair value of 234 thousand euros recognized in the CFH reserve. Most of the financial assets and liabilities in force reflect short-term financial assets and liabilities, for which, in consideration of their nature, their book value is considered as a reasonable approximation of fair value.
For more information, reference should be made to para. 2.5.15 regarding the management of exchange risks.
CASH AND CASH EQUIVALENTS
The amount of 151,328 thousand euros compares with 85,744 thousand euros last year. This increase relates, in the amount of 50,000 thousand euros, to the taking out of the medium- to long-term loan with Crédit Agricole Italia for the purpose of the acquisition of e-comer S.r.l. that took place in January 2023 (see section on subsequent events). The difference is also linked to the time flow of collections and payments and should be analyzed by combining the cash and cash equivalents of some companies with the bank payables of others, and partly due to the liquidity acquired through the consolidation of the German group. Liquidity is well distributed in all subsidiaries worldwide to meet the financing of core business and investments. The values stated can be readily converted into cash and are subject to an insignificant risk of
change in value. It is believed that the carrying value of Cash and cash equivalents approximates their fair value at the balance sheet date. More information can be gleaned from the cash flow statement.
SHORT-TERM LOANS AND CURRENT PORTION OF MEDIUM/LONG TERM LOANS
The item includes interest-bearing bank loans.
The value of 51,580 is made up of 52,272 thousand euros of short-term bank loans, shown net of the short-term portion of transaction costs treated according to the amortized cost method (IFRS 9) equal to 691 thousand euros.
The increase of 22,376 thousand euros compared to the previous year is mainly due to the short-term portion of a new loan taken out in H1 2022 from Unicredit for a total amount of 19,000 thousand euros (repaid during the year for 9,500 thousand euros) and to the short-term portion relating to the taking out of a medium-long term loan by Comer Industries S.p.A. from Crédit Agricole Italia to acquire e-comer S.r.l., which took place in January 2023 (see subsequent events) for 50,000 thousand euros.
The current account debt at December 31, 2022 of Comer Industries S.p.A. and Comer Industries Components S.r.l. relates to the balance of cash in transit linked to the payment of bills payable and direct remittances on December 31.
DESCRIPTION (AMOUNTS IN THOUSANDS) NOMINAL VALUE IN CURRENCY DECEMBER 31, 2022 NOTIONAL VALUE IN EUROS DECEMBER 31, 2022 FAIR VALUE DECEMBER 31, 2022 Short-term derivative financial instruments on exchange rates with positive fair value - -Short-term derivative financial instruments on exchange rates with negative fair value USD 12,000 11,251 (234) Net value of financial instruments USD 12,000 11,251 (234) Net value of financial instruments 12,000 11,251 (234) 91 Comer Industries
LONG-TERM LOANS
This item includes the long-term portions of the following loans:
1. Loan agreement entered into with Crédit Agricole in December 2021 and divided as follows:
- 140,000 thousand euros remaining, of which 126,000 thousand euros due March 31, 2027 and 14,000 thousand euros is short-term.
- 30,000 thousand euros, usable in cash and intended to support general revolving financial requirements, to be repaid in a lump-sum at the end of the relative interest period as set forth in the utilization request, with a maximum duration of 5 years.
- 32,816 thousand euros remaining, of which 25,971 thousand euros due March 31, 2027 and 6,845 thousand euros is short-term.
This loan requires compliance with consolidated operating management covenants, which were met as of December 2022.
2. Loan agreement signed with Unicredit in H1 2022 for a total amount of 19,000 thousand euros, residual value of 9,500 thousand euros maturing on December 31, 2023.
3. Loan agreement signed with Crédit Agricole Italia in December 2022 for a total amount of 50,000 thousand euros, maturing on December 16, 2027. This financing will provide the funding for the acquisition of e-comer, which will be finalized in January 2023.
Note that during 2022 a portion of the loan with Crédit Agricole, originally of USD 50,000 thousand, was repaid in advance in the amount of 13,200 thousand euros. Moreover, the Unicredit loan of 10,500 thousand euros, which matured, and 9,500 thousand euros of the Unicredit loan taken out in 2022 were repaid. Further information can be obtained from the specific tables provided below.
DESCRIPTION (THOUSAND EUROS) CURRENCY CONT. VAL. DECEMBER 31, 2021 CHANGE CONT. VAL. DECEMBER 31, 2022 NOM. VAL. DECEMBER 31, 2022 (LC/000) Bank accounts payable and advances Comer Ind S.p.A. EUR 7,779 (2,206) 5,574 5,574 Bank accounts payable and advances Comer Comp. S.r.l. EUR 7,287 (2,501) 4,786 4,786 Loan Unicredit Comer Ind. S.p.A. EUR 10,500 (10,500) 0 0 Loan Unicredit Comer Ind. S.p.A. EUR 0 9,500 9,500 9,500 Loan CAI Comer Ind. S.p.A. EUR 0 10,076 10,076 10,076 Loan Crédit Agricole M/L current portion EUR 0 15,469 15,469 15,469 Loan Crédit Agricole M/L current portion USD 4,400 2,468 6,868 7,325 Total gross short-term loans 29,966 22,305 52,272 Up-front commissions for short-term structured loans EUR (763) 71 (692) (692) Total net short-term loans 29,203 22,376 51,580 92 2022 Annual Report
Reported below is the breakdown of bank loans by nature, short and medium/long-term existing as at December 31, 2022:
SHORT
AND
MEDIUM/LONG-TERM FINANCIAL PAYABLES
The heading refers to payables deriving from the application of the international accounting standard IFRS 16. The detail for the breakdown of the item payables on December 31, 2022 and its variation is provided below:
COMMITMENTS AND GUARANTEES
Guarantees given amount to 32,990 thousand euros (38,916 thousand euros in 2021) and consist of commitments of Comer Industries S.p.A. in the total amount of 23,149 thousand euros, all relating to the granting of local credit facilities in favor of subsidiaries. The Group has no commitments to finance leasing companies.
DESCRIPTION (THOUSAND EUROS) CURRENCY CONT. VAL. DECEMBER 31, 2021 CHANGE CONT. VAL. DECEMBER 31, 2022 NOM. VAL. DECEMBER 31, 2022 (LC/000) Loan CAI M/L long-term portion EUR 0 40,000 40,000 40,000 Loan Crédit Agricole M/L long-term portion EUR 140,000 (14,000) 126,000 126,000 Loan Crédit Agricole M/L long-term portion USD 39,602 (13,631) 25,971 27,701 Total gross long-term borrowings 179,602 12,369 191,971 Up-front commissions for M/L structured loans (1,859) 557 (1,302) (1,302) Total long-term borrowings 177,743 12,926 190,669
DESCRIPTION (THOUSAND EUROS) DECEMBER 31, 2021 INCREASES DECREASES FOREIGN EXCHANGE IMPACT DECEMBER 31, 2022 Short-term payables IFRS 16 8,739 1,225 (153) (68) 9,744 Long-term payables IFRS 16 47,592 9,706 (8,970) (280) 48,048 Total 56,331 10,931 (9,123) (348) 57,791 DESCRIPTION (THOUSAND EUROS) BALANCE AS AT DECEMBER 31, 2021 NEW DISBURSEMENT REPAYMENTS BALANCE AS AT DECEMBER 31, 2022 < 1 YEAR > 1 YEAR OF WHICH > 5 YEARS EXPIRY Unicredit 10,500 (10,500) 0 July 31, 2022 Unicredit 0 19,000 (9,500) 9,500 9,500 December 31, 2023 CA-CIB Line A1 20,000 20,000 2,000 18,000 March 31, 2027 CA-CIB Line A2 120,000 120,000 12,000 108,000 March 31, 2027 CA-CIB Line A3 $ 44,002 (13,200) 30,802 6,845 23,957 March 31, 2027 CAI 0 50,000 50,000 10,000 40,000 December 16, 2027 Total 194,502 69,000 (33,200) 230,302 40,345 189,957 0 OTHER
93 Comer Industries
94 2022 Annual Report
The Parent Company's share capital as of December 31, 2022 consists of 28,678,090 shares with no par value and fully subscribed and paid up for 18,487,338.60 euros.
On May 3, 2022 dividends of 0.5 euros per share relating to the result for the 2021 financial year were paid for a total of 14,339 thousand euros.
OTHER RESERVES
(THOUSAND EUROS)
Information regarding the distributability of the reserves can be found in the notes to the financial statements of the Parent Company Comer Industries S.p.A.
The increase in the legal reserve relates to the allocation of the 2021 result of the parent company Comer Industries S.p.A. net of dividend distribution.
The decrease in the conversion reserve of 3,866 thousand euros is mainly attributable to the revaluation of the euro against the US dollar and the Chinese renminbi compared to the exchange rates reported at December 31, 2021.
It should be noted that during the period dividends relating to available reserves of some subsidiaries were distributed in favor of the parent company Comer Industries S.p.A. and in particular for a total of 12,469 thousand euros by Comer Industries INC, Comer UK, Comer Jiaxing and Comer Industries Component S.r.l.
On December 31, 2022 the cash flow hedge reserve includes the fair value of contracts to hedge expected cash flows in foreign currency, as well as contracts to cover interest rate risks, considered effective according to the requirements of IFRS 9 concluded in the first half of 2022.
The IAS 19 reserve includes the change of 26,227 thousand euros relating to the recognition of actuarial gains on pension funds described in detail in Section 2.6.12.
Reconciliation between the amount of capital and reserves and the result of operations of the Parent Company Comer Industries S.p.A. in compliance with the IAS/IFRS international accounting standards as at December 31, 2022, and the amounts reported in this consolidated financial report, drawn up in compliance with international standards, on the same date is as follows: DECEMBER 31, 2022 DECEMBER 31, 2021 Legal reserve 3,416 2,622 Extraordinary reserves available 19,225 19,225 Stock grant reserve 8,181 8,181 Consolidation reserve 3,543 3,543 FTA reserve (IAS/IFRS first time adoption) (5,923) (5,923) Translation reserve 212 4,078 CFH reserve (Cash Flow Hedge) (387) 345 IAS 19 reserve 26,227 Total other reserves 54,495 32,071
2.6.10 NET EQUITY
Other reserves include
It should be noted that during the year dividends were distributed in favor of the holding company Comer Industries S.p.A., relating to profits for the year and available reserves of some subsidiaries, mainly by Comer Industries Inc., Comer Industries Components s.r.l., Comer Industries UK Ltd. and Comer Industries (Jiaxing) Co. Ltd. for a total of 12,469 thousand euros.
Actuarial earnings from recalculating the pension provision for the year 2022 have been reported after changes in the reserves for retained earnings (as required by the revised IAS 19.93 A) and amounted to 26,492 thousand euros, gross of the tax effect. All the effects of the above are shown net of the related taxes.
31, 2021
DECEMBER
DESCRIPTION (THOUSAND EUROS) NET EQUITY NET PROFIT/LOSS FOR THE YEAR NET EQUITY NET PROFIT/LOSS FOR THE YEAR Impact of the result for the year on Equity of the Parent Company 314,958 38,044 119,735 15,884 Other changes: Share capital increase 5,378 Increase in share premium reserve 159,937 Net increase in stock grant reserve 2,194 Effects IAS 19 rev. Actuarial losses net of tax effect 726 (126) Dividends approved (14,339) (10,205) Statutory net equity of Comer Industries S.p.A. IAS/IFRS 301,344 38,044 276,913 15,884 Differences between the adjusted net equity of consolidated equity investments and their value in the financial statements of the Parent Company 251,113 84,240 166,873 30,337 Reversal of intercompany dividends (106,824) (12,469) (94,355) (2,748) Change in the Cash Flow Hedge Reserve IAS 38 Comer Industries Jiaxing (328) 345 Elimination of exchange rate differences from translation reserve calculation 212 4,078 Effects IAS 19 rev. Actuarial losses net of the tax effect 25,478 (491) Equity contribution of subsidiaries to the Parent Company 169,652 71,771 76,451 27,589 Effects deriving from consolidation entries (27,111) (19,099) (7,752) (4,044) Net equity attributable to minority interests - - -Total net equity IAS/IFRS 443,885 90,716 345,612 39,429 95 Comer Industries
DECEMBER 31, 2022
2.6.11 DEFERRED TAX LIABILITIES
The deferred taxes are related to the tax effect of timing differences between the profit and loss for the year for statutory purposes of each company, and any associated taxable income.
The amounts so defined are detailed in the following table:
(*) Values restated from December 31, 2021 in accordance with IFRS 3, to retrospectively take into account the tax effects resulting from the final accounting of the WPG acquisition transaction (values previously considered provisional, see Section 2.5 "Acquisition of Walterscheid Powertrain Group").
The balance of temporary differences Italian companies is mainly attributable to the adjustment of foreign currency items.
The balance of foreign subsidiary temporary differences mainly includes the deferred tax provision resulting from the final Purchase Price Allocation process.
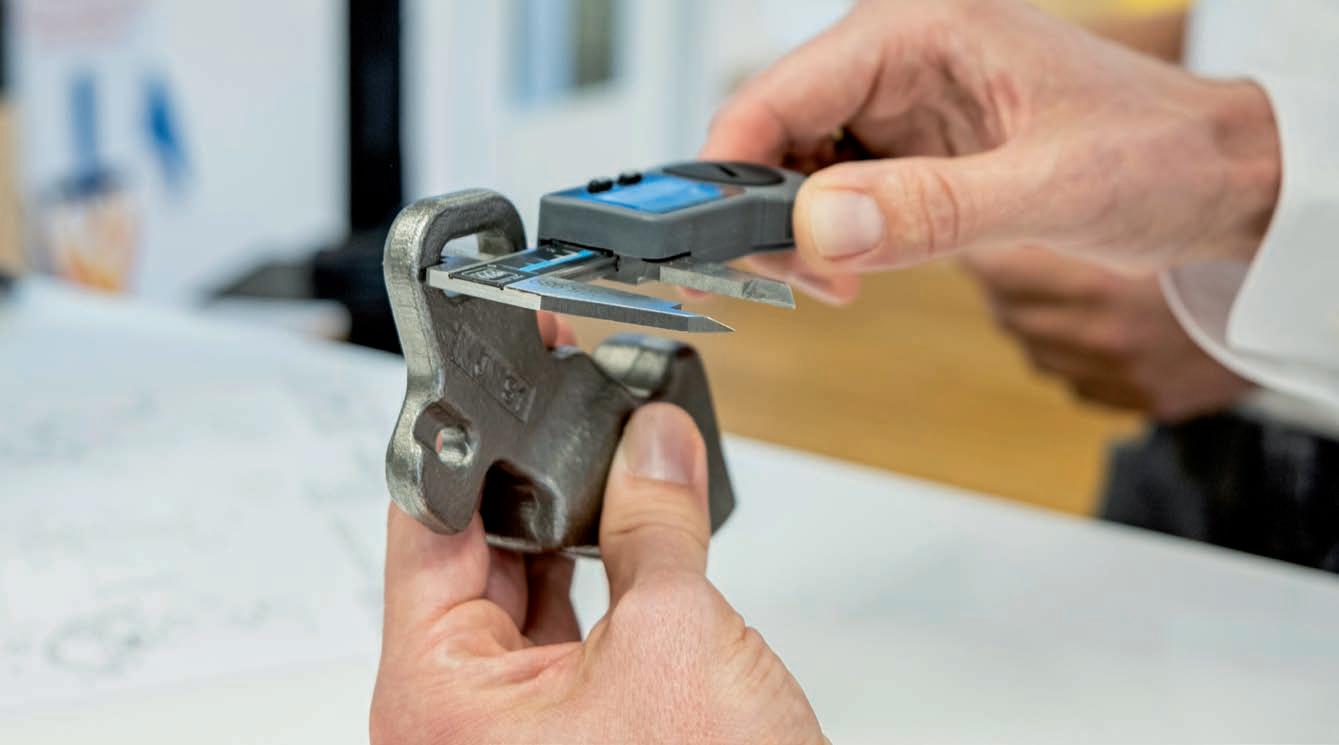
DECEMBER 31, 2022 DECEMBER 31, 2021 RESTATED (*) 2022 DESCRIPTION (THOUSAND EUROS) TOTAL DEFERRED TAXES TOTAL DEFERRED TAXES (USED) ALLOCATED Temporary differences Italian companies 1,605 175 1,430 Temporary differences foreign subsidiaries 60,146 61,729 (1,583) Total deferred taxes 61,751 61,904 (153) Total deferred taxes consolidation 620 620 0 Total deferred taxes in the financial statements 62,371 62,524 (153)
96 2022 Annual Report
2.6.12 POST-EMPLOYMENT BENEFITS
Variations in the provision were as follows:
The economic and equity effects of the period, compared with the previous year, are detailed below: This item refers to:
- Employee benefits governed by the rules and regulations in force in Italy and recorded in the financial statements of Italian companies
- Benefit plans defined after employment calculated on the basis of the final salary for all employees of its WPG subsidiaries in Germany and the USA.
The positive effect for the period of 39,320 thousand euros before taxes is mainly reflected in the recognition of the actuarial gain accrued as a result of the adjustment of discount rates, as explained below. With regard to the Italian branches, the total value of which amounts to 7,608 thousand euros, based on the actuarial valuation and interpretations available at the date of preparation of the financial statements, the Group has made the following distinction:
• Employee severance indemnity (TFR) installments accruing as from January 1, 2007: considered a "defined
DESCRIPTION: (THOUSAND EUROS) DECEMBER 31, 2022 DECEMBER 31, 2021 Current service cost (2,431) (409) Actuarial losses/(gains) (39,320) 315 Financial expenses 1,708 195 Tax effect on income statement 202 74 Equity tax effect 12,828 (117) Overall effect (27,014) 58
CHANGES (THOUSAND EUROS) DECEMBER 31, 2022 DECEMBER 31, 2021 Opening balance 165,179 9,228 Acquisition balances 155,996 Use for discharges and advances (5,533) (619) Settlements of complementary pensions and treasury funds (1,945) (1,942) Allocation for the year 5,827 2,473 Effects of IAS 19 recalculation period (gross of taxes) (39,320) 43 Closing balance 124,208 165,179 Short term 5,792 7,379 Medium/long term 118,416 157,800 Closing balance 124,208 165,179
97 Comer Industries
contribution plan" in the case of both the option for complementary social security schemes as well as the option for the treasury fund of the National Security Institution (INPS). The accounting treatment is therefore the same as that in place for other types of contribution payments.
• Employee severance indemnity (TFR) provision as at December 31, 2006: remains a "defined benefit plan" for which actuarial calculations must be made, although, compared to the calculations made to date (and reflected in the financial statements for the year ending December 31, 2006), excludes the component relating to future salary increases.
Liabilities for defined benefit plans have been determined on the basis of the following Group actuarial assumptions with value scales from 2020 to 2023:
In accordance with new regulations of IAS 19, the values of the employee severance
(TFR) provision that would have been obtained by changing the above actuarial assumptions are as follows:
The companies maintain defined benefit plans in the balance sheet at the end of the employment relationship calculated with the last salary. Employees generally receive a fixed pension for each year they work. Benefits vary based on date of entry, length of employment, and worker's compensation. With respect to the US subsidiaries, the entire value of the plans is fully funded by assets.
Liabilities for defined benefit plans have been determined using the following actuarial assumptions:
ITALIAN ACTUARIAL ASSUMPTIONS MEASURING UNIT DECEMBER 31, 2022 DECEMBER 31, 2021 Discount rate % 4.11 0.73 Expected rate of wage growth % 0.50 0.50 Expected % of employees who will resign before pension (turnover) % 5.0 5.0 Annual cost of living increase rate % 2.3 1.8 Annual rate of employee severance indemnity (TFR) increase % 3.2 2.8 CHANGES (THOUSAND EUROS) DISCOUNTED SEVERANCE INDEMNITY PROVISION (TFR) Turnover rate +1.0% 7,668 Turnover rate -1.0% 7,533 Annual cost of living increase rate +0.25% 7,706 Annual cost of living increase rate - 0.25% 7,505 Discount rate + 0.25% 7,462 Discount rate - 0.25% 7,751
indemnity
98 2022 Annual Report
The interest rate used for discounting is based on the yields of high-grade corporate bonds with an average AA rating, increased for Europe from 1.1% as of December 31, 2021 to 3.7% as of December 31, 2022, and for the United States from 2.44% as of December 31, 2021 to 5.37% as of December 31, 2022. The significant actuarial assumptions in determining the defined benefit obligations are discount rate and future salary growth. The sensitivity analysis was determined based on reasonable possible changes in the respective assumptions occurring at the end of the reporting period, holding all other assumptions constant:
• If the discount rate is 0.5% higher (lower), the defined benefit obligation will decrease by 7.7 million euros (12.7 million euros in 2021).
• If the projected future salary grows (decreases) by 0.5%, the defined benefit obligation would increase by 0.9 million euros (1.8 million euros in 2021).
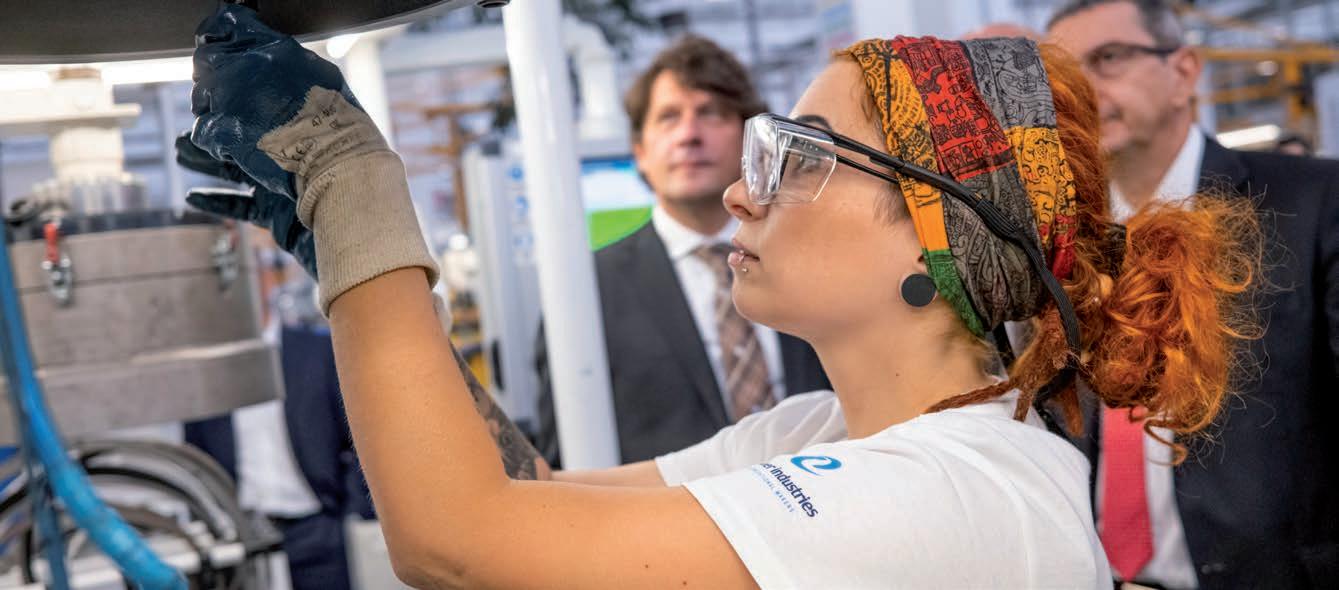
The composition of personnel by category, based on average data, is as follows:
As of December 31, 2022, the Group had 3,808 resources (including temporary workers), an increase of 198 from December 31, 2021.
GERMAN
MEASURING UNIT DECEMBER 31, 2022 DECEMBER 31, 2021 Discount rate % 3.70 1.00 Expected rate of wage growth % 2.75 2.00 Annual rate of employee severance indemnity (TFR) increase % 2.25 1.75
ACTUARIAL ASSUMPTIONS
CONTRACT CATEGORY AVERAGE NUMBER 2022 AVERAGE NUMBER 2021 Senior executives 34 49 White Collar and Managers 1,114 1,081 Blue Collar and Outsourced workers 2,520 2,375 Total 3,668 3,505
99 Comer Industries
2.6.13 SHORT AND LONG-TERM PROVISIONS
The provisions include:
The product warranty provision includes the estimation of specific risks reported before preparation of the financial statements and relating to past productions. It also refers to coverage of general risks (the result of a calculation based on historical data) for repairs or replacement of products that did not conform to expectations. The balance at the end of the year is due to the best estimate of these risks in relation to open claims, not yet settled at year end.
The provision for contingent tax liabilities refers to potential liabilities relating to audits in progress not yet concluded abroad.
The Supplementary Agents Indemnity Fund includes provisions for reimbursements recognized in the event of termination of the agency relationship, quantified according to the methods indicated in the collective economic agreement of 20 March, 2002 for the regulation of agency relations and commercial representation in the industrial sectors and cooperation.
The provision for contingent liabilities and legal expenses represents the reasonable risk calculated in relation to litigation or potential liabilities still pending in court.
Lastly, the other short-term and long-term
provisions for risks and charges cover the estimated liabilities mainly related to the completion of Group reorganizations also in relation to the acquisition of the German Group at the end of 2021.
2.6.14 TRADE PAYABLES AND OTHER LONG AND SHORT-TERM PAYABLES
(i) Trade payables
The balance of 198,630 thousand euros shows a decrease of 20 million from the previous year. The average payment days as of December 31, 2022 (calculated on the cost of the last quarter's came) amounted to 91 days compared to 113 days in the previous year.
There are no payables expiring after more than one year or expired for more than 12 months.
(ii) Other long and short-term payables
The short-term balance amounting to 34,758 thousand euros includes amounts due to employees for services accrued and not paid as of the year-end closing, as well as the best estimate of long-term benefits for directors and employees.
PROVISIONS FOR RISKS AND CHARGES (THOUSAND EUROS) DECEMBER 31, 2022 DECEMBER 31, 2021 Provision for product warranty risks 20,200 17,051 Other provisions for risks 7,112 1,165 Contingent liabilities for tax risks 311 172 Short-term provisions 27,624 18,388 Contingent liabilities for tax risks 8 8 Agents provision 247 428 Other provisions for risks and legal charges 1,805 2,235 Provision for long-term product warranties 8,786 6,217 Other provisions for risks 3,718 958 Long-term provisions 14,563 9,845 100 2022 Annual Report
2.6.15 CURRENT TAX LIABILITIES
The details are as follows:
At the end of the year there were liabilities with tax authorities for current taxes calculated on income for the period.
The amount due to the tax authorities for withholding taxes on employee and self-employed income is in line with the previous year.
2.6.16 INFORMATION ON FINANCIAL ASSETS AND LIABILITIES MANAGEMENT OF LIQUIDITY RISK
Liquidity risk is related to the difficulty in raising funds to meet commitments.
The control and implementation of appropriate policies for the management of liquidity risk in the presence of contingency guarantee the Company's survival and minimize the cost of funding. This particular risk, unlike the others, manifests its effects in a very short time, with devastating consequences for companies. It can result from insufficient resources available to meet financial obligations under the terms and deadlines set in the case of sudden revocation of uncommitted credit lines or of the possibility that the Company must honor its financial liabilities before their natural expiry.
As previously commented, the treasury activities of the Group are substantially centralized at the parent company.
In FY 2022 the Group developed a cash pooling project with leading financial institutions in order to optimize the cash flows of companies residing in foreign countries.
This project is expected to be completed in fiscal year 2023.
The management of liquidity risk implies:
• Maintaining credit lines defined as primary risk within a total of more than 80% of total credit lines
and a substantial balance between the short and medium/long-term lines. This is necessary in order to avoid liquidity strains in the case of requests for any reimbursement by the relevant financial partners.
• Maintaining the average financial exposure for the year within an amount substantially equivalent to 80% of the total amount committed by the banking system.
• Maintaining adequate liquidity derived from the cash flow generated by economic, characteristic and current operations.
It should be added that in managing this type of risk, the Group always tries to finance its investments with medium- to long-term unsecured claims (in addition to equity) in the breakdown of net debt, while covering current expenses using the shortterm credit lines above.
MANAGEMENT OF THE INTEREST RATE RISK
The Group is exposed to the risk of changes in interest rates associated with outstanding financial assets and liabilities. The objective of interest rate risk management is to limit and stabilize the negative effects on cash flows subject to changes in interest rates. As of December 31, 2022, the Group had no interest rate risk hedging instruments in place given its limited financial debt.
The risk is related to financial instruments on which interest accrues that are at a variable rate and which are not hedged through other financial
DESCRIPTION (THOUSAND EUROS) DECEMBER 31, 2022 DECEMBER 31, 2021 Tax authority balance for current taxes 17,731 15,009 Tax authority for IRPEF withholdings 1,722 1,703 Other amounts due to tax authorities for withholding tax and VAT owed by foreign companies 3,720 5,105 Current tax liabilities 23,173 21,816
101 Comer Industries
instruments, for which reference should be made to paragraph 2.6.16 in relation to the sensitivity analysis.
MANAGEMENT OF EXCHANGE RATE RISK
In addition to that already written in the previous paragraph, it should be noted that the Group has significant transactions in the currency of non-EU countries (mainly USD and CNY). The exchange rate risk is hedged through purchase and sale of foreign currencies contracts (forwards). Counterparties in these operations are the banks with which the Group normally operates. The currencies involved are the USD and CNY, and any such transactions carried out to hedge cash inflows connected with budgeted sales transactions, scheduled on a monthly basis, may well fall within those defined as "highly effective" on "highly probable" future transactions, and their economic effect is recorded on an accrual basis. The efficacy assessment is aimed at proving the high correlation existing between the technicalfinancial characteristics of the risk being hedged (maturity, amount, etc.) and those of the hedging instrument, by carrying out specific retrospective and prospective tests.
The fair value of a derivative contract is calculated using the official listing prices for instruments traded in regulated markets. The fair value of instruments that are not listed on regulated markets is calculated using valuation models that are appropriate for each category of financial instrument, with market data related to the balance sheet date (such as interest rates, exchange rates, and volatility), discounting the expected cash flows based on interest rate curves and converting amounts in other currencies to the Euro through exchange rates provided by the European Central Bank.
Additional information, along with the sensitivity analysis, was provided in the relevant parts of the notes to the financial statements, in accordance with IFRS 7, to which reference should be made. It provides details on the amounts of the outstanding derivative transactions on December 31, 2022, specifying the fair value and notional value in euros for each instrument class.
RESIDUAL COVERAGE 2022 (AMOUNTS IN THOUSANDS) OPERATION TYPE CURRENCY NOMINAL VALUE NOTIONAL VALUE FAIR VALUE Hedges deemed effective Amounts in currency Amounts in euros Amounts in euros Term hedging USD/CNY USD 12,000 11,251 (234) Total residual coverage 2022 11,251 (234) Short-term derivative financial instruments 11,251 (234)
102 2022 Annual Report
SENSITIVITY ANALYSIS
The following analysis has been prepared in order to better identify the economic risks and changes in equity arising from possible changes in exchange rates.
The analysis is performed on year-end and average exchange rates for the period adjusted with the maximum and minimum values recorded over an observation period of 52 weeks in 2022, the volatility index of the main currencies used by the Group.
The aim of the simulation is to show the impacts on the Group’s net profit and equity deriving from the translation of the financial statements of subsidiaries into the currency of the consolidated financial statements according to potential maximum fluctuations predicted by the analysis.
The Group considers that it is not subject to significant economic and equity impacts deriving from the management of transactions of the single legal entities forming part of the scope of consolidation in foreign currency.
With regard to interest rates, the risk of which derives from financial instruments with interest accruing at a floating rate that are not hedged via other financial instruments, a sensitivity analysis was performed in which the effects of a change in interest rates of ±50 basis points with respect to the spot interest rates at December 31, 2022 were considered, all other variables remaining constant. Potential impacts were calculated on floating rate financial liabilities as of December 31, 2022. The aforementioned change in interest rates would result in a higher (or lower) net pre-tax charge, as discussed below:
IMPACT ON EQUITY (THOUSAND EUROS) IMPACT ON NET PROFIT (THOUSAND EUROS) LOCAL CURRENCY RANGE LAST 52 WEEKS 2022 RANGE LAST 52 WEEKS 2022 2022 AVG 365 DAYS RANGE LAST 52 WEEKS 2022 Source: UIC Net equity Net Profit min max Spot 12.31.2022 min max min max US dollar 138,353 22,260 0.957 1.146 1.067 14,931 (9,029) 1.053 2,132.7 (1,722.3) British pound 7,103 - 10,115 0.824 0.903 0.887 613 (140) 0.853 (415.8) 655.9 Chinese renminbi 631,014 222,749 6.752 7.533 7.358 7,702 (1,985) 7.079 1,524.0 (1,895.7) Indian rupee 749,171 122,179 78.266 88.230 88.171 1,075 (6) 82.686 83.5 (92.8) Brazilian real 47,487 21,035 4.968 6.442 5.639 1,136 (1,050) 5.440 367.1 (601.5) Russian ruble 119,250 - 13,260 84.531 117.201 85.300 13 (381) 88.397 (6.9) 36.9
min (-50 bps) max (+50 bps) Index Spread Rate Capital Interest Rate Economic effect Rate Economic effect Loan Unicredit Euribor 3 months 2.132% 0.50% 2.63% € 9,500 € 250 2.132% € -48 3.132% € 48 CA-CIB Line A1 Euribor 6 months 2.693% 1.00% 3.69% € 120,000 € 4,432 3.193% € -600 4.193% € 600 CA-CIB Line A2 Euribor 6 months 2.693% 1.00% 3.69% € 20,000 € 739 3.193% € -100 4.193% € 100 CAI Euribor 6 months 2.693% 1.15% 3.84% € 50,000 € 1,922 3.343% € -250 4.343% € 250 CA-CIB Line A3 $ Libor 6 months 4.170% 1.15% 5.32% $ 35,000 € 1,757 4.820% € -165 5.820% € 165 Total € 9,098 € -1,163 € 1,163 103 Comer Industries
MANAGEMENT OF CREDIT RISK
The Group's policy is to sell to customers after an evaluation of their credit capacity and therefore within pre-set credit limits.
Historically, the Group has not suffered significant losses on receivables. With reference to the changed economic conditions that marked the year 2022, it is believed that the risk connected to the reference value is higher. Consequently, the Group has strengthened its procedures for the selection of customers, monitoring of recoveries of credit and has set up a specific insurance coverage for 95% of receivables generated by the Holding company (with the exception of several historical customers with a grade of highly reliable), in respect of the credit lines assigned. The risk of insolvency has been adequately reflected in the accounts by the allocation of the specific allowance for doubtful accounts.
MANAGEMENT OF THE PRICE RISK
The Group is subject to the risk of fluctuation in the price of raw materials, particularly that of: aluminum, cast iron, copper and steel. Group companies review the sales prices of the products annually, transferring to customers increases in purchase costs in percentage terms compared to forecast indices, on the basis of specific trade indexing agreements.
2.6.17 SALES REVENUES
The breakdown of revenues by geographic area is as follows (2021 included WPG's revenues only in the month of December):
The Group closed 2022 with an increase of 106.9% in total sales volumes, which stand at 1,237,576 thousand euros. The most significant growth was in Europe and North America, especially in the agricultural sector, as well as in the change in the scope of consolidation.
The turnover generated outside national borders reached 91% of the total, a figure that confirms the continuous expansion of the internationalization process.
DESCRIPTION (THOUSAND EUROS) DECEMBER 31, 2022 INC. % DECEMBER 31, 2021 INC. % CHANGE % EMEA 694,634 56.1% 248,526 41.6% 179.5% NORTH AMERICA 265,315 21.4% 129,851 21.7% 104.3% ASIA PACIFIC 208,751 16.9% 190,128 31.8% 9.8% LATIN AMERICA 68,875 5.6% 29,604 4.9% 132.7% Total turnover by geographical area 1,237,576 100% 598,110 100% 106.9%
104 2022 Annual Report
2.6.18 OTHER OPERATING REVENUES
The breakdown of other operating revenues is as follows:
The recovery of production, repairs, services and transport costs heading includes, among other things, bonuses and volume awards on supplies, charges for design and endurance test expenses, and the recovery of logistical and repair costs.
Costs capitalized during the year for industrial product development projects amount to 275 thousand euros.
Other income and revenues increased in 2022 compared to the previous year also due to the amounts attributable to the German WPG Group.
2.6.19 PERSONNEL COSTS
Personnel costs in absolute terms increased by 156,834 thousand euros compared to 2021 and related almost entirely to the values of the German WPG group. The heading also contains the annual production bonus and provision of the variable salary in all the subsidiaries in the world, as the Group managed to meet the profitability targets established for 2022.
2.6.20 REMUNERATION OF DIRECTORS AND STATUTORY AUDITORS
The fees of the Directors and Statutory Auditors of Comer Industries S.p.A. for the performance of their offices in the Parent Company and in the other enterprises included in the consolidation are as follows:
DESCRIPTION (THOUSAND EUROS) DECEMBER 31, 2022 DECEMBER 31, 2021 Recovery of manufacturing, repair, service and transportation expenses 1,979 1,534 Scrap sales 665 707 Capital gains, photovoltaic refund 230 172 Capitalized costs 275 403 Income from insurance claims 0 475 Other revenues and income including out-of-period income 3,779 2,486 Total other revenues and income 6,929 5,778
DESCRIPTION (THOUSAND EUROS) DECEMBER 31, 2022 DECEMBER 31, 2021 Directors 2,299 1,211 Chief Executive Officer (service cost value share-based payment stock grant plan) - 2,194 Statutory Auditors 50 50 Total compensation 2,349 3,455 105 Comer Industries
The amounts include fees payable for the period resolved by the Shareholders’ Meeting and the remunerations established by the Board of Directors for Directors attributed particular responsibilities, including bonuses. The values do not include social security and insurance contributions. The Group does not have any stock grant and/or stock option plans in place as of today.
2.6.21 OTHER OPERATING COSTS AND WRITE-DOWNS
The item other operating costs includes indirect charges associated with turnover, production and the corporate organizational structure such as rentals, utilities, leases and maintenance, insurance expenses, sales commissions, expenses related to product quality as well as losses in value related to impairment tests on rights of use relating to leased properties.
Write-downs include provisions for bad debts and warranty for the year, before any uses.
As required by Art. 149-duodecies of the Issuer Regulation amended by Consob Resolution no.
15915 of May 3, 2007 published in Official Gazette no. 111 of May 15, 2007 (SO 115), the remuneration for the year 2022 for services provided by the audit firm Deloitte & Touche S.p.A. relating to the certification of the 2021 financial statements is as follows:
o annual and infra-annual audit engagements on Italian companies for 111 thousand euros;
o annual and infra-annual engagements for the audit of subsidiary companies for 350 thousand euros;
All the above-described fees are included in the "other operating costs" heading.
2.6.22 OPERATING RESULT
The operating result achieved, in absolute terms, is equivalent to 127,517 thousand euros, corresponding to 10.3% of the consolidated turnover, increasing compared to 9.5% of the previous year. This result is mainly due to the combined effect of the increase in sales volumes and the ongoing efficiency drive in production and management processes throughout the Group. Further information can be found in the Directors’ Report on operations.
106 2022 Annual Report
2.6.23 NET FINANCIAL INCOME / (CHARGES)
The details are as follows:
EXCHANGE GAIN (LOSS)
This item includes both realized differences between the historical exchange rates of the relevant transactions and the reference exchange rates of receipts and payments in foreign currency, and unrealized differences due to the translation of monetary items at the spot exchange rate at the end of the financial year. The profit is mainly attributable to the latter case, and in particular to the revaluation of the Chinese yuan and of the dollar against the euro.
The figure is shown net of the negative effect resulting from the revaluation of the dollar loan commented on above.
INTEREST AND OTHER NET FINANCIAL CHARGES
The value of interest payable on advances and loans of a banking nature, both long- and short-term (equal to 4,581 thousand euros) has deteriorated compared to the previous period (394 thousand euros) as a result of the loan contracts stipulated in the year.
The Interest payable heading for discounting the pension funds refers to the recalculation according to IAS 19 of the amount allocated to provisions for severance pay by Italian, German and American companies.
DESCRIPTION (THOUSAND EUROS) DECEMBER 31, 2022 DECEMBER 31, 2021 Exchange gain (loss) 4,842 (731) Exchange gains and losses 4,842 (731) Bank interest receivable 445 189 Other interest income 558 11 Total financial income from cash management 1,003 199 Interest on advances, loans and other short-term bank borrowings (1,810) (12) Interest on medium/long-term loans (2,770) (382) Interest on loans amortized cost (781) (486) Interest expense on discounted pension funds (1,708) (195) Economic result of interest rate hedging transactions fair value as at 12/31 137 13 Total financial costs from cash management (6,933) (1,062) Interest resulting from the application of IFRS 16 (1,500) (403) Interest and other Net financial charges (7,430) (1,265) Financial income balance (2,588) (1,996)
107 Comer Industries
2.6.24 INCOME TAXES
The total tax charge of 34,213 thousand euros includes current income taxes of 22,755 thousand euros (18,250 thousand euros in 2021), a positive change in deferred tax assets of 3,335 thousand euros, lower deferred tax liabilities of 4,160 thousand euros, and withholding taxes on dividends from foreign companies for 816 thousand euros. The consolidated tax charge calculated net of withholding tax on dividends from subsidiaries and tax credits, stands on December 31, 2022 at around 26.7% against 28.0% calculated correspondingly on the 2021 period.
This improvement is mainly attributable to the different taxation in the countries the Group
operates in and to the absence in 2022 of nondeductible costs as present in 2021 with respect to the WPG acquisition booked to the income statement in the consolidated financial statements, as required by IFRS 3. In order to better understand the reconciliation between the tax burden recognized in the financial statements and the theoretical tax burden, the following explanatory table is provided wherein the IRAP (regional tax on productive activities) is not considered as this, being a tax with a tax base different from income before taxes, would generate distortions between one year and another. The reconciliation was therefore determined with reference to the single IRES (corporate income tax) tax rate in force in Italy, equal to 24.0%.
DESCRIPTION (THOUSAND EUROS) DECEMBER 31, 2022 DECEMBER 31, 2021 Consolidated profit before taxes 124,929 54,835 Parent Company theoretical tax rate 24% 24% Theoretical income taxes 29,983 13,160 Tax effect of permanent differences – Italian companies (629) 780 Effect of foreign tax rates different from the theoretical Italian tax rates (3,208) 813 Tax effect of taxation of dividends from consolidated companies 150 142 Bonus tax credit – Italian Legislative Decree 91/2014 (25) (25) Tax effect of tax relief for Italian companies ACE (113) (84) Tax effect of R&D credit (Italian Law 190/2014 Art.1, para. 35) and energy credit (1,776) (191) Tax effect of super-amort/depr (Italian Law
hyper-amort/depr (Italian Law
(453) (590) Prior-year taxes and provisions (332) (61) Tax impact on consolidation entries and IRAP impact on deferred taxes 7,588 (261) Income taxes recorded in the financial statements, excluding IRAP 31,185 13,683 Current IRAP 3,029 1,723 Income taxes posted to the financial statements (current, deferred) 34,214 15,406
208/2015) and
232/2016)
108 2022 Annual Report
2.6.25 EARNINGS PER SHARE
At the bottom of the income statement, the earnings/(loss) per share is reported, determined according to that manner provided in IAS 33, as summarized below.
The means of calculation of the basic earnings (loss) per share and the diluted earnings (loss) per share are defined by IAS 33 – Earnings per share. The basic earnings (loss) per share is defined as the ratio between the economic result or the results of continuing operations of the Group attributable to the holders of ordinary shares and the number of ordinary shares outstanding at the end of the fiscal year.
Reggiolo, Italy, March 21, 2023
For the Board of Directors
Matteo Storchi (President & CEO)
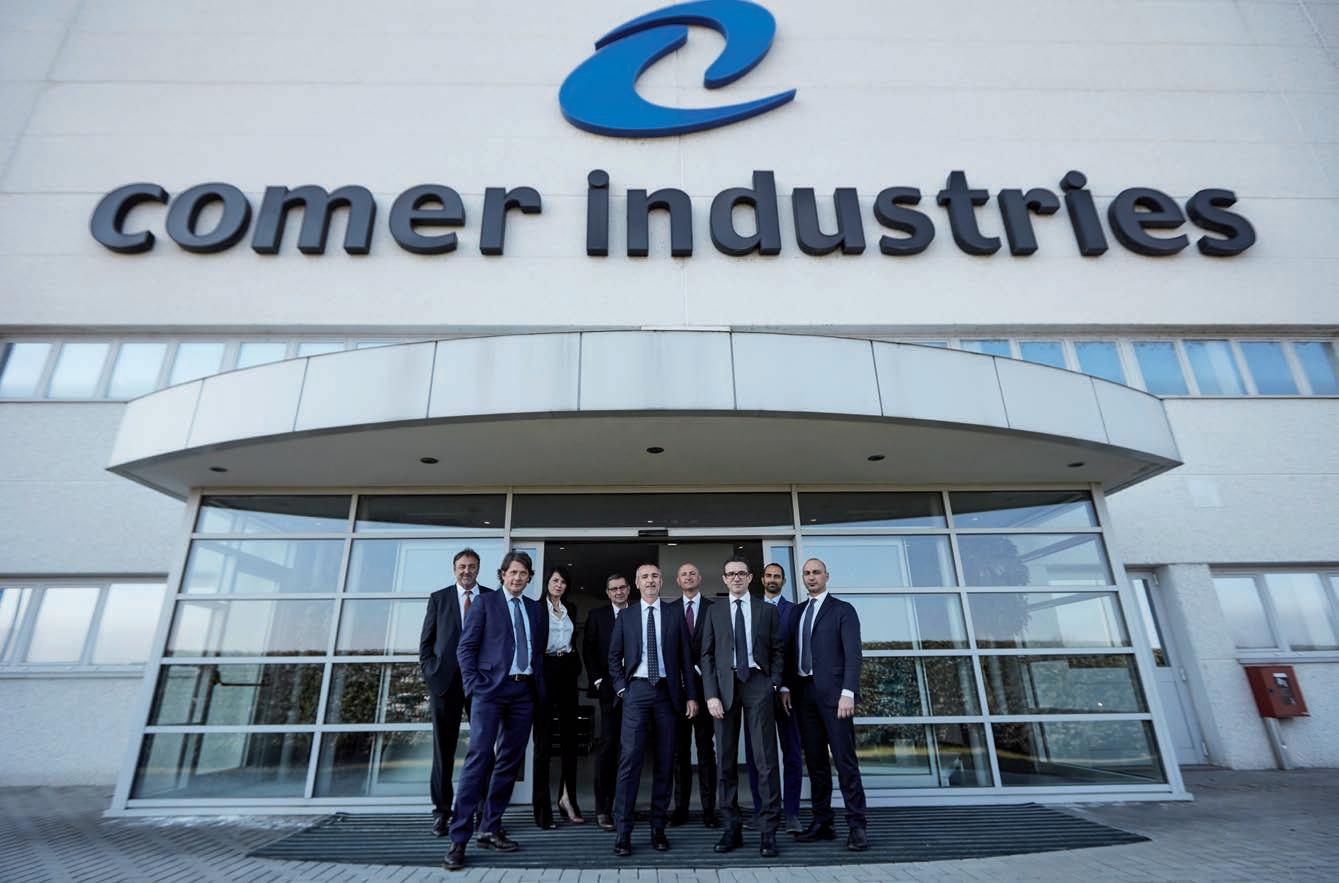
DESCRIPTION (EUROS) DECEMBER 31, 2022 DECEMBER 31, 2021 Consolidated net income for the period attributable to Parent Company shareholders 90,716,070 39,428,960 Number of shares outstanding 28,678,090 28,678,090 Earnings per share (EPS) (€) 3.16 1.37
109 Comer Industries
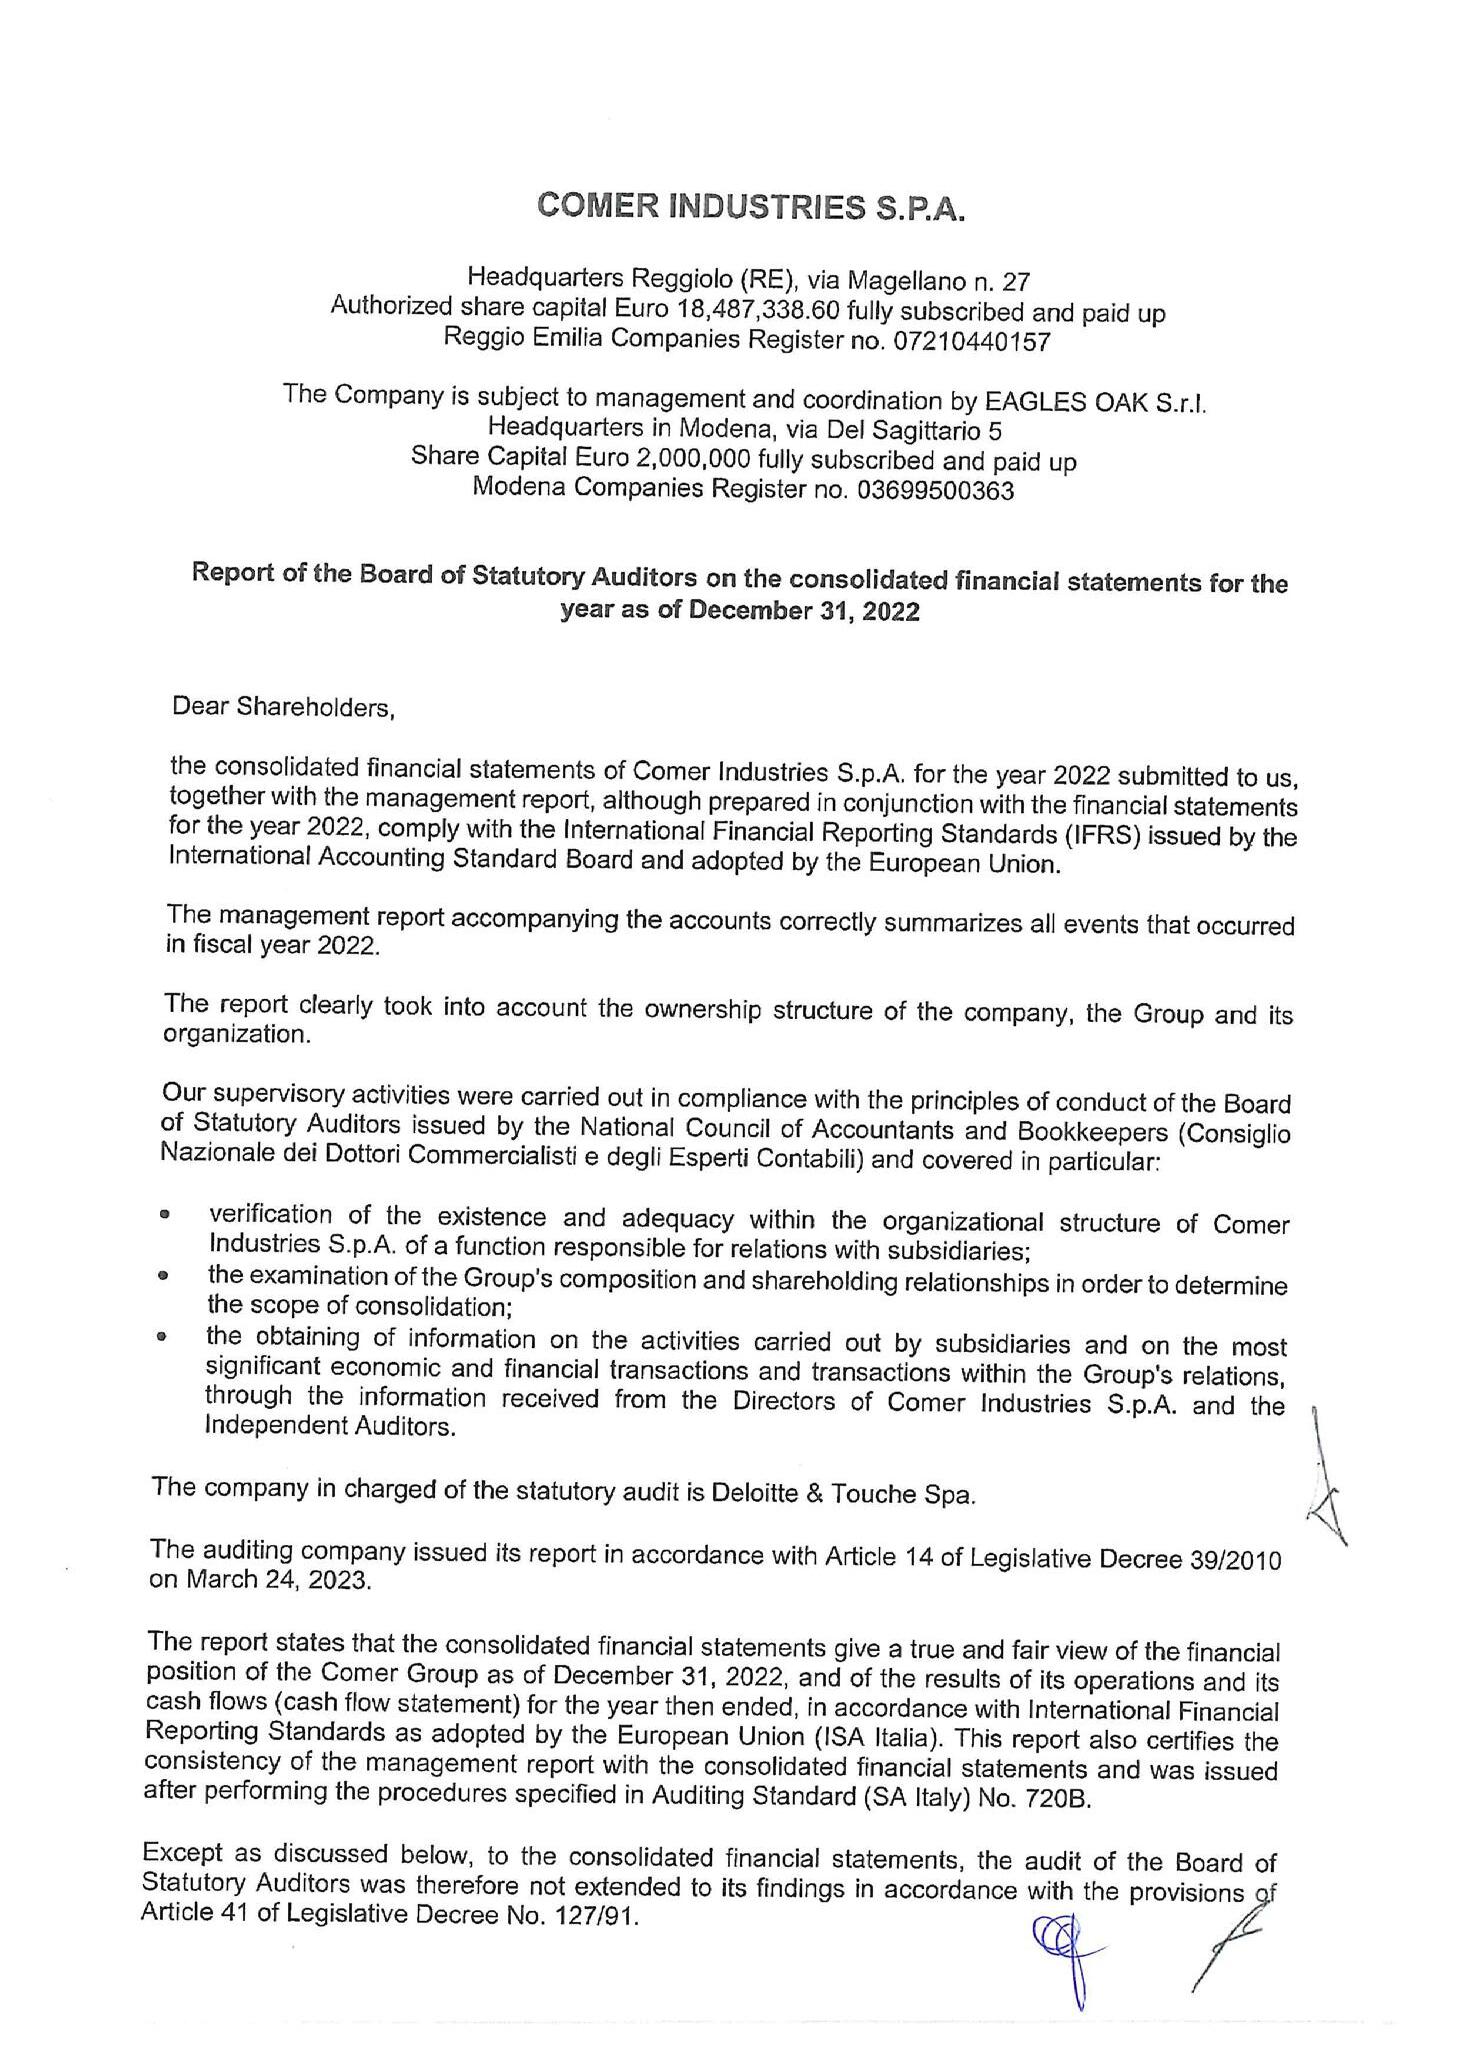
112 Annual Report 2022
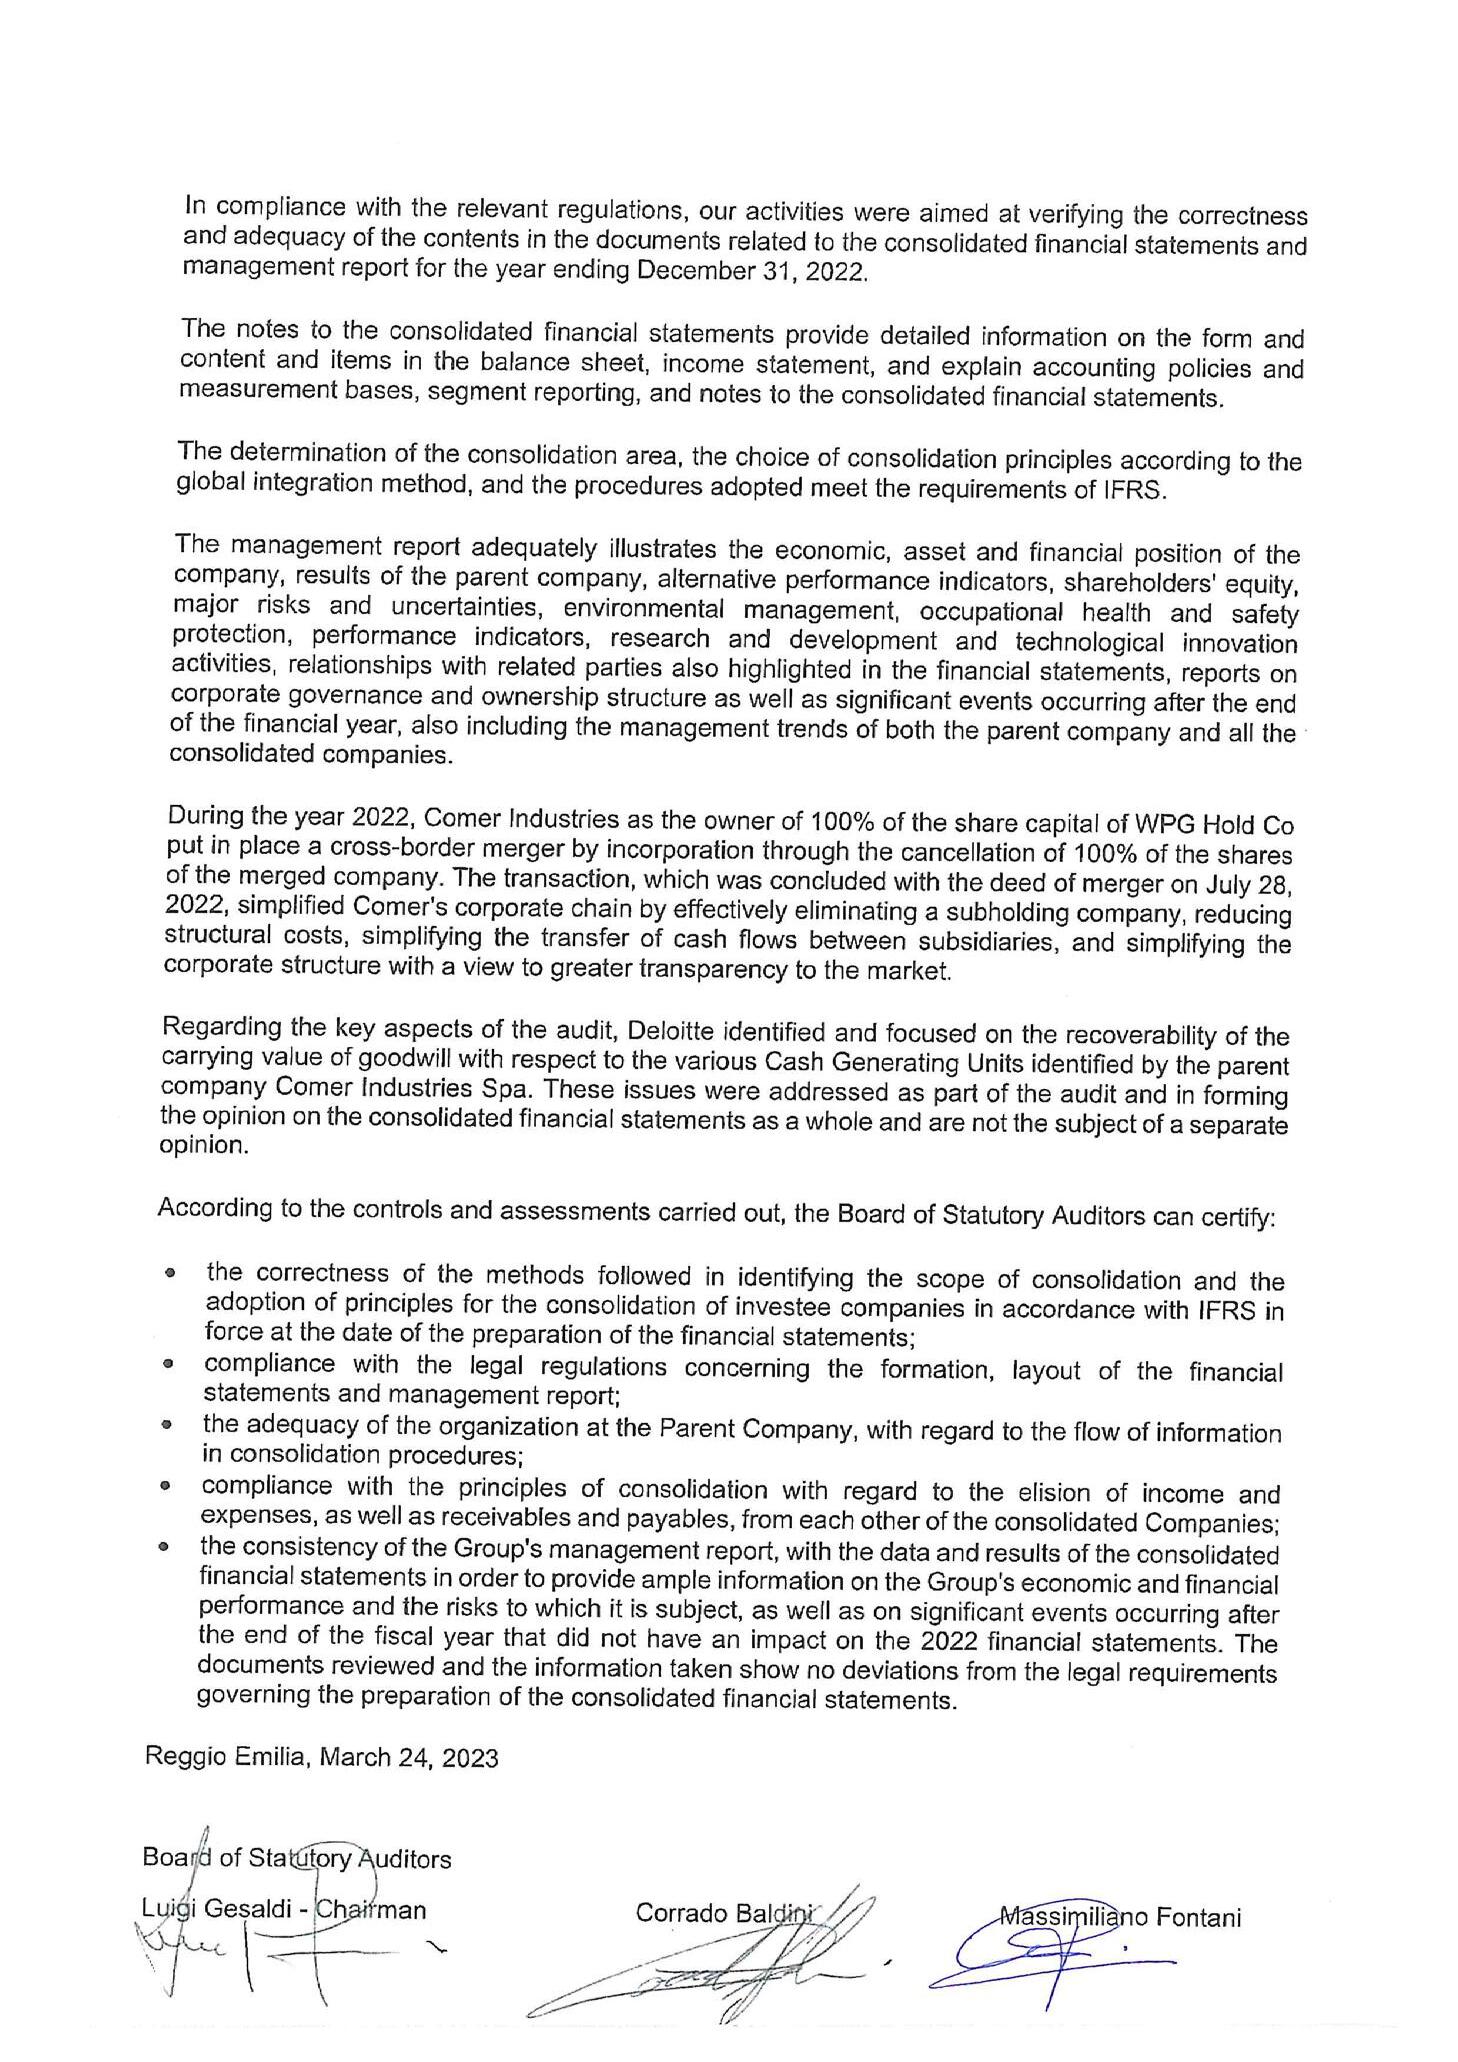
113 Comer Industries
114 Annual Report 2022
115 Comer Industries
Deloitte & Touche S.p.A. Piazza Malpighi, 4/2
40123 Bologna Italia
Tel: +39 051 65811
Fax: +39 051 230874
www.deloitte.it

INDEPENDENT AUDITORS’ REPORT
PURSUANT TO ARTICLE 14 AND 19-BIS OF LEGISLATIVE DECREE No 39 OF JANUARY 27, 2010
R REPORT ON THE AUDIT OF THE CONSOLIDATED FINANCIAL STATEMENTS
Opinion
We have audited the consolidated financial statements of Comer Industries S.p.A. and its subsidiaries (the “Comer Group”), which comprise the consolidated statement of financial position as at December 31, 2022, and the consolidated comprehensive income statement, consolidated statement of changes in equity and consolidated cash flows statement for the year then ended, and notes to the consolidated financial statements, including a summary of significant accounting policies.
In our opinion, the accompanying consolidated financial statements give a true and fair view of the consolidated financial position of the Comer Group as at December 31, 2022, and of its consolidated financial performance and its consolidated cash flows fo r the year then ended in accordance with International Financial Reporting Standards as adopted by the European Union.
Basis for Opinion
We conducted our audit in accordance with International Standards on Auditing (ISA Italia) . Our responsibilities under those standards are further described in the Auditor’s Responsibilities for the Audit of the Consolidated Financial Statements section of our report. We are independent of Comer Industries S.p.A. in accordance with the ethical requirements applicable under Italian law to the audit of the financial statements. We believe that the audit evidence we have obtained is sufficient and appropriate to provide a basis for our opinion.
Responsibilities of the Directors and the Board of Statutory Auditors for the Consolidated Financial Statements
The Directors are responsible for the preparation of consolidated financial statements that give a true and fair view in accordance with International Financial Reporting Standards as adopted by the European Union, and, within the terms established by law, for such internal control as the Directors determine is necessary to enable the preparation of consolidated financial statements that are free from material misstatement, whether due to fraud or error.
Ancona Bari Bergamo Bologna Brescia Cagliari Firenze Genova Milano Napoli Padova Parma Roma Torino Treviso Udine Verona
Sede Legale: Via Tortona, 25 - 20144 Milano | Capitale Sociale: Euro 10.328.220,00 i.v.
Codice Fiscale/Registro delle Imprese di Milano Monza Brianza Lodi n. 03049560166 - R.E.A. n. MI-1720239 | Partita IVA: IT 03049560166
Il nome Deloitte si riferisce a una o più delle seguenti entità: Deloitte Touche Tohmatsu Limited, una società inglese a responsabilità limitata (“DTTL”), le member firm aderenti al suo network e le entità a esse correlate. DTTL e ciascuna delle sue member firm sono entità giuridicamente separate e indipendenti tra loro. DTTL (denominata anche “Deloitte Global”) non fornisce servizi ai clienti. Si invita a leggere l’informativa completa relativa alla descrizione della struttura legale di Deloitte Touche Tohmatsu Limited e delle sue member firm all’indirizzo www.deloitte.com/about.
© Deloitte & Touche S.p.A.
T To the Shareholders of Comer Industries S p A
118 Annual Report 2022
In preparing the consolidated financial statements, the Directors are responsible for assessing the Comer Group’s ability to continue as a going concern, disclosing, as applicable, matters related to going concern and using the going concern basis of accounting unless they have identified the existence of the conditions for the liquidation of the Company or the termination of the business or have no realistic alternatives to such choices
The Board of Statutory Auditors is responsible for overseeing, withi n the terms established by law, the Comer Group’s financial reporting process.
A Auditor’s Responsibilities for the Audit of the Consolidated Financial Statements
Our objectives are to obtain reasonable assurance about whether the consolidated financial st atements as a whole are free from material misstatement, whether due to fraud or error, and to issue an auditor’s report that includes our opinion. Reasonable assurance is a high level of assurance, but is not a guarantee that an audit conducted in accordance with International Standards on Auditing (ISA Italia) will always detect a material misstatement when it exists. Misstatements can arise from fraud or error and are considered material if, individually or in the aggregate, they could reasonably be expe cted to influence the economic decisions of users taken on the basis of these consolidated financial statements.
As part of an audit in accordance with International Standards on Auditing (ISA Italia) , we exercise professional judgment and maintain professional skepticism throughout the audit. We also:
• Identify and assess the risks of material misstatement of the consolidated financial statements, whether due to fraud or error, design and perform audit procedures responsive to those risks, and obtain audit evidence that is sufficient and appropriate to provide a basis for our opinion. The risk of not detecting a material misstatement resulting from fraud is higher than for one resulting from error, as fraud may involve collusion, forgery, intentional omiss ions, misrepresentations, or the override of internal control.
• Obtain an understanding of internal control relevant to the audit in order to design audit procedures that are appropriate in the circumstances, but not for the purpose of expressing an opinio n on the effectiveness of the Comer Group’s internal control.
• Evaluate the appropriateness of accounting policies used and the reasonableness of accounting estimates and related disclosures made by the Directors.
• Conclude on the appropriateness of management’s use of the going concern basis of accounting and, based on the audit evidence obtained, whether a material uncertainty exists related to events or conditions that may cast significant doubt on the Comer Group’s ability to co ntinue as a going concern. If we conclude that a material uncertainty exists, we are required to draw attention in our auditor’s report to the related disclosures in the consolidated financial statements or, if such disclosures are inadequate, to modify our opinion. Our conclusions are based on the audit evidence obtained up to the date of our auditor’s report. However, future events or conditions may cause the Comer Group to cease to continue as a going concern.
2
119 Comer Industries
• Evaluate the overall presentation, structure and content of the consolidated financial statements, including the disclosures, and whether the consolidated financial statements represent the underlying transactions and events in a manner that achieves fair presentation.
• Obtain sufficient appropriate audit evidence regarding the financial information of the entities or business activities within the Comer Group to express an opinion on the consolidated financial statements. We are responsible for the direction, supervision and p erformance of the group audit. We remain solely responsible for our audit opinion.
We communicated with those charged with governance regarding, among other matters, the planned scope and timing of the audit and significant audit findings, including any s ignificant deficiencies in internal control that we identify during our audit.
R REPORT ON OTHER LEGAL AND REGULATORY REQUIREMENTS
O Opinion pursuant to art 14 paragraph 2 (e) of Legislative Decree 39/10
The Directors of Comer Industries S.p.A. are respon sible for the preparation of the Directors’ Report of the Comer Group as at December 31, 2022, including its consistency with the related consolidated financial statements and its compliance with the law.
We have carried out the procedures set forth in the Auditing Standard (SA Italia) n. 720B in order to express an opinion on the consistency of the Directors’ Report , with the consolidated financial statements of the Comer Group as at December 31, 2022 and on its compliance with the law, as well as to make a statement about any material misstatement.
In our opinion, the above-mentioned Directors’ Report is consistent with the consolidated financial statements of the Comer Group as at December 31, 2022 and is prepared in accordance with the law.
With reference to the statement referred to in art. 14, paragraph 2 (e), of Legislative Decree 39/10, made on the basis of the knowledge and understanding of the Comer Group and of the related context acquired during the audit, we have nothing to report.
S Statement pursuant to art 4 of the Consob Regulation for the implementation of Legislative Decree December 30, 2016, no. 254
The Directors of Comer Industries S.p.A. are responsible for the preparation , on voluntary basis, of the non-financial statement pursuant to Legislative Decree December 30, 2016, no. 254.
We verified the approval by the Directors of the non -financial statement.
3
120 Annual Report 2022
Pursuant to art. 3, paragraph 10 of Legislative Decree December 30, 2016, no. 254, this statement is subject of a separate attestation issued by us
DELOITTE & TOUCHE S.p.A.
Signed by S Stefano Montanari Partner
Bologna, Italy
March 24, 2023
This report has been translated into the English language solely for the convenience of international readers. Accordingly, only the original text in Italian language is authoritative.
4
121 Comer Industries

