


Table of Figures


Table of Figures


The following individuals formed part of the project team, with various contributions to this project:
Team member Company
Steve Giudici Esk Spatial
Jeremy Wilson Esk Spatial
Luke Ellis Esk Spatial
Dannielle Denning Esk Spatial
Darren Schunke Esk Spatial
Role
Project Manager
Data sourcing, collation and analysis, model generation
Model development and automation
Data sourcing, collation and analysis, industry expertise
Data collation, mapping automation and analysis
Patrick Groenhout Greenwood Strategy Stakeholder Engagement
Jill Roscoe Greenwood Strategy Stakeholder Engagement
Penny Johnson NRM South Project Manager (to 21st March 2024)
Maudie Brown NRM South Project Manager (from 21st March 2024)
Rebecca Kelly isNRM
Biodiversity expert, NRM North representative
Ben Correy NRM Cradle Coast NRM Stakeholder
Additional contributors from the NRM regions include Iona Flett, Cindy Hull, Todd Nation, Jennifer Hemer, Nepelle Crane, Andrew Baldwin, Ben Slingsby, James Stronach and Spencer Gibbs.

The Emergency Preparedness – Statewide Analysis and Mapping (this report) forms part of the statewide NRM’ s “Biodiversity and Agricultural Natural Capital Preparedness and Emergency Response Plan.”
The statewide NRM report addresses a growing need to enhance our preparedness for natural disasters and their impact on biodiversity and agricultural natural capital assets. The Plan considers the most likely disaster scenarios for the State, which include emergency flood (including coastal inundation), fire, and biosecurity incursion scenarios.
Esk Spatial worked with the three NRM organisations and key stakeholders to identify and map the priority natural capital assets across the Tasmanian landscape (tenure blind) using existing data, and to analyse the vulnerability of these assets to extreme weather events to guide the development of the NRM Response Plan.
The key deliverable of this project is an ongoing spatial analysis resource that the NRM organisations can use in decision-making prior to, during, and after future emergency events.
A comprehensive risk assessment model was developed for each identified threat to biodiversity and agricultural natural capital assets, including Fire, Flood, Coastal Erosion, and Coastal Inundation. Each risk assessment model consists of three key components:
1. Threat Rating, defining the extent and/or severity of the threat, categorised by the likelihood or hazard,
2. Natural Capital Asset Priority Rating, assessing the priority of natural capital assets in terms of conservation value and vulnerability to the threat, and
3. Risk Assessment Rating, combining the Threat Rating and Natural Capital Asset Priority Rating to identify areas of highest risk and priority within natural capital assets.
The process involved developing a well-structured, semi-automated GIS model using standard ESRI software, allowing for easy adjustment and annual or on-demand updates to accommodate changing threat conditions. The model's resolution was determined to balance on-ground accuracy with efficient modelling processes, utilising a 100m x 100m grid cell representation.
Parameters and priorities agreed upon by NRM organisations and stakeholders were utilised, to develop natural capital asset priority ratings for each threat, facilitating direct integration into NRM emergency response plans. The methodology involved acquiring or developing threat models, converting descriptive ratings into numeric values, and multiplying threat and priority ratings to derive overall risk assessment values for each site.
These risk assessment values enable ranking of sites relative to others, aiding emergency planning and decision-making by highlighting areas with the highest potential impact from threats to natural capital assets.
Stakeholder interviews and sessions covered the areas of Natural Capital priority, themes of biodiversity preservation, coastal management, fire management, climate change, agricultural assets, and risk management in the context of critical assets Through these sessions, a framework of priority setting was developed, and confirmed through subsequent workshops and additional feedback. This framework informed the subsequent data analysis which was required to confirm the modelling outputs.
The output models are designed such that future iterations can include these values as further information on range and habitat becomes available.
Moving forward, future iterations of the modelling process must address several considerations, including rectifying previously unusable data sources, identifying additional data requirements to

enhance natural capital asset modelling accuracy, and pinpointing specific data enhancements needed for evaluating significant species. Establishing a practical timeframe for future updates is crucial for maintaining the ongoing relevance and effectiveness of the modelling efforts.
We recommend undertaking a partial reiteration of this project within a timeframe that addresses the primary issues related to fire modelling before the next fire season. Specifically, this would involve refining and improving species range boundaries, which would directly inform biodiversity risk assessment modelling for flood, coastal erosion, and coastal inundation. The urgency to enhance models for agricultural risk assessment may be less pressing, as many threat timeframes are contingent on sea level rise.
Once the major limitations of the modelling are addressed, a re-run every two to three years is likely sufficient to capture significant changes in priority natural capital assets and threat models. However, the models can be easily re-run at any time should there be any nationally significant changes that require attention.

The key components of this project included:
1. Preliminary Analysis:
a. A desktop review of available plans and projects relevant to the scope of the project.
b. Preliminary stakeholder engagement to gather insights and input, assist in the development of a robust priority setting framework.
2. Data collection and analysis:
a. Sourced available data layers pertaining to priority natural capital assets and information on vulnerability and susceptibility to extreme weather events.
b. Analysed the collected data to develop a risk assessment model for priority natural capital assets concerning emergency events.
3. Stakeholder engagement workshop:
a. Organised a stakeholder engagement workshop focused on Natural Capital Priority Ranking, facilitating discussions among key stakeholders
b. Gathered input from stakeholders to inform the prioritisation process and ensure alignment with NRM needs and objectives.
4. Creation of data layers and maps:
a. Utilised the analysed data to create data layers and maps that can be used by each NRM organisation involved in the project.
b. These data layers and maps serve as essential tools for NRM organisations to develop effective response plans and strategies tailored to their specific regions and priorities.
5. Final Report:
a. Compiled findings, insights, and recommendations into a final report (this document).

A desktop review was undertaken of NRM strategic plans and projects and other documentation relevant to the project, as well as similar projects undertaken by other organisations. This step ensured that all relevant priorities and data sets were identified and accounted for prior to commencing modelling work.
A two-phase consultation process was designed and implemented. It included consultation with key decision-makers within each of the NRMs, as well as other critical stakeholders that required direct engagement. The primary objective of the consultation process was to source information directly from key stakeholders which would assist in developing the priority setting framework, in order to:
• Fully understand perspectives on strategic priorities for modelling and protection,
• Ensure all relevant data was explored and accounted for, and
• Ensure relevant threats and assets are understood and accounted for in the plans.
The first phase of the preliminary stakeholder consultation was a series of semi-formal one-on-one interviews (30-45 minutes in duration) with targeted external stakeholders across the state. Due to timing issues and Departmental preference, a workshop was held with specifically identified Department of Natural Resources and Environment (NRE) stakeholders in lieu of individual interviews.
The second phase of stakeholder consultation was an online workshop with key NRM staff, as discussed in section 2.5
2.2.1 Stakeholder interviews
2.2.1.1 Identification of stakeholders
A total of 29 key decision-makers within the Natural Resources field were invited by email to participate in the interview process. Of these, 18 stakeholders responded, and 7 stakeholders were interviewed. The identified stakeholders comprised a mix of natural resources experts as summarised in Table 1.
Table 1 – Identified Stakeholders
Departmental preference for engaging NRE stakeholders in a group setting instead of individual interviews was addressed through an additional workshop. This resulted in formal consultation with a further six stakeholders bringing the total stakeholders consulted to 13. These figures exclude representatives from NRM organisations that took part in the preliminary consultation.

2.2.1.2 Interview questions
Targeted and semi-formal one-on-one stakeholder interviews were undertaken with key stakeholders. The interviews followed the structure and format presented in Appendix 1. Interviews were undertaken by video-conferencing technology.
The interviews included qualitative questions using a conversational approach to assess direct views on priority assets and explore any additional sources of data that would be of value to the project's modelling.
The group workshop setting for identified NRE stakeholders followed a similar approach to that of the interviews, albeit with the addition of draft outputs presented for more tailored feedback.
Preliminary consultation was undertaken by Greenwood Strategy between 29 February and 21 March 2024.
2.2.1.3
Stakeholders acknowledged the significance of factors such as biodiversity preservation, coastal management, fire risk mitigation, climate change adaptation, and agricultural resilience. Several discussions concerning natural capital priorities were either very broad in scope or focused on specific locations or issues, occasionally delving into levels of detail that exceeded the project's scope. The insights gathered provided a foundation for further data analysis and refinement of natural capital priorities which were tested at the two workshops.
Below is an excerpt of some key outcomes and feedback from interviews:
2.2.1.4 Biodiversity Preservation
• Protecting critically endangered species and ecosystems from fire is imperative.
• Specific flora and fauna species were identified as priority species.
• Protecting geodiversity values and native species is of high importance.
• The estuary and wetlands are crucial biodiversity assets.
2.2.1.5 Coastal Management
• Preserving natural function and form of coastal environments is vital, considering increasing pressure and vulnerability.
• Coastal environments, due to their fragility, are seen as a higher priority than flooding in terms of potential impact and loss.
• Encroachment of the sea onto land areas threatens habitats.
• Coastal inundation poses a significant threat, especially at the lower end of the estuary.
2.2.1.6 Fire Management
• Critically endangered species and ecosystems must be safeguarded against bushfires.
• Minimising the impacts of fire preparation activities is essential.
• Understanding species' adaptability to fire and implementing measures to protect vulnerable species and ecosystems, especially in alpine zones, is crucial.
2.2.1.7 Climate Change
• Climate change is the biggest driver of natural capital risks, altering the frequency and intensity of events.

• It affects all threats differently, exacerbating challenges for biodiversity preservation, coastal management, and agricultural productivity.
• Rapid environmental changes pose challenges for adaptation, particularly for biodiversity with limited time to adjust.
2.2.1.8 Agricultural Assets
• Carbon, soil, and grass quality are fundamental assets for agriculture. Soil loss or degradation is a key threat.
• Both fire and flood will have a significant impact on the agriculture sector.
• Salinity incursion and coastal inundation threaten agricultural productivity.
• Flood risk management is essential for protecting fertile floodplain environments.
2.2.1.9 Risk Management
• Proactive measures such as relocating vulnerable assets out of flood zones are crucial for agricultural resilience.
• Preventing landslides through effective water management and vegetation preservation is vital, especially in mountainous regions.
Stakeholders also noted that the development of the Emergency Preparedness Plan should prioritise the protection of critical assets while considering the evolving challenges posed by climate change and human activities.
Based on the desktop review and initial stakeholder engagement, a preliminary priority setting framework was developed. This framework was tested during the NRM and NRE stakeholder engagement workshops. Participants provided feedback and the approach to ranking of natural capital assets was confirmed. This framework informed the subsequent data analysis which was required to confirm outputs for section 3
2.4
Available data was sourced for natural capital assets using a similar approach in developing the data layers and maps used to inform the development of the NRM Strategy 2030 in 2021. This included collating statewide data from various sources, including but not limited to:
1. The Tasmanian Government Land Information System (theLIST),
2. Australian Government open data portal, 3. Geoscience Australia and any other relevant portals.
This data was filtered based on the priorities agreed with the NRM organisations. A series of data layers has been created for each of the natural capital asset groups. For example:
1. Threatened and important species,
2. Threatened and important ecological communities,
3. Important biodiversity areas, soils, and vegetation. These layers have then been used to create mapping outputs
In parallel with construction of the risk assessment model, a workshop was conducted involving key representatives across the three NRM organisations. The primary objective of the workshop was to

obtain preliminary feedback on draft outputs and validate the ranking of each natural capital asset against the proposed Natural Capital Priority Ranking values used in the modelling to ensure that they reflect the priorities of the NRMs at a regional level, and wider state and national conservation priorities
An explanation of the method used to prioritise risks and vulnerabilities was discussed, as were the criteria and factors considered in prioritising NRM emergencies. Participants were provided the opportunity to discuss specific feedback on areas of interest or concern relating to the preliminary outputs
The engagement of NRE stakeholders was pivotal in ensuring comprehensive input for the project. Recognising the Department’s preference for NRE stakeholders to be consulted collectively, a workshop was convened specifically. See Appendix 3 for a full list of stakeholders who participated in this project. Subsequently, a workshop dedicated to NRM stakeholders was also conducted. Both events served as important platforms for updating key stakeholders on project progress and soliciting further input to enhance the identification and mapping of priority natural capital assets.
During these workshops, stakeholders were presented with an overview of the project’s methodology, including the process for accessing relevant data sources and the types of data utilised in the development of the risk assessment model.
Stakeholders engaged in discussions regarding the vulnerability assessment of biodiversity assets and agricultural natural capital assets to various emergency scenarios. Drawing on existing information holdings, stakeholders contributed valuable insights to enhance the accuracy and comprehensiveness of the vulnerability analysis.
The workshop emphasised the importance of providing an ongoing resource for NRM organisations to support decision making in emergency preparedness and response.
Moving forward, continued collaboration and engagement with stakeholders will be essential to ensure the effectiveness and relevance of the NRM Biodiversity and Agricultural Natural Capital Emergency Preparedness and Response Plan.

A risk assessment model was developed for each threat identified in this scope (Fire, Flood, Coastal Erosion, Coastal Inundation) both for biodiversity and agricultural natural capital assets where relevant The three major components of each risk assessment model are:
1. Threat Rating (input): describes the extent and likelihood/severity of the threat.
2. Natural Capital Asset Priority Rating (input): describes the extent of the natural capital assets, which are then rated against all other assets in terms of priority for conservation value and/or the asset’s vulnerability to the threat
3. Risk Assessment Rating (output): describes the combination of the two above rating models which can be used to identify areas at highest risk to the threat
The underlying process to update and combine all the input layers was designed and built around a well-structured and semi-automated GIS model using standard ESRI software. The benefit of this approach is that all, or individual inputs to the models can be easily adjusted and the whole model rerun either annually or on-demand to feed into ongoing emergency plan revisions. This means that plans can be kept current and therefore effective, as threat conditions change. Although out of the scope of this project, marine assets and vulnerabilities to heat waves, biosecurity, on-farm drought risk and so on, could also be added via additional inputs as required.
The resolution of the model was determined to ensure it best met the needs of emergency response and decision-making purposes. Similar risk assessment models within Tasmania use a 100m x 100m grid cell to represent mapped features and this has proven to be a good compromise between on-ground accuracy and efficient modelling processes.
Esk has used the parameters and priorities agreed on by the NRM organisations and external stakeholders to develop for each threat the natural capital asset priority ratings described below such that modelled outputs can directly feed into the framework of each of the three NRM emergency response plans.
A risk assessment model has been developed for each threat using the following methodology:
1. A model for the threat was acquired or developed to describe for any given site across the state, the likelihood or hazard associated with that threat rated from highest to lowest likelihood/severity
2. The descriptive likelihood/severity ratings for each site were converted into a numeric risk value to allow for mathematic calculation. For example:
a. Low Threat Rating assigned a Threat Value of 1,
b. Moderate Threat Rating assigned a Threat Value of 2,
c. High Threat Rating assigned a Threat Value of 3
1. A model to represent the location of each natural capital asset was developed and assigned a priority to rate vulnerability to each threat.

2. The descriptive priority rating for each natural capital asset was converted into a numeric priority value to allow for mathematic calculation. For example:
a. Low Priority Rating assigned a Priority Value of 1,
b. Moderate Priority Rating assigned a Priority Value of 2,
c. High Priority Rating assigned a Priority Value of 3
2. For each site (100m x 100m grid cell) the maximum priority value of all the natural capital assets present on that site was chosen to represent the final natural capital priority value for that site. For example, if three different species or vegetation communities were present within the 100m x 100m grid cell, then the species or vegetation community with the highest priority rating would be used to set the overall priority value for that grid cell.
1. The risk assessment model was developed by way of multiplication of the two input ratings for each site across the state:
Risk Assessment Value = Threat Value x Maximum Natural Capital Priority Value
2. The resultant Risk Assessment Value calculated for each site across the state describes its overall rank relative to all other sites for the given threat. For example:
a. Any site with the highest risk assessment value (i.e. 3 x 3 = 9), has the highest ranking for emergency planning and decision making, as these sites have at least one natural capital asset of highest priority rating which may experience a threat event of the highest threat rating
b. Any site with a risk assessment value (i.e. 1 x 1 = 1) has the lowest ranking.
Table 2 – Example Risk Rating Calculation Matrix – Threat Rating x Natural Capital Asset Priority Rating
The following sections describe in more detail how each of the input components were developed, including source datasets

The Fire Threat Rating model for 2024 was sourced from the Tasmanian Parks and Wildlife Service (TPWS). TPWS express the threat of a bushfire in terms of five ‘likelihood’ ratings:
• Rare,
• Unlikely,
• Possible,
• Likely,
• Almost Certain.
This model is developed from a large and varied range of external sources and internal fire weather and vegetation fire behaviour models and accounts for:
• Ignition Potential:
• Lightning Strike Probability,
• Historic Fire Start Points
• Suppression Capability:
• Likelihood of Detection,
• Proximity to brigade/air resource.
• Head Fire Intensity:
• Vegetation Type (defines Rate of Spread based on vegetation specific fire behaviour models),
• Slope,
• Fuel Load (fire age versus fuel accumulation by vegetation type),
• 95% Percentile Historic Weather
No further work was required on this model, as it had already been assigned threat values which were used directly in the risk assessment modelling undertaken
The Flood Threat Rating model was developed from three sources:
1. Statewide 1% AEP Climate Change Peak Flood Extent:
The State Emergency Service (SES), Department of Police, Fire and Emergency Management (DPFEM) has developed a range of flood hazard models covering a range of annual exceedance probability (AEP) scenarios and for current and 2100 modelled climate change weather scenarios. The flood model chosen for this project used the 2100 climate weather scenario and a 1% AEP. This model was chosen as it models the worst-case scenario in terms of extent affected by flooding.
2. Flood Extent June 2016:
The extent of the 2016 Floods around Evandale were mapped in Augst 2016 by the vas part of the Flood Recovery Program. Where this 2016 flood mapping extended beyond the modelled statewide flooding extent above, these areas were included in the model.
3. LIST Hydrographic Area – Flood Plain
Where the Flood Plains mapped within the LIST Hydrographic Area layer extended outside the above two layers, these areas were included in the model.
All areas covered by the features described above were assigned a nominal threat rating of ‘high’, but essentially the extent was used to represent that the areas that would be affected by water in the event

of a flood (i.e. presence versus absence of excess water). This was a simplistic approach and could possibly have been further developed with the depth models also created by SES had time permitted
The Coastal Erosion Threat Rating model was developed using the ‘Coastal Erosion Hazard Bands 20161201’ dataset as developed by DPAC. The following extract from their technical report1 describes the hazard bands used to assign Threat Ratings to the model:
The four coastal erosion hazard bands are:
• Acceptable: the area is unaffected by coastal recession until after 2100, and not subject to controls,
• Low: the area vulnerable to coastal recession by 2100 or is protected by coastal defences,
• Medium: the area vulnerable to coastal recession to 2050,
• High: the area vulnerable to hazardous erosion now, and typically found on sand dunes; for the purpose of SCP, this is considered the area that is a potentially actively mobile landform,
• Coastal Erosion ‘Investigation’ area: an area adjacent to the coastline for which there is insufficient information to classify it into Acceptable, Low, Medium, or High hazard bands. The width of the area is the cumulative width of the Low, Medium, and High hazard bands.
For the purposes of risk modelling, the hazard bands described above were assigned the following Threat Ratings:
Table 3 – Assignment of Coastal Erosion Threat Ratings and Values as derived from Coastal Erosion Hazard Bands (DPAC)
Erosion investigation Area Investigation
0 - these areas were included in the final model to identify areas that may yet be at threat but had no final risk rating assigned
The Coastal Erosion Threat Rating model was developed using the ‘Coastal Erosion Hazard Bands 20161201’ dataset as developed by DPAC. The following extract from their technical report2 describes the hazard bands used to assign Threat Ratings to the model:
The coastal inundation hazard bands are defined as follows:
• Low: areas vulnerable to a 1% AEP storm event in 2100; these areas have a medium-term flooding issue,
• Medium: areas vulnerable to a 1% AEP storm event in 2050; the medium band also contains all of the land that will be impacted by a 0.8 m SLR by 2100,
1 Page 5 of Summary Report of Coastal Hazards, Coastal Hazards in Tasmania, Department of Premier and Cabinet, 1st December 2016
2 Page 7 of Summary Report of Coastal Hazards, Coastal Hazards in Tasmania, Department of Premier and Cabinet, 1st December 2016

• High: areas that will be within a 0.2 m SLR from the mean high tide line by 2050; these areas are currently impacted by the Highest Astronomical Tide,
• Coastal Investigation: areas that are not covered by LiDAR and are below the 10 m contour and within the coastal zone.
Table 4 – Assignment of Coastal Inundation Threat Ratings and Values as derived from Coastal Inundation Hazard Bands (DPAC)
Coastal Investigation Investigation
0 - these areas were included in the final model to identify areas that may yet be at threat but had no final risk rating assigned
The range or location of each identified biodiversity natural capital asset was derived from a range of sources, including:
• Tasmanian Natural Values Atlas – Observation Records (29/02/2024),
• TASVEG 4.0 - The Digital Vegetation Map of Tasmania,
• Forest Practices Authority (FPA) Range Boundary Mapping 2012,
• Species of National Environmental Significance 1km Grids February 2024 (DCCEEW),
• Ecological Communities of National Environmental Significance (ECNES) Database
These were reviewed and where the datasets defining the range/habitat were too coarse (1km grids, or sporadic historic observation records), an effort was made to derive a more accurate location from other available sources. This was particularly the case for several priority fauna species, so where possible, the habitat description in the conservation or listing advice was interpreted such that vegetation communities within the TASVEG 4.0 dataset could be extracted to represent the habitat of the fauna required. In the case of bird species, this equated to nesting and foraging habitat.
Once the geographic extent of each biodiversity natural capital asset was defined, a default priority rating value was assigned to each based on the following rules:
• Only biodiversity natural capital assets which are vulnerable to the threat were prioritisednatural capital assets which are not vulnerable to the threat were assign a priority ranking of zero for that threat.
• The conservation or threatened species listing advice was reviewed and those reported as more vulnerable/susceptible to the threat were assigned a higher priority for that threat.
• The geographic distribution of the natural capital asset was assessed and those species, vegetation communities or sites with a wider distribution were generally assigned a lower priority to those with a narrow distribution, over-riding the priorities assigned based on the conservation/listing advice. The reasoning being that widely distributed populations or habitats would generally be at less risk of extinction or significant loss to a single emergency event likely to happen within a year, than those natural capital assets only found in very concentrated locations.
Appendix 4 provides an overview of the final geographic extent developed for each biodiversity natural capital asset and the default priority rating assigned for each threat, as used in the modelling.

Appendix 5 describes the source data and methodology used to define the geographic extent for each biodiversity natural capital asset.
For the threat of fire only, an additional set of analyses was undertaken to further enhance the priority rating process. Given many species, vegetation communities or sites had very large geographic extents defined in the model, to fine tune areas more vulnerable to fire within those areas, the ‘Tolerable Fire Intervals (TFI) for TASVEG Communities3’ as developed by the NRET Conservation Science Section, were applied. By applying this fine tuning, the priority assigned to these widely dispersed assets could be downplayed in areas where the impact of fire was likely to be less significant, such that the priority for more narrowly dispersed assets would not be masked in the final risk assessment model where they overlapped
The TFI concept was developed to assist natural resource managers with planning the timing of prescribed burning programs to balance the need to reduce bushfire hazard against maintenance of functional ecosystems. In terms of the biodiversity natural capital assets in this project, the Tolerance Fire Interval:
• Is a measure that is directly applicable to the flora and vegetation community assets,
• Serves as a surrogate for fauna assets by maintaining direct habitat,
• Serves as a surrogate for aquatic fauna asset conservation by maintaining surrounding habitat, preserving water quality, etc
TFI’s provide an upper and lower range of age between fire events within which the frequency of fire is more likely to be acceptable to maintain a vegetation community’s identity and function. Too frequent a fire regime will likely impede the ability for plants to recover from fire such that they will persist when subject to a subsequent fire (represented by the ‘Minimum TFI’ value). Conversely, too infrequent a fire regime may affect species that require disturbance for regeneration, which in turn is often linked to inter-species competition and vegetation successional processes (represented by the ‘Maximum TFI’ value) A further separation of the Minimum TFI into the frequency of low and high severity fires was also made, and for this exercise, the ‘Minimum TFI (high severity fire)’ value was chosen to represent the likely impact of a bushfire. Bushfires are not always high severity fires, but this option was chosen to represent the ‘worst-case’ scenario.
Using the December 2023 Fire History dataset as sourced from LIST, which records fire extents back to 1920, the age since the last fire event was calculated for each location across the state and was overlaid with the Tolerance Fire Intervals as applied to TASVEG 4 communities to highlight areas that would be inside or outside their minimum tolerance fire interval if a fire occurred in 2024. If a portion of the biodiversity natural capital asset overlapped TASVEG communities in which a 2024 fire would be outside the minimum TFI, that portion was assigned a higher priority rating than the remainder of the asset. This process only focused on calculating the age since fire based on the previous fire event, it did not attempt to model areas which might have had two or more prior fires recorded. A multiple fire age history model could be developed further to highlight areas which might be at higher risk again if a subsequent fire occurred
In modelling terms, if the 'Age Since Fire' value was less than the 'Minimum TFI (high severity fire)' value for a location, then the priority assigned to the biodiversity natural capital asset was elevated for that location in which the historic fire occurred (refer areas in red in Figure 1).
3 https://nre.tas.gov.au/Documents/Tolerable%20Fire%20Intervals%20for%20TASVEG%20communities%20.pdf

Figure 1 – Fire Age Model as applied to indicate vegetation communities that would fall outside their minimum Tolerance Fire Interval (high severity fire) if a fire occurred in 2024


The extent of the agricultural landscape was defined using the Tasmanian Land Use (2021) dataset, and the following land classes were included:
• 2. Production from Relatively Natural Environments but excluding:
• 2.2.0 Production native forests
• 3. Production from Dryland Agriculture and Plantations but excluding:
• 3.1.0 Plantation forests,
• 3.1.1 Hardwood plantation forestry,
• 3.1.2 Softwood plantation forestry
• 4. Production from Irrigated Agriculture and Plantations but excluding
• 4.1.0 Irrigated plantation forests
Within this agricultural landscape the soils and the remnant native vegetation were considered to be key natural capital assets to be at risk from the threats modelled in this planning process. The priority rating for the soils and remnant native vegetation was applied as described in the next two sections.
For the threats of flood, coastal erosion and coastal inundation, the potential for water erosion was considered a significant risk to soils
For coastal inundation, and possibly coastal erosion, the introduction of saline water into the agricultural setting would be an additional risk to soil productivity It was assumed that loss of productivity due to salinity would have the same risk rating for all sites susceptible to coastal inundation or coastal erosion, so no priority rating was modified to account for increased salinity
Stakeholders reported that the influx of debris from floods was another possible source of threat to agricultural land, especially where that debris was significant in volume. Again, for the threat of flooding, the likelihood of debris being deposited was assumed to be equal across all sites affected by flood, so no specific priority rating was developed to account for debris. This is unlikely to be the case as the velocity and volume of water present at various stages of the flood’s flow, and interaction with fixed objects like trees, fences and vegetation, would likely define where debris would be deposited, but such modelling was beyond the scope of this project.
Based on these assumptions, the vulnerability of the agricultural natural capital assets was prioritised based solely on the vulnerable soils water erosion hazard ratings as developed in 2018 by NRE4 . The water erosion mapping shows areas where a water erosion hazard might exist if sufficient groundcover is not maintained, which could lead to soil resource degradation through soil, organic matter and nutrient loss, resulting in sedimentation and contamination of drainage lines and waterways after significant rainfall and runoff events. The hazard ratings for water erosion were developed from a combination of Digital Soil Mapping (DSM) inputs of the soil properties Coarse Fragments, Sand %, Silt %, Clay %, Organic Carbon %, Soil Permeability, and Soil Structure, with Slope and Slope-Length (from the SRTM Digital Elevation Model)5
4 Refer page 12 of Managing Vulnerable Soils under Irrigation in Tasmania (https://nrmdatalibrary.dpipwe.tas.gov.au/FactSheets/WfW/ListMapUserNotes/Vulnerable_soils.pdf)
5 Refer LIST Metadata record for Vulnerable Soils: Hillslope Water Erosion Hazard: https://www.thelist.tas.gov.au/app/content/data/geo-meta-data-record

For this modelling exercise is it was assumed that the presence of natural vegetation was likely to signify areas of lower erosion potential, and as such vegetated areas were assigned the lowest priority ranking for the threats of flood, coastal erosion, and coastal inundation.
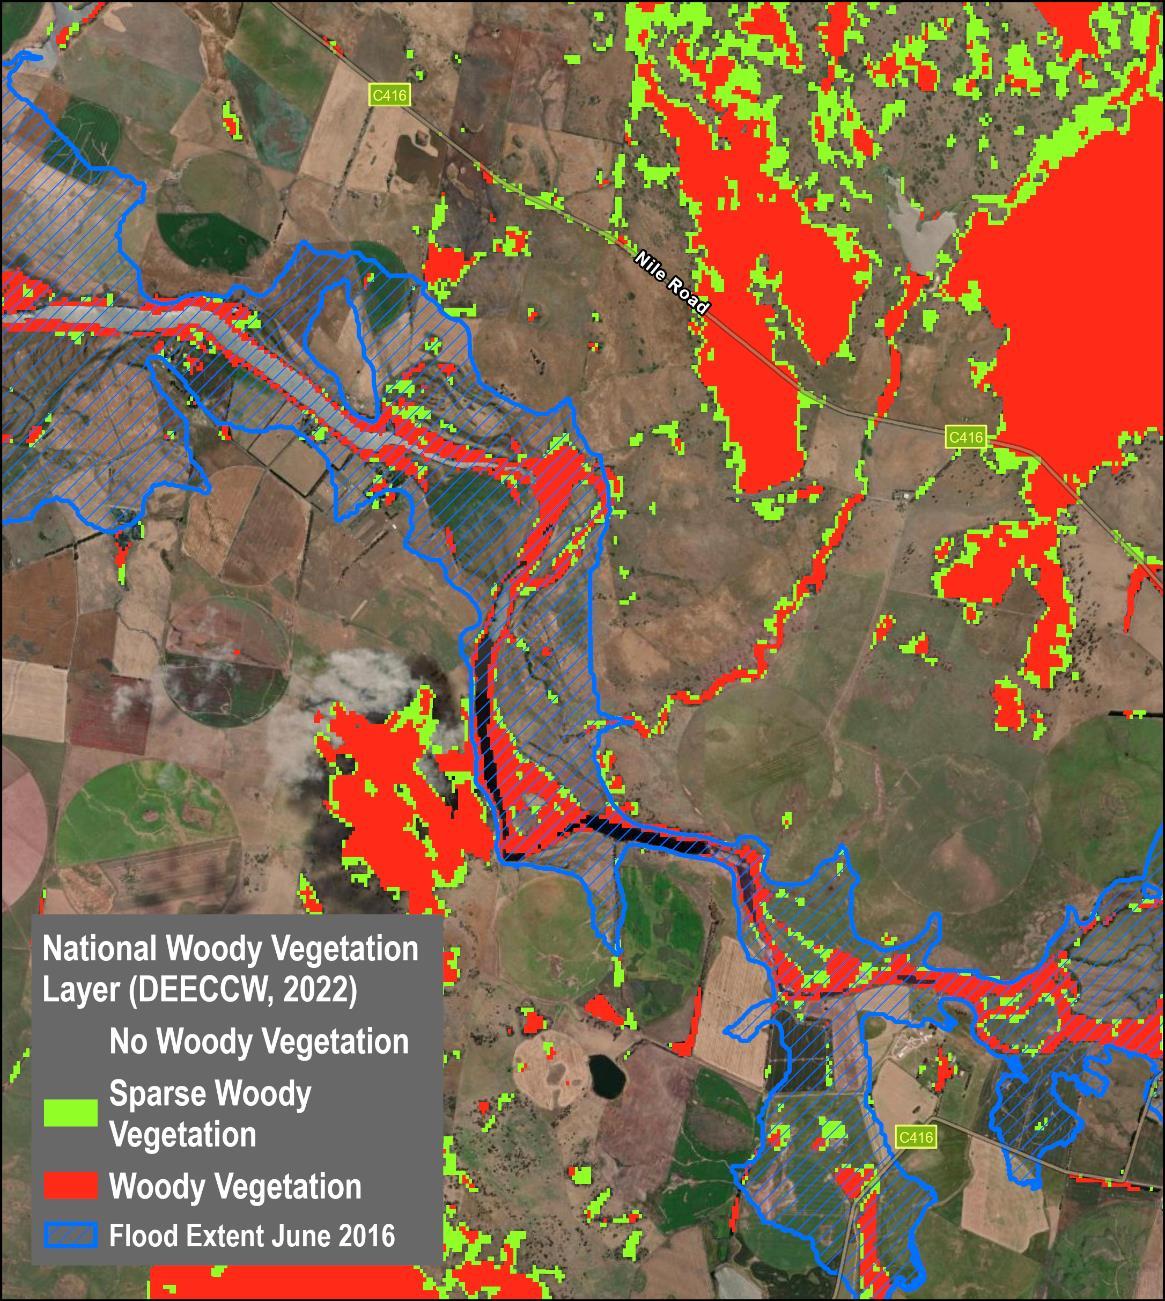
The presence of forest, woodland or native vegetation was modelled using a combination of the National Forest and Sparse Woody Vegetation Data (Version 7.0 - 2022 Release, DCCEEW) and TASVEG 4.0 (NRET). Where forest woodland or native vegetation was identified on a site from these two datasets, this overrode the priority rating previously assigned based on vulnerability to water erosion hazard. The national woody vegetation layer was incorporated into the modelling as it has a finer resolution (25m cells) and is likely to be more current across the whole state than TASVEG 4 given it was mapped from recent imagery, so is more likely to identify linear strips of forest and vegetation along riverbanks, that help mitigate erosion (refer Figure 2). The effect of salinity from coastal inundation on the forest, woodland and native vegetation were not considered in this modelling exercise.


It was considered that applying the fire risk models used for the threat of bushfire to biodiversity assets would not be appropriate for agricultural assets in terms of impact on soils As such, bushfire was not modelled for soil-based agricultural natural capital assets as part of this project.
However, where bushfires do start on, or escape onto, agricultural land, the main risk to soils would be subsequent risk of erosion due to wind, water or steep slope and the layers for these potential hazards are provided for reference. It would be recommended that more work be put into modelling the threat of bushfire to the agricultural natural capital assets in future iterations of this modelling based on these erosion hazard ratings. The layers developed by NRET to describe soils vulnerable to wind erosion, hillslope erosion and water erosion have been packaged with the model outputs to assist with emergency response planning, should they need to be consulted when assessing the possible impacts of fire on soils
Table 5 – Assignment of Agricultural Natural Capital Priority Ratings and Values as derived from Water Erosion Hazard Bands (NRET) and presence/absence of vegetation
bands where forest, woodland or native vegetation
‘Very Low’ Band where no forest, woodland or native vegetation is present
‘Low’ Band where no forest, woodland or native vegetation is present
‘Moderate’ Band where no forest, woodland or native vegetation is present
‘High’ Band where no forest, woodland or native vegetation is present
‘Very High’ Band where no forest, woodland or native vegetation is present
For the threats of flood, coastal erosion and coastal inundation, it was considered that the main threat to remnant native vegetation would be the physical interaction of excess flowing running through the vegetation or eroding the underlying soil structure. In the case of the coastal threats, introduction of saline water may also likely have an impact on some vegetation types.
Using the vegetation data modelled in the Agricultural Soils Priority Model as described in section 3.7.1 above, all remnant native vegetation within the Agricultural landscape was assigned a priority rating of High. Inclusion of woody vegetation mapped from the National Woody and Sparse Vegetation Layer (2022) in the model captured riparian vegetation in the modelling to a reasonable level of spatial accuracy.
Current known invasive species are typically widespread within Tasmania, and the distribution mapping available to this project was generally limited to point-based observation records, rather than actual or modelled range boundaries It was considered that use of observation data in this format could produce potentially misleading results if applied to the risk assessment modelling framework for this project Although the mapping might indicate a species has not been observed in a location, it can’t be relied upon to define absence, as the lack of observation records are limited by human access. For example, the locations of observation records frequently follow roads, or walking trails, so don’t cover large areas

where access is scarce. Further work to interpret the observation mapping into likely ranges would improve the utility of these datasets for risk modelling
Stakeholder feedback did underscore the importance of considering the presence or absence of pests, weeds, and pathogens in assessing the ecosystem's ability to recover from emergency events. Although the observation records might not be suitable for confirming absence of an invasive species, they certainly can be used to indicate known presence in, or proximity to, natural capital assets Used with this awareness of their limitations, these datasets can still be important supplemental information for emergency response planning with respect to risks to recovery from other threats As such, all available information on known invasive species was included with the packaged model outputs.
Although no risk assessment model was prepared for the threat of biosecurity, each of the biodiversity natural capital assets6 was assigned a vulnerability rating to the main classes of biosecurity threats, as describe below:
• Terrestrial Predator Vulnerability (i.e. cats, rats, etc),
• Aquatic Predator Vulnerability,
• Marine Predator Vulnerability,
• Habitat Disturbance Vulnerability (i.e. deer, pigs, etc),
• Predatory Wasp Vulnerability,
• Phytophthora Vulnerability,
• Myrtle Rust Vulnerability,
• Weed Vulnerability,
• Pathogen Vulnerability
Using these ratings, biodiversity natural capital assets vulnerable to each biosecurity threat type can be filtered out and viewed in GIS software as needed and compared against known locations of the biosecurity threats
Risk assessment modelling could be applied to future threats as they become apparent, assuming that areas at risk from the threat can be defined accurately. However, the current Tasmanian biosecurity alerts, including the Small Hive Beetle, Varroa Bee, and Queensland Fruit Fly7, do not appear directly relevant as threats to the natural capital assets defined in this project, so were not modelled
It should be noted that the 'Phytophthora_susceptibility_veg_no_pc_records_region' GIS Layer packaged with this report describes area likely susceptible to Phytophthora but which have no current observation records within them. In terms of risk from Phytophthora. This dataset offers a potential source for future risk assessment modelling and highlights areas meriting attention in the current emergency response planning.
6 Refer the ‘NRM_Biodiversity_Natural_Capital_Asset_Priority’ GIS layer provided in the GIS Products package
7 https://nre.tas.gov.au/biosecurity-tasmania/current-biosecurity-alerts

The key deliverable of the project is to provide an ongoing resource that the NRM organisations can use in decision-making prior to, during, and after future emergency events. The key project outputs as part of this project include:
1. Data package including all base layers used provided for use in Desktop and web feature services,
2. Biodiversity and Agricultural Natural Capital Risk Assessment Models, one for each threat,
3. A series of heat mapping PDF Maps generated from Risk Assessment Model for each threat.
All GIS the main components of the models developed in this project are provided in a set of ESRI File Geodatabases projected in UTM Zone 55 (GDA 1994 Datum), as described in Table 6 below.
Table 6 – Description of GIS layers packaged for this project File
Biosecurity_Model.gdb Cat
Biosecurity_Model.gdb Chytrid_Fungus
Biosecurity_Model.gdb Deer
Biosecurity_Model.gdb European_Green_Crab
Biosecurity_Model.gdb European_Wasp
Biosecurity_Model.gdb Phytophthora
Biosecurity_Model.gdb Phytophthora_Isolation_records
Biosecurity_Model.gdb Phytophthora_Symptoms
Biosecurity_Model.gdb PhytophthoraPoly
Biosecurity_Model.gdb Phytophthora_susceptibility_veg_no_pc _records_region
Biosecurity_Model.gdb Weeds_Declared
Biosecurity_Model.gdb Weeds_DeclaredPoly
Biosecurity_Model.gdb Weeds_Priority
Biosecurity_Model.gdb Weeds_PriorityPoly
Coastal_Erosion_Risk_Model.gdb
Coastal_Erosion_Risk_Model.gdb
Agricultural_Soils_Coastal_Erosion_Prior ity_Rating
Agricultural_Soils_Coastal_Erosion_Risk _Assessment_Model
Sightings of Felis catus
Observation records where Batrachochytrium dendrobatidis is present.
Sightings of Dama dama
Sightings of Carcinus maenas
Sightings of Vespula germanica
Observation records from NVA where Phytophthora cinnamomic is present.
Observations records Phytophthora cinnamomic is present.
Observations where P Phytophthora cinnamomic symptoms are present.
Mapped area where Phytophthora cinnamomic symptoms are present
TASVEG Communities identified as susceptible to Phytophthora but which have no current recorded observations of Phytophthora presence
Observations where declared weeds are present.
Mapped areas where declared weeds are present.
Observations where priority weeds are present
Mapped areas where priority weeds are present.
Model of the priority ratings applied to agricultural soils in terms of vulnerability to the threat of coastal erosion
Final risk assessment model for the threat of coastal erosion on agricultural soils
Coastal_Erosion_Risk_Model.gdb
Coastal_Erosion_Risk_Model.gdb
Coastal_Erosion_Risk_Model.gdb
Coastal_Erosion_Risk_Model.gdb
Coastal_Erosion_Risk_Model.gdb
Agricultural_Vegetation_Coastal_Erosio n_Priority_Rating
Agricultural_Vegetation_Coastal_Erosio n_Risk_Assessment_Model
Biodiversity_Coastal_Erosion_Priority_R ating
Biodiversity_Coastal_Erosion_Priority_R ating_Detail
Biodiversity_Coastal_Erosion_Risk_Asse ssment_Model
Coastal_Erosion_Risk_Model.gdb Coastal_Erosion_Hazard_Rating
Coastal_Inundation_Risk_Model.gdb Agricultural_Soils Coastal_Inundation_P riority_Rating
Coastal_Inundation_Risk_Model.gdb
Coastal_Inundation_Risk_Model.gdb
Coastal_Inundation_Risk_Model.gdb
Coastal_Inundation_Risk_Model.gdb
Coastal_Inundation_Risk_Model.gdb
Coastal_Inundation_Risk_Model.gdb
Agricultural_Soils_Coastal_Inundation_R isk_Assessment_Model
Agricultural_Vegetation_Coastal_Inunda tion_Priority_Rating
Agricultural_Vegetation_Coastal_Inunda tion_Risk_Assessment_Model
Biodiversity_Coastal_Inundation_Priorit y_Rating
Biodiversity_Coastal_Inundation_Priorit y_Rating_Detail
Biodiversity_Coastal_Inundation_Risk_A ssessment_Model
Coastal_Inundation_Risk_Model.gdb Coastal_Inundation_Hazard_Rating
Fire_Risk_Model.gdb
Fire_Risk_Model.gdb
Biodiversity_Fire_Priority_Rating
Biodiversity_Fire_Priority_Rating_Detail

Model of the priority ratings applied to agricultural remnant native vegetation in terms of vulnerability to the threat of coastal erosion
Final risk assessment model for the threat of coastal erosion on agricultural remnant native vegetation
Merged model of the priority ratings applied to biodiversity natural capital assets in terms of vulnerability to the threat of coastal erosion
Detailed model of the priority ratings applied to each biodiversity natural capital assets in terms of vulnerability to the threat of coastal erosion
Final risk assessment model for the threat of coastal erosion on biodiversity natural capital assets
Model of the coastal erosion threat ratings applied to the natural capital assets
Model of the priority ratings applied to agricultural soils in terms of vulnerability to the threat of coastal inundation
Final risk assessment model for the threat of coastal inundation on agricultural soils
Model of the priority ratings applied to agricultural remnant native vegetation in terms of vulnerability to the threat of coastal inundation
Final risk assessment model for the threat of coastal inundation on agricultural remnant native vegetation
Merged model of the priority ratings applied to biodiversity natural capital assets in terms of vulnerability to the threat of coastal inundation
Detailed model of the priority ratings applied to each biodiversity natural capital assets in terms of vulnerability to the threat of coastal inundation
Final risk assessment model for the threat of coastal inundation on biodiversity natural capital assets
Model of the coastal inundation threat ratings applied to the natural capital assets
Merged model of the priority ratings applied to biodiversity natural capital assets in terms of vulnerability to the threat of fire
Detailed model of the priority ratings applied to each biodiversity natural capital assets in terms of vulnerability to the threat of fire
Fire_Risk_Model.gdb
Fire_Risk_Model.gdb
Fire_Risk_Model.gdb
Flood_Risk_Model.gdb
Flood_Risk_Model.gdb
Flood_Risk_Model.gdb
Flood_Risk_Model.gdb
Flood_Risk_Model.gdb
Flood_Risk_Model.gdb
Flood_Risk_Model.gdb
Flood_Risk_Model.gdb
NRM_Assets.gdb
NRM_Assets.gdb
NRM_Assets.gdb
Vulnerable_Soils.gdb
Biodiversity_Fire_Risk_Assessment_Mo del
Fire_Likelihood_Rating
TASVEG4_FireAge_ToleranceFireInterval _Model
Agricultural_Soils_Flood_Priority_Rating
Agricultural_Soils_Flood_Risk_Assessme nt_Model
Agricultural_Vegetation_Flood_Priority_ Rating
Agricultural_Vegetation_Flood_Risk_Ass essment_Model
Biodiversity_Flood_Priority_Rating
Biodiversity_Flood_Priority_Rating_Deta il
Biodiversity_Flood_Risk_Assessment_M odel
Flood_Hazard_Rating
NRM_Agricultural_Soils_Priority
NRM_Agricultural_Natural_Remnant_Ve getation_Priority
NRM_Biodiversity_Natural_Capital_Asse t_Priority
Hillslope_Erosivity
Vulnerable_Soils.gdb Water_Erosion_Hazard
Vulnerable_Soils.gdb
Wind_Erosion_Hazard

Description
Final risk assessment model for the threat of fire on biodiversity natural capital assets
Model of the fire threat ratings applied to the natural capital assets
Fire Age and Tolerance Fire Interval model as applied to TASVEG 4 communities
Model of the priority ratings applied to agricultural soils in terms of vulnerability to the threat of flood
Final risk assessment model for the threat of flood on agricultural soils
Model of the priority ratings applied to agricultural remnant native vegetation in terms of vulnerability to the threat of flood
Final risk assessment model for the threat of flood on agricultural remnant native vegetation
Merged model of the priority ratings applied to biodiversity natural capital assets in terms of vulnerability to the threat of flood
Detailed model of the priority ratings applied to each biodiversity natural capital assets in terms of vulnerability to the threat of flood
Final risk assessment model for the threat of flood on biodiversity natural capital assets
Model of the flood threat ratings applied to the natural capital assets
Detailed model of the priority ratings applied to the agricultural soils for all threats
Detailed model of the priority ratings applied to the agricultural soils for all threats
Detailed model of the priority ratings applied to each biodiversity natural capital asset for all threats
NRET model of soil vulnerability to hillslope erosivity
NRET model of soil vulnerability to water erosion
NRET model of soil vulnerability to wind erosion

The following sections provide figures displaying each of the three model components for each threat risk assessment model for both biodiversity and agricultural natural capital assets, namely:
1. Threat Hazard Rating (input): describes the extent and likelihood/severity of the threat.
2. Natural Capital Asset Priority Rating (input): describes the extent of the natural capital assets, which are then rated against all other assets in terms of priority for conservation value and/or the asset’s vulnerability to the threat.
3. Risk Assessment Rating (output): describes the combination of the two above rating models which can be used to identify areas at highest risk to the threat
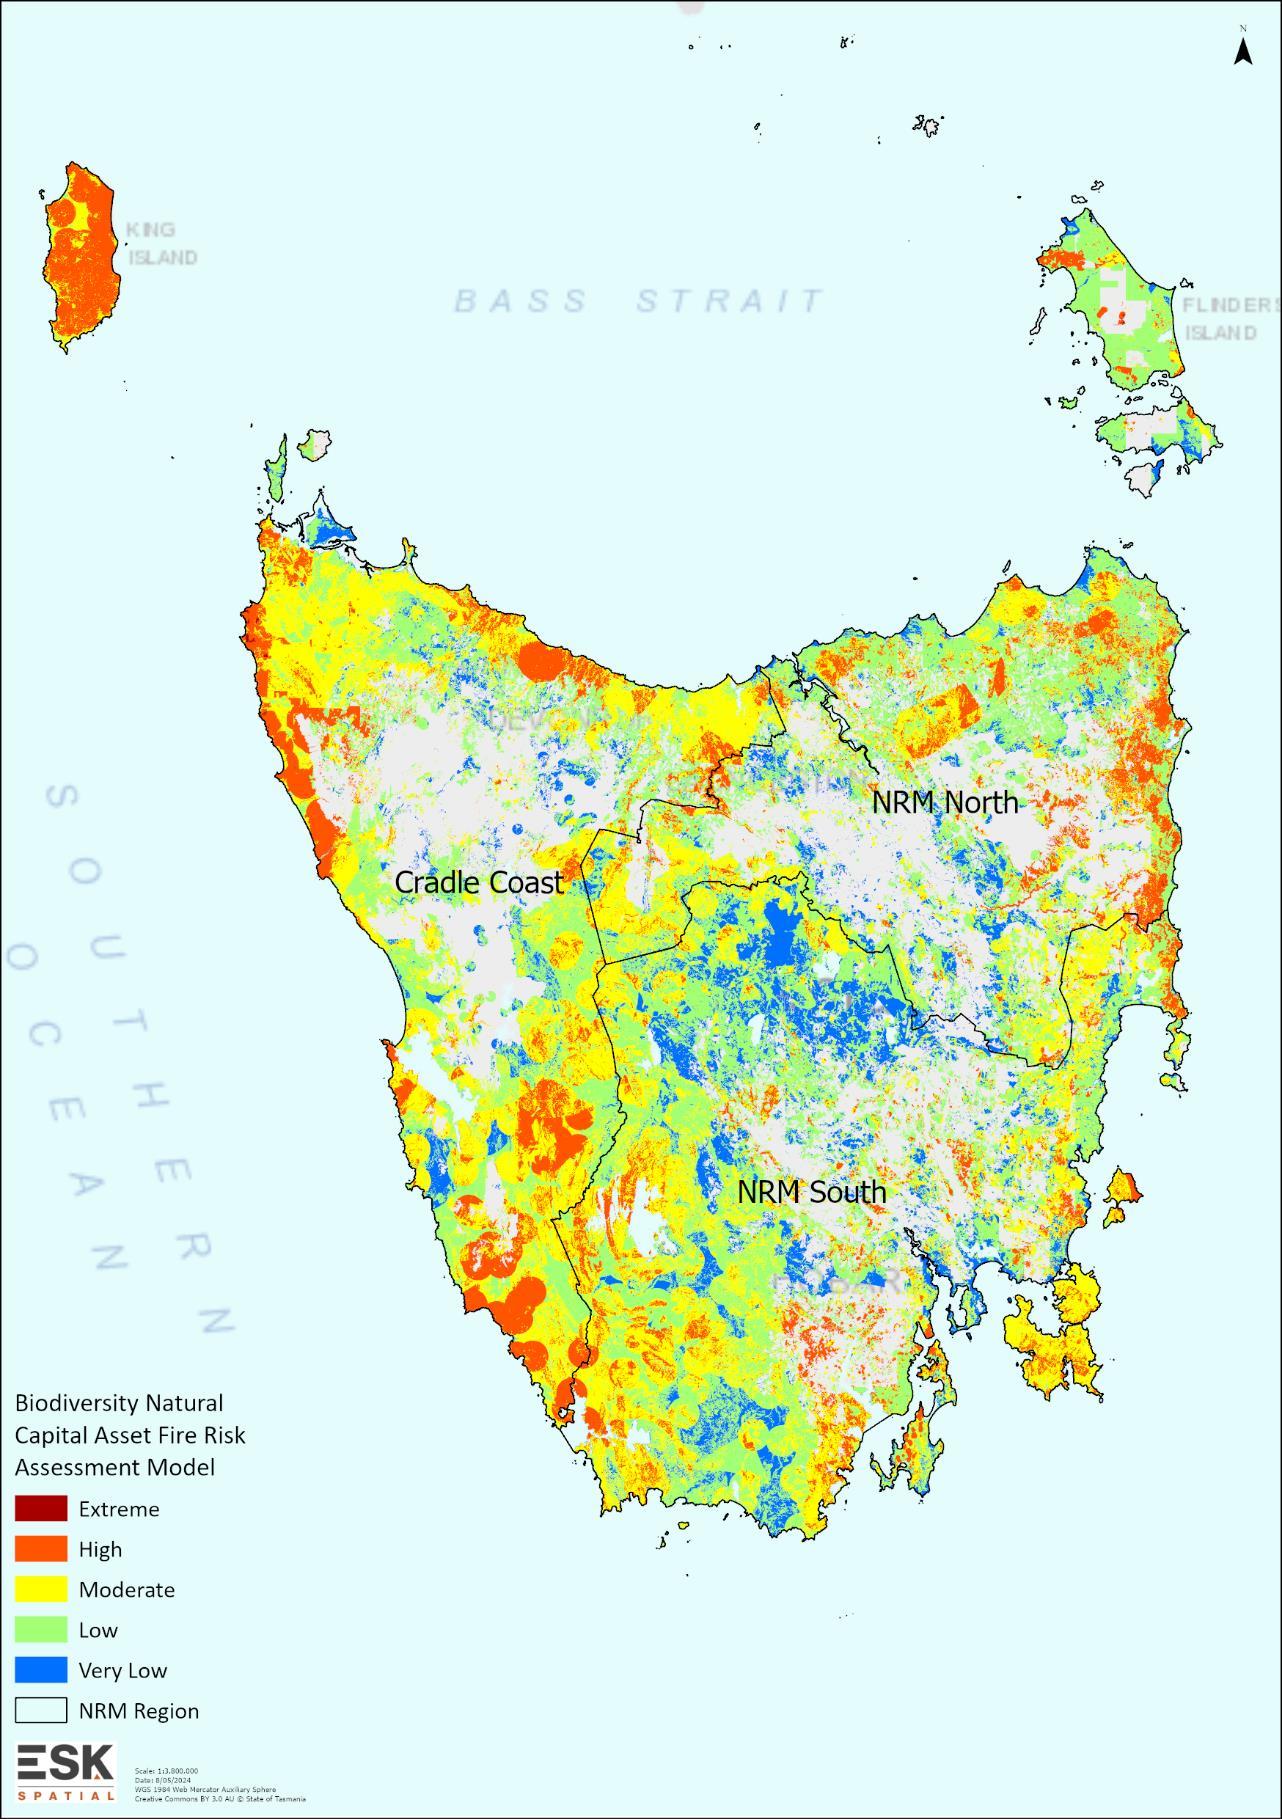
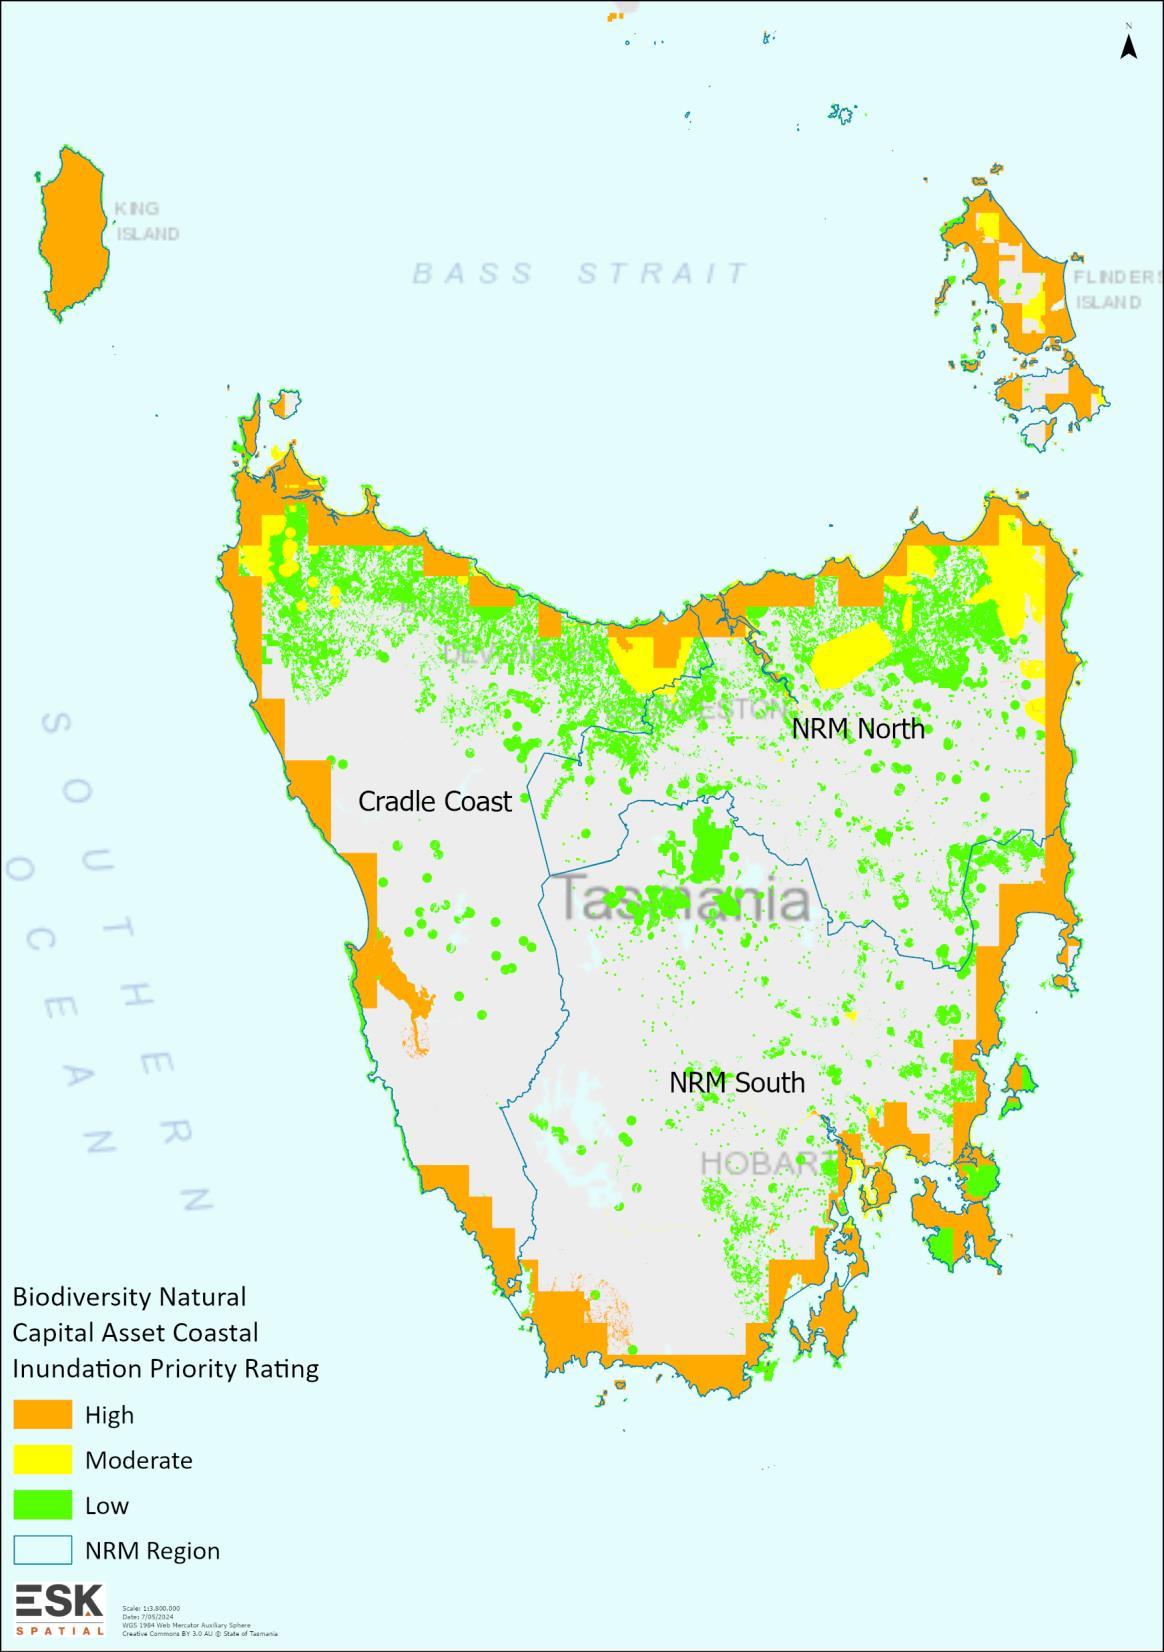
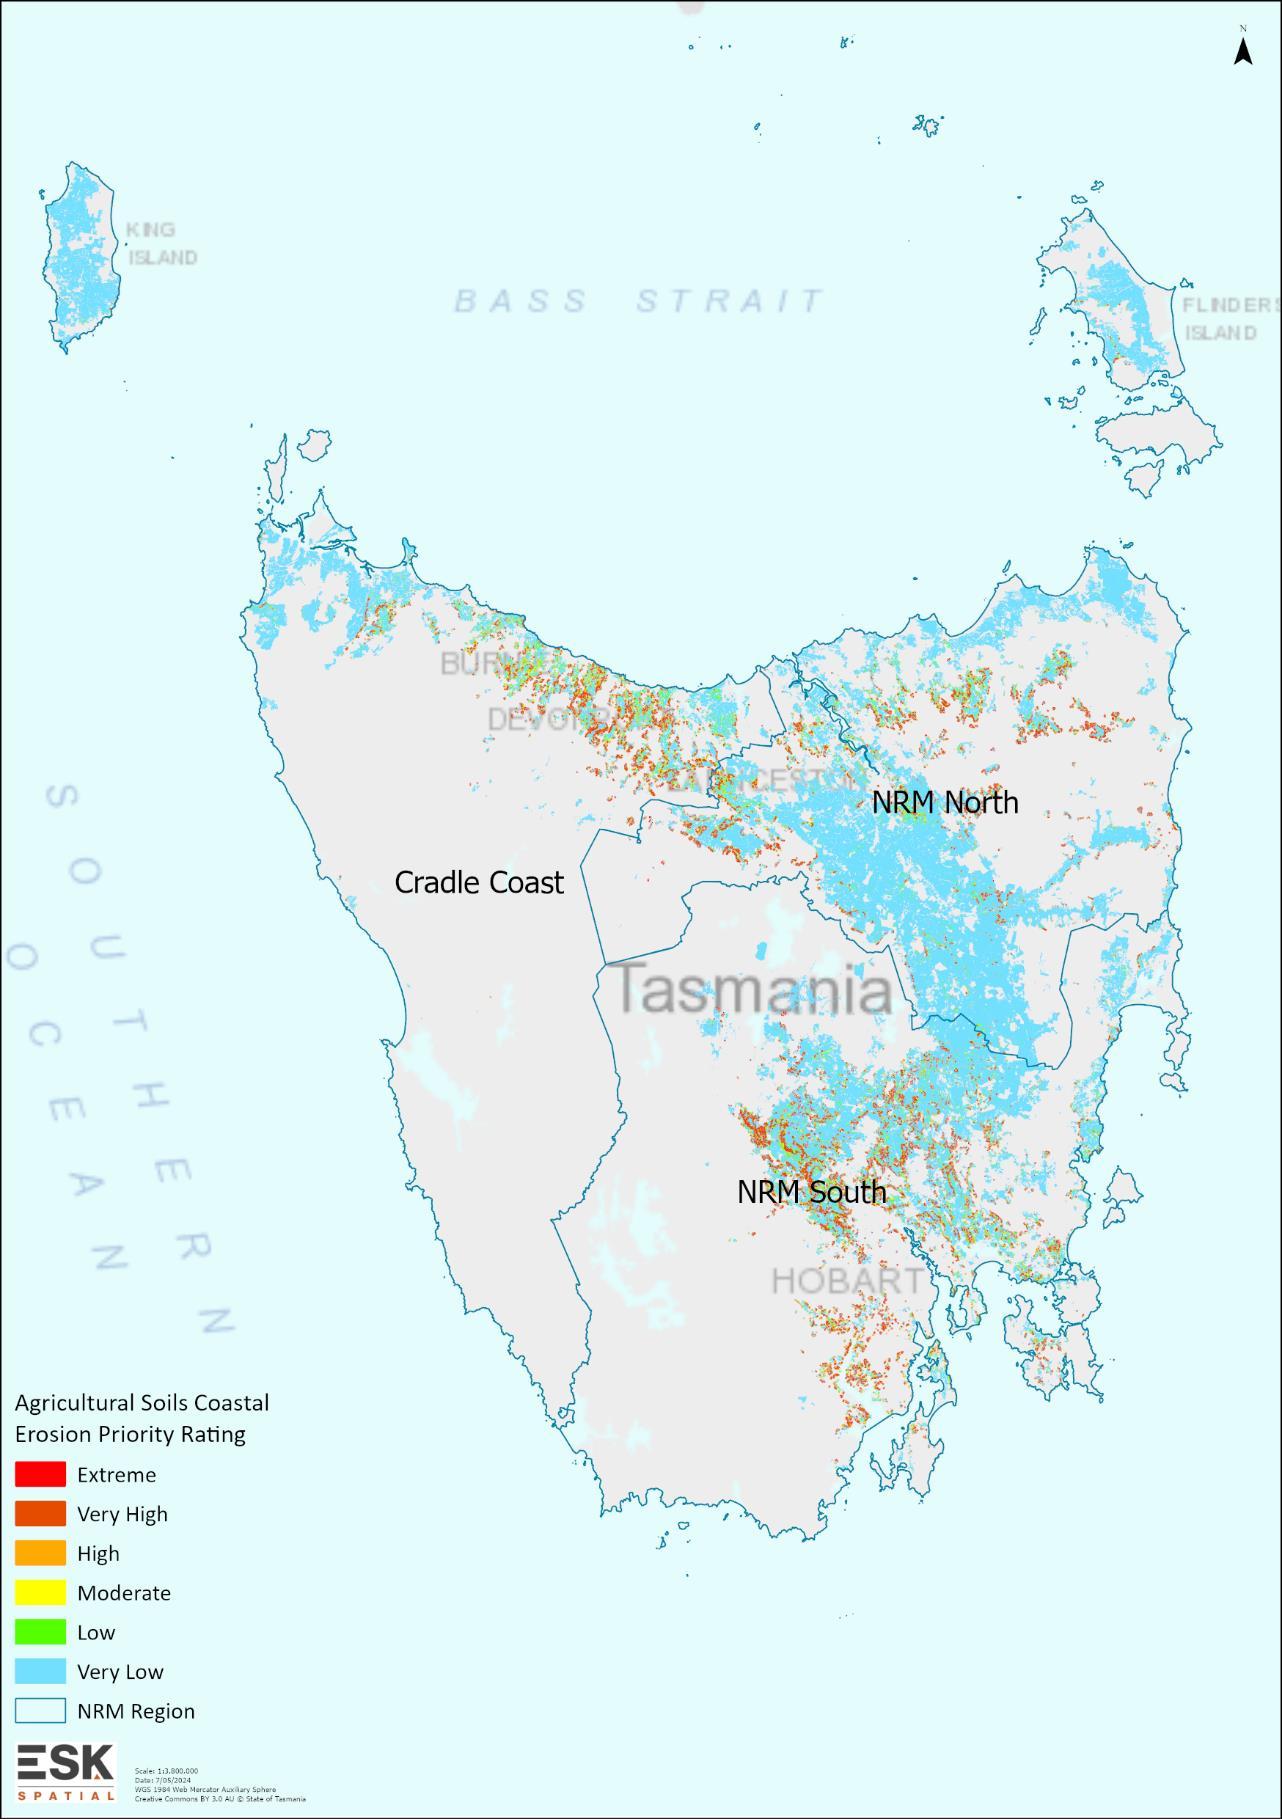
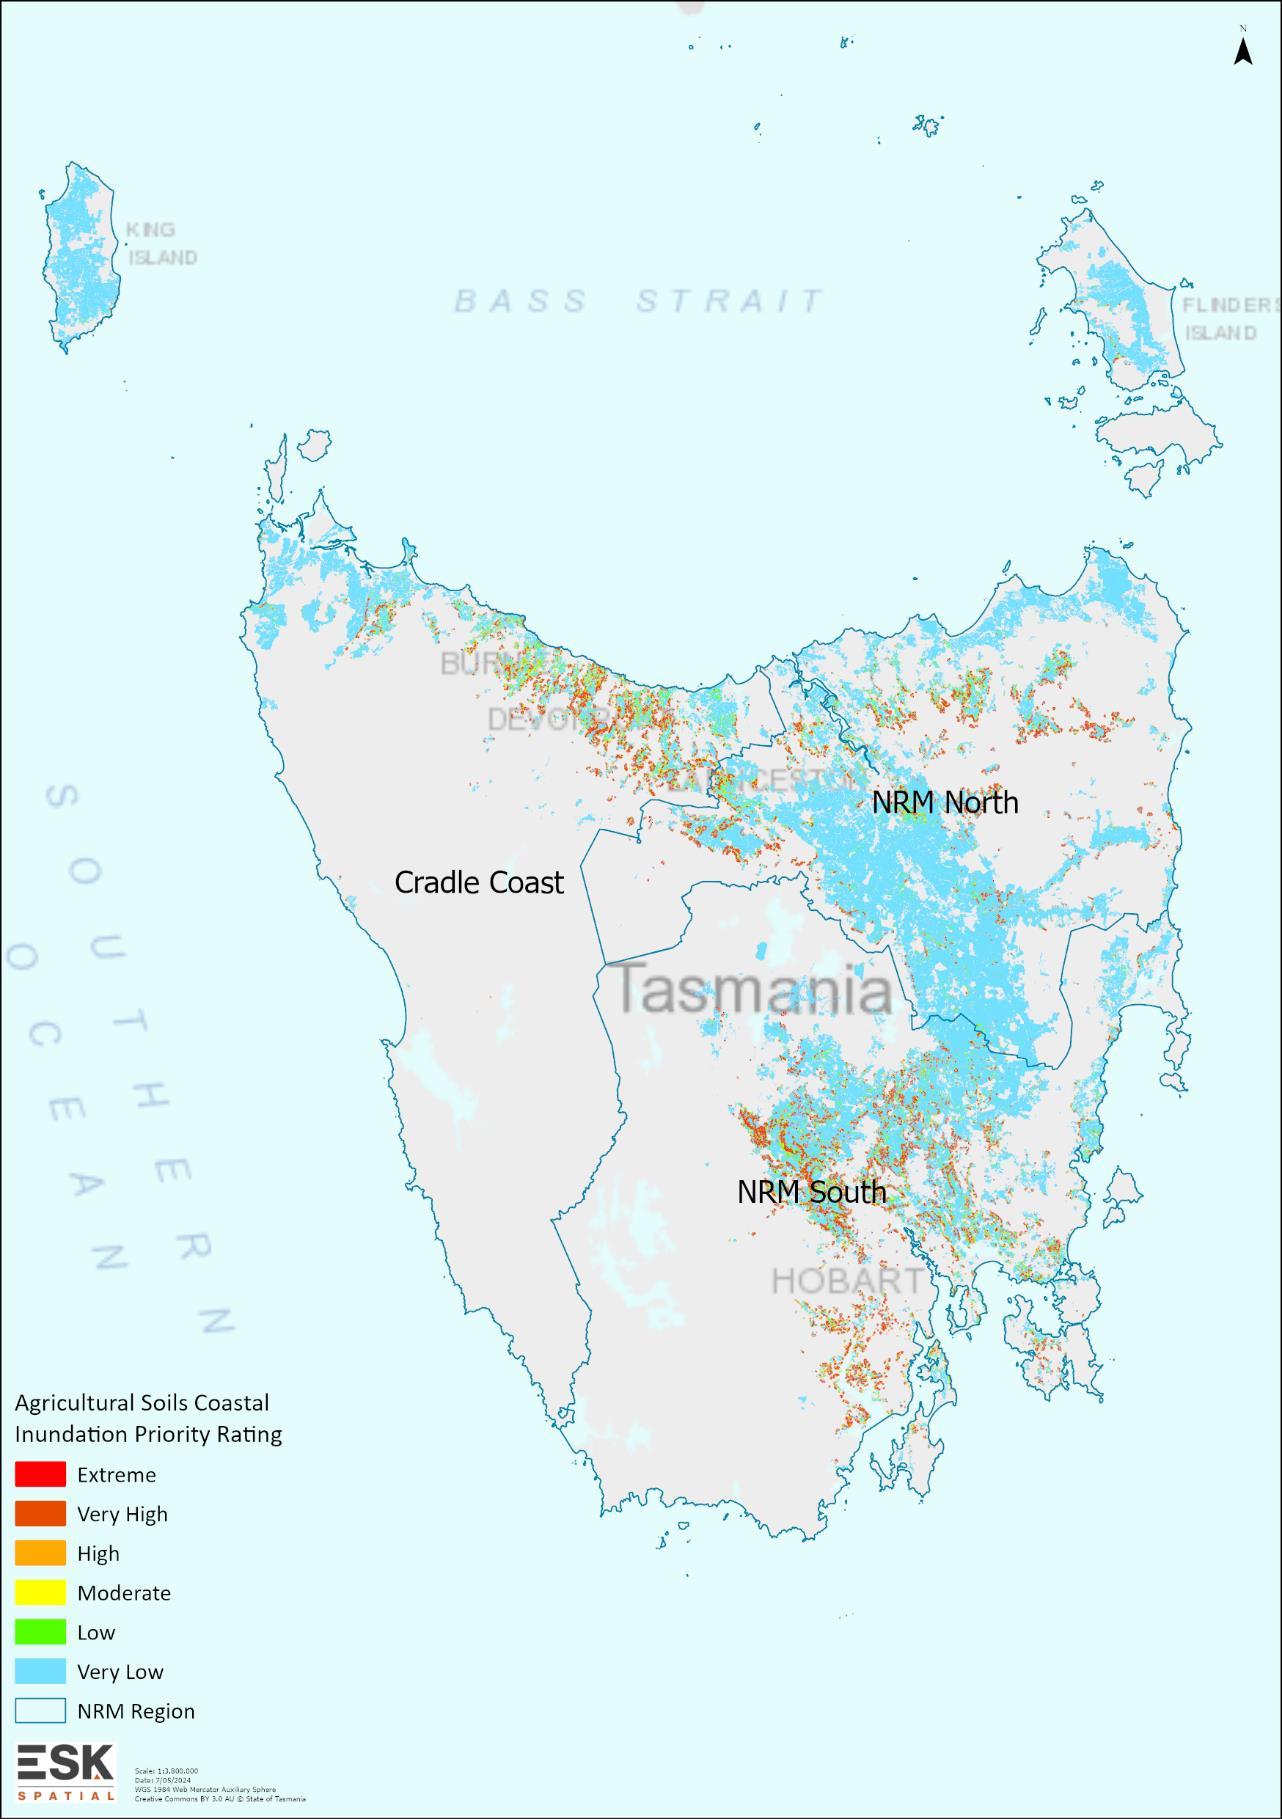
It should be noted that the distribution of natural capital asset priority ratings relative to the threat being modelled will often seem counterintuitive in regard to their location across Tasmania (refer Figure 4, Figure 7, Figure 10, Figure 13, Figure 16, Figure 19, Figure 22, Figure 25, Figure 28 and Figure 31 ahead).
For example, in the map describing the priority rating for Biodiversity Natural Capital Assets for Coastal Erosion (Figure 7) various ratings appear within the map well away from the coast.
This seeming inconsistency arises because priorities are applied to the whole range of boundary of the natural capital asset, and many assets include a range which spans from the coast to well inland. As such, priority ratings are assigned in a location agnostic manner, and it is the interaction with the geographic distribution of the threat which ties the final risk model down to more relevant locations This approach avoids the need to second guess where the threat might occur whilst assigning priorities to natural capital assets, allowing updates to the geographic location of either the threat or the natural capital asset to be undertaken independently of one another during future runs of the models

4.2.1 Biodiversity Natural Capital Assets – Fire Risk Assessment Model Components
Figure 3 – Fire Threat (Likelihood) Rating Model


Figure 4 – Biodiversity Natural Capital Asset Fire Priority Rating Model


5 – Biodiversity Natural Capital Asset Fire Risk Assessment Model


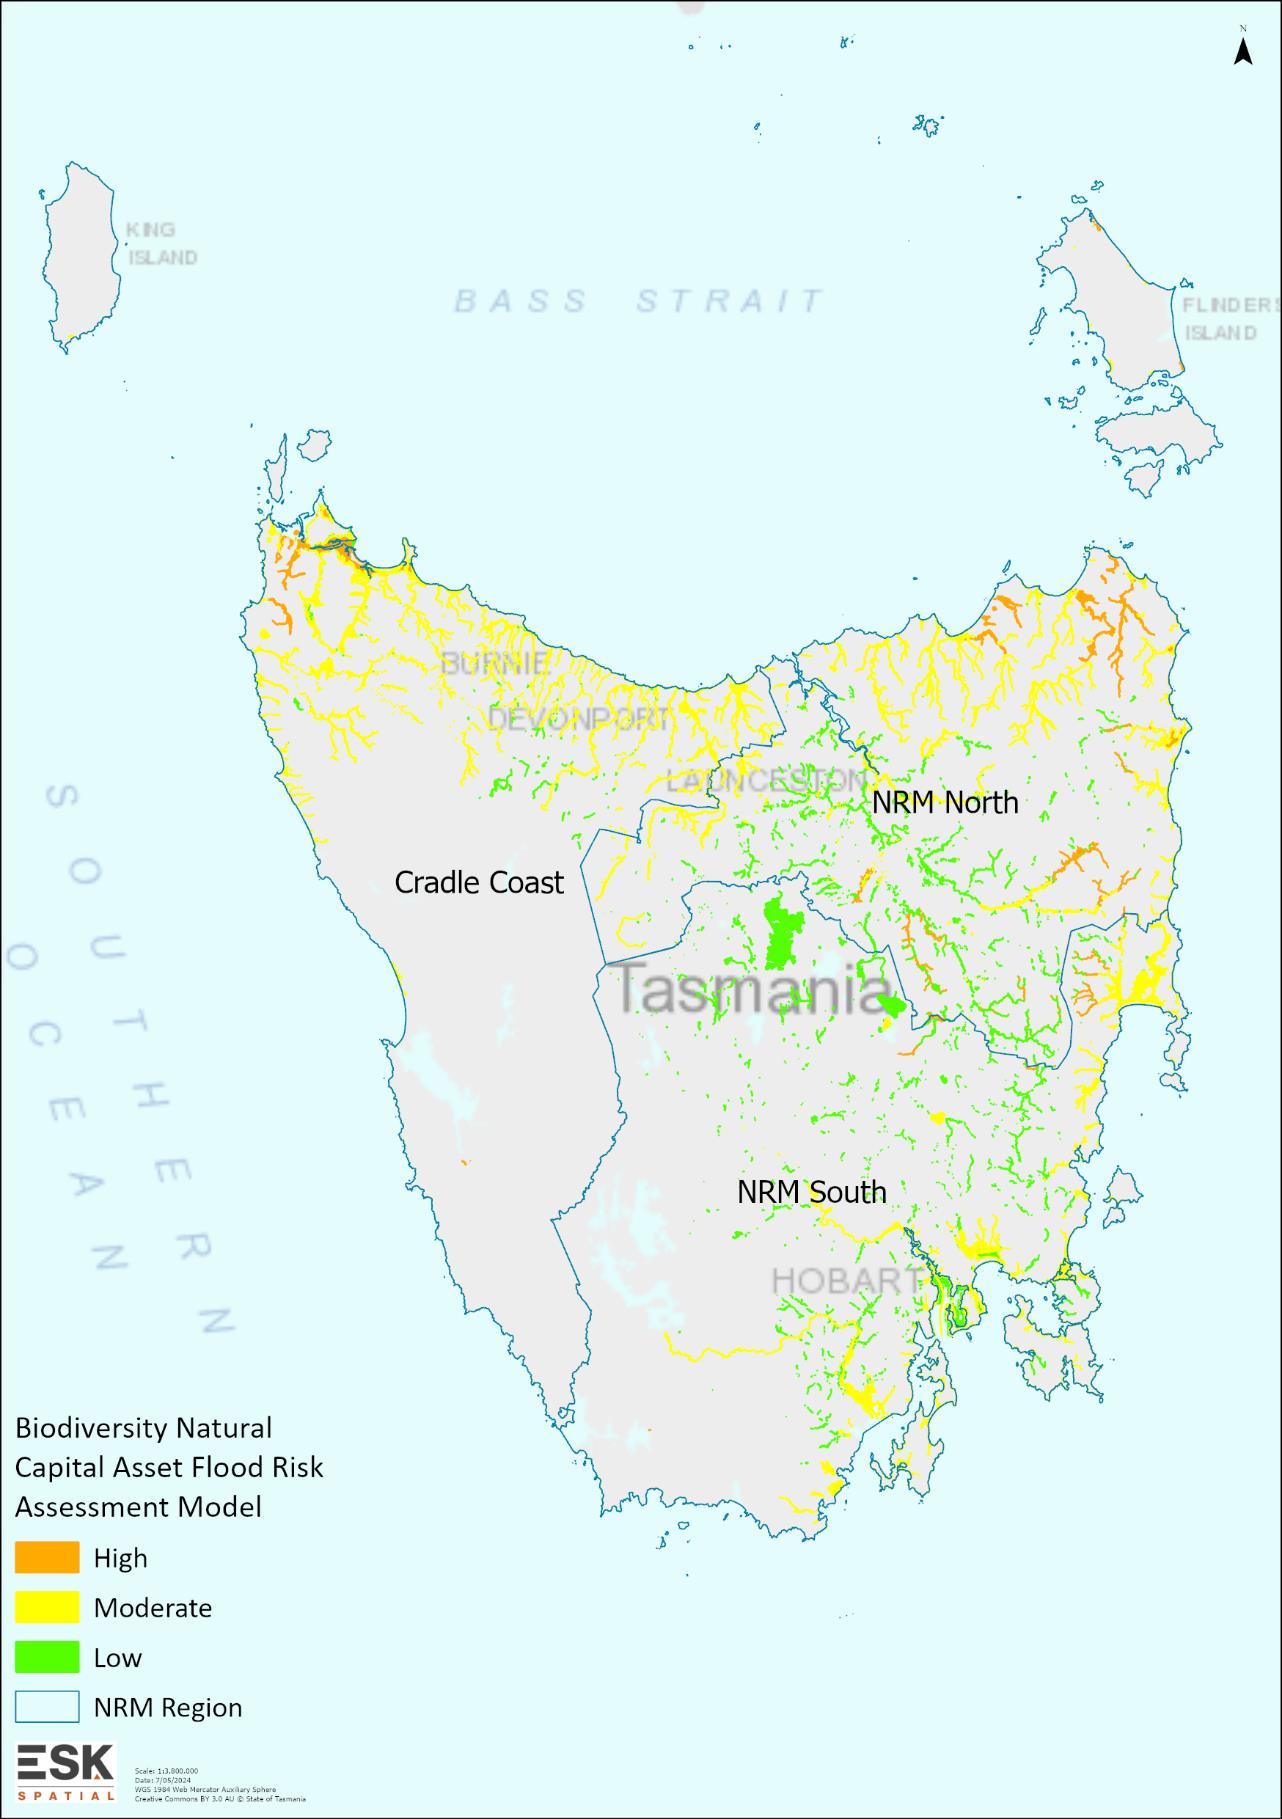
4.2.2 Biodiversity Natural Capital Assets – Flood Risk Assessment Model Components
6 – Flood Threat (Hazard) Rating Model



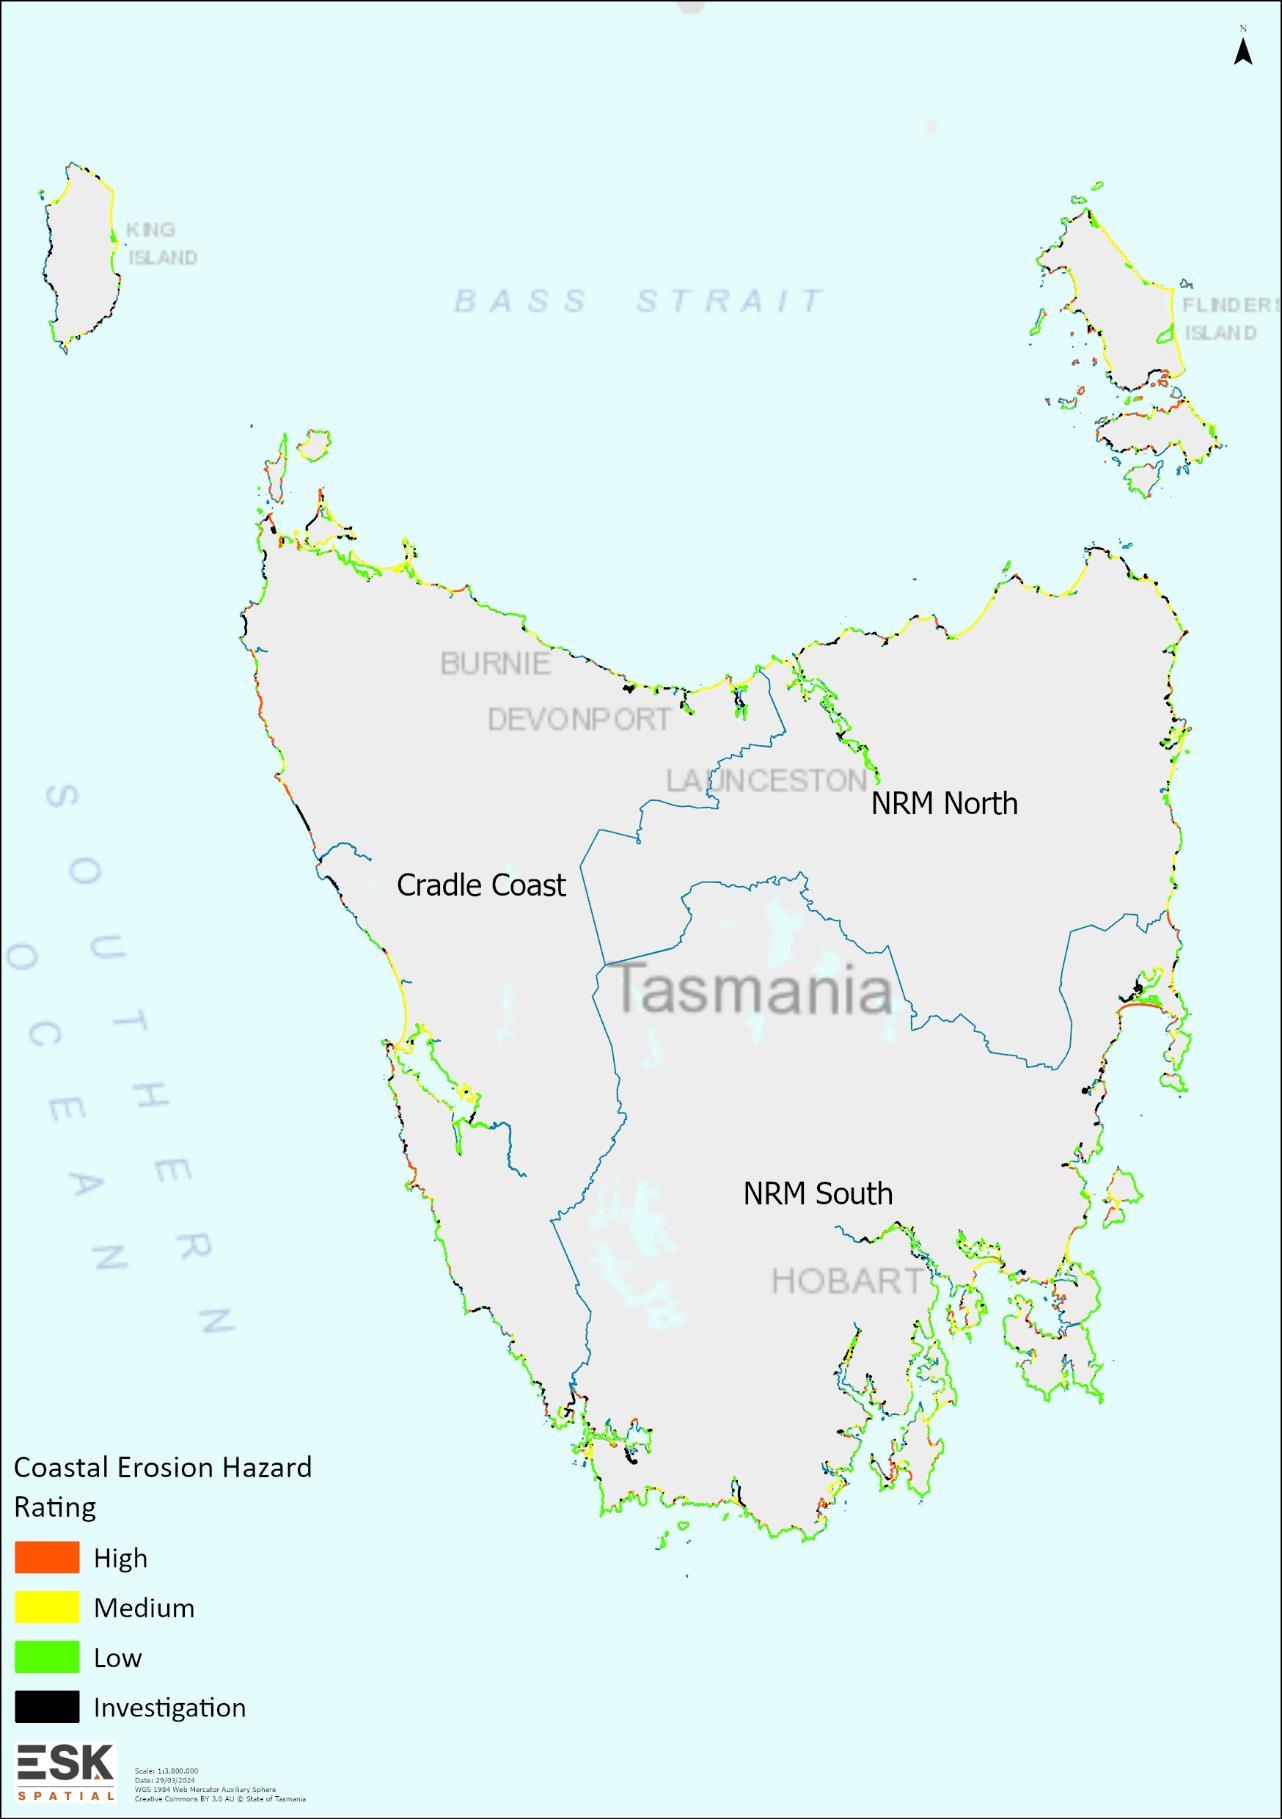
4.2.3 Biodiversity Natural Capital Assets – Coastal Erosion Risk Assessment Model Components
9 – Coastal Erosion Threat (Hazard) Rating Model



4.2.4 Biodiversity Natural Capital Assets – Coastal Inundation Risk Assessment Model Components
Figure 12 – Coastal Inundation Threat (Hazard) Rating Model

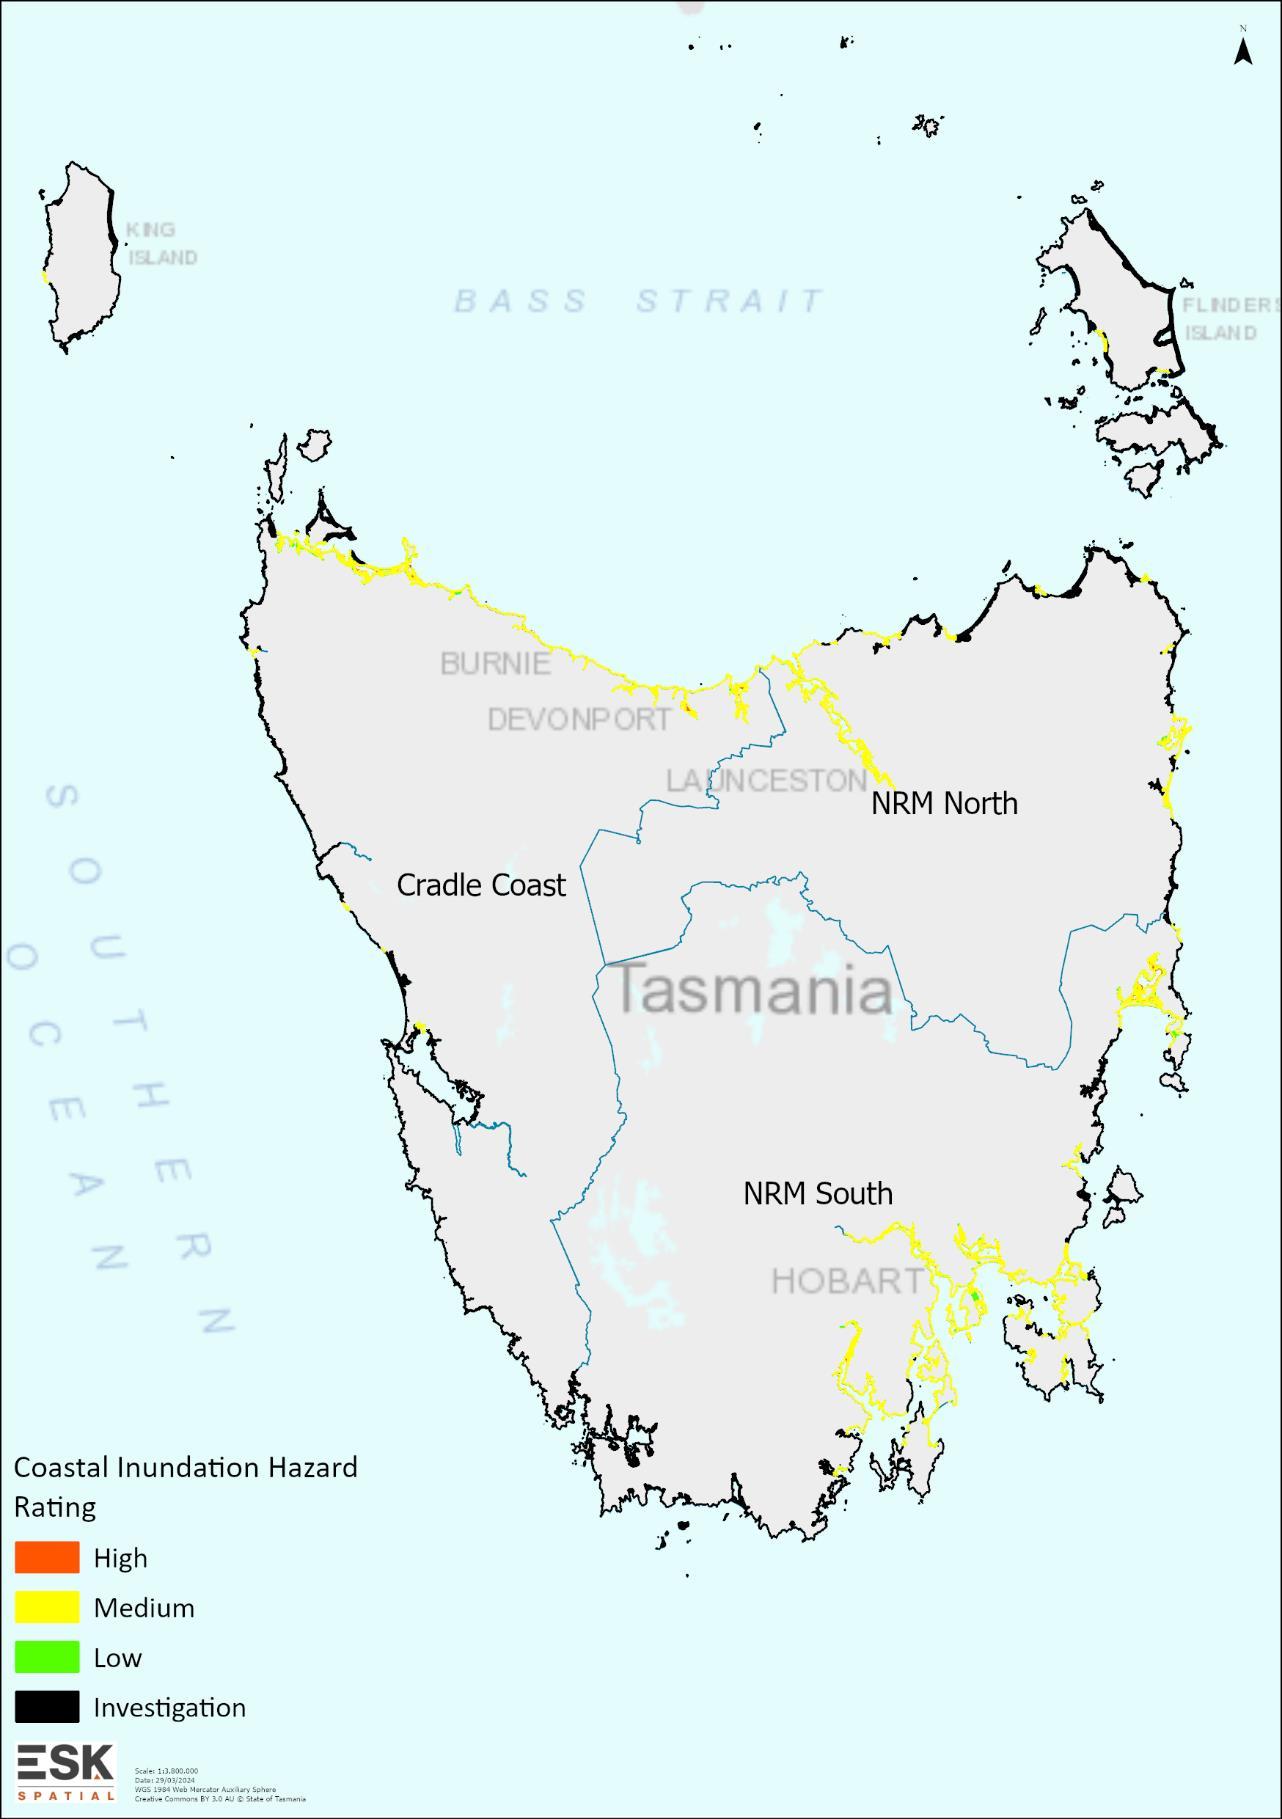

Figure 13 – Biodiversity Natural Capital Asset Coastal Inundation Priority Rating Model



4.2.5 Agricultural Soils Flood Risk Assessment Model Components
Figure 15 – Flood Threat (Hazard) Rating Model


16 – Agricultural Soils Flood Priority Rating Model


4.2.6 Agricultural Soils Coastal Erosion Risk Assessment Model Components
Figure 18 – Coastal Erosion Threat (Hazard) Rating Model


19 – Agricultural Soils Coastal Erosion Priority Rating Model



4.2.7 Agricultural Soils Coastal Inundation Risk Model Components

21 – Coastal Inundation Threat (Hazard) Rating Model




4.2.8 Agricultural Remnant Native Vegetation Flood Risk Assessment Model Components
Figure 24 – Flood Threat (Hazard) Rating Model


25 – Agricultural Remnant Native Vegetation Flood Priority Rating Model


26 – Agricultural Remnant Native Vegetation Flood Risk Assessment Model

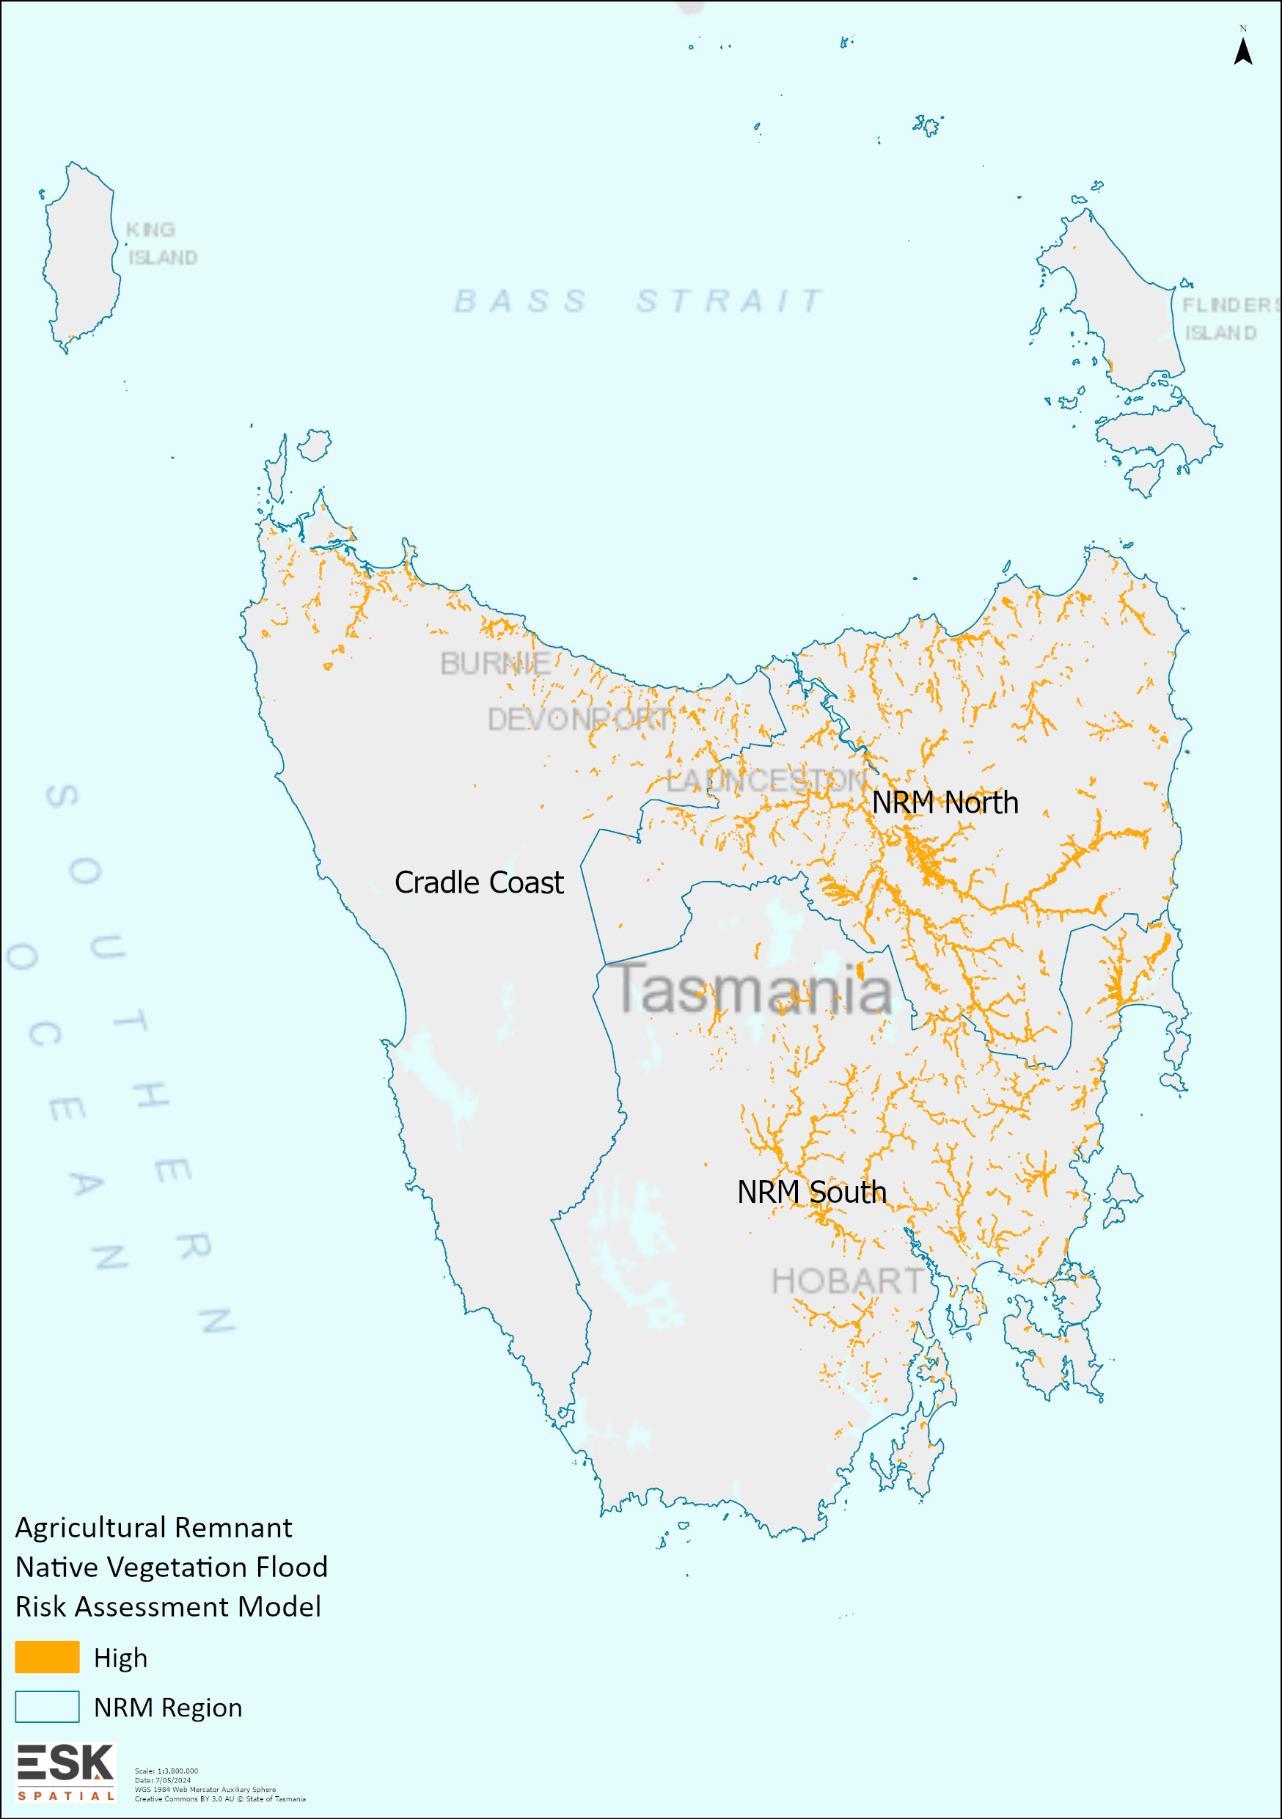

4.2.9 Agricultural Remnant Native Vegetation Coastal Erosion Risk Assessment Model Components


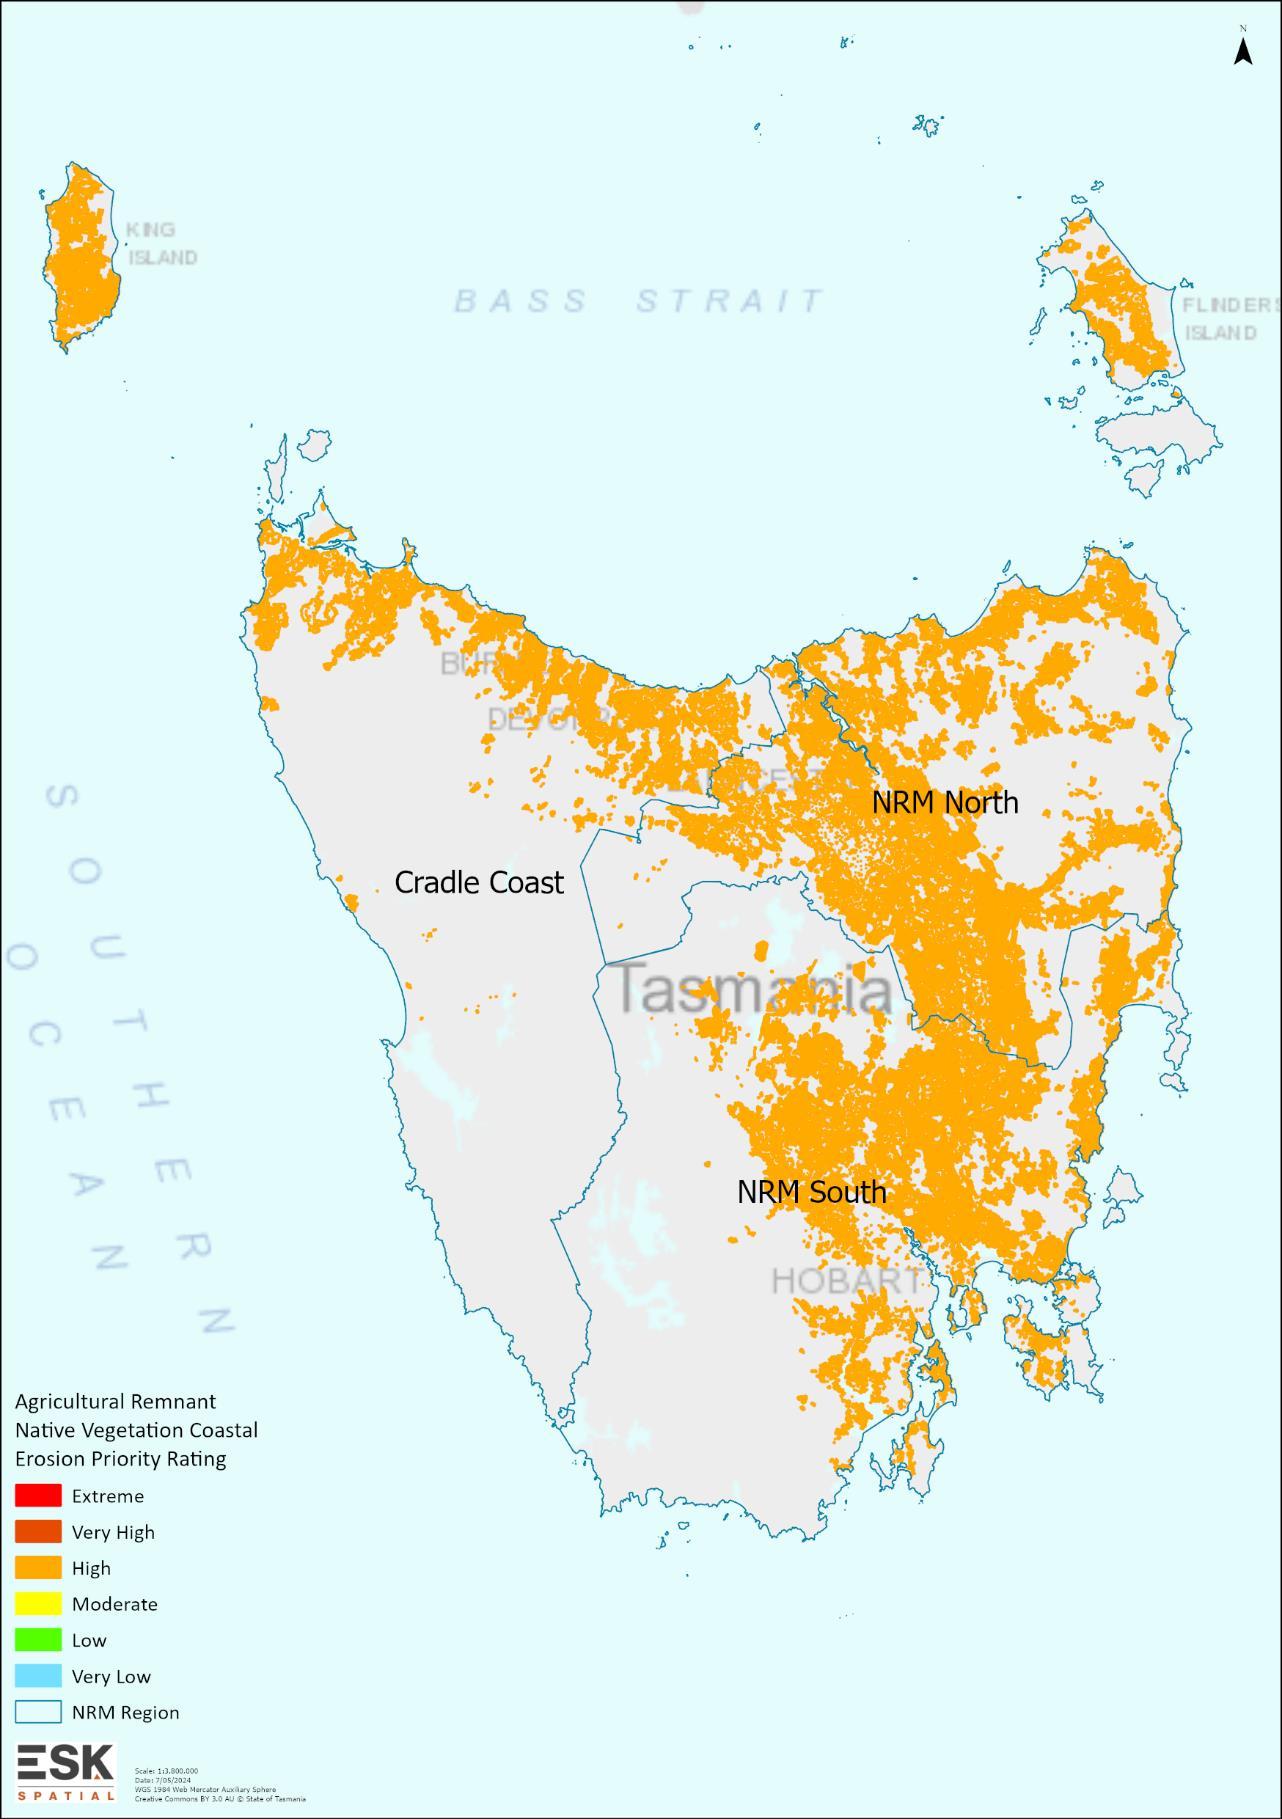


4.2.10 Agricultural Remnant Native Vegetation Coastal Inundation Risk Assessment Model Components
30 – Coastal Inundation Threat (Hazard) Rating Model


31 – Agricultural Remnant Native Vegetation Coastal Inundation Priority Rating Model


32 – Agricultural Remnant Native Vegetation Coastal Inundation Risk Assessment Model


To assist with interpretation of the mapped outputs, a series of tables has been produced summarising the area and/or percentage of the range/location of each natural capital asset under each risk assessment rating for each threat.
Note the items highlighted in grey were excluded from analysis as their modelled range was too generic/broad to accurately model
Acanthiza pusilla magnirostris (Acanthiza pusilla subsp. archibaldi)
Prasophyllum taphanyx Graveside
Pseudomys novaehollandiae
Thymichthys politus Red Hand Fish
Zearaja maugeana Maugean Skate

Table 8 – Fire Risk Assessment Results for Nationally Threatened Ecological Communities
Eucalyptus ovataCallitris oblonga Forest
Eucalyptus ovata / Eucalyptus brookeriana Forests and Woodlands
Giant Kelp Marine Forests of South East Australia
Lowland Native Grasslands of Tasmania
Subtropical &
Tasmanian White Gum (Eucalyptus viminalis) Wet Forest
Table 9 – Fire Risk Assessment Results for National Priority Sites

Table 11 – Fire Risk Assessment Results for Regionally Threatened and Important Species
Strepera


Note the items highlighted in grey were excluded from analysis as their modelled range was too generic/broad to accurately model
Table 14 – Flood Risk Assessment Results for National Priority EPBC Listed Threatened Species
Acanthiza pusilla magnirostris (Acanthiza pusilla subsp. archibaldi)
magna subsp. greeniana
raniformis
Table 15 – Flood Risk Assessment Results for Nationally Threatened Ecological Communities
ovata - Callitris oblonga Forest
Eucalyptus ovata / Eucalyptus brookeriana Forests and Woodlands
Giant Kelp Marine Forests of South East
Lowland Native Grasslands of Tasmania
Subtropical & Temperate Coastal Saltmarsh
Tasmanian White Gum (Eucalyptus viminalis) Wet Forest

Table 16 – Flood Risk Assessment Results for National Priority Sites
Table 18 – Flood Risk Assessment Results for Regionally Threatened and Important Species


Note the items highlighted in grey were excluded from analysis as their modelled range was too generic/broad to accurately model
Table 21 – Coastal Erosion Risk Assessment Results for National Priority EPBC Listed Threatened Species
Acanthiza pusilla magnirostris (Acanthiza pusilla subsp. archibaldi)
Acanthornis magna subsp. greeniana
viverrinus
Pseudomys novaehollandiae New Holland Mouse
Thinornis cucullatus cucullatus Hooded Plover
Thymichthys politus Red Hand Fish
maugeana

Alpine Sphagnum Bogs and Associated Fens
Eucalyptus ovata - Callitris oblonga Forest
Eucalyptus ovata / Eucalyptus brookeriana Forests and Woodlands
Giant Kelp Marine Forests of South East Australia
Lowland Native Grasslands of Tasmania
Subtropical & Temperate Coastal Saltmarsh
Tasmanian White Gum (Eucalyptus viminalis) Wet Forest
Table 23 – Coastal Erosion Risk Assessment Results for National Priority Sites

morrisbyi
Limnodynastes peronii Striped Marsh Frog
Oreisplanus munionga subsp. larana Marrawah Skipper
Oreixenica ptunarra Ptunarra Brown Butterfly
Pardalotus quadragintus Forty Spotted Pardalote
Perameles gunnii gunnii Eastern Barred Bandicoot
Platycercus caledonicus brownii King Island Green Rosella
Prototroctes maraena Australian Grayling
Puffinus tenuirostris Short-tailed Shearwater
Sarcophilus harrisii Tasmanian Devil


Note the items highlighted in grey were excluded from analysis as their modelled range was too generic/broad to accurately model
Gold Bell Frog


Oreisplanus munionga subsp. larana Marrawah Skipper
Oreixenica ptunarra Ptunarra Brown Butterfly
Pardalotus quadragintus Forty Spotted Pardalote
Perameles gunnii gunnii Eastern Barred Bandicoot
Platycercus caledonicus brownii King Island Green Rosella


4.
3.3.3
3.6.2

4.2.0
4.2.3
4.2.4
4.3.3
4.3.7
4.3.8
4.4.0
4.4.5
4.4.9 Irrigated grapes
4.5.0 Irrigated
4.5.3
4.5.4

Table 37 – Primary Land Use Classes by Coastal Erosion Risk Assessment Rating for Agricultural Soils
Land Use Class
2.
3.4.2
3.6.1
3.6.2
4.2.0
4.3.2
38 – Tertiary Land Use Classes
4.3.3
4.3.7
4.3.8
4.4.1
4.4.3
4.4.5
4.4.6
4.4.7
4.4.9
4.5.0
4.6.2

2.1.0
3.2.3
3.2.5
3.3.0
3.3.3
3.5.0
3.6.2
4.2.4
4.3.3 Irrigated hay and silage
4.3.7 Irrigated alkaloid poppies
4.3.8
4.4.0
4.4.1
4.4.2 Irrigated olives
4.4.3 Irrigated tree nuts
4.4.5 Irrigated shrub berries and fruits
4.4.6 Irrigated perennial flowers and bulbs
4.4.7


4.4.9


5.9 Agricultural Remnant Native Vegetation – Coastal Erosion Risk Model
Table 42 – Vegetation Type by Coastal Erosion Risk Assessment Rating for Agricultural Remnant Native Vegetation
Scrub, heathland and coastal complexes
(DSC) Eucalyptus amygdalina - Eucalyptus obliqua damp sclerophyll forest
(DSG) Eucalyptus sieberi forest and woodland on granite
(DSO) Eucalyptus sieberi forest and woodland not on granite

(DVC) Eucalyptus viminalis - Eucalyptus globulus

5.10 Agricultural Remnant Native Vegetation – Coastal Inundation Risk Model Table

(DTD) Eucalyptus tenuiramis forest and woodland on dolerite
(DTO) Eucalyptus tenuiramis forest and woodland on sediments
(DVC) Eucalyptus viminalis - Eucalyptus globulus coastal forest and woodland
(DVG) Eucalyptus viminalis grassy forest and woodland
(GPL) Lowland Poa labillardierei grassland
(GSL) Lowland grassy sedgeland
(GTL) Lowland Themeda triandra grassland
Non eucalypt forest and woodland (NAD) Acacia dealbata forest
(NAF) Acacia melanoxylon swamp forest
(NAL) Allocasuarina littoralis forest
(NAR) Acacia melanoxylon forest on rises
Saltmarsh and wetland
Scrub, heathland and coastal complexes

(WGL) Eucalyptus globulus wet forest
eucalypt forest and woodland (WGK) Eucalyptus globulus King Island forest
(WNL) Eucalyptus nitida forest over Leptospermum
(WNU) Eucalyptus nitida wet forest (undifferentiated)
(WOB) Eucalyptus obliqua forest with broad-leaf shrubs
(WOU) Eucalyptus obliqua wet forest (undifferentiated)
(WRE) Eucalyptus regnans forest

As described in the methodology, where the range of a species or vegetation community appeared too broad (1km grids, whole of Tasmania), scattered (reliant only on infrequent observation records) or inaccurate (included large areas of sea for a species reliant on terrestrial habitat) to model, we put in considerable effort to derive a more accurate location from other available sources such as interpreting habitat descriptions into target Tasmanian vegetation communities which could be used in the risk modelling process However, despite best efforts, many of the resultant models appear to be still out of date, incomplete or inaccurate so results from this iteration of the emergency preparedness modelling should be used with caution and should be reviewed and improved prior to revisiting the modelling.
Where the literature to describe the range, habitat and/or extent of the natural capital asset was either lacking or too broad to accurately locate geographically, they were excluded from the risk assessment modelling process (refer Table 44)
Table 44 – Biodiversity Natural Capital Assets which were excluded from the Risk Assessment Modelling due to insufficient information to accurately locate their range/habitat
Neophema chrysostoma Blue-winged Parrot
During the breeding season (spring and summer), birds occupy eucalypt forests and woodlands. Before migrating from Tasmania in autumn, many birds congregate on saltmarshes and agricultural land before departing north.
Inclusion of these broad species ranges as currently described would have covered most of Tasmania with inaccurate priority rankings, masking the rankings of more accurately located natural capital assets. In any future iteration of this modelling process, it is recommended that more research be put into determining better models to describe the habitat and extent of these species
In general, to provide robust risk assessment modelling it is very important that ranges for all the priority biodiversity natural capital assets be reviewed and updated as accurately as possible and this is likely a high priority for any future iterations of this modelling exercise, particularly for the fire risk assessment modelling given several species are currently excluded
The biodiversity-focused fire risk assessment model built in this project was designed from the framework of, and even used similar input data models as, the long established TPWS BRAM model process, which is based on a solid set of assumptions and scientific research. However, the risk assessment models built for the agricultural natural capital assets in this project were novel, and due to time limitations had to be applied in a more simplistic approach than the biodiversity and fire modelling
The underlying science and assumptions applied by DPAC to devise the hazard bands for the coastal erosion and coastal inundation models was robust, as did the flood modelling produced by SES and the water erosion vulnerability modelling produced by NRET, but the assumptions on how these inputs were combined in the final model in this project require more research and fine tuning to ensure they have been applied appropriately

It is recommended that more research and stakeholder engagement be undertaken to improve the agricultural risk models for any future iterations of this process.
Although there were several aquatic and marine natural capital assets listed for inclusion in the modelling, the bulk of the threat data available to us, and subsequently the modelling undertaken in this project, was terrestrial in nature, so they were largely underrepresented in the risk assessment outputs.
We endeavoured to address some of their conservation requirements by modelling the threat to the local riparian habitat, crucial for preserving water quality for these species. However, this approach overlooked the significance of upstream ecosystems. Any impacts on these upstream environments from events such as fire or flood would likely affect downstream species as well, leading to heightened runoff and sediment flow, among other consequences.
In terms of the effect on aquatic species, including marine species, a different approach to modelling would be required that accounts for risk assessment to upstream environment on a catchment by catchment basis
Several of the acquired datasets varied in their delineation and precision of the Tasmanian coastline, resulting in inconsistent spatial alignment along the coast. While this inconsistency posed fewer issues for fire and flood risk modelling, it could prove critical for coastal erosion and inundation modelling, potentially leading to the improper identification of high-risk areas. This discrepancy was particularly notable concerning the range boundaries for biodiversity natural capital assets. Further efforts will be necessary to establish a uniform coastline as the foundation for defining range boundaries in future iterations of this process.
Statewide Data provided by LIST Open Data is often tiled by municipality but the file format for many was inconsistent between tiles. This meant that column names were inconsistent, particularly in the case of ESRI shapefile columns which were truncated when the tiles were merged back into a statewide version, causing issues within the modelling. In some cases, the ZIP files for some tiles were corrupted. This was experienced with the following layers within this project:
• Coastal Erosion Hazard Bands 20161201,
• Coastal Inundation Hazard Bands 20161201,
• Coastal Projected Storm Tide 20161201 (1% AEP 21000).

The Emergency Preparedness – Statewide Analysis and Mapping report plays an integral role in the statewide NRM's overarching "Biodiversity and Agricultural Natural Capital Preparedness and Emergency Response Plan." This initiative responds to the increasing necessity to fortify our readiness for natural disasters and their potential impact on biodiversity and agricultural natural capital assets, considering diverse disaster scenarios such as floods, fires, and biosecurity incursions.
Collaborating closely with three NRM organisations and key stakeholders, Esk Spatial conducted a thorough assessment to identify and map priority natural capital assets across Tasmania, leveraging existing data. This analysis, conducted in a tenure-blind manner, also scrutinised the vulnerability of these assets to extreme weather events, thereby guiding the development of the NRM Response Plan. Central to this project is the creation of an ongoing spatial analysis resource empowering NRM organisations to make informed decisions pre, during, and post-emergency events.
Drawing from publicly available and stakeholder data, the Biodiversity and Agricultural Natural Capital Risk Assessment Modelling produced outputs including Threat Risk Rankings, Natural Capital Asset Priority Rankings, and a comprehensive Risk Assessment Model. Stakeholder engagement sessions, encompassing a wide array of thematic areas such as biodiversity preservation, coastal management, and climate change, contributed to the establishment of a robust priority-setting framework. This framework, validated through subsequent workshops and feedback, guided the data analysis necessary to validate the modelling outputs.
Looking ahead, future iterations of the modelling process must address various considerations, including rectifying previously unusable data sources, identifying additional knowledge data requirements for enhanced modelling accuracy, and pinpointing specific data enhancements necessary for evaluating significant species. Establishing a pragmatic timeframe for future updates is essential to maintaining the ongoing relevance and effectiveness of the modelling efforts.
The most significant limitation to the modelling implemented was a lack of accurate information about key biodiversity natural capital assets, particularly the range locations for threatened species. Current data sets providing such location information are either too broad in nature or out of date. We would recommend that a partial re-iteration of this project be undertaken in a time frame that would clean up the main issues relating to the fire modelling prior to the next fire season, specifically the improvements and fine tuning of the species range boundaries. These improvements would feed directly into the biodiversity risk assessment modelling for flood, coastal erosion, and coastal inundation. The timing to improve the models for the agricultural risk assessment models are likely less pressing given much of the timeframes for increased threat rely on sea level rise
Once the major limitations to the modelling are improved, it is likely a re-run every two to three years would be sufficient to pick up the major changes in priority natural capital assets and threat models, however the models can be easily re-run at any time should there be any change of national significance that needs addressing.
Through concerted efforts and continued refinement, this initiative stands poised to strengthen Tasmania's resilience in the face of environmental challenges, safeguarding its natural capital into the future.

Questions for preliminary stakeholder engagement interview
1. What are the priority biodiversity and agricultural natural capital assets for your organisation in Tasmania? Why?
2. What are the key threats to these (specifically related to fire, coastal inundation, storms and biosecurity)? Why?
3. Do you have data and/or other information available to assist with modelling the threat?
4. Are you aware of any other sources of data?
5. Is there anyone else we should be speaking to on this topic?
6. Is there anything else you’d like to add?

Esk Spatial and Greenwood Strategy have been engaged to work collaboratively with the three NRM organisations and key stakeholders to identify and map the priority natural capital assets across the Tasmanian landscape that are vulnerable to fire, flooding, coastal inundation, and biosecurity emergencies (tenure blind). This includes the identification and mapping of biodiversity assets and agricultural natural capital assets, drawing on existing information holdings at Commonwealth State or regional level investigation, and to analyse the vulnerability of these assets to fire, flood, coastal inundation, and biosecurity emergencies. This will guide the development of the NRM Biodiversity and Agricultural Natural Capital Emergency Preparedness and Response Plan.
The key deliverable of the project is to provide an ongoing resource that the NRM organisations can use in decision making prior to, during, and after future emergency events.
Desktop review and stakeholder consultation have concluded. This meeting is to update the NRMs on data outputs so far and to garner additional input from the NRMs.
Time and date:
12PM – 2PM, Monday 18 March 2023
Agenda:
1 Welcome and Introductions
• Welcome
• What we hope to achieve from today’s session
2 Project Overview
• Overview of the NRM Emergency Preparedness – Statewide Spatial Analysis and Mapping project.
• Explanation of the project's goals, scope, and timeline.
3 Process to Access Data
• Presentation on the process for accessing relevant data for the identification and mapping of biodiversity assets and agricultural natural capital assets.
• Data layer sources.
4 Data Accessed and Used
• Overview of the types of data accessed and utilised in the development of a risk assessment model.
•
5 Priority Setting Method
• Explanation of the method used to prioritise risks and vulnerabilities in the NRM context.
Pat Groenhout
Pat Groenhout
Jeremy Wilson
Jeremy Wilson
Jeremy Wilson

• Presentation of the criteria and factors considered in prioritising NRM emergencies
6. Description of Draft Outputs
• Presentation of preliminary outputs.
Opportunity for Input
• Facilitated discussion to gather specific feedback on areas of interest or concern relating to the draft outputs.
7. Summary
• Wrap up and next steps
Jeremy Wilson

Stakeholder Company Section Date interviewed
Ashley Bastock Department of Natural Resources and Environment Agriculture, Forestry and Water 8/03/2024
Caroline Brown Department of Natural Resources and Environment Agriculture, Forestry and Water 8/03/2024
Luke Roberts Department of Premier and Cabinet State Planning Office / Resilience and Recovery Tasmania 29/02/2024
Claire Kain Department of State Growth Mineral Resources Tasmania 4/03/2024
Amy Koch Forest Practices Authority 18/03/2024
David Storey Department of Natural Resources and Environment Natural Values Atlas 14/03/2024
Kathryn Pugh City of Launceston 7/03/2024
Katy Edwards Department of Natural Resources and Environment Parks and Wildlife Service NRE Workshop 21 March 2024
Liv Espie Department of Natural Resources and Environment NRE Workshop 21 March 2024
Aaron Cashion Department of Natural Resources and Environment Emergency Services GIS NRE Workshop 21 March 2024
Chris Emms Department of Natural Resources and Environment Parks and Wildlife Service
Nepelle Crane NRM South
NRE Workshop 21 March 2024
NRM Workshop 18 March 2024
James Stronach NRM South NRM Workshop 18 March 2024
Todd Nation NRM South NRM Workshop 18 March 2024
Cindy Hull NRM South
Ben Slingsby NRM North
NRM Workshop 18 March 2024
NRM Workshop 18 March 2024
Andrew Baldwin NRM North NRM Workshop 18 March 2024
Ben Correy NRM Cradle Coast
Rebecca Kelly IsNRM
NRM Workshop 18 March 2024
NRM Workshop 18 March 2024

Appendix 4 – Modelled Range and Priority Ratings of Individual Biodiversity Natural Capital Assets
National Priority EPBC Listed Threatened Species





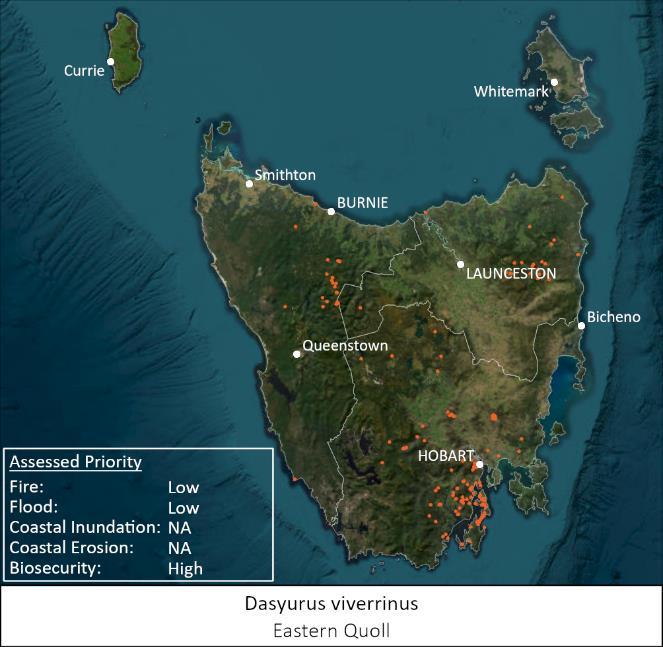
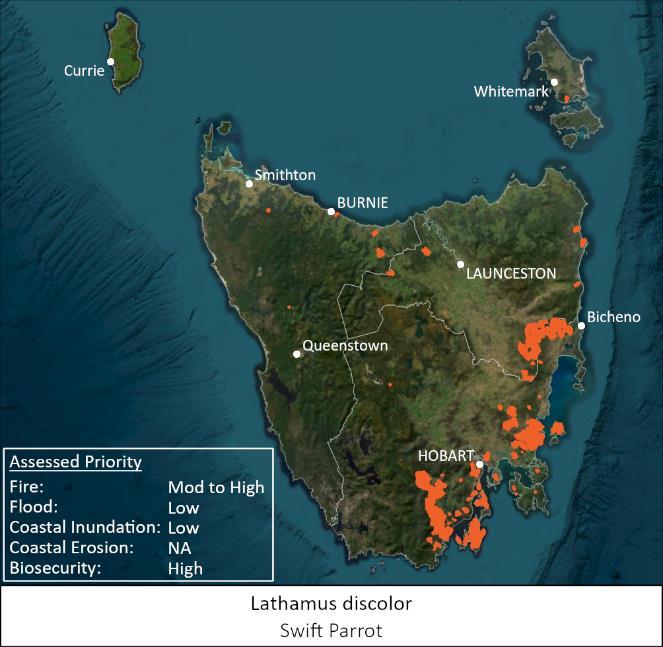


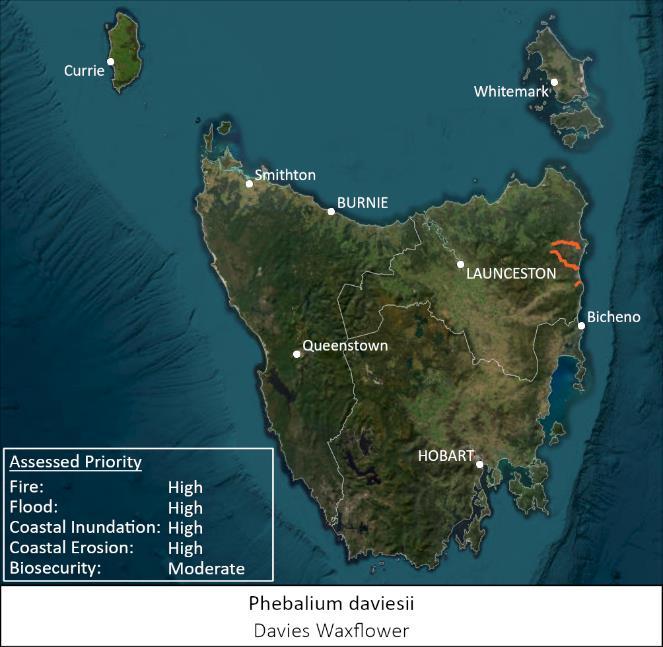


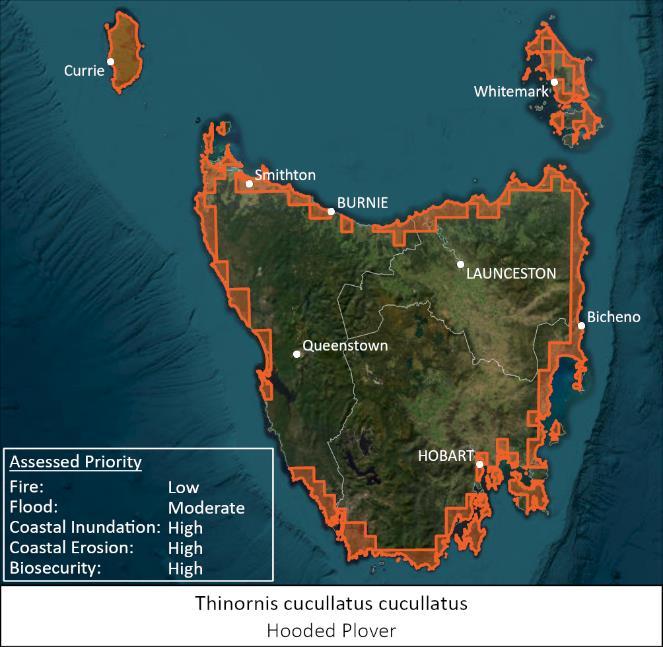

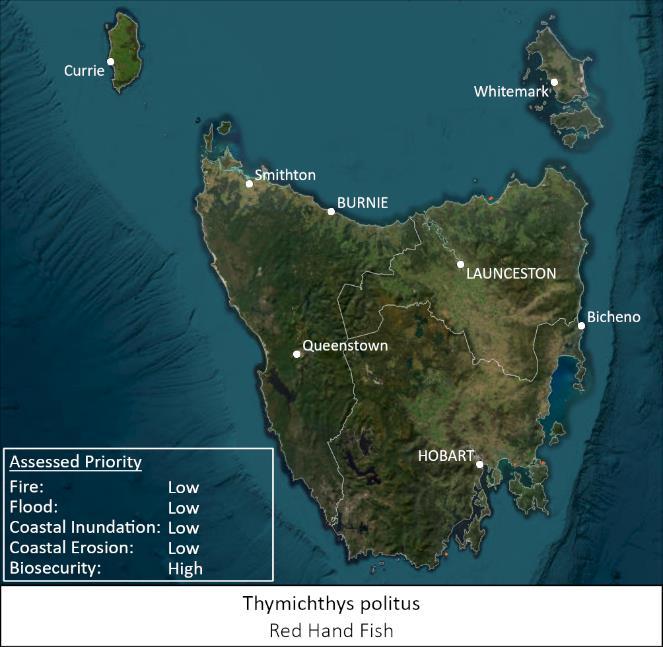
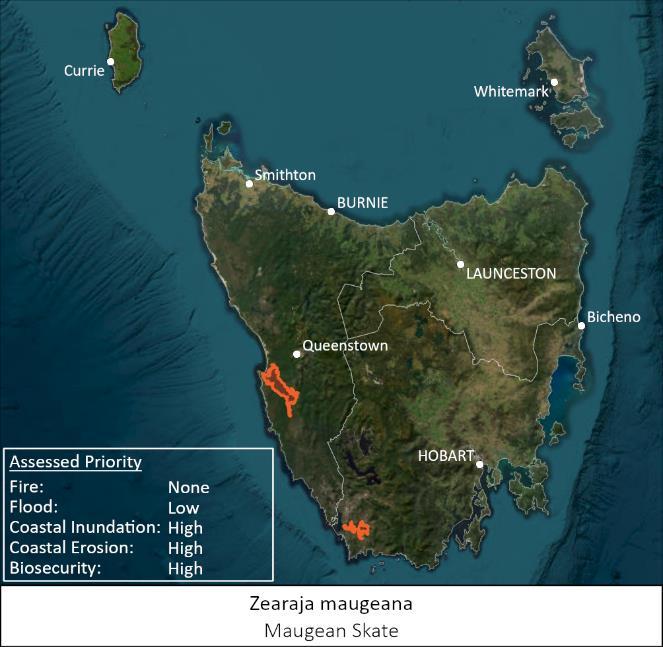
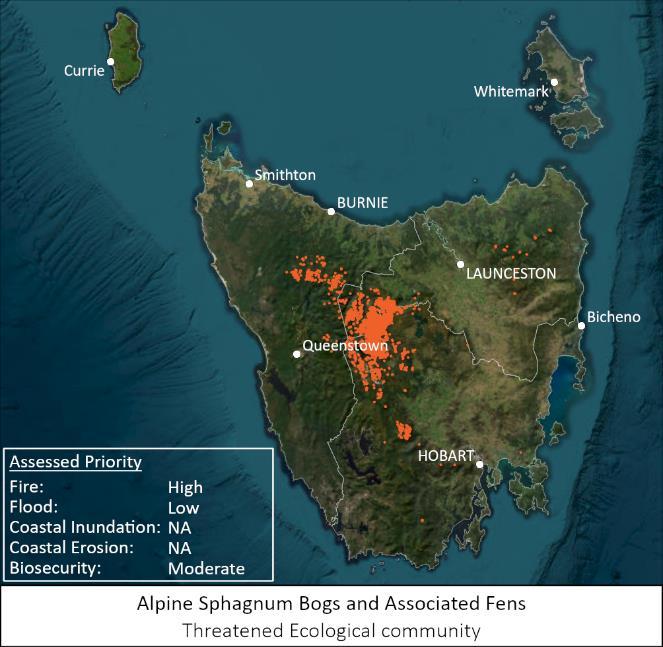

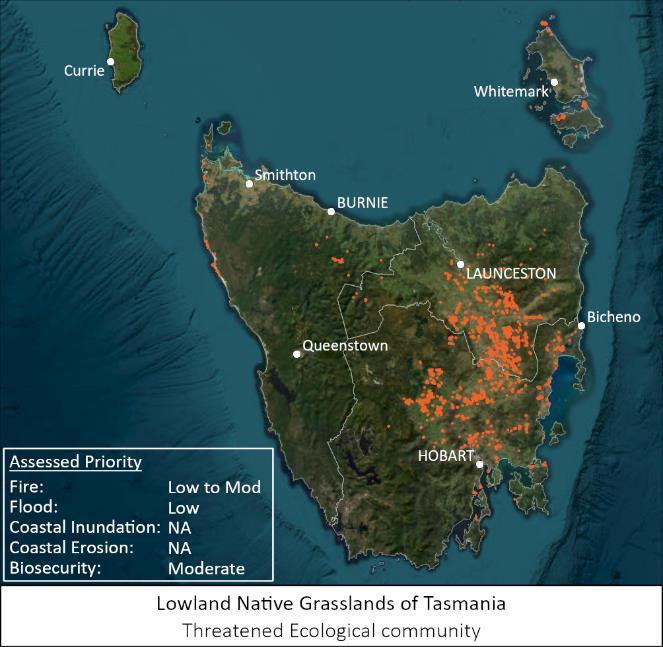

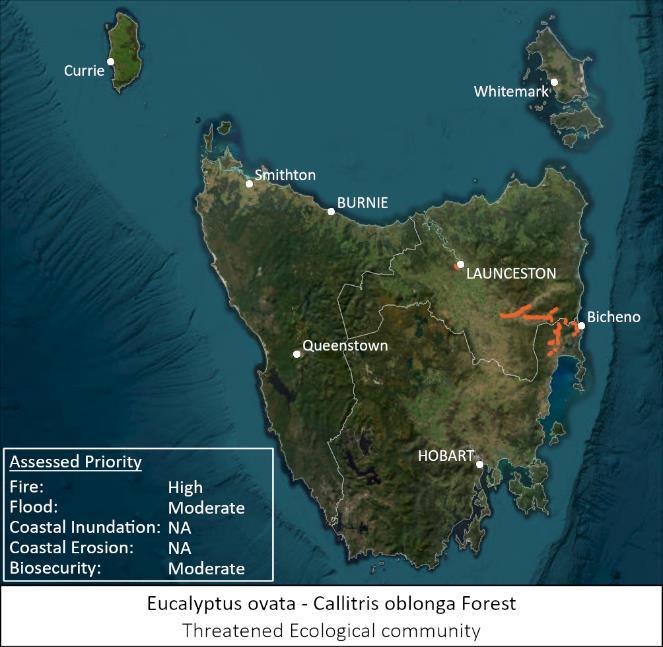


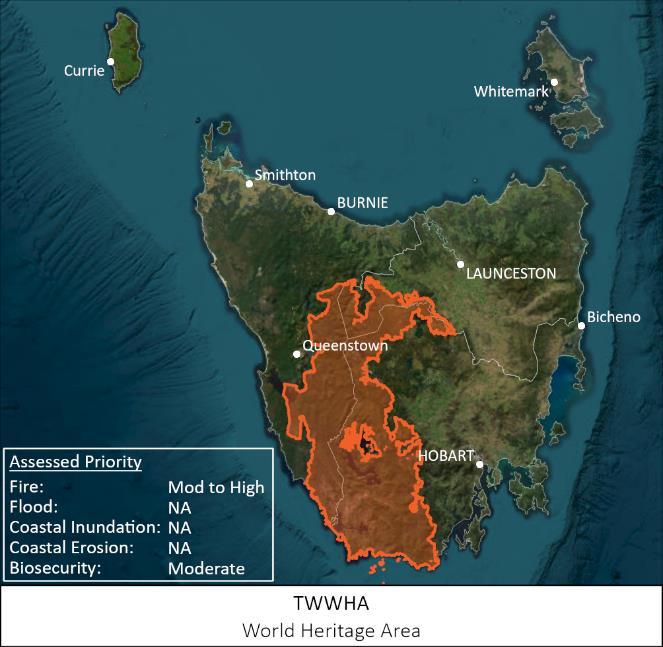
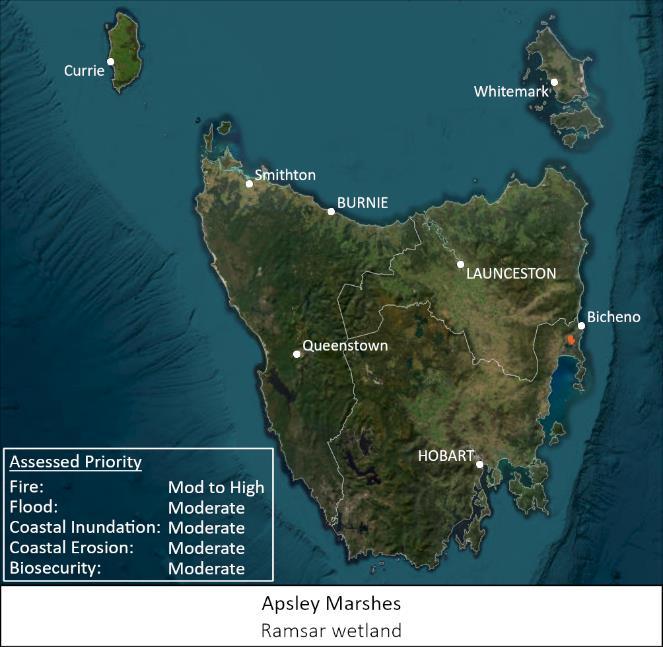


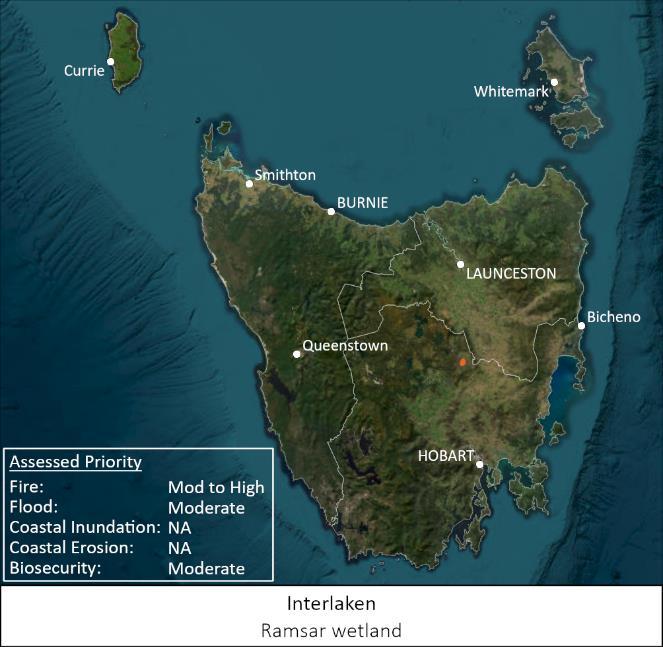


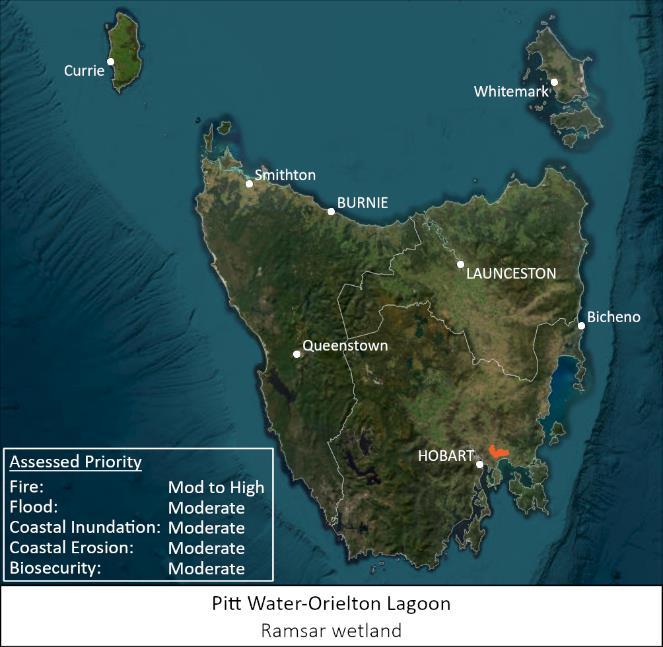
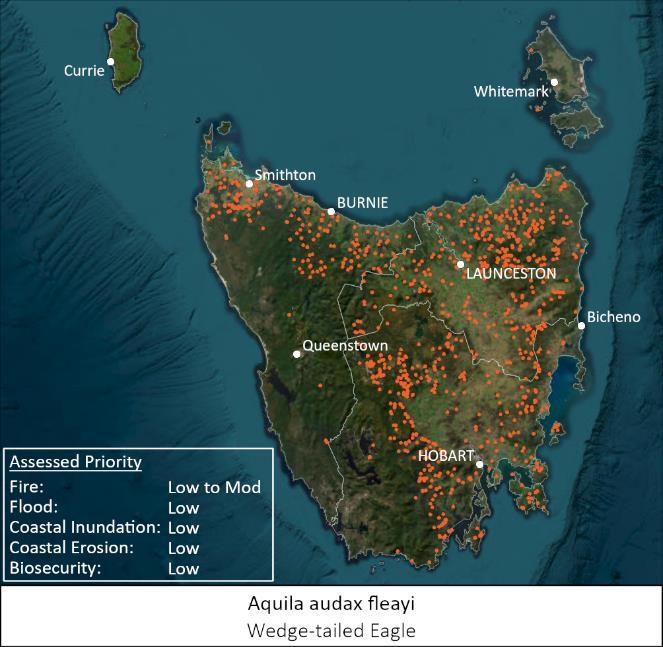
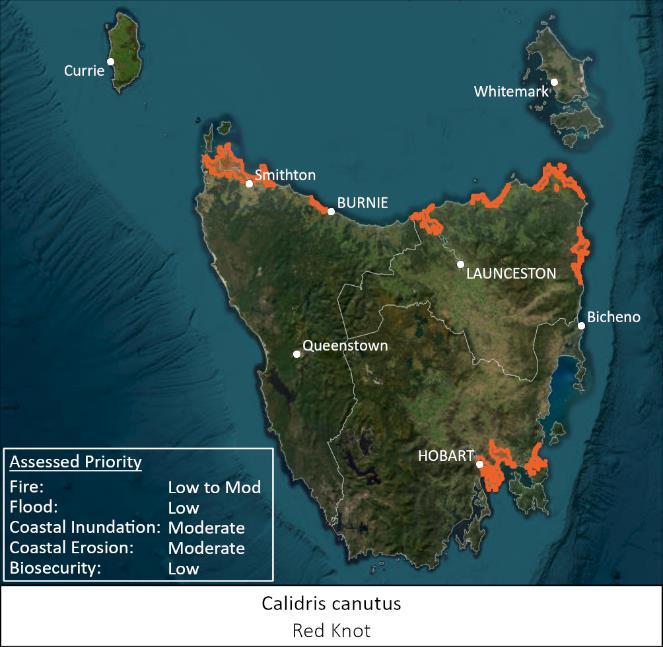
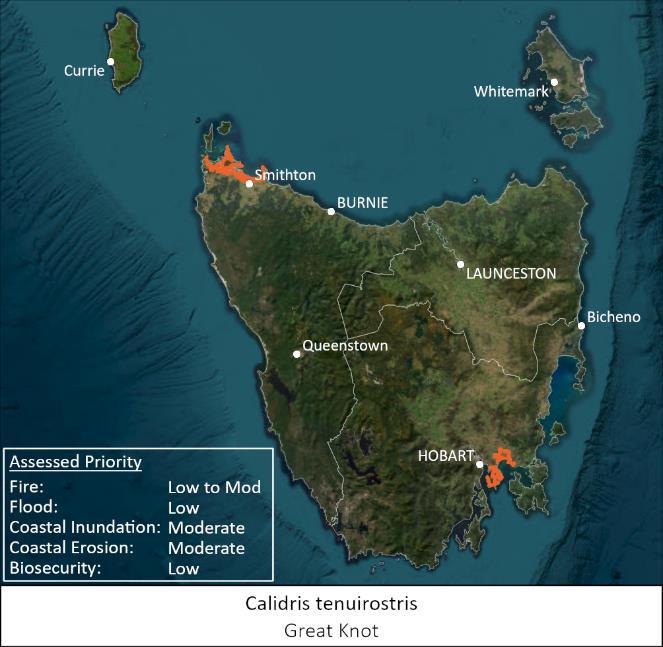


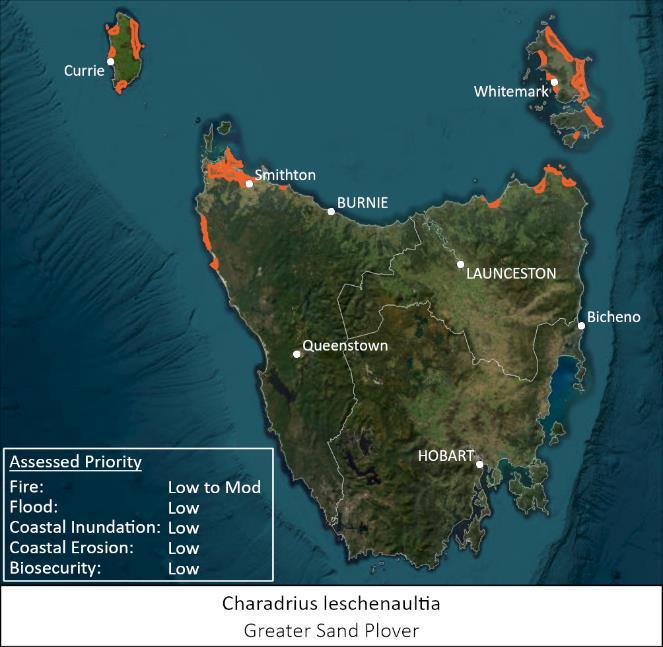
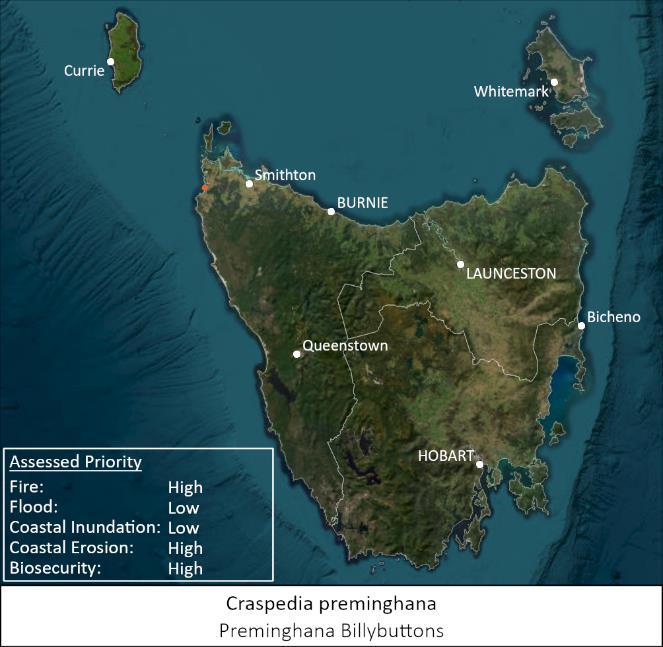
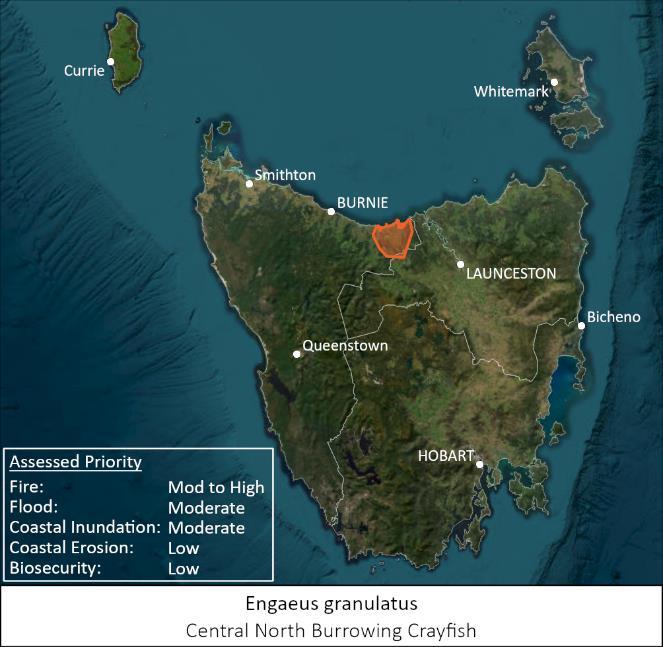

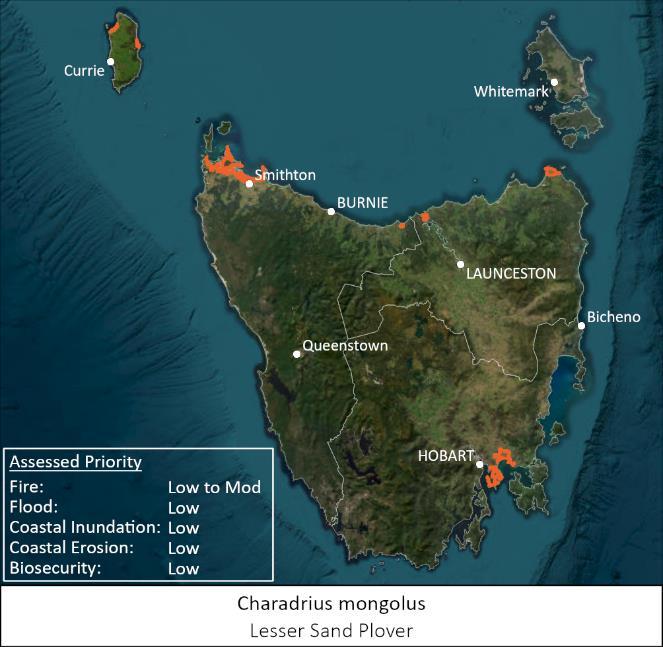
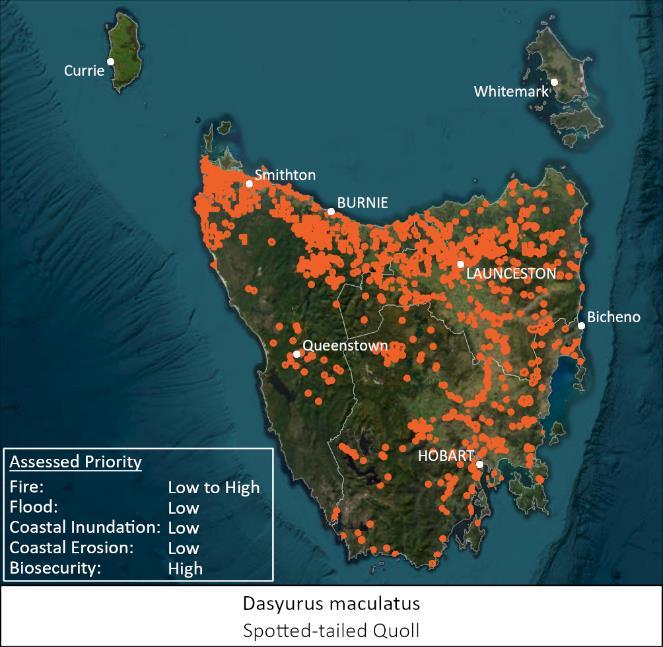


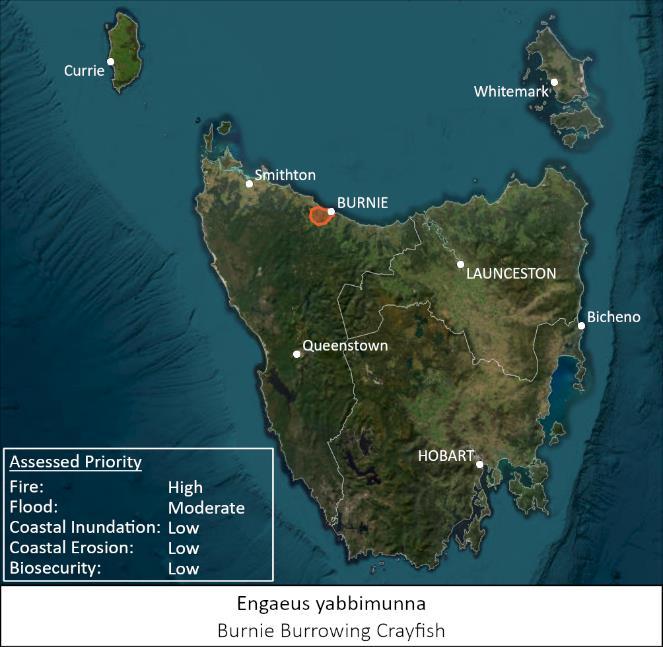


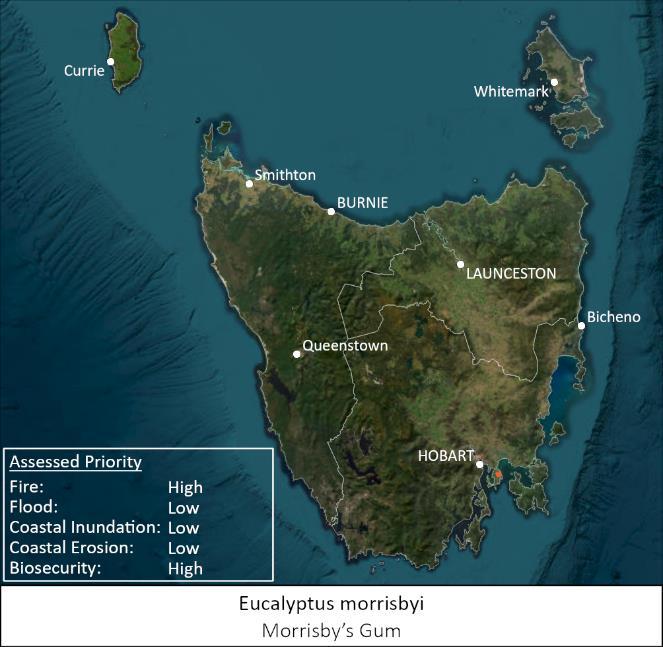
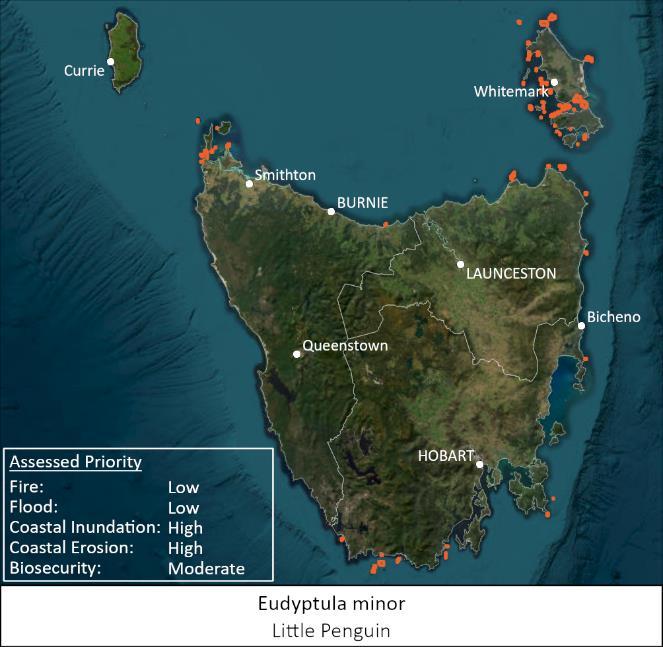

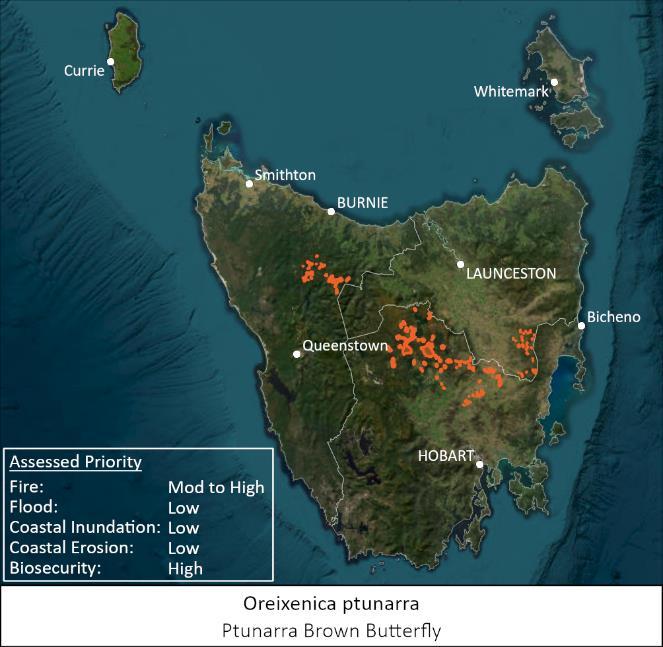

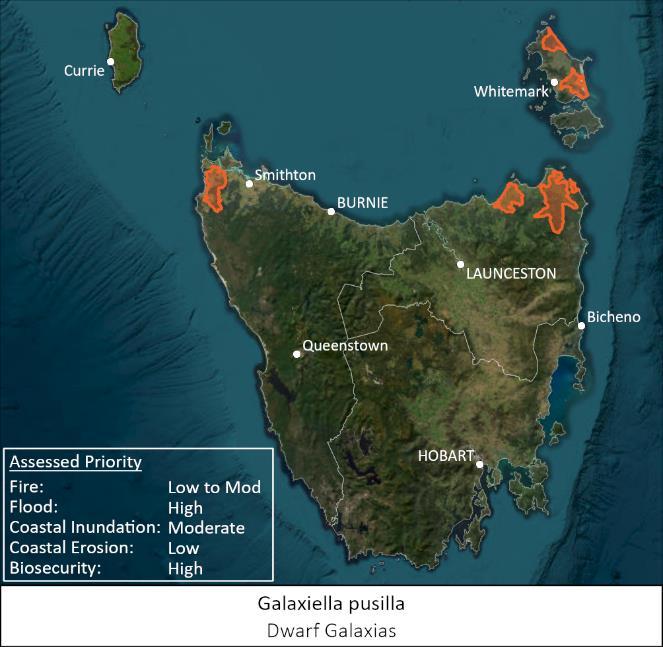


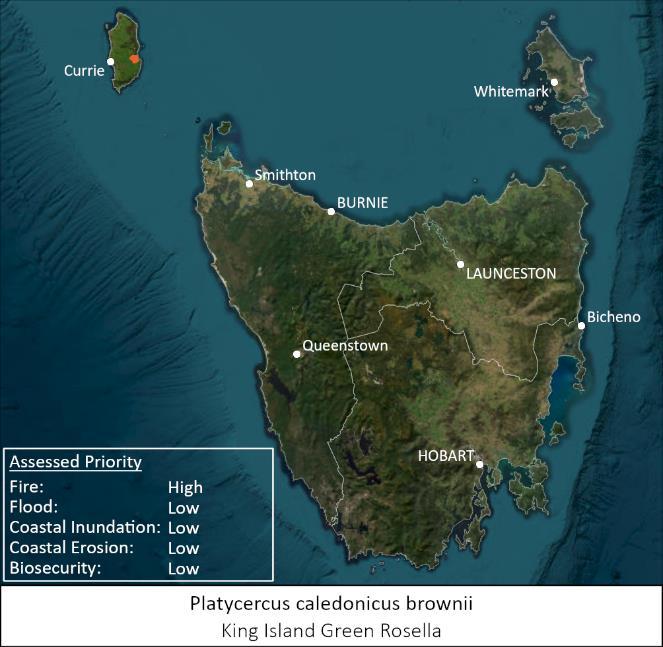

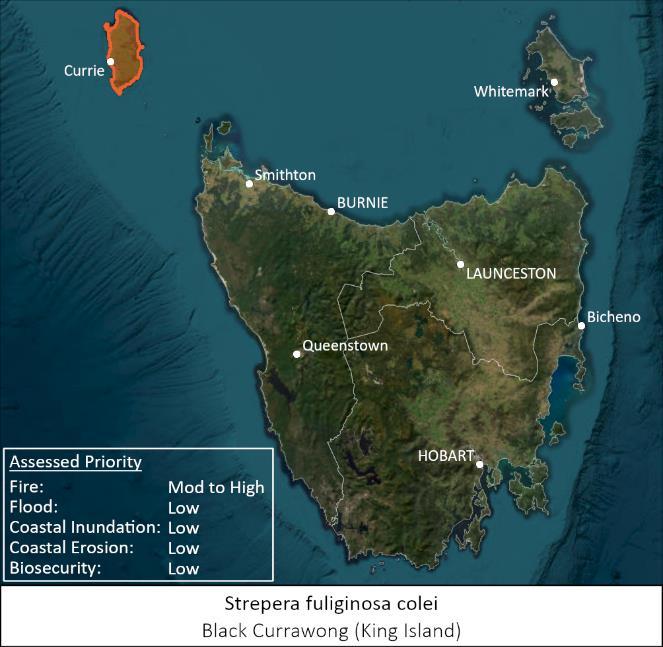

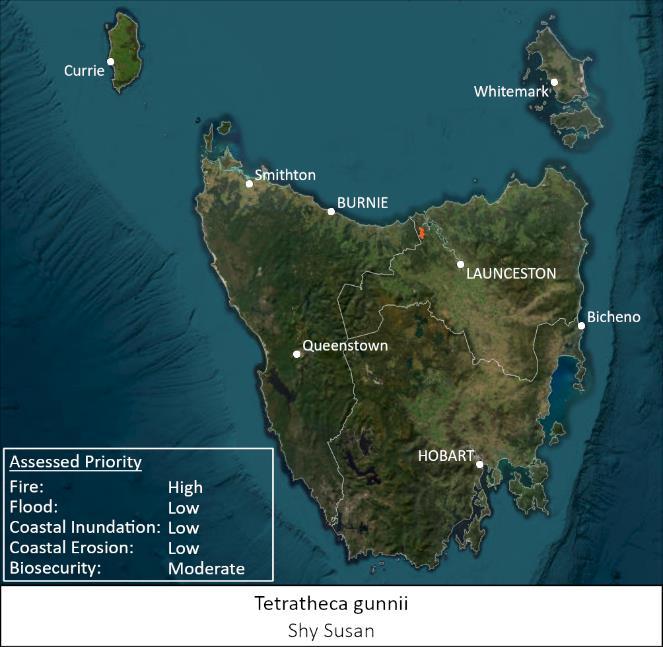
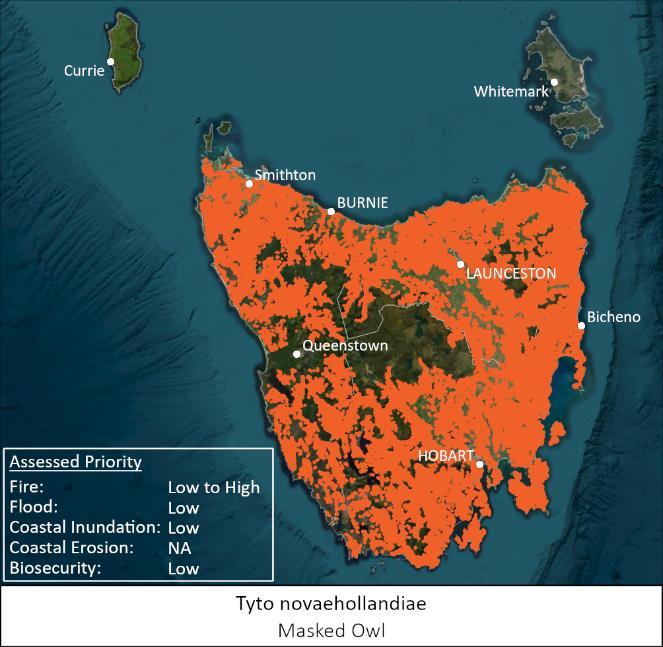

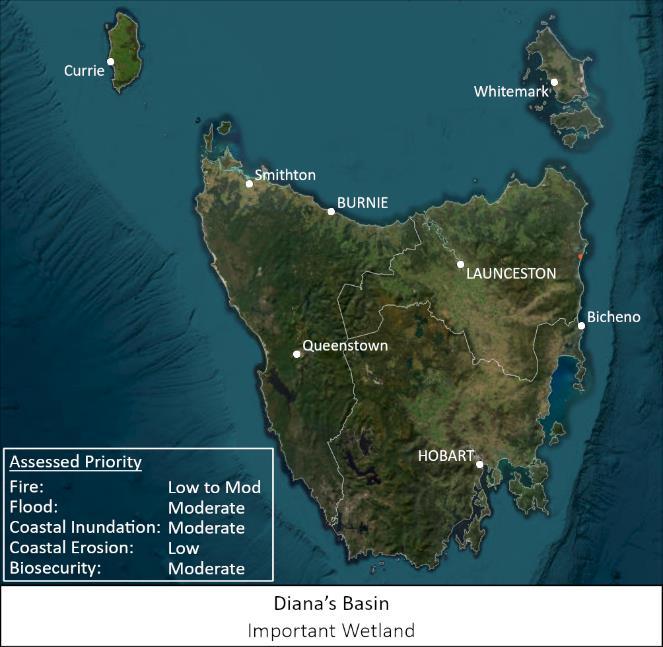

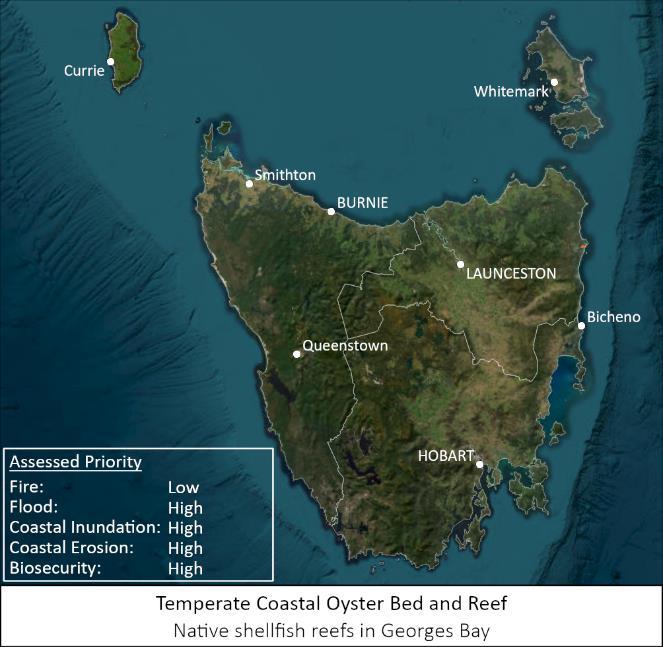






Official Name
Acanthiza pusilla magnirostris (Acanthiza pusilla subsp. archibaldi)
King Island Brown Thornbill
Eucalypt forest, woodland and teatree.
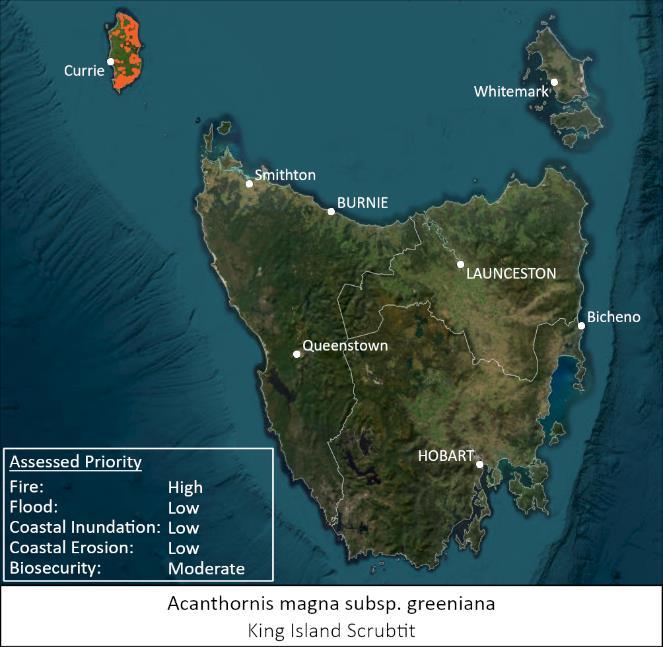
Acanthornis magna subsp. greeniana King Island Scrubtit
Ammoniropa vigens
Ammonite Snail
Wet sclerophyll forest and swamp forest and known sites vegetation community.
Using available Range Boundary Mapping and NVA Observations as a guide to likely habitat location, manually selected relevant TASVEG 4.0 communities (DGL, DKW, WGK, WGL, WVI, WOU, WOR, WOL, WOB, NME)
Using available Range Boundary Mapping and NVA Observations as a guide to likely habitat location, manually selected relevant manually selected TASVEG 4.0 communities (Wet eucalypt forest and woodland Veg Group, SMR and NME)
Forest Practices Authority (FPA) Range Boundary Mapping 2012
TASVEG 4.0 - The Digital Vegetation Map of Tasmania
https://www.naturalvalues atlas.tas.gov.au/
https://nre.tas.gov.au/cons ervation/developmentplanning-conservationassessment/planningtools/monitoring-andmapping-tasmaniasvegetation-(tasveg)/tasvegthe-digital-vegetation-mapof-tasmania
https://www.naturalvalues atlas.tas.gov.au/
Forest Practices Authority (FPA) Range Boundary Mapping 2012
TASVEG 4 - The Digital Vegetation Map of Tasmania
Astacopsis gouldi Giant Freshwater Crayfish
Dry and wet eucalypt forests on dolerite in the Hobart lowlands, below 400 m altitude. To date, the species has only been found under dolerite rocks.
Rivers and streams in the Arthur River catchment and all rivers. and streams flowing into Bass Strait except those of the Tamar River catchment and rivers east of Gladstone. Flowing and still waters mainly below about 400 m. in altitude, in all sizes of stream; the species can also occur in farm dams.
Botaurus poiciloptilus Australasia n Bittern Freshwater wetlands and, rarely, in estuaries or tidal wetlands.
100m buffer on existing observations
FPA Giant Freshwater Crayfish Habitat Suitability (High)
Natural Values Atlas (NVA) Observation Records 29/02/2024
TASVEG 4.0 - The Digital Vegetation Map of Tasmania
https://nre.tas.gov.au/cons ervation/developmentplanning-conservationassessment/planningtools/monitoring-andmapping-tasmaniasvegetation-(tasveg)/tasvegthe-digital-vegetation-mapof-tasmania
https://www.naturalvalues atlas.tas.gov.au/
https://nre.tas.gov.au/cons ervation/developmentplanning-conservationassessment/planningtools/monitoring-andmapping-tasmaniasvegetation-(tasveg)/tasvegthe-digital-vegetation-mapof-tasmania
Davies, Munks, Cook, Von Minden and Wilson (2007), Mapping Suitability of Habitat for the Giant Freshwater Crayfish, Astacopsis gouldi: Background Document To GIS Mapping Layer, Forest Practices Authority Scientiic Report 4.
Manually selected TASVEG 4.0 wetlands (Codes: ASF, AWU, AHF, AHL, AHS) which intersected with
TASVEG 4.0 - The Digital Vegetation Map of Tasmania
Species of National Environmental
https://fpa.tas.gov.au/Docu ments/ScientificReport4.pd f
https://nre.tas.gov.au/cons ervation/developmentplanning-conservationassessment/planningtools/monitoring-andmapping-tasmanias-
Official Name Descriptor
Habitat Description Advice
Galaxias fontanus Swan Galaxias
Methodology used to define Range Model
Species of National Environmental Significance (public grids)
For fire priority ranking, where the range intersected areas likely to fall outside the Tolerance Fire Interval in the event of a 2024 fire, their priority was increased by one ranking (i.e. Moderate -> High)
Open grassland (including farmland), tussock grassland, grassy woodland, dry eucalypt forest, coastal scrub and alpine heathland. Male territory 44ha, Female territory 35ha 400m buffer on existing observations (Sightings, Present, on or after 01/01/2014)
Occurs naturally only in the headwaters of the eastern-flowing Swan River above Hardings Falls (approximately 15 km due west of Bicheno) and tributaries of the northern-flowing Macquarie River (starting approximately 25 km west of Cranbrook and waters to the south).
The breeding range of the swift parrot is largely restricted to the east and southeast coast of Tasmania and closely mirrors the distribution of blue gum (Eucalyptus globulus). The species breeds in the north-west of the state between Launceston and Smithton, however, the number of birds involved and frequency of these breeding events is not well understood.

Data Source Reference
Significance Database
Tolerable Fire Intervals for TASVEG Communities, NRET, 2021
Data Source Link
vegetation-(tasveg)/tasvegthe-digital-vegetation-mapof-tasmania
https://www.dcceew.gov.a u/environment/environme ntal-informationdata/databasesapplications/snes
https://nre.tas.gov.au/Doc uments/Tolerable%20Fire% 20Intervals%20for%20TASV EG%20communities%20.pd f
Natural Values Atlas (NVA) Observation Records 29/02/2024
Forest Practices Authority (FPA) Range Boundary Mapping 2012
TASVEG 4.0 - The Digital Vegetation Map of Tasmania
CFEV Rivers intersecting with Species of National Environmental Significance (public grids) with a 20m buffer.
Conservation of Freshwater Ecosystem Values (CFEV) Data
Species of National Environmental Significance (public grids)
https://www.naturalvalues atlas.tas.gov.au/
https://listdata.thelist.tas.g ov.au/opendata/
Manually selected TASVEG 4.0 community with nest observation records (back to 1990) and appended STT Tasmania Swift Parrot Potential Nesting Habitat
For fire priority ranking, where the range intersected areas likely to fall outside the Tolerance Fire Interval in the event of a 2024 fire, their priority was increased by one
Natural Values Atlas (NVA) Observation Records 29/02/2024
TASVEG 4.0 - The Digital Vegetation Map of Tasmania
Tolerable Fire Intervals for TASVEG Communities, NRET, 2021
https://nre.tas.gov.au/wate r/water-monitoring-andassessment/cfevprogram/cfevresources#TheCFEVTechnic alReport
https://www.dcceew.gov.a u/environment/environme ntal-informationdata/databasesapplications/snes
https://www.naturalvalues atlas.tas.gov.au/
https://nre.tas.gov.au/cons ervation/developmentplanning-conservationassessment/planningtools/monitoring-andmapping-tasmaniasvegetation-(tasveg)/tasvegthe-digital-vegetation-mapof-tasmania
https://services.thelist.tas.g ov.au/arcgis/rest/services/ Public/NaturalEnvironment /MapServer/94
https://nre.tas.gov.au/Doc uments/Tolerable%20Fire%
Official Name Descriptor
Habitat Description Advice
Potential breeding habitat remaining in the northwest is scarce and highly fragmented.
Methodology used to define Range Model
ranking (i.e. Moderate -> High)

Data Source Reference
Litoria raniformis
Neophema chrysogaster
Growling Grass Frog or Green and Gold Bell Frog
Permanent freshwater lagoons. restricted to lowland areas, mainly in coastal zones with the exception of the Deloraine-LongfordLaunceston region, and historically it was common in the Midlands region.
Merged TASVEG 4.0 communities (ASF, AWU, AHF, AHL, AHS), CFEV wetlands and Hydrographic Area (Wetland ) that intersect with Range Boundary Mapping.
For fire priority ranking, where the range intersected areas likely to fall outside the Tolerance Fire Interval in the event of a 2024 fire, their priority was increased by one ranking (i.e. Low -> Moderate)
TASVEG 4.0 - The Digital Vegetation Map of Tasmania
Conservation of Freshwater Ecosystem Values (CFEV) Data
LIST Hydrographic Areas
Forest Practices Authority (FPA) Range Boundary Mapping 2012
Tolerable Fire Intervals for TASVEG Communities, NRET, 2021
Data Source Link
20Intervals%20for%20TASV EG%20communities%20.pd f
https://nre.tas.gov.au/cons ervation/developmentplanning-conservationassessment/planningtools/monitoring-andmapping-tasmaniasvegetation-(tasveg)/tasvegthe-digital-vegetation-mapof-tasmania
https://nre.tas.gov.au/wate r/water-monitoring-andassessment/cfevprogram/cfevresources#TheCFEVTechnic alReport
https://listdata.thelist.tas.g ov.au/public/LIST_Hydrogra phic_Information.pdf
https://www.naturalvalues atlas.tas.gov.au/
https://nre.tas.gov.au/Doc uments/Tolerable%20Fire% 20Intervals%20for%20TASV EG%20communities%20.pd f
Orangebellied Parrot
Salt marshes, coastal dunes, pastures, shrub lands, estuaries, islands, beaches and moorlands generally within 10 km of the coast.
The known breeding range of the Orange-bellied Parrot is mostly confined to nearcoastal areas of south-west Tasmania between Birchs Inlet, in Macquarie Harbour, and Louisa Bay on the southern coast. Most breeding activity occurs within 20 km of Melaleuca and 5 km of Birchs Inlet.
Nesting Habitat modelled using relevant TASVEG 4.0 communities (DNI, DNF, WNU, WNU, WNR) clipped to 20km around Melaleuca and 5km around Birchs Inlet
TASVEG 4.0 - The Digital Vegetation Map of Tasmania Species of National Environmental Significance Database Species of National Environmental Significance Database
https://www.dcceew.gov.a u/environment/environme ntal-informationdata/databasesapplications/snes https://nre.tas.gov.au/cons ervation/developmentplanning-conservationassessment/planningtools/monitoring-andmapping-tasmaniasvegetation-(tasveg)/tasvegthe-digital-vegetation-mapof-tasmania
Neophema chrysostoma Bluewinged Parrot
During the breeding season (spring and summer), birds occupy eucalypt forests and woodlands. Before migrating from Not Modelledrange too inaccurate
TASVEG 4.0 - The Digital Vegetation Map of Tasmania
Species of National Environmental Significance Database
https://www.dcceew.gov.a u/environment/environme ntal-informationdata/databasesapplications/snes
Official Name Descriptor
Habitat Description Advice
Tasmania in autumn, many birds congregate on saltmarshes and agricultural land before departing north.
Methodology used to define Range Model

Data Source Reference
Numenius madagascariensis Eastern Curlew
Sheltered intertidal sandflats or mudflats that are open and without vegetation or seagrass. Forages near mangroves, on saltflats or saltmarsh, around rockpools, amongst rubble on coral reefs, and on ocean beaches near the tideline. The species shows a preference for soft substrates containing little or no hard material.
Used Species of National Environmental Significance (public grids)
Species of National Environmental Significance Database
Data Source Link
Phebalium daviesii Davies Waxflower
Prasophyllum taphanyx Graveside Leek-orchid
One extant location consisting of two sites on the banks of the lower reaches of the George River near St. Helens. 3 consvervation plantings along Scamander River Stat Forest, Banticks Creek State Reserve, George River.
Single population in the Northern Midlands region. It grows in native grassland dominated by Kangaroo Grass (Themeda triandra) and Spear Grasses (Austrostipa spp.) on well drained basaltic loams.
50m buffer of Georges River, Scamander River and Banticks Creek based on Hydline.
GTL and GCL intersect within Species of National Environmental Significance (public grids)
LIST Hydrographic Lines
https://www.dcceew.gov.a u/environment/environme ntal-informationdata/databasesapplications/snes
TASVEG 4.0 - The Digital Vegetation Map of Tasmania
Species of National Environmental Significance (public grids)
https://listdata.thelist.tas.g ov.au/public/LIST_Hydrogra phic_Information.pdf
https://nre.tas.gov.au/cons ervation/developmentplanning-conservationassessment/planningtools/monitoring-andmapping-tasmaniasvegetation-(tasveg)/tasvegthe-digital-vegetation-mapof-tasmania
https://www.dcceew.gov.a u/environment/environme ntal-informationdata/databasesapplications/snes
Pseudomys novaehollandiae New Holland Mouse
Open heathlands, open woodlands with a heathland understorey and vegetated sand dunes.
Manually selected TASVEG 4.0 community with observation record. (Flinders Island Only).
TASVEG 4.0 - The Digital Vegetation Map of Tasmania
Natural Values Atlas (NVA) Observation Records 29/02/2024
https://nre.tas.gov.au/cons ervation/developmentplanning-conservationassessment/planningtools/monitoring-andmapping-tasmaniasvegetation-(tasveg)/tasvegthe-digital-vegetation-mapof-tasmania
Thinornis cucullatus cucullatus Hooded Plover
Ocean beaches, particularly wide beaches backed by dunes with large amounts of seaweed, creek
Used Species of National Environmental Significance (public grids)
Species of National Environmental Significance Database
https://www.dcceew.gov.a u/environment/environme ntal-informationdata/databasesapplications/snes
Official Name Descriptor
Habitat Description Advice
mouths and inlet entrances. It may also occur on nearcoastal saline and freshwater lakes and lagoons, tidal bays and estuaries, on rock platforms, or on rocky or sandy reefs close to shore.
Methodology

Data Source Reference
Thymichthys politus Red Hand Fish
Found in 0-2-m water depth. Once found across southeastern Tasmania, only two small populations of red handfish near Hobart now survive. They only produce 30-60 eggs at a time with females standing guard over them. The eggs are attached to standing structures and once hatched, the juveniles tend to remain close to the area where they were born. Juvenile hatchlings look similar to the adults.
(Source: https://fishing.tas.go v.au/species/handfis h-red).
Zearaja maugeana Maugean Skate
The species has only been recorded in two isolated estuaries in southwestern Tasmania, Macquarie Harbour and, to a lesser extent, Bathurst Harbour.
Observation records 100m buffer
Natural Values Atlas (NVA) Observation Records 29/02/2024
Data Source Link
Alpine Sphagnum Bogs and Associated Fens
Threatened Ecological community Sphagnum peatland
Used Hydrographic Area (Estuary) representing Macquarie Harbour and Bathurst Harbour
LIST Hydrographic Areas
https://www.naturalvalues atlas.tas.gov.au/
Used Ecological Communities of National Environmental Significance Distributions and relevant TASVEG 4.0 community (Codes: ASP)
Ecological Communities of National Environmental Significance (ECNES) Database
TASVEG 4.0 - The Digital Vegetation Map of Tasmania
https://listdata.thelist.tas.g ov.au/public/LIST_Hydrogra phic_Information.pdf
https://www.dcceew.gov.a u/environment/environme ntal-informationdata/databasesapplications/ecnes
https://nre.tas.gov.au/cons ervation/developmentplanning-conservationassessment/planningtools/monitoring-andmapping-tasmaniasvegetation-(tasveg)/tasvegthe-digital-vegetation-mapof-tasmania
Eucalyptus ovataCallitris oblonga Forest
Threatened Ecological community
Occurs along rivers in the Midlands and East Coast regions of Tasmania
Used Ecological Communities of National Environmental Significance Distributions
Ecological Communities of National Environmental Significance (ECNES) Database
https://www.dcceew.gov.a u/environment/environme ntal-informationdata/databasesapplications/ecnes
Official Name Descriptor
Habitat Description Advice
Dominated by black gum or Brookers gum (Eucalyptus ovata / E. brookeriana)
Eucalyptus ovata / Eucalyptus brookeriana Forests and Woodlands
Threatened Ecological community
ecological community is a type of eucalypt forest to woodland that is restricted to Tasmania and is associated with sites that are typically damp and/or poorly draining.
Methodology used to define Range Model
Used Ecological Communities of National Environmental Significance Distributions and TASVEG 4.0 (Codes: DOV, DOW, WBR)
For fire priority ranking, where the range intersected areas likely to fall outside the Tolerance Fire Interval in the event of a 2024 fire, their priority was increased by one ranking (i.e. Moderate -> High)

Data Source Reference Data Source Link
Ecological Communities of National Environmental Significance (ECNES) Database
TASVEG 4.0 - The Digital Vegetation Map of Tasmania
Tolerable Fire Intervals for TASVEG Communities, NRET, 2021
https://www.dcceew.gov.a u/environment/environme ntal-informationdata/databasesapplications/ecnes
https://nre.tas.gov.au/cons ervation/developmentplanning-conservationassessment/planningtools/monitoring-andmapping-tasmaniasvegetation-(tasveg)/tasvegthe-digital-vegetation-mapof-tasmania
https://nre.tas.gov.au/Doc uments/Tolerable%20Fire% 20Intervals%20for%20TASV EG%20communities%20.pd f
Giant Kelp Marine Forests of South East Australia
Threatened Ecological community
Kelp forests are shallow coastal ecological communities of cold water regions organised around the structure and productivity of members of the order Laminariales
Lowland Native Grasslands of Tasmania
Threatened Ecological community
Used Ecological Communities of National Environmental Significance Distributions
Ecological Communities of National Environmental Significance (ECNES) Database
https://www.dcceew.gov.a u/environment/environme ntal-informationdata/databasesapplications/ecnes
Subtropical & Temperate Coastal Saltmarsh Threatened Ecological community
Lowland Temperate Grasslands of Tasmania. The ecological community is comprised of two major sub-types differentiated by the dominant native tussock-forming perennial grass species: Lowland Poa labillardierei (Silver Tussock Grass) Grassland and Lowland Themeda triandra (Kangaroo Grass) Grassland
Consists mainly of salt-tolerant vegetation (halophytes) including: grasses, herbs, sedges, rushes and shrubs in the intertidal zone and commonly occurs in association with estuaries.
Used Ecological Communities of National Environmental Significance Distributions; and TASVEG 4.0 (Codes: GPL, GTL)
For fire priority ranking, where the range intersected areas likely to fall outside the Tolerance Fire Interval in the event of a 2024 fire, their priority was increased by one ranking (i.e. Low -> Moderate)
Used Ecological Communities of National Environmental Significance Distributions and TASVEG (Codes: AHS, ARS, ASS, AUS)
For fire priority ranking, where the range intersected areas likely to fall outside the Tolerance Fire
Ecological Communities of National Environmental Significance (ECNES) Database
TASVEG 4.0 - The Digital Vegetation Map of Tasmania
https://www.dcceew.gov.a u/environment/environme ntal-informationdata/databasesapplications/ecnes
https://nre.tas.gov.au/cons ervation/developmentplanning-conservationassessment/planningtools/monitoring-andmapping-tasmaniasvegetation-(tasveg)/tasvegthe-digital-vegetation-mapof-tasmania
https://nre.tas.gov.au/Doc uments/Tolerable%20Fire% 20Intervals%20for%20TASV EG%20communities%20.pd f
Ecological Communities of National Environmental Significance (ECNES) Database
TASVEG 4.0 - The Digital Vegetation Map of Tasmania
Tolerable Fire Intervals for TASVEG Communities, NRET, 2021
https://www.dcceew.gov.a u/environment/environme ntal-informationdata/databasesapplications/ecnes
https://nre.tas.gov.au/cons ervation/developmentplanning-conservationassessment/planningtools/monitoring-andmapping-tasmaniasvegetation-(tasveg)/tasvegthe-digital-vegetation-mapof-tasmania
Official Name Descriptor
Habitat Description Advice
Tasmanian White Gum (Eucalyptus viminalis) Wet Forest
Threatened Ecological community
A wet sclerophyll forest with a canopy dominated by Eucalyptus viminalis and an understorey generally comprised of broad-leaved shrubs and ferns, occurring mainly on fertile, well-drained sites in the north of the state.
Island Bruny Island Island
Midlands Priority Place Identified priority place NA
Midlands Biodiversity Hotspot Identified priority place NA
TWWHA World Heritage Area NA
Methodology used to define Range Model
Interval in the event of a 2024 fire, their priority was increased by one ranking (i.e. Low -> Moderate)
Used relevant TASVEG 4.0 communities (Codes: WVI, DVF)
For fire priority ranking, where the range intersected areas likely to fall outside the Tolerance Fire Interval in the event of a 2024 fire, their priority was increased by one ranking (i.e. Moderate -> High)

Data Source Reference
Removed modified land from TASVEG and clipped to Bruny Island coastline
TASVEG 4.0 - The Digital Vegetation Map of Tasmania
Tolerable Fire Intervals for TASVEG Communities, NRET, 2021
Data Source Link
https://nre.tas.gov.au/Doc uments/Tolerable%20Fire% 20Intervals%20for%20TASV EG%20communities%20.pd f
https://nre.tas.gov.au/cons ervation/developmentplanning-conservationassessment/planningtools/monitoring-andmapping-tasmaniasvegetation-(tasveg)/tasvegthe-digital-vegetation-mapof-tasmania
https://nre.tas.gov.au/Doc uments/Tolerable%20Fire% 20Intervals%20for%20TASV EG%20communities%20.pd f
https://listdata.thelist.tas.g ov.au/public/LIST_Hydrogra phic_Information.pdf
LIST Hydrographic Lines
Removed modified land from TASVEG and clipped to priority place boundary
Removed modified land from TASVEG and clipped to provided boundary
Used TWWWHA boundary to prioritise vegetation communities within the area based on vulnerability to threat.
For fire priority ranking, where the range intersected
Digitised boundary using DCCEEW image
https://nre.tas.gov.au/cons ervation/developmentplanning-conservationassessment/planningtools/monitoring-andmapping-tasmaniasvegetation-(tasveg)/tasvegthe-digital-vegetation-mapof-tasmania
https://www.dcceew.gov.a u/environment/biodiversity /threatened/strategy/priori ty-places/midlands-regioncentral-tasmania#toc_1 https://nre.tas.gov.au/cons ervation/developmentplanning-conservationassessment/planningtools/monitoring-andmapping-tasmaniasvegetation-(tasveg)/tasvegthe-digital-vegetation-mapof-tasmania
https://www.researchgate. net/publication/263487652
Supplied by NRM's
https://www.bushheritage. org.au/newsletters/2017/w inter/biodiversity-hotspot
LIST Tasmanian Wilderness World Heritage Area
Tolerable Fire Intervals for TASVEG Communities, NRET, 2021
https://listdata.thelist.tas.g ov.au/public/LIST%20World _Heritage_Area_informatio n.pdf
https://nre.tas.gov.au/Doc uments/Tolerable%20Fire% 20Intervals%20for%20TASV EG%20communities%20.pd f
Official Name Descriptor
Habitat Description Advice
Apsley Marshes Ramsar wetland Wetland
Methodology used to define Range Model
areas likely to fall outside the Tolerance Fire Interval in the event of a 2024 fire, their priority was increased by one ranking (i.e. Moderate -> High)
Used Ramsar Wetland Boundary
For fire priority ranking, where the range intersected areas likely to fall outside the Tolerance Fire Interval in the event of a 2024 fire, their priority was increased by one ranking (i.e. Moderate -> High)
Used Ramsar Wetland Boundary
Data Source Reference

Data Source Link
East Coast Cape Barren Island Lagoons Ramsar wetland Wetland
Flood Plain Lower Ringarooma River Ramsar wetland Wetland
LIST Ramsar Wetlands
Tolerable Fire Intervals for TASVEG Communities, NRET, 2021
https://www.thelist.tas.gov .au/app/content/data/geometa-datarecord?detailRecordUID=f9 d3f371-fc97-47cc-a80056d35ce67ea5
https://nre.tas.gov.au/Doc uments/Tolerable%20Fire% 20Intervals%20for%20TASV EG%20communities%20.pd f
Interlaken Ramsar wetland Wetland
For fire priority ranking, where the range intersected areas likely to fall outside the Tolerance Fire Interval in the event of a 2024 fire, their priority was increased by one ranking (i.e. Moderate -> High)
Used Ramsar Wetland Boundary
For fire priority ranking, where the range intersected areas likely to fall outside the Tolerance Fire Interval in the event of a 2024 fire, their priority was increased by one ranking (i.e. Moderate -> High)
Used Ramsar Wetland Boundary
For fire priority ranking, where the range intersected areas likely to fall outside the Tolerance Fire Interval in the event of a 2024 fire, their priority was increased by one
LIST Ramsar Wetlands
Tolerable Fire Intervals for TASVEG Communities, NRET, 2021
https://www.thelist.tas.gov .au/app/content/data/geometa-datarecord?detailRecordUID=f9 d3f371-fc97-47cc-a80056d35ce67ea5
https://nre.tas.gov.au/Doc uments/Tolerable%20Fire% 20Intervals%20for%20TASV EG%20communities%20.pd f
Jocks Lagoon Ramsar wetland Wetland
Methodology
ranking (i.e. Moderate -> High)

Lavinia Ramsar wetland Wetland
Used Ramsar Wetland Boundary
For fire priority ranking, where the range intersected areas likely to fall outside the Tolerance Fire Interval in the event of a 2024 fire, their priority was increased by one ranking (i.e. Moderate -> High)
Used Ramsar Wetland Boundary
For fire priority ranking, where the range intersected areas likely to fall outside the Tolerance Fire Interval in the event of a 2024 fire, their priority was increased by one ranking (i.e. Moderate -> High)
Used Ramsar Wetland Boundary
LIST Ramsar Wetlands
Tolerable Fire Intervals for TASVEG Communities, NRET, 2021
https://www.thelist.tas.gov .au/app/content/data/geometa-datarecord?detailRecordUID=f9 d3f371-fc97-47cc-a80056d35ce67ea5
https://nre.tas.gov.au/Doc uments/Tolerable%20Fire% 20Intervals%20for%20TASV EG%20communities%20.pd f
Little Waterhouse Lake Ramsar wetland Wetland
Logan Lagoon Ramsar wetland Wetland
For fire priority ranking, where the range intersected areas likely to fall outside the Tolerance Fire Interval in the event of a 2024 fire, their priority was increased by one ranking (i.e. Moderate -> High)
Used Ramsar Wetland Boundary
For fire priority ranking, where the range intersected areas likely to fall outside the Tolerance Fire Interval in the event of a 2024 fire, their priority was increased by one ranking (i.e. Moderate -> High)
LIST Ramsar Wetlands
Tolerable Fire Intervals for TASVEG Communities, NRET, 2021
https://www.thelist.tas.gov .au/app/content/data/geometa-datarecord?detailRecordUID=f9 d3f371-fc97-47cc-a80056d35ce67ea5
https://nre.tas.gov.au/Doc uments/Tolerable%20Fire% 20Intervals%20for%20TASV EG%20communities%20.pd f
Moulting Lagoon Ramsar wetland Wetland
Pitt Water-
Orielton Lagoon Ramsar wetland Wetland

Used Ramsar Wetland Boundary
For fire priority ranking, where the range intersected areas likely to fall outside the Tolerance Fire Interval in the event of a 2024 fire, their priority was increased by one ranking (i.e. Moderate -> High)
Used Ramsar Wetland Boundary
For fire priority ranking, where the range intersected areas likely to fall outside the Tolerance Fire Interval in the event of a 2024 fire, their priority was increased by one ranking (i.e. Moderate -> High)
Used known present nests NVA records after 01/01/2014 buffered by 500m to represent potential nesting habitat
LIST Ramsar Wetlands
Tolerable Fire Intervals for TASVEG Communities, NRET, 2021
https://www.thelist.tas.gov .au/app/content/data/geometa-datarecord?detailRecordUID=f9 d3f371-fc97-47cc-a80056d35ce67ea5
https://nre.tas.gov.au/Doc uments/Tolerable%20Fire% 20Intervals%20for%20TASV EG%20communities%20.pd f
Aquila audax fleayi Wedgetailed Eagle
Wide range of habitats, from the coast to highland areas.
Bettongia gaimardi Eastern Bettong
Dry open eucalypt forests and grassy woodlands eastern half of Tasmania, including Maria and Bruny islands
Intertidal mudflats, sandflats, and sandy beaches of sheltered coasts, estuaries, bays, inlets, lagoons, and harbours.
For fire priority ranking, where the range intersected areas likely to fall outside the Tolerance Fire Interval in the event of a 2024 fire, their priority was increased by one ranking (i.e. Low -> Moderate)
Used NVA observation records with 100m buffer
Used Species of National Environmental Significance (public grids)
For fire priority ranking, where the range intersected areas likely to fall outside the Tolerance Fire
Natural Values Atlas (NVA) Observation Records 29/02/2024
Tolerable Fire Intervals for TASVEG Communities, NRET, 2021
https://www.naturalvalues atlas.tas.gov.au/
https://nre.tas.gov.au/Doc uments/Tolerable%20Fire% 20Intervals%20for%20TASV EG%20communities%20.pd f
Natural Values Atlas (NVA) Observation Records 29/02/2024
Species of National Environmental Significance Database
Tolerable Fire Intervals for TASVEG Communities, NRET, 2021
https://www.naturalvalues atlas.tas.gov.au/
https://www.dcceew.gov.a u/environment/environme ntal-informationdata/databasesapplications/snes
https://nre.tas.gov.au/Doc uments/Tolerable%20Fire% 20Intervals%20for%20TASV EG%20communities%20.pd f
Official Name Descriptor
Habitat Description Advice
Calidris ferruginea Curlew Sandpiper Intertidal mudflats
Methodology used to define Range Model
Interval in the event of a 2024 fire, their priority was increased by one ranking (i.e. Low -> Moderate)
Used Species of National Environmental Significance (public grids)
For fire priority ranking, where the range intersected areas likely to fall outside the Tolerance Fire Interval in the event of a 2024 fire, their priority was increased by one ranking (i.e. Low -> Moderate)
Used Species of National Environmental Significance (public grids)
Data Source Reference

Data Source Link
Calidris tenuirostris Great Knot Intertidal mudflats
Species of National Environmental Significance Database
Tolerable Fire Intervals for TASVEG Communities, NRET, 2021
https://www.dcceew.gov.a u/environment/environme ntal-informationdata/databasesapplications/snes
https://nre.tas.gov.au/Doc uments/Tolerable%20Fire% 20Intervals%20for%20TASV EG%20communities%20.pd f
Ceyx azureus subsp. diemenensis Tasmanian Azure Kingfisher Riparian vegetation
For fire priority ranking, where the range intersected areas likely to fall outside the Tolerance Fire Interval in the event of a 2024 fire, their priority was increased by one ranking (i.e. Low -> Moderate)
Used Specific habitat requirements too broad to model at this stage.
Used Species of National Environmental Significance (public grids)
Species of National Environmental Significance Database
Tolerable Fire Intervals for TASVEG Communities, NRET, 2021
https://www.dcceew.gov.a u/environment/environme ntal-informationdata/databasesapplications/snes
https://nre.tas.gov.au/Doc uments/Tolerable%20Fire% 20Intervals%20for%20TASV EG%20communities%20.pd f
Species of National Environmental Significance Database
Charadrius leschenaultia Greater Sand Plover Littoral and estuarine habitats.
For fire priority ranking, where the range intersected areas likely to fall outside the Tolerance Fire Interval in the event of a 2024 fire, their priority was increased by one ranking (i.e. Low -> Moderate)
Species of National Environmental Significance Database
Tolerable Fire Intervals for TASVEG Communities, NRET, 2021
https://www.dcceew.gov.a u/environment/environme ntal-informationdata/databasesapplications/snes
https://www.dcceew.gov.a u/environment/environme ntal-informationdata/databasesapplications/snes
https://nre.tas.gov.au/Doc uments/Tolerable%20Fire% 20Intervals%20for%20TASV EG%20communities%20.pd f
Official Name Descriptor
Habitat Description Advice
Charadrius mongolus Lesser Sand Plover Littoral and estuarine habitats.
Methodology used to define Range Model
Used Species of National Environmental Significance (public grids)
For fire priority ranking, where the range intersected areas likely to fall outside the Tolerance Fire Interval in the event of a 2024 fire, their priority was increased by one ranking (i.e. Low -> Moderate)
Data Source Reference

Data Source Link
Craspedia preminghana
Premingha na Billybuttons
Dasyurus maculatus Spottedtailed Quoll
Mt Cameron West, steep basalt cliffs with coastal vegetation including Correa backhousiana, Alyxia buxifolia and Urtica incise
Range of habitats throughout mainland Tasmania
Used Range Boundary Mapping
Species of National Environmental Significance Database
Tolerable Fire Intervals for TASVEG Communities, NRET, 2021
https://www.dcceew.gov.a u/environment/environme ntal-informationdata/databasesapplications/snes
https://nre.tas.gov.au/Doc uments/Tolerable%20Fire% 20Intervals%20for%20TASV EG%20communities%20.pd f
Forest Practices Authority (FPA) Range Boundary Mapping 2012
Used Species of National Environmental Significance (public grids) to defined core range, appended with NVA Observation records after 01/01/2014 buffered by 1.8km (average of 2sqkm to 5sqkm range).
For fire priority ranking, where the core range intersected areas likely to fall outside the Tolerance Fire Interval in the event of a 2024 fire, their priority was increased by one ranking (i.e. Moderate -> High). All buffered NVA records were kept as Low.
Used Range Boundary Mapping
Species of National Environmental Significance Database
Tolerable Fire Intervals for TASVEG Communities, NRET, 2021
https://www.naturalvalues atlas.tas.gov.au/
https://www.dcceew.gov.a u/environment/environme ntal-informationdata/databasesapplications/snes
https://nre.tas.gov.au/Doc uments/Tolerable%20Fire% 20Intervals%20for%20TASV EG%20communities%20.pd f
Engaeus granulatus
Central North Burrowing Crayfish
Seeps, wetlands and stream banks in central north Tasmania
For fire priority ranking, where the range intersected areas likely to fall outside the Tolerance Fire Interval in the event of a 2024 fire, their priority was increased by one
Forest Practices Authority (FPA) Range Boundary Mapping 2012
Tolerable Fire Intervals for TASVEG Communities, NRET, 2021 https://www.naturalvalues atlas.tas.gov.au/
https://nre.tas.gov.au/Doc uments/Tolerable%20Fire% 20Intervals%20for%20TASV EG%20communities%20.pd f
Official Name Descriptor
Habitat Description Advice
Methodology used to define Range Model

Data Source Reference
Data Source Link ranking (i.e. Moderate -> High)
Engaeus martigener
Engaeus orramakunna
Furneaux Burrowing Crayfish
Engaeus spinicaudatus
Mount Arthur Burrowing Crayfish
Boggy areas and small clear water creeks in high altitude wet ferny gullies. The Furneaux burrowing crayfish is only found on Flinders Island and Cape Barren Island in the Bass Strait.
Variety of habitats, including undisturbed rainforests, eucalypts forests, open pastures, cattle-trampled pastures and roadside gutters.
Used Range Boundary Mapping
Forest Practices Authority (FPA) Range Boundary Mapping 2012
Used Range Boundary Mapping
For fire priority ranking, where the range intersected areas likely to fall outside the Tolerance Fire Interval in the event of a 2024 fire, their priority was increased by one ranking (i.e. Moderate -> High)
Forest Practices Authority (FPA) Range Boundary Mapping 2012
https://www.naturalvalues atlas.tas.gov.au/
Scottsdale Burrowing Crayfish
Variety of habitats, including Gymnoschoenus sphaerocephalus (wet buttongrass) and heathy plains (particularly with peaty and saturated soils), surface seepages, the floodplains of creeks (often with scrubby or taller tea-tree vegetation), wet areas converted to pasture from any of the preceding habitat types, and some creek banks in open dry eucalypt forest
Used Range Boundary Mapping
Engaeus yabbimunna Burnie Burrowing Crayfish
Fern-dominated stream-side vegetation as well as in open and grassy sheep pasture, farm dams, roadside seeps and culverts, and sedgey marsh
Epacris stuartii Southport Heath
Heathland on an exposed dolerite headland at Southport Bluff.
Used Range Boundary Mapping
Used Species of National Environmental Significance (public grids)
Tolerable Fire Intervals for TASVEG Communities, NRET, 2021 https://www.naturalvalues atlas.tas.gov.au/
Forest Practices Authority (FPA)
Range Boundary Mapping 2012
https://nre.tas.gov.au/Doc uments/Tolerable%20Fire% 20Intervals%20for%20TASV EG%20communities%20.pd f
https://www.naturalvalues atlas.tas.gov.au/
Forest Practices Authority (FPA)
Range Boundary Mapping 2012
Species of National Environmental Significance Database
https://www.naturalvalues atlas.tas.gov.au/
https://www.dcceew.gov.a u/environment/environme ntal-informationdata/databasesapplications/snes
Official Name Descriptor
Eucalyptus gunnii Miena Cider Gum
Eucalyptus morrisbyi Morrisby’s Gum
Habitat Description Advice
Poorly drained highaltitude sites on the edges of treeless flats and frost hollows.
The two primary populations of Morrisby’s gum are found in moister aspects on infertile soils on the low rainfall eastern shore of the River Derwent. The Risdon Hill population occurs on Permian mudstones, and exists as part of a community which includes understorey species such as Acacia dealbata (silver wattle), Acacia melanoxylon (blackwood) and Acacia verticillata (prickly moses). The Calverts Hill population occurs on Jurassic dolerite and the nearby remnants on Quaternary sands.
Methodology used to define Range Model
Used NVA observation records with a 100m buffer

Data Source Reference
Natural Values Atlas (NVA) Observation Records 29/02/2024
Used NVA observation records with a 100m buffer
Natural Values Atlas (NVA) Observation Records 29/02/2024
Data Source Link
https://www.naturalvalues atlas.tas.gov.au/
Eudyptula minor Little Penguin
Little Penguins can be found nesting along much of Tasmania’s coastline in a wide variety of habitats. Nests can be found in burrows dug in the sand/soil, under native plants or weeds, under or between rocks, in caves, on steep cliffs, in culverts and stormwater drains, woodpiles, building material/rubble, under houses or machinery, or in some places, artificial penguin burrows. In fact, any hollow, crevice or cavity that provides some shelter in the coastal zone may provide a nesting opportunity for a Little Penguin.
Used Species of National Environmental Significance (public grids) appended with NVA Observation records (mix of burrows and sightings) since 01/01/2014 buffered by 50m
Species of National Environmental Significance Database
Natural Values Atlas (NVA) Observation Records 29/02/2024
https://www.naturalvalues atlas.tas.gov.au/
https://www.dcceew.gov.a u/environment/environme ntal-informationdata/databasesapplications/snes
https://www.naturalvalues atlas.tas.gov.au/

Official Name Descriptor
Habitat Description Advice
Galaxiella pusilla Dwarf Galaxias
Limnodynastes peronii Striped Marsh Frog
The species occurs in lowland swampy areas of far northwest and northeast Tasmania and Flinders Id. It is found in slow flowing waterways like streams in swamps and in drainage channels.
Methodology used to define Range Model
Used Range Boundary Mapping
For fire priority ranking, where the range intersected areas likely to fall outside the Tolerance Fire Interval in the event of a 2024 fire, their priority was increased by one ranking (i.e. Low -> Moderate)
Used Range Boundary Mapping
Rainforests, wet and dry forests, woodlands, shrublands, open and disturbed areas where they frequent swamps, flooded grasslands, pools and ponds.
Data Source Reference
Forest Practices Authority (FPA)
Range Boundary Mapping 2012
Tolerable Fire Intervals for TASVEG Communities, NRET, 2021
Data Source Link
Oreisplanus munionga subsp. larana Marrawah Skipper
Dense Carex appressa sedgeland (e.g. along drains and forest margins) and swamp forest to plantations and pasture.
For fire priority ranking, where the range intersected areas likely to fall outside the Tolerance Fire Interval in the event of a 2024 fire, their priority was increased by one ranking (i.e. Moderate -> High)
Used Range Boundary Mapping
For fire priority ranking, where the range intersected areas likely to fall outside the Tolerance Fire Interval in the event of a 2024 fire, their priority was increased by one ranking (i.e. Moderate -> High)
Used Range Boundary Mapping
Forest Practices Authority (FPA)
Range Boundary Mapping 2012
Tolerable Fire Intervals for TASVEG Communities, NRET, 2021
https://www.naturalvalues atlas.tas.gov.au/
https://nre.tas.gov.au/Doc uments/Tolerable%20Fire% 20Intervals%20for%20TASV EG%20communities%20.pd f
Forest Practices Authority (FPA) Range Boundary Mapping 2012
Tolerable Fire Intervals for TASVEG Communities, NRET, 2021
https://www.naturalvalues atlas.tas.gov.au/
https://nre.tas.gov.au/Doc uments/Tolerable%20Fire% 20Intervals%20for%20TASV EG%20communities%20.pd f
https://www.naturalvalues atlas.tas.gov.au/
https://nre.tas.gov.au/Doc uments/Tolerable%20Fire% 20Intervals%20for%20TASV EG%20communities%20.pd f
Oreixenica ptunarra Ptunarra Brown Butterfly Poa tussock grassland and sedgy grassland to Hakea microcarpa grassy shrubland to grassy open eucalypt woodland. Restricted to sites above 400 m where there is >25% cover of Poa tussocks.
Pardalotus quadragintus Forty Spotted Pardalote
White Gum forest within 3 km of the east coast from St Helens to Southport
For fire priority ranking, where the range intersected areas likely to fall outside the Tolerance Fire Interval in the event of a 2024 fire, their priority was increased by one ranking (i.e. Moderate -> High)
Used Range Boundary Mapping
Forest Practices Authority (FPA) Range Boundary Mapping 2012
Tolerable Fire Intervals for TASVEG Communities, NRET, 2021
https://www.naturalvalues atlas.tas.gov.au/
https://nre.tas.gov.au/Doc uments/Tolerable%20Fire% 20Intervals%20for%20TASV EG%20communities%20.pd f
Forest Practices Authority (FPA) Range Boundary Mapping 2012
https://www.naturalvalues atlas.tas.gov.au/
Official Name Descriptor
Perameles gunnii gunnii Eastern Barred Bandicoot
Platycercus caledonicus brownii King Island Green Rosella
Habitat Description Advice
Native grasslands and grassy woodlands
Methodology used to define Range Model
Used NVA observation records after 01/01/2014, present and less than 1km position accuracy with a 500m buffer
Eucalypt forest on the King Island
Range Boundary Mapping

Data Source Reference
Natural Values Atlas (NVA) Observation Records 29/02/2024
Forest Practices Authority (FPA) Range Boundary Mapping 2012
Data Source Link
https://www.naturalvalues atlas.tas.gov.au/
Prototroctes maraena Australian Grayling
Coastal rivers and streams in New South Wales, Victoria and Tasmania.
Puffinus tenuirostris
Short-tailed Shearwater
Sarcophilus harrisii Tasmanian Devil
Headlands and islands covered with tussocks and succulent vegetation such as pigface and iceplant.
Wide range of habitats across Tasmania, especially in landscapes with a mosaic of pasture and woodland.
Generated a 50m buffer of Mersey River, Gawler River, River Tamar, North Esk River, Great Forester River, River Derwent, Huon River and Etterick River (King Island) based on Hydline and Hydarea
Used Species of National Environmental Significance (public grids) appended with NVA Observation records (predominantly breeding colonies) since 01/01/2014 buffered by 100m
Used Range Boundary Mapping clipped to Tasman Penisula and Maria Island which are critical areas (Devil Facial Tumour Disease Free Areas)
Used Species of National Environmental Significance (public grids).
LIST Hydrographic Lines and Hydrographic Areas
https://www.naturalvalues atlas.tas.gov.au/
https://listdata.thelist.tas.g ov.au/public/LIST_Hydrogra phic_Information.pdf
Species of National Environmental Significance Database
Natural Values Atlas (NVA) Observation Records 29/02/2024
Forest Practices Authority (FPA) Range Boundary Mapping 2012
https://www.dcceew.gov.a u/environment/environme ntal-informationdata/databasesapplications/snes
https://www.naturalvalues atlas.tas.gov.au/
https://www.naturalvalues atlas.tas.gov.au/
Strepera fuliginosa colei
Black Currawong (King Island)
Tetratheca gunnii Shy Susan
Wet sclerophyll forest, woodland and heath on King Island
For fire priority ranking, where the range intersected areas likely to fall outside the Tolerance Fire Interval in the event of a 2024 fire, their priority was increased by one ranking (i.e. Moderate -> High)
Serpentine outcrops in the foothills of the Dazzler Range near Beaconsfield, Tasmania
Used NVA observation records with a 100m buffer
Species of National Environmental Significance Database
Tolerable Fire Intervals for TASVEG Communities, NRET, 2021
https://www.dcceew.gov.a u/environment/environme ntal-informationdata/databasesapplications/snes
https://nre.tas.gov.au/Doc uments/Tolerable%20Fire% 20Intervals%20for%20TASV EG%20communities%20.pd f
Natural Values Atlas (NVA) Observation Records 29/02/2024
https://www.naturalvalues atlas.tas.gov.au/
Tyto novaehollandiae Masked Owl
Diverse range of forests and woodlands including agricultural and forest mosaics. Forests with relatively open understoreys, particularly when these habitats adjoin areas of open or cleared land.
Diana’s Basin Important Wetland Wetland / swamp
Methodology
For fire priority ranking, mature habitat availability areas were extracted from the range boundary and assigned a base priority for fire risk modelling as follows:
- Low Habitat Availability Class = Low Fire Priority - Medium/High Habitat Availability Class = Moderate Priority.
Where these priority areas had an age since last fire outside the minimum Tolerance Fire Interval, their priority rating was increased by a class.
Used CFEV Wetland Boundary
For fire priority ranking, where the range intersected areas likely to fall outside the Tolerance Fire Interval in the event of a 2024 fire, their priority was increased by one ranking (i.e. Low -> Moderate)
Used CFEV Wetland Boundary

Forest Practices Authority (FPA) Mature Habitat Availability Modelling 2012.
Forest Practices Authority (FPA) Range Boundary Mapping 2012.
Tolerable Fire Intervals for TASVEG Communities, NRET, 2021
https://fpa.tas.gov.au/Docu ments/Fauna_Tech_Note_ 2_Mature_habitat.pdf
https://www.naturalvalues atlas.tas.gov.au/
https://nre.tas.gov.au/Doc uments/Tolerable%20Fire% 20Intervals%20for%20TASV EG%20communities%20.pd f
McKerrows Marsh Important Wetland Wetland / swamp
Conservation of Freshwater Ecosystem Values (CFEV) Data
Tolerable Fire Intervals for TASVEG Communities, NRET, 2021
https://nre.tas.gov.au/wate r/water-monitoring-andassessment/cfevprogram/cfevresources#TheCFEVTechnic alReport
https://nre.tas.gov.au/Doc uments/Tolerable%20Fire% 20Intervals%20for%20TASV EG%20communities%20.pd f
Melaleuca ericifolia Swamp Forest
Tasmanian threatened vegetation community
Pure or almost pure stands of Melaleuca ericifolia (coast paperbark) with trees forming a dense (generally even-aged) canopy over a simple, sedgy understorey
For fire priority ranking, where the range intersected areas likely to fall outside the Tolerance Fire Interval in the event of a 2024 fire, their priority was increased by one ranking (i.e. Low -> Moderate)
Used relevant TASVEG 4.0 community (Code: NME)
For fire priority ranking, where the range intersected areas likely to fall outside the Tolerance Fire
Conservation of Freshwater Ecosystem Values (CFEV) Data
Tolerable Fire Intervals for TASVEG Communities, NRET, 2021
https://nre.tas.gov.au/wate r/water-monitoring-andassessment/cfevprogram/cfevresources#TheCFEVTechnic alReport
https://nre.tas.gov.au/Doc uments/Tolerable%20Fire% 20Intervals%20for%20TASV EG%20communities%20.pd f
TASVEG 4.0 - The Digital Vegetation Map of Tasmania
Tolerable Fire Intervals for TASVEG Communities, NRET, 2021
https://nre.tas.gov.au/cons ervation/developmentplanning-conservationassessment/planningtools/monitoring-andmapping-tasmaniasvegetation-(tasveg)/tasvegthe-digital-vegetation-mapof-tasmania
https://nre.tas.gov.au/Doc
Official Name Descriptor
Habitat Description Advice
Seagrass Habitat
kanamaluka /Tamar estuary, North East Inlet, Georges Bay and Ansons Bay NA
Temperate Coastal Oyster Bed and Reef Native shellfish reefs in Georges Bay
Robbins Passage –Boullanger Bay
Coastal wetland proposed for Ramsar nomination
Native shellfish reefs in Georges Bay
Methodology used to define Range Model
Interval in the event of a 2024 fire, their priority was increased by one ranking (i.e. Moderate -> High)
Used merged CFEV Estuaries

Data Source Reference
Digitised polygons using 2013 survey maps
Conservation of Freshwater Ecosystem Values (CFEV) Data
Tarbath, David & Gardner, Caleb. (2013). Tasmanian Small Bivalve Fishery, 2013. 10.13140/RG.2.1.41 19.5683. Venerupis or Venus Clam.
Data Source Link
uments/Tolerable%20Fire% 20Intervals%20for%20TASV EG%20communities%20.pd f
https://nre.tas.gov.au/wate r/water-monitoring-andassessment/cfevprogram/cfevresources#TheCFEVTechnic alReport
https://www.researchgate. net/publication/278041806 _Tasmanian_Small_Bivalve _Fishery_2013
Extensive intertidal mudflats up to the high-tide line around Robbins Island, extending east around Perkins Bay to North Point.
Greater ForesterBrid Catchment Important Catchment NA
Used KML provided by Cradle Coast Authority
Cradle Coast Authority
https://www.planning.tas.g ov.au/__data/assets/pdf_fil e/0010/593569/Represent ative-4-Circular-HeadCoastal-AwarenessNetwork-additionalhearing-information,Robbins-PassageBoullanger-Bay,-Report-ofa-natural-heritage-trustproject-27-November2020.pdf
Removed modified land from TASVEG and clipped to Greater ForesterBrid catchment area
LIST Hydrographic Areas
https://listdata.thelist.tas.g ov.au/public/LIST_Hydrogra phic_Information.pdf https://nre.tas.gov.au/cons ervation/developmentplanning-conservationassessment/planningtools/monitoring-andmapping-tasmaniasvegetation-(tasveg)/tasvegthe-digital-vegetation-mapof-tasmania
Derwent Catchment Important Catchment NA
Removed modified land from TASVEG and clipped to LGA boundaries for Derwent Valley and Central Highlands
Conservation of Freshwater Ecosystem Values (CFEV) Data
https://www.thelist.tas.gov .au/app/content/data/geometa-datarecord?detailRecordUID=0 2d3c724-9bfe-446a-a38ac47cbca31291
Tasman Peninsula Important Region NA
Removed modified land from TASVEG and clipped to LGA boundaries for Tasman Peninsula
Conservation of Freshwater Ecosystem Values (CFEV) Data
https://www.thelist.tas.gov .au/app/content/data/geometa-datarecord?detailRecordUID=0 2d3c724-9bfe-446a-a38ac47cbca31291 https://nre.tas.gov.au/cons ervation/developmentplanning-conservationassessment/planningtools/monitoring-andmapping-tasmaniasvegetation-(tasveg)/tasvegthe-digital-vegetation-mapof-tasmania
Official Name Descriptor
Habitat Description Advice
kanamaluka/Tama r Estuary Important Estuary Estuary
Macquarie Harbour Important Estuary Estuary
North East Corner of Tasmania Important Region NA
Methodology used to define Range Model
Used CFEV Estuary Boundary

Data Source Reference
Conservation of Freshwater Ecosystem Values (CFEV) Data
Used CFEV Estuary Boundary
Removed modified land from TASVEG and clipped to north east corner (NRM Strategy 2021) shape
Conservation of Freshwater Ecosystem Values (CFEV) Data
Data Source Link
https://nre.tas.gov.au/wate r/water-monitoring-andassessment/cfevprogram/cfevresources#TheCFEVTechnic alReport
https://nre.tas.gov.au/wate r/water-monitoring-andassessment/cfevprogram/cfevresources#TheCFEVTechnic alReport
Digitsed area for NRM Strategy 2021
Ringarooma Catchment Important Catchment NA
Removed modified land from TASVEG and clipped to catchment area
LIST Hydrographic Areas
https://nre.tas.gov.au/cons ervation/developmentplanning-conservationassessment/planningtools/monitoring-andmapping-tasmaniasvegetation-(tasveg)/tasvegthe-digital-vegetation-mapof-tasmania
https://listdata.thelist.tas.g ov.au/public/LIST_Hydrogra phic_Information.pdf https://nre.tas.gov.au/cons ervation/developmentplanning-conservationassessment/planningtools/monitoring-andmapping-tasmaniasvegetation-(tasveg)/tasvegthe-digital-vegetation-mapof-tasmania

Agricultural Natural Capital Asset
Land Use
Vegetation cover
Vegetation cover
Source Data for Model
Source Reference
Tasmanian Land Use 2021 excluding forestry NCH Tasmanian Land Use 2021
TASVEG 4.0 for natural vegetation cover
National Forest and Sparse Woody Vegetation Data
Vulnerable Soils Water Erosion Layer
TASVEG 4.0 - The Digital Vegetation Map of Tasmania
National Forest and Sparse Woody Vegetation Data (Version 7.0 - 2022 Release, DCCEEW) and TASVEG 4.0 (NRET).
Department of Primary Industries, Parks, Water and Environment Managing Vulnerable Soils under Irrigation in Tasmania 2018
Source Link
https://www.thelist.tas.gov.au/app/content/data/geometa-data-record?detailRecordUID=418ff94a-6a0544c9-951f-65c2e7c1f17b
https://nre.tas.gov.au/conservation/developmentplanning-conservation-assessment/planningtools/monitoring-and-mapping-tasmanias-vegetation(tasveg)/tasveg-the-digital-vegetation-map-oftasmania
https://data.gov.au/data/dataset/national-forest-andsparse-woody-vegetation-data-version-3-2018-release
https://nrmdatalibrary.dpipwe.tas.gov.au/FactSheets/ WfW/ListMapUserNotes/Vulnerable_soils.pdf
Threat Threat Layers
Source Data for Model
Fire BRAM 2024 Fire Likelihood BRAM 2024 Fire Likelihood
Flooding
Statewide 1% AEP Climate Change Peak Flood Extent
Flooding
Flooding
Coastal Erosion
Coastal Inundation
Biosecurity
Statewide_1pc_AEP_CC_Peak_ Flood_Extent_Polygon.shp
Flood Extent June 2016Tasmanian Flood Recovery June 2016 Flood HWM Flood Extents
Flood Plain
LIST Hydrographic Areas (Floodplain)
Coastal Erosion - High Hazard Band Coast Erosion Hazard Bands
Projected Storm Tide AEP2100 Coastal Projected Storm Tide
Cats (risk of reintroduction) on luntalanana Felis catus Observation Records
Biosecurity Chytrid fungus
Batrachochytrium dendrobatidis Observation Records
Biosecurity Deer Dama dama Observation Records
Biosecurity European Green Crabs Carcinus maenas Observation Records
Biosecurity European Wasps Vespula germanica Observation Records
Phytophthora cinnamomi symptoms point
Biosecurity
Phytopthora cinnamomi
Biosecurity Weed
Biosecurity
Weed, pest and invasive species threats to the Furneaux Islands
Phytophthora cinnamomi symptoms region
Phytophthora cinnamomi isolation records
Phytophthora cinnamomi Management Areas
Declared Weed Observation Records
Priority Weed Observation Records
Declared Weed Observation Records Priority Weed Observation Records
Source Reference
Tasmanian Parks and Wildlife Service (TPWS)
State Emergency Service (SES), Department of Police, Fire and Emergency Management (DPFEM)
Department of Premier and Cabinet (DPAC)
LIST Hydrographic Areas
LIST Coastal Erosion Hazard Bands 20161201
LIST Coastal Projected Storm Tide 20161201
Natural Values Atlas (NVA) Observation Records 29/02/2024
Natural Values Atlas (NVA) Observation Records 29/02/2024
Natural Values Atlas (NVA) Observation Records 29/02/2024
Natural Values Atlas (NVA) Observation Records 29/02/2024
Natural Values Atlas (NVA) Observation Records 29/02/2024

Source Link
https://parks.tas.gov.au/aboutus/fire-management/bushfire-riskplanning
https://www.ses.tas.gov.au/about/r isk-management/flood-riskmanagement/tasmanian-floodmapping-project-reports/
https://listdata.thelist.tas.gov.au/pu blic/DPAC_Flood_Extent_Report.pd f
https://listdata.thelist.tas.gov.au/pu blic/LIST_Hydrographic_Information .pdf
https://listdata.thelist.tas.gov.au/pu blic/outgoing/sif/metadata/Coastal _Inundation_Mapping_Stage4_1.pd f
https://www.dpac.tas.gov.au/divisio ns/osem/coastal_hazards_in_tasma nia
https://www.naturalvaluesatlas.tas. gov.au/
https://www.naturalvaluesatlas.tas. gov.au/
https://www.naturalvaluesatlas.tas. gov.au/
https://www.naturalvaluesatlas.tas. gov.au/
https://www.naturalvaluesatlas.tas. gov.au/
Forestry Tasmania
https://nre.tas.gov.au/biosecuritytasmania/plant-biosecurity/pestsanddiseases/phytophthora/phytophtho ra-publications/conservation-ofplant-species-threatened-by-pcinnamomi
Natural Values Atlas (NVA) Observation Records 29/02/2024
Natural Values Atlas (NVA) Observation Records 29/02/2024
https://www.naturalvaluesatlas.tas. gov.au/
https://www.naturalvaluesatlas.tas. gov.au/