BUSINESS FORECAST San Joaquin Valley

Emerging Trends in the Valley’s Economy

VOL XII | ISS 1 2023

Table of Contents Contributors ........................................................................................................................... 3 Executive Summary ............................................................................................................. 4 Introduction ........................................................................................................................... 5 Employment Indicators ....................................................................................................... 6 Housing Sector ..................................................................................................................... 16 Inflation and Prices .............................................................................................................. 18 Banking and Capital Markets .......................................................................................... 20 Concluding Remarks ......................................................................................................... 22 2 | Stanislaus State Volume XII, Issue 1 csustan.edu/sjvbf Gökçe Soydemir, Ph.D. Stanislaus State One University Circle Turlock, CA 95382 We wish to thank Foster Farms for generously providing the endowment for this project. SAN JOAQUIN VALLEY BUSINESS FORECAST 2023
Contributors
Faculty


Staff
College of Business Administration
Communications and Public Affairs Student Assistants


 Annhenrie Campbell, Ph.D. Professor, Accounting and Finance
Gökçe Soydemir, Ph.D. Foster Farms Endowed Professor of Business Economics
Terence Pitre, Ph.D. Dean, College of Business Administration
David Lindsay, Ph.D. Professor, Accounting and Finance
Diamelle Abalos Administrative Support Coordinator
Carmen Garcia Administrative Analyst
Gina Donahue Interim Director, MBA Programs
Rosalee Rush Senior Associate Vice President for Communications, Marketing and Media Relations
Ethan Machado
Madeline Heidman
Cristian Alcantar
Kristina Stamper Director for Communications and Creative Services
Steve Caballero Senior Graphic Designer
Mandeep Khaira Senior Web and Electronic Communications Developer
Donna Birch Trahan Senior Writer and Content Specialist
Katie Dowling Graphic Designer
Annhenrie Campbell, Ph.D. Professor, Accounting and Finance
Gökçe Soydemir, Ph.D. Foster Farms Endowed Professor of Business Economics
Terence Pitre, Ph.D. Dean, College of Business Administration
David Lindsay, Ph.D. Professor, Accounting and Finance
Diamelle Abalos Administrative Support Coordinator
Carmen Garcia Administrative Analyst
Gina Donahue Interim Director, MBA Programs
Rosalee Rush Senior Associate Vice President for Communications, Marketing and Media Relations
Ethan Machado
Madeline Heidman
Cristian Alcantar
Kristina Stamper Director for Communications and Creative Services
Steve Caballero Senior Graphic Designer
Mandeep Khaira Senior Web and Electronic Communications Developer
Donna Birch Trahan Senior Writer and Content Specialist
Katie Dowling Graphic Designer
2023 | Volume XII • Issue 1 | 3
San Joaquin Valley Business
Forecast,
After registering negative growth during the first and second quarters of 2022, the Valley economy — and the nation — entered a recession, according to the general definition, two consecutive quarters of negative real economic growth. We stated in our previous report that the severity of the recession would depend on how fast and how high the Federal Reserve increased interest rates. It takes time for rate hikes to influence the economy, and concerns are mounting that the Federal Reserve is raising rates too quickly without waiting to see the effect on the economy. A closely watched predictor of recessions, the yield curve on the two-year versus ten-year bonds yields inverted a few times beginning in late March, once again accurately predicting a recession. Now, there are increased worries that the rate hikes from by Federal Reserve to bring down inflation will steer the economy to a hard landing.
In the Valley, all employment categories except for financial activities grew in 2022. Growth was multifold of respective long-term benchmark growth rates, continuing the strong pace from 2021. Projections point to slower growth rates due to the Federal Reserve’s committed stance to fight inflation and to implement additional rate hikes this year.
Financial activities employment declined by 0.34 percent in 2022, continuing to worsen in the Valley as it did in 2021. Despite the ongoing drought, farm-related Valley wholesale trade employment grew 3.48 percent, more than three times faster than in 2021. For the first time since the pandemic began, education and health services employment grew 4.33 percent in 2022, which was faster than the long-term benchmark growth of 3.24 percent. Government employment growth at 3.52 percent came in as expected with a lag, which had declined by 1.35 percent in 2021.
Valley leisure and hospitality services employment, one of the employment categories most sensitive to interest rates, grew 12.71 percent, which is about 4 percent less than the 2021 rate. Despite the decline, leisure and hospitality services employment registered the fastest growth in the Valley. Surprisingly, structurally problematic information employment grew 6.47 percent, which is about twice the growth rate observed in 2021, making it the second fastestgrowing employment category. Trade, transportation and utilities employment came in third at 4.60 percent followed by Valley construction employment, which grew 3.25 percent in 2022, slower than the 4.95 percent observed in 2021. Another sensitive category, retail services employment, grew 2.52 percent, falling by approximately 4 percent from the 2021 rate. Manufacturing employment grew 2.29 percent faster than the previous year and at the fastest pace since 2015. Given the stricter policy variables to fight inflation, employment levels are expected to grow at negative rates in 2023 but are expected to only to partially recover in 2024, sparing any catastrophic outcomes resulting from the Ukraine-Russia war contributing to global supply chain shortages.
Valley building permits increased 18.92 percent, about half of the phenomenal 35.65 percent rate seen in 2021. These double-digit increases reflect supply chasing demand to close the Valley’s big housing inventory shortage. There were no foreclosures in 2022, much like 2021. Freddie Mac 30-year rates increased steeply after a series of rate hikes and high inflation in 2022. The average yearly inflation rate was 8.29 percent in 2022, more than three times the typical rate of 2.61 percent. Valley home values increased 21.46 percent in 2022 on top of the 16.83 percent increase in 2021. This year’s increase was more than three times the long-term 5.96 percent benchmark growth. Some of the increase is due to high inflation rates seen in 2022. Beginning with the third quarter of 2022, home values are likely to decrease by 2 percent from the previous quarter until in line with longterm benchmark growth rates. A crisis comparable to levels seen during the Great Recession is not expected because lenders are stricter, unemployment is still low and there is a significant lack of available housing inventory in the Valley. Most of the home sales occurring are due to family events or are investment related. However, some realignment of home values is underway given the steep increases in long-term interest rates.
Wage inflation and price of oil as a cost-push factor contributed to high inflation in 2022. Average weekly wages rose 3.28 percent but stayed below the overall price growth of 8.29 percent, corresponding to a decline in real wage, a purchasing power loss of 5 percent in the Valley. Since wages typically fall during recessions, projections point to lower growth rates in the coming two-year interval and further declines in Valley consumers’ purchasing power.
Valley community bank total deposits grew 9.57 percent, about half the rate of 2021 and in line with the long-term benchmark rate of 8.95 percent. In contrast, net loans and leases experienced no growth in 2022. Growth at 0.10 percent was nonexistent and a sharp reversal to the 11.36 percent growth in 2021. This imbalance between total deposits and net loans is like the pattern observed during the Great Recession. This is concerning because it means Valley banks have stopped extending additional loans. Unlike the Federal Reserve intervention during the COVID-19 pandemic, Valley bank nonaccruals trended sharply upward in 2022, creating another unease for the coming months. Community bank assets in default 30 to 89 days and assets in default more than 90 days were higher in 2022 than 2021. As projected, nonaccruals rose much faster in 2022 as the Federal Reserve’s intervention ended and balance sheet reduction and tapering began.
As we recommended in our previous issue, Valley businesses and residents can take precautionary measures by switching from flexible to fixed rates, decreasing leverage by reducing debt, increasing cash holdings, renting housing rather than owning and switching to credit cards that offer zero introductory interest charges.
4 | Stanislaus State
Executive Summary
Time series data spans from January 2001 to October 2022. The two-year medium-term forecasts are from November 2022 to December 2024. Forecasting a range rather than a point provides a more realistic assessment of future values. When actual numbers fall within the upper and lower forecast bands, the forecast becomes accurate.
The remainder of this report is structured as follows: Section B analyzes labor market conditions for the San Joaquin Valley; the region’s real estate market, based on eight metropolitan statistical areas, are examined in Section C; Section D reviews trends in prices and inflation; indicators from local banking and capital markets are examined in Section E. Section F is concluding remarks.

San Joaquin Valley

San Joaquin


2023 | Volume XII • Issue 1 | 5
San Joaquin Valley Business Forecast,
Kern
Tulare
Fresno
Madera
Merced
Kings
Introduction
Total employment continued to grow at fast rates for all counties in 2022. The employment growth in 2022 was so strong that many counties reported growth multifold of their benchmark growth rates. Fresno County reported growth at 6.84 percent, followed by Tulare County at 6.81 percent. Merced County registered the third fastest growth at 6.23 percent. Madera County, the only county that reported a decline in 2021, grew 5.95 percent in 2022. San Joaquin County grew 5.54 percent, while Kings County reported 4.99 percent growth. Among the eight counties of the San Joaquin Valley, Stanislaus County total employment grew the slowest at 4.68 percent, which was still more than four times the long-term benchmark growth rate.
EMPLOYMENT GROWTH
Number of Employees

All categories of employment except financial services grew in 2022. Financial services employment declined 0.34 percent in 2022, but the decline was less than 0.98 percent. The historically problematic information employment category continued to register significant growth rates, much like the prior year. Government employment growth switched from negative to positive territory after registering 3.52 percent growth. Despite the ongoing drought, farm-related wholesale trade employment in the Valley grew 3.48 percent, significantly faster than the 1.01 percent seen in 2021. Education and health services employment grew faster in 2022 than the previous year, increasing by 2.57 percent to 4.33 percent. After a 4 percent drop from 2021, leisure and hospitality services employment grew 12.71 percent in 2022, becoming the Valley’s fastest growing employment category.
1,700,000
1,600,000
1,500,000
1,400,000
1,300,000
Total Employment Actual Projected
1,900,000 1,800,000 Months
Total employment in the Valley grew at an average yearly rate of 5.85 percent — more than twice the rate of 2.81 percent in 2021. Given the projected decline in growth rates, the Valley’s total employment is expected to continue to stay below 1.8 million until the first half of 2025. Projections point to a decline in growth of 0.16 percent in 2023 followed by 1.53 percent growth in 2024 when the influence of steep rate hikes begin to be felt in the economy.
6 | Stanislaus State
Employment Indicators
2001M01 2001M10 2002M07 2003M04 2004M01 2004M10 2005M07 2006M04 2007M01 2007M10 2008M07 2009M04 2010M01 2010M10 2011M07 2012M04 2013M01 2013M10 2014M07 2015M04 2016M01 2016M10 2017M07 2018M04 2019M01 2019M10 2020M07 2021M04 2022M01 2022M10 2023M07 2024M04 Sample Average 1.09% 2020 Average -5.35% 2021 Average 2.81% 2022 Average 5.85% 2023 Forecast 2024 Forecast Total Employment: Historical vs. Projected Average Yearly Growth Average Percentage Change Actual Optimistic Most Likely Pessimistic 0.64% 2.08% -0.16% 1.53% -0.96% 0.98% -6.00% -4.00% -2.00% 0.00% 2.00% 4.00% 6.00% 8.00%
THE
IN 2022 WAS SO STRONG THAT MANY COUNTIES REPORTED GROWTH MULTIFOLD OF THEIR BENCHMARK GROWTH RATES.
The Consumer Confidence Index (CCI) is one leading economic indicator that has the predictive power to tell which direction the economy is headed. The steep increase in the early months of 2021 shows higher consumer confidence immediately after the pandemic. The rate hikes, however, reversed that trend, and consumer confidence had been continuously decreasing since the second half of 2021. Despite an upward turn in September 2022, confidence in consumer spending is not expected to exceed a value of 130 points in the coming months due to the uncertainty from interest rate hikes and regional conflicts.
The Labor Force Participation Rate, unlike previous quarters, began showing a clear sign of increase following the first quarter of 2021. The labor market remains strong as of the third quarter of 2022. Upon careful examination of the displayed patterns of both series, the tendency to switch directions is now acting as a new leading indicator for our region. It appears that both series are on a path to crossing each other, which would serve as a leading indicator of a contraction.
Limited by the oceans California cannot expand westward, which makes the Valley a growth area. Employment growth in the Valley relative to California is supposed to be faster, but this pattern was not observed in 2021. However, both series are now displaying almost identical growth rates for the first time since the first quarter of 2020. The impact of interest rate hikes will be telling in the coming months to determine whether the Valley’s employment growth will exceed the state’s.
San
Valley Business Forecast, 2023 | Volume XII • Issue 1 | 7 0 20 40 60 80 100 120 140 160 Index Value Months Consumer Confidence Index
Board 9/1/1992
Months Labor Force vs. Employment Growth Percentage Change from Previous Year Labor Force Employment 2002M01 2002M08 2003M03 2003M10 2004M05 2004M12 2005M07
2007M04 2007M11
-18 -15 -12 -9 -6 -3 0 3 6 9 12 15 Months
Annual Percentage
-18.00% -13.00% -8.00% -3.00% 2.00% 7.00% 12.00%
2015M07 2016M01 2016M07 2017M01 2017M07 2018M01 2018M07 2019M01 2019M07 2020M01 2020M07 2021M01 2021M07
2022M07
Joaquin
Conference
10/1/1993 11/1/1994 12/1/1995 1/1/1997 2/1/1998 3/1/1999 4/1/2000 5/1/2001 6/1/2002 7/1/2003 8/1/2004 9/1/2005 10/1/2006 11/1/2007 12/1/2008 1/1/2010 2/1/2011 3/1/2012 4/1/2013 5/1/2014 6/1/2015 7/1/2016 8/1/2017 9/1/2018 10/1/2019 11/1/2020 12/1/2021
2006M02 2006M09
2008M06 2009M01 2009M08 2010M03 2010M10 2011M05 2011M12 2012M07 2013M02 2013M09 2014M04 2014M11 2015M06 2016M01 2016M08 2017M03 2017M10 2018M05 2018M12 2019M07 2020M02 2020M09 2021M04 2021M11 2022M06
Employment Growth: State vs. San Joaquin Valley Valley State
Change
2002M01 2002M07 2003M01 2003M07 2004M01 2004M07 2005M01 2005M07 2006M01 2006M07 2007M01 2007M07 2008M01 2008M07 2009M01 2009M07 2010M01 2010M07 2011M01 2011M07 2012M01 2012M07 2013M01 2013M07 2014M01 2014M07 2015M01
2022M01
Given the two consecutive quarters of negative real economic growth during the first and second quarters of 2022, we are now officially in a recession. The impact has not yet affected the job market, but some significant slowdowns have been observed in the latter part of the third quarter. Projections point to a deepening recession in 2023 only to enter an expansionary phase in 2024 as the effect on the labor market is felt. What’s noteworthy is the unemployment rate reached a minimum in May 2022 then gradually began to rise in the following months. Normally, the Valley’s unemployment rate reaches a seasonal minimum in the third quarter of each year.
Over a 12-month period, education and health services employment reported 2.57 percent growth, switching from negative to positive territory in 2021. The long-term growth trend catches growth trends that have existed before the pandemic. Delays in school openings and priorities on COVID-19 healthcare workers undoubtedly caused employment in these sectors to recover with a lag relative to other employment categories in the Valley.
Given the Federal Reserve’s commitment to further increase interest rates, employment levels in education and health services employment are projected to stay below 255,000 by the end of 2024. Employment in this category is robust relative to the other employment categories.
Education and health services employment continued to grow even during the 2008 Great Recession. Projections point to growth at an average yearly rate of 1.29 percent in 2023, which is below the benchmark growth rate, and then at a faster pace of 2.13 percent in 2024.
OVER A 12-MONTH PERIOD, EDUCATION AND HEALTH SERVICES EMPLOYMENT REPORTED
2.57 % GROWTH
Percentage Change
U.S. Real GDP Annual Growth
30.0
20.0
10.0
0.0

-10.0
-20.0
-30.0
-40.0
40.0 2000q1 2001q1 2002q1 2003q1 2004q1 2005q1 2006q1 2007q1 2008q1 2009q1 2010q1 2011q1 2012q1 2013q1 2014q1 2015q1 2016q1 2017q1 2018q1 2019q1 2020q1 2021q1 2022q1 2023q1 2024q1
Quarters
Actual Projected
Education and Health Services Employment
235,000
Average Percentage Growth
215,000
195,000
175,000
155,000
135,000
115,000
Number of Employees 2001M01 2001M09 2002M05 2003M01 2003M09 2004M05 2005M01 2005M09 2006M05 2007M01 2007M09 2008M05 2009M01 2009M09 2010M05 2011M01 2011M09 2012M05 2013M01 2013M09 2014M05 2015M01 2015M09 2016M05 2017M01 2017M09 2018M05 2019M01 2019M09 2020M05 2021M01 2021M09 2022M05 2023M01 2023M09 2024M05
255,000 Months
Actual Projected
Education and Health Services Employment: Historical vs. Projected Average Yearly Growth
3.00% 4.00%
4.33%
5.00% 3.24% -0.87% 2.57%
2.00%
-1.00% 0.00% 1.00%
1.61%
2.48% 1.29% 2.13% 0.96% 1.78% -2.00%
Sample Average 2020 Average 2021 Average 2022 Average 2023 Forecast 2024 Forecast
Actual Optimistic Most Likely Pessimistic
8 | Stanislaus State
Employment Indicators
Valley manufacturing employment grew 2.29 percent in 2022 compared to 1.50 percent in 2021, a significant improvement over the prior year despite the ongoing drought. Employment levels in this category will likely oscillate at around 115,000 by the end of 2024. After the robust growth that continued into 2022, the Valley’s manufacturing employment longterm benchmark growth continues to remain in positive territory and further increased to 0.19 percent.
VALLEY MANUFACTURING
EMPLOYMENT GREW
2.29 % IN 2022
Given the Federal Reserve’s continued interventions to fight inflation, growth in manufacturing employment will slow in the coming months. Projections point to an average annual decline of 0.59 percent in 2023 and a faster pace of growth of 0.79 percent in 2024.
The Institute of Supply Management’s (ISM) Manufacturing Purchasing Managers Index is an important leading indicator that predicts where manufacturing activity will head in the coming months. The ISM Purchasing Managers Index reached an all-time high in the first quarter of 2021 but has been on a steady decline since then stemming from worries that the recession may deepen in 2023. However, the index appears to stay above the value of 50, pointing to an expansion thus far. With more scheduled increases in the Federal Funds rate, further declines below 50 in this index are expected.
Manufacturing Employment: Historical vs. Projected Average Yearly Growth
2023 | Volume XII • Issue 1 | 9
Average
Index Value Months Purchasing
Supply
30 35 40 45 50 55 60 65 70 Jan-01 Jul-01 Jan-02 Jul-02 Jan-03 Jul-03 Jan-04 Jul-04 Jan-05 Jul-05 Jan-06 Jul-06 Jan-07 Jul-07 Jan-08 Jul-08 Jan-09 Jul-09 Jan-10 Jul-10 Jan-11 Jul-11 Jan-12 Jul-12 Jan-13 Jul-13 Jan-14 Jul-14 Jan-15 Jul-15 Jan-16 Jul-16 Jan-17 Jul-17 Jan-18 Jul-18 Jan-19 Jul-19 Jan-20 Jul-20 Jan-21 Jul-21 Jan-22 Jul-22
Months Manufacturing
Employees
Projected 2001M01 2001M11 2002M09 2003M07 2004M05 2005M03 2006M01 2006M11 2007M09 2008M07 2009M05 2010M03 2011M01 2011M11 2012M09 2013M07 2014M05 2015M03 2016M01 2016M11 2017M09 2018M07 2019M05 2020M03 2021M01 2021M11 2022M09 2023M07 2024M05
San Joaquin Valley Business Forecast,
Percentage Change Sample Average 2021 Average 2022 Average 2023 Forecast 2024 Forecast 2020 Average -1.50% 2.33% Actual Optimistic Most Likely Pessimistic -3.00% -2.00% -1.00% 0.00% 1.00% 2.00% 3.00% 0.20% -2.35% -0.33% -0.59% -0.86% 1.04% 0.79% 0.55%
Managers Index Institute of
Management
90,000 95,000 100,000 105,000 110,000 115,000 120,000 125,000 130,000
Employment Number of
Actual
In 2022, leisure and hospitality services employment continued to be the Valley’s fastest-growing employment category. Even after a 4 percent drop from 2021, employment in this category maintained the top position in terms of the speed of growth. Leisure and hospitality services employment grew 12.71 percent in 2022 and is expected to stay below 135,000 by the end of 2024. If the pandemic had not occurred, employment levels in this category would have already exceeded 145,000 in the Valley.
Multifold growth rates registered in 2021’s and 2022’s long-term benchmark growth for leisure and hospitality services employment increased further, rising to 2.43 percent. Being one of the employment categories most sensitive to changes in economic conditions, about 30,000 workers in this category alone were laid off in 2020. Leisure and hospitality services employment, along with retail trade, hires the greatest number of unskilled workers in the Valley. Projections point to an average annual growth of 1.08 percent in 2023 and 1.70 percent in 2024.
IN 2022, LEISURE AND HOSPITALITY SERVICES EMPLOYMENT
CONTINUED TO BE THE VALLEY’S FASTEST-GROWING
EMPLOYMENT CATEGORY.
Trade, transportation, and utilities employment in the Valley was the only category to post growth, even during the worst months of the pandemic. The pace of growth decreased from 6.63 percent to 4.60 percent in 2022. However, 2022 growth was still more than twice the benchmark growth of 2.04 percent. Even after declining to 4.60 percent in 2022, employment in this category was the Valley’s third fastest-growing category. Trade, transportation and utilities employment is projected to stay below 330,000 by the end of 2024.
Number of Employees
Leisure and Hospitality Services Employment
Actual Projected
Number of Employees
15.00%
10.00%
2001M01 2001M11 2002M09 2003M07 2004M05 2005M03 2006M01 2006M11 2007M09 2008M07 2009M05 2010M03 2011M01 2011M11 2012M09 2013M07 2014M05 2015M03 2016M01 2016M11 2017M09 2018M07 2019M05 2020M03 2021M01 2021M11 2022M09 2023M07 2024M05 65,000 75,000 85,000 95,000 105,000 115,000 125,000 135,000 145,000 155,000 Annual Growth
5.00%
0.00%
-5.00%
-10.00%
Leisure and Hospitality Services Employment: Historical vs. Projected Average Yearly Growth 1.42% 2.51% -16.39%
16.10% 2.38% 1.23% 0.08% -20.00%

-15.00%
Sample Average 2020 Average 2021 Average 2023 Forecast 2024 Forecast 2019 Average
Actual Optimistic Most Likely Pessimistic
Trade, Transportation and Utilities Employment
350,000
330,000
310,000
290,000
270,000
250,000
230,000
210,000
190,000
2001M01 2001M11 2002M09 2003M07 2004M05 2005M03
20.00% 4.39% 3.02% 1.65% Months
Actual Projected
10 | Stanislaus State
Employment Indicators
2007M09 2008M07
2010M03 2011M01 2011M11
2013M07 2014M05 2015M03
2017M09
2006M01 2006M11
2009M05
2012M09
2016M01 2016M11
2018M07 2019M05 2020M03 2021M01 2021M11 2022M09 2023M07 2024M05
Trade, transportation and utilities was the only category that did not switch to a remote work environment since goods have to be physically transported from one location to another, explaining the growth during the pandemic. Truck driver shortages will continue into the coming months but at gradually slowing intensities. Trade, transportation and utilities employment is projected to grow slower than the benchmark pace of growth at an average yearly rate of 1.47 percent in 2023 and then pick up pace and grow at a faster rate of 2.37 percent in 2024.
Valley retail trade employment growth slowed to 2.52 percent in 2022 from 6.30 percent growth in 2021. This slowdown was not surprising considering that retail trade employment is one of the categories in the Valley most sensitive to changes in the interest rate. Retail trade employment is comprised of unskilled workers who are most vulnerable to changes in economic conditions. Employment levels in this category are expected to stay below 160,000 by the end of 2024.
The long-term benchmark growth now stands at 0.97 percent, resulting from continued growth in 2021 and 2022. Additional rate hikes scheduled for the remainder of 2022 will have the most negative impact on this category in 2023. Projections point to a decline of 0.70 percent in 2023 and a switch to positive territory with 2.86 percent growth in 2024.
VALLEY RETAIL TRADE EMPLOYMENT GROWTH
SLOWED TO 2.52%
7.00%
Average Growth
Trade, Transportation and Utilities Employment: Historical vs. Projected Average Yearly Growth
6.00%
5.00%
4.00%
3.00%
2.00%
1.00%
1.91% 1.20% 0.68%
6.63% 2.50% 2.19% 1.89% 1.96% 1.65% 1.34% 0.00%
Sample Average 2020 Average 2021 Average 2023 Forecast 2024 Forecast 2019 Average
Actual Optimistic Most Likely Pessimistic
Retail Trade Employment
Number of Employees 100,000 110,000 120,000 130,000 140,000 150,000 160,000 170,000 180,000 190,000
Months 2001M01 2001M11 2002M09 2003M07 2004M05 2005M03 2006M01 2006M11 2007M09 2008M07 2009M05 2010M03 2011M01 2011M11 2012M09 2013M07 2014M05 2015M03 2016M01 2016M11 2017M09 2018M07 2019M05 2020M03 2021M01 2021M11 2022M09 2023M07 2024M05
Actual Projected
6.00%
4.00%
2.00%
Retail Trade Employment: Historical vs. Projected Average Yearly Growth Annual Growth
-2.00%
8.00% 0.81% -1.41% -4.01%
5.93% 2.80% 2.30% 1.81% 1.48% 0.99% 0.49%
0.00%
-4.00%
-6.00%
Sample Average 2020 Average 2021 Average 2023 Forecast 2024 Forecast 2019 Average
Actual Optimistic Most Likely Pessimistic
2023 | Volume XII • Issue 1 | 11
San Joaquin Valley Business Forecast,
IN 2022
Employment Indicators
Valley wholesale trade employment slowly began to resume the seasonal dynamics that were lost during the pandemic and the drought. More than three times the long-term benchmark rate of growth in wholesale trade employment was surprising given the ongoing drought in 2022. Employment levels in the category are expected to stay below 48,000 by the end of 2024.
Valley wholesale trade employment grew 3.48 percent in 2022, which was more than three times the 2021 growth of 1.01 percent. A farm related category of employment, wholesale trade employment in the Valley was affected little by skyrocketing fertilizer prices resulting from the Ukraine-Russia war. Wholesale trade in the Valley is comprised of necessities, explaining the growth in 2022 despite the higher cost of fertilizers and price of oil. Projections point to 1.15 percent growth in 2023 followed by 2.48 percent growth in 2024.
AFTER DECLINING FOR MANY YEARS EVEN BEFORE THE PANDEMIC, VALLEY INFORMATION EMPLOYMENT
GREW 6.47 % AT THE SECOND-FASTEST RATE IN 2022.
After declining for many years even before the pandemic, Valley information employment grew 6.47 percent at the second-fastest rate in 2022. However, the growth in 2022 was not enough to erase prior years’ continued declines. Employment levels in this category will likely oscillate around 8,500 during the two-year interval.
30,000 32,000 34,000 36,000 38,000 40,000 42,000 44,000 46,000 48,000 50,000 Number of Employees
Wholesale Trade Employment
Annual Growth
Actual Projected
Wholesale Trade Employment: Historical vs. Projected Average Yearly Growth
-6.00% -5.00% -4.00% -3.00% -2.00% -1.00% 0.00% 1.00% 2.00% 3.00% 4.00% 1.00%
Months 2001M01 2001M11 2002M09 2003M07 2004M05 2005M03 2006M01 2006M11 2007M09 2008M07 2009M05 2010M03 2011M01 2011M11 2012M09 2013M07 2014M05 2015M03 2016M01 2016M11 2017M09 2018M07 2019M05 2020M03 2021M01 2021M11 2022M09 2023M07 2024M05 1.35% 3.48% -4.79%
2.80% 2.48% 2.16%
1.47% 1.15% 0.84%
Sample Average
2021 Average 2022 Average 2023 Forecast 2024 Forecast 2020 Average
Actual Optimistic Most Likely Pessimistic
Information Employment
16,500
14,500
12,500
10,500
8,500
Number of Employees 4,500
18,500 2001M01 2001M12 2002M10 2003M08 2004M06 2005M04 2006M02 2006M12 2007M10 2008M08 2009M06 2010M04 2011M02 2011M12 2012M10 2013M08 2014M06 2015M04 2016M02 2016M12 2017M10 2018M08 2019M06 2020M04 2021M02 2021M12 2022M10 2023M08 2024M06
6,500
Months
Actual Projected
12 | Stanislaus State
The long-term benchmark rate decline in information employment slowed to 2.62 percent in 2022. The long-awaited switch in growth from negative to positive territory took place in 2021 and remained positive through 2022, taking away worries of a temporary improvement. Information employment has been problematic over the years due to the increased use of digital social media. Projections point to a decline of 1.65 percent due to slowing economic conditions resulting from further rates rather than industry specific conditions in 2023 and 0.98 percent growth in 2024.
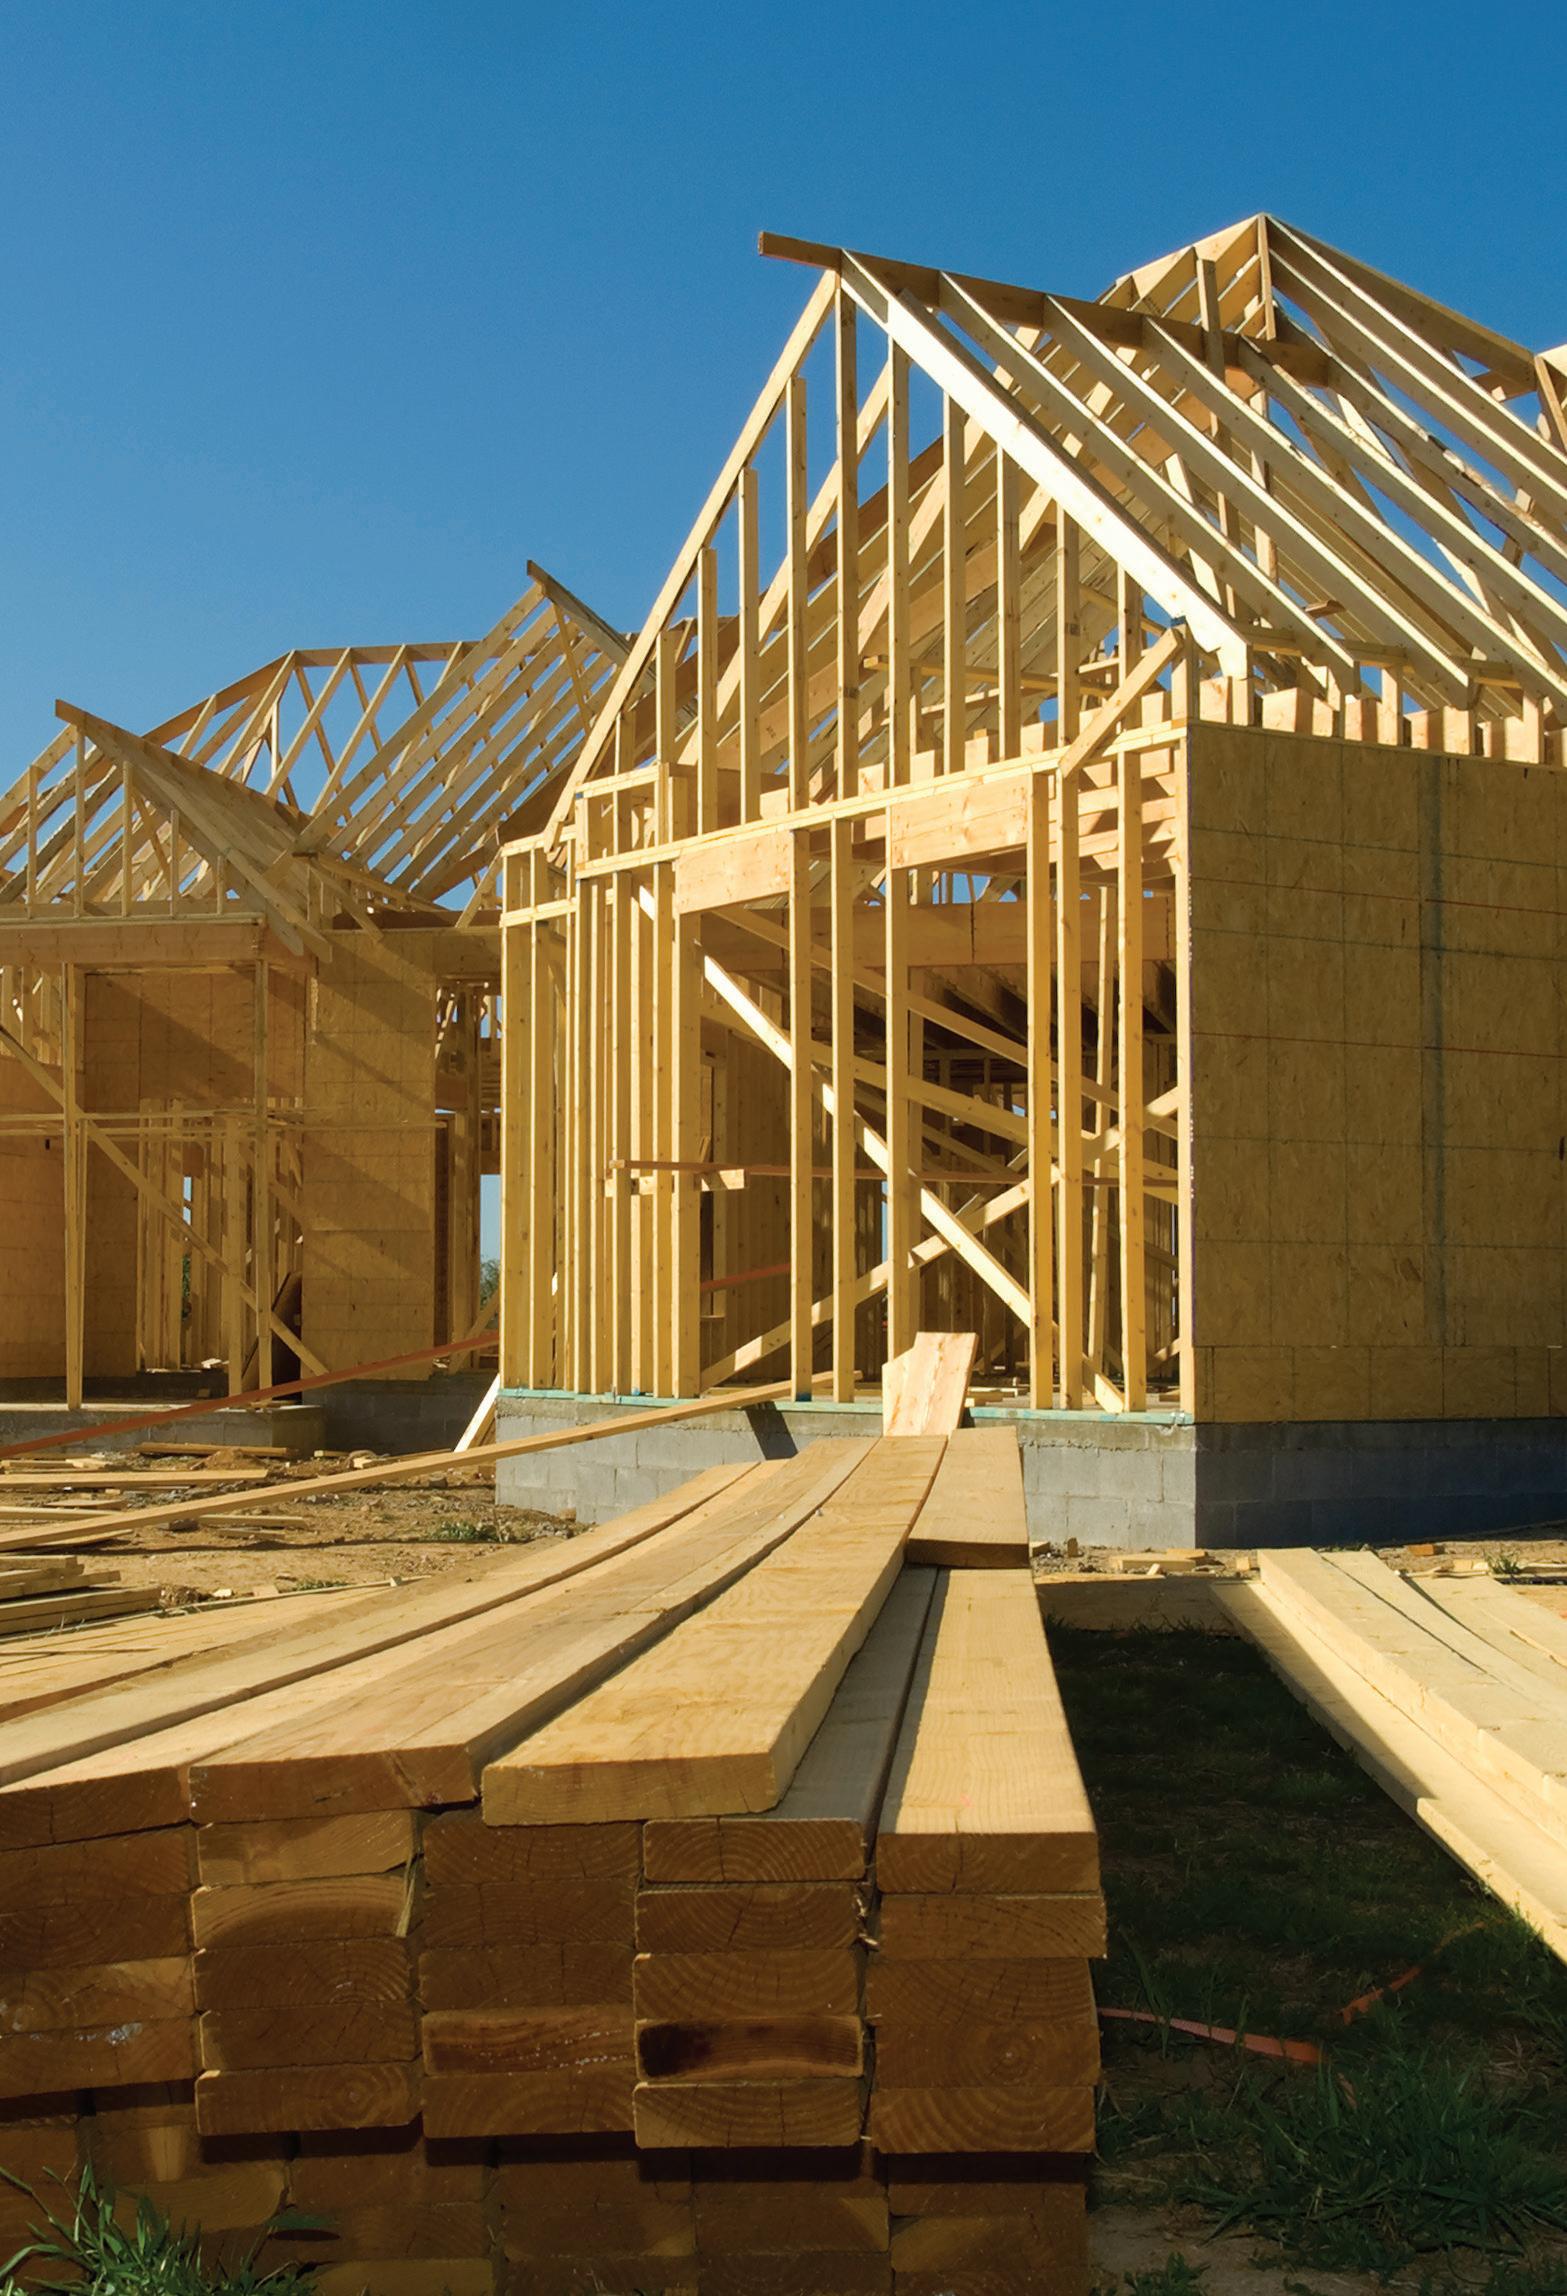
Seasonal variations in Valley construction employment tend to disappear during recessions and other negative shocks to the economy. A clear pattern in seasonal behavior reflects a healthy state of the construction industry, as can be seen in 2022. It is not certain if the reappearing seasonal variation will continue to exist in the coming months due to the Federal Reserve’s stance. Employment in this category grew 3.20 percent in 2022, which was a slower than the 4.95 percent in 2021. Vibrant construction activity throughout the Valley is clearly visible. Inventory shortages will keep construction alive in the coming months despite additional rate hikes.
On the demand side, rate hikes are projected to lower demand for Valley home purchases relative to previous years. Foreclosures, which were at all-time lows during the pandemic, will begin to rise steeply in the months ahead as borrowing costs continue to increase. A rise in unemployment rates would have an amplified effect on this employment category. Projections point to slower growth at an average annual rate of 1.21 percent in 2023 and a faster rate of 2.60 percent in 2024.
Information Employment: Historical vs. Projected Average Yearly Growth
Annual Growth
5.00%
3.36%
0.00%
6.47% -0.28%
1.86% -1.65%
0.98% -3.01%
-10.00%
-5.00%
-15.00%
-20.00%
10.00% -2.62% -18.96%
Sample Average 2020 Average 2021 Average 2022 Average 2023 Forecast 2024 Forecast -25.00%
Actual Optimistic Most Likely Pessimistic
95,000
85,000
75,000
65,000
55,000
0.09% 35,000
Construction Employment Number of Employees Months
45,000
Actual Projected
Construction Employment: Historical vs. Projected Average Yearly Growth
2001M07 2002M05 2003M03 2004M01 2004M11 2005M09 2006M07 2007M05 2008M03 2009M01 2009M11 2010M09 2011M07 2012M05 2013M03 2014M01 2014M11 2015M09 2016M07 2017M05 2018M03 2019M01 2019M11 2020M09 2021M07 2022M05 2023M03 2024M01 2024M11 1.23% -2.26%
4.95% 1.61% 1.21% 0.81%
Annual Growth 3.02% 2.60% 2.18%
Sample
Average
Actual Optimistic Most Likely Pessimistic
2023 | Volume XII • Issue 1 | 13
San Joaquin Valley Business Forecast,
Average 2020
2021 Average 2022 Average 2023 Forecast 2024 Forecast -3.00% -2.00% -1.00% 0.00% 1.00% 2.00% 3.00% 4.00% 5.00% 6.00% 3.20%
Employment Indicators
Government employment, a lagged indicator of economic activity, switched from negative to positive territory in 2022. Considering this category makes up about 20 percent of the Valley’s total employment, government employment is an important driver of economic activity. In the Valley, government employment grew 3.52 percent in 2022 — about five times the long-term benchmark rate of 0.76 percent — quickly recovering from a 1.35 percent decline in 2021.
Seasonally adjusted employment levels in this category are likely to remain below 300,000 in the coming two-year interval. A discrepancy of about 12,500 employees will continue to prevail in the months ahead. Projections point to an average yearly growth of 2.01 in 2023 and 1.60 percent in 2024. The faster projected increase in 2023 results from displaying a lagged response to changes in economic conditions.
3.52 % IN 2022
Valley financial activities employment was the only category that experienced a decline in 2022. The decline constituted a third consecutive year of falling employment. However, at negative 0.34 percent, the decline in 2022 was less than the two prior years’ decline of 3.83 percent and 0.98 percent in 2020 and 2021 respectively. Given a slowing economy, a switch from negative to positive territory is not expected in 2023. Employment levels in this category are projected to drop below 42,000 by the end of 2024.
Unlike other series of employment, the prevailing growth trend before the pandemic ceased to reappear in the recovery months afterwards. Instead, the trend after the pandemic appears to be flat. Financial activities employment is projected to decline further in 2023 at 0.80 percent and then switch to positive territory and grow at 1.29 percent in 2024.
235,000 245,000 255,000 265,000 275,000 285,000 295,000 305,000 315,000 325,000

Government Employment
Number of Employees Months
Actual Projected
-5.00% -4.00% -3.00% -2.00% -1.00% 0.00% 1.00% 2.00% 3.00% 4.00%
Financial Activities Employment
Number of Employees Months
2001M01 2001M11 2002M09 2003M07 2004M05 2005M03 2006M01 2006M11 2007M09 2008M07 2009M05 2010M03 2011M01 2011M11 2012M09 2013M07 2014M05 2015M03 2016M01 2016M11 2017M09 2018M07 2019M05 2020M03 2021M01 2021M11 2022M09 2023M07 2024M05 37,000 39,000 41,000 43,000 45,000 47,000 49,000 51,000
2001M01 2001M09 2002M05 2003M01 2003M09 2004M05 2005M01 2005M09 2006M05 2007M01 2007M09 2008M05 2009M01 2009M09 2010M05 2011M01 2011M09 2012M05 2013M01 2013M09 2014M05 2015M01 2015M09 2016M05 2017M01 2017M09 2018M05 2019M01 2019M09 2020M05 2021M01 2021M09 2022M05 2023M01 2023M09
Actual Projected
14 | Stanislaus State
K Completed UPDATED 11/7 0.76% -3.81% 3.52% -1.35% 2.33% 1.90% 2.01% 1.60% 1.69% 1.31% Government Employment: Historical vs. Projected Average Yearly Growth Actual Optimistic Most Likely Pessimistic Annual Growth Sample Average 2020 Average 2021 Average 2022 Average 2023 Forecast 2024 Forecast
IN THE VALLEY, GOVERNMENT EMPLOYMENT GREW
Due to the Federal Reserve's commitment to tame inflation by resorting to a series of interest rate hikes, tapering and balance sheet reduction, the Valley’s economic activity is expected to slow in 2023. An official recession already began in the first and second quarters of 2022, but the labor market has been strong. There are increasing concerns that the Federal Reserve is rushing to increase rates without first observing the impact on the economy, since the effect of any rate hikes occurs with a significant lag. Incoming unemployment rate numbers point to a minimum rate reached in May 2022, and unemployment rates have gradually increased since then. Given the economic landscape, a return to a clearly defined expansionary phase of the business cycle is not expected until 2024.

San Joaquin Valley Business Forecast, 2023 | Volume XII • Issue 1 | 15 -0.35% 0.55% -3.83% -1.07% 1.78% 1.64%
1.21% 1.14% 0.77% Financial Activities Employment: Historical vs. Projected Average Yearly Growth Annual Growth Actual Optimistic Most Likely Pessimistic Sample Average 2019 Average 2020 Average 2021 Average 2023 Forecast 2024 Forecast -5.00% -4.00% -3.00% -2.00% -1.00% 0.00% 1.00% 2.00% 3.00% K Completed UPDATED 11/7
1.46%
AN OFFICIAL RECESSION ALREADY BEGAN IN THE FIRST AND SECOND QUARTERS OF 2022, BUT THE LABOR MARKET HAS BEEN STRONG.
Housing permits rose 18.92 percent in 2022 following a 35.65 percent increase in 2021. Considering the long-term benchmark rate is 8.21 percent, the increase in both years was strong. Even during the pandemic, housing permits increased by 13.26 percent. Given the economy’s slowing, Valley housing permits are not projected to exceed 1,000 per month by the end of 2024.
In 2022, Stockton took the lead with 1,801 permits, while Fresno dropped from first to second with 1,252 permits. Bakersfield issued 1,040 permits followed by Visalia’s 702 permits and Madera’s 539. There was a significant increase from the prior year in Modesto with 384 permits issued this year compared to 50 permits in 2021. Hanford and Merced issued 278 and 177 permits respectively compared to no permits issued in 2021. As rate hikes basically continue and the impact begins to be felt more intensely, the average annual growth in 2023 is projected to slow to 3.60 percent and then pick up some pace in 2024 at 8.04 percent.
The foreclosures-started series remained at their lowest level ever in 2022 as it did in 2021. However, it is still early for foreclosures to begin displaying a rising trend. As the unemployment rate begins to increase gradually, there is likely to be some upward foreclosure activity. Valley bank accruals began to rise further in 2022, an early indicator of what is to come.
Perhaps the most concerning indicator to watch is the 30-year fixed interest rate, which began to display the steepest and most prolonged increase ever seen in the series. After reaching an all-time minimum of 2.68 percent in the first quarter of 2021, long-term rates have steadily risen along with the Federal Reserve’s continued rate hikes. Such a drastic pattern is the underlying concern that rates are being increased too fast and are too high for the economy to achieve a soft landing.
Number of Permits
3,000
2,500
2,000
1,500
1,000
500 0
Single Family Building Permits
2004M01 2004M09 2005M05 2006M01 2006M09 2007M05 2008M01 2008M09 2009M05 2010M01 2010M09 2011M05 2012M01 2012M09 2013M05 2014M01 2014M09 2015M05 2016M01 2016M09 2017M05 2018M01 2018M09 2019M05 2020M01 2020M09 2021M05 2022M01 2022M09 2023M05 2024M01 2024M09
Months
Actual Projected
25.00% 30.00% 35.00% 40.00%
35.65% Annual Growth 18.92%
15.00% 20.00% 10.00%
K Completed UPDATED 11/21 5.01% 3.60% 2.20%
Single-Family Building Permits: Historical vs. Projected Average Yearly Growth 0.00% 5.00%
8.24% 13.26%
9.23% 8.04% 6.84% Percentage
0 0.3 0.6 0.9 1.2 1.5 1.8 2.1 2.4
Actual Optimistic Most Likely Pessimistic
Foreclosures Started in California Mortgage Bankers Association of America Q1 1999 Q4 1999 Q3 2000 Q2 2001 Q1 2002 Q4 2002 Q3 2003 Q2 2004 Q1 2005 Q4 2005 Q3 2006 Q2 2007 Q1 2008 Q4 2008 Q3 2009 Q2 2010 Q1 2011 Q4 2011 Q3 2012 Q2 2013 Q1 2014 Q4 2014 Q3 2015 Q2 2016 Q1 2017 Q4 2017 Q3 2018 Q2 2019 Q1 2020
Quarters
16 | Stanislaus State Housing Sector
Sample Average 2020 Average 2021 Average 2022 Average 2023 Forecast 2024 Forecast
Q4 2020 Q3 2021
Fresno, Bakersfield-Delano, HanfordCorcoran, Madera-Chowchilla, Merced, Modesto, Stockton and Visalia-Porterville comprise the Bureau of Labor Statistics’ eight Metropolitan Statistical Areas (MSAs) that make up the San Joaquin Valley. The aggregated data from these eight MSAs constitute the Valley’s total single-family building permits.
Valley home values increased at an average annual rate of 21.46 percent at the nominal level, which corresponded to 13.17 percent real appreciation after removing the effect of inflation. Double-digit increases are clearly not sustainable and mean reversion to the long-term benchmark rates is likely to occur in the coming two-year interval. Because lenders are stricter this year than in 2021, and the unemployment rate is low, a crisis at the level of the Great Recession is not expected. However, there would be concerns if double-digit unemployment rates prevail in the economy. In addition, inventory shortages, homeowners hanging on to their property rather than selling and home sales resulting from family-related events are other reasons to expect a correction of a lesser degree in the coming months.

The increase in home values was more than three times the benchmark rate of 5.96 percent. Home value appreciation of 16.83 percent in 2021 was the fastest since the Great Recession. The increase in 2022 — even at a higher pace of 21.46 percent — quickly took over the record set in 2022. Even in real terms, the appreciation was one of the fastest and more than twice the benchmark rate. Therefore, home values are expected to rise at a slower pace and rates will be more consistent with benchmark rates in the coming two-year interval.
A surprise Metropolitan Statistical Area (MSA) took the lead in fastest increase in home values in 2022. Madera reported a 23.10 percent increase in 2022, ending the reign of Stockton and Bakersfield, which registered 22.60 percent and 22.55 percent growth, respectively. Visalia came in with the fourth fastest increase in average home values at 21.18 percent. Fresno trailed Visalia at 20.56 percent. Merced reported 22.30 percent growth followed by Modesto at 19.88 percent average yearly appreciation. Hanford came last with a 19.47 percent increase in 2022. Projections point to an 8.61 percent increase in 2023 and a 6.33 percent increase in 2024.
San Joaquin Valley Business Forecast, 2023 | Volume XII • Issue 1 | 17 3 2 4 5 6 7 8 9 10 Percentage Freddie Mac Months 30-Year Fixed Rate 1993M10 1994M07 1995M04 1996M01 1996M10 1997M07 1998M04 1999M01 1999M10 2000M07 2001M04 2002M01 2002M10 2003M07 2004M04 2005M01 2005M10 2006M07 2007M04 2008M01 2008M10 2009M07 2010M04 2011M01 2011M10 2012M07 2013M04 2014M01 2014M10 2015M07 2016M04 2017M01 2017M10
Percentage Change Over the Previous Year -40 -30 -20 -10 0 10 20 30 40 Actual Projected Quarters Yearly Percentage Change in Housing Prices 2000q1 2000q4 2001q3 2002q2 2003q1 2003q4 2004q3 2005q2 2006q1 2006q4 2007q3 2008q2 2009q1 2009q4 2010q3 2011q2 2012q1 2012q4 2013q3 2014q2 2015q1 2015q4 2016q3 2017q2 2018q1 2018q4 2019q3 2020q2 2021q1 2021q4 2022q3 2023q2 2024q1 2024q4 5.96% 5.41% 21.46% 16.83% 9.98% 7.87% 8.61% 6.33% 7.75%
2018M07 2019M04 2020M01 2020M10 2021M07
4.79% Yearly Growth in Housing Prices: Historical vs. Projected Average Yearly Growth Annual Yearly Growth Actual Optimistic Most Likely Pessimistic Sample Average 2020 Average 2021 Average 2022 Average 2023 Forecast 2024 Forecast 0.00% 5.00% 10.00% 15.00% 20.00% 25.00%
Inflation and Prices
It is well known that inflation runs higher in the west than at the national level. When the two series display identical or reversing patterns similar to what occurred during the Great Recession, economic activity declines. There appears to be a tendency for such a pattern in recent months, acting as a coincidental indicator of a slowdown for our region.
At an average yearly rate of 8.29 percent, the inflation rate in 2022 was more than three times the benchmark rate of 2.61 percent and more than twice 3.66 percent rate in 2021. Both cost-push and demand-pull factors continued to put upward pressure on the overall price level in 2022. Given that inflation is driven by the price of oil, OPEC’s decision to curtail output is likely to maintain this pressure.
Other factors that put upward pressure on overall price levels are the ongoing Ukraine-Russia war, unresolved supply chain issues and wages, although the effect of the latter has subsided during the second half of 2022. Inflation rate projections for the Western region point to an average yearly increase of 3.36 percent in 2023 and 2.31 percent in 2024.
Yearly Inflation Rate
-2.5 -1.5 -0.5 0.5 1.5 2.5 3.5 4.5 5.5

Inflation Rate: Nationwide vs. West
2001M01 2001M07 2002M01 2002M07 2003M01 2003M07 2004M01 2004M07 2005M01 2005M07 2006M01 2006M07 2007M01 2007M07 2008M01 2008M07 2009M01 2009M07 2010M01 2010M07 2011M01 2011M07 2012M01 2012M07 2013M01 2013M07 2014M01 2014M07 2015M01 2015M07 2016M01 2016M07 2017M01 2017M07 2018M01 2018M07 2019M01 2019M07 2020M01 2020M07 2021M01 2021M07 2022M01 2022M07
Months
West Nationwide
U.S. West Inflation Rate
Yearly Percentage Change
2001M01 2001M09 2002M05 2003M01 2003M09 2004M05 2005M01 2005M09 2006M05 2007M01 2007M09 2008M05 2009M01 2009M09 2010M05 2011M01 2011M09 2012M05 2013M01 2013M09 2014M05 2015M01 2015M09 2016M05 2017M01 2017M09 2018M05 2019M01 2019M09 2020M05 2021M01 2021M09 2022M05 2023M01 2023M09 2024M05
Actual Projected
U.S. West Inflation Rate: Historical vs. Projected Average Yearly Growth
Yearly Percentage Change
18 | Stanislaus State
Months -4.0 -2.0 0.0 2.0 4.0 8.0 6.0 10.0 0.00% 1.00% 2.00% 3.00% 4.00% 5.00% 6.00% 7.00% 8.00% 9.00% 2.61% 1.76% 2.66% 8.29% 3.72% 2.72% 3.36% 2.31% 3.00% 1.90%
Average 2020 Average 2021 Average 2022 Average 2023 Forecast 2024 Forecast
Actual Optimistic Most Likely Pessimistic Sample
IT IS WELL KNOWN THAT INFLATION RUNS HIGHER IN THE WEST THAN AT THE NATIONAL LEVEL.
After a significant 8.48 percent increase in 2020, wages decreased steadily, registering 4.93 percent increase in 2021 and 3.28 percent increase in 2022. As the recovery was underway, workers’ reluctance to re-enter the workforce gradually dissipated, increasing the supply of labor and decreasing wage growth by nearly one-third of rates seen in 2020. Wage growth in 2022 is now in line with the benchmark growth of 3.24 percent and is likely to oscillate around that value in the coming months.
The reservation wage of a typical Valley employee fell as workers gradually reported to work, brushing away worries about infection, vaccinations and being better prepared against variant strains of the COVID-19 virus. Average weekly wages in the Valley are likely to stay below $1,050 by the end of 2024. Projections point to an average yearly increase of 3.08 percent in 2023 and a 2.09 percent increase as inflation subsides in 2024.
During 2022, the average rate of inflation stood at 8.29 percent. During the same time, average weekly wages rose 3.28 percent, resulting in a fall in real wages and a remarkably high loss of purchasing power of 5.01 percent. This loss in purchasing power will continue in the coming months.

San Joaquin Valley Business Forecast, 2023 | Volume XII • Issue 1 | 19 DURING 2022, THE AVERAGE
8.29 % Quarters 450 550 650 750 850 950 1050 1150 Quarterly Average Weekly Wages Actual Projected Average Weekly Wage 2001q1 2001q4 2002q3 2003q2 2004q1 2004q4 2005q3 2006q2 2007q1 2007q4 2008q3 2009q2 2010q1 2010q4 2011q3 2012q2 2013q1 2013q4 2014q3 2015q2 2016q1 2016q4 2017q3 2018q2 2019q1 2019q4 2020q3 2021q2 2022q1 2022q4 2023q3 2024q2 3.21% 3.81% 8.48% 4.74% 3.16% 1.76% 2.75% 1.41% 2.35% 1.06% Weekly
Historical
Average Yearly
Sample Average 2019 Average 2020 Average 2021 Average 2023 Forecast 2024 Forecast 0.00%
Quarters Inflation Wage Growth Yearly
Average Percentage Change -4.0 -2.0 0.0 2.0 4.0 6.0
10.0 12.0 14.0 2002q1 2002q4 2003q3 2004q2 2005q1 2005q4 2006q3 2007q2 2008q1 2008q4 2009q3 2010q2 2011q1 2011q4 2012q3 2013q2 2014q1 2014q4 2015q3 2016q2 2017q1 2017q4 2018q3 2019q2 2020q1 2020q4 2021q3
RATE OF INFLATION STOOD AT
Wage Growth:
vs. Projected Average Yearly Growth
Growth Actual Optimistic Most Likely Pessimistic
1.00% 2.00% 3.00% 4.00% 5.00% 6.00% 7.00% 8.00% 9.00%
Wage Growth vs. Inflation
8.0
The upward movement in bank assets in nonaccruals became more pronounced in the first and second quarters of 2022 when the trend became steeper compared to previous quarters. With the passage of time after the end of mortgage forbearance programs by September 2021, nonaccruals naturally picked up speed as rates continued to rise. Further increases in interest rates will likely make it harder for Valley residents to pay their mortgages and meet their other financial obligations, leading to even steeper increases in nonaccruals.
The upward movement in bank assets in default 90-plus days was earmarked with a significant spike in the first and second quarters of 2022. This spike was confirmed by the Federal Deposit Insurance Corporation (FDIC) for accuracy. At least one of the community banks reported a roughly ten-fold increase in assets in default 90-plus days. Keep in mind that to make both series comparable assets, in default 90 days is multiplied by 10. As in previous reports, the pattern observed in bank assets in default 30 to 89 days and assets in default 90-plus days is now consistent in the direction of change. As rates rise further and unemployment continues to gradually rise, the trend in both series is likely to become much steeper.
Total Bank Deposits (in $ Thousands)
Total Deposits
24,000,000
19,000,000
14,000,000
9,000,000
4,000,000
2003q1 2003q4 2004q3 2005q2 2006q1 2006q4 2007q3 2008q2 2009q1 2009q4 2010q3 2011q2 2012q1 2012q4 2013q3 2014q2 2015q1 2015q4 2016q3 2017q2 2018q1 2018q4 2019q3 2020q2 2021q1 2021q4 2022q3 2023q2 2024q1
Quarters
Actual Projected
S Completed UPDATED 11/15
Total Bank Deposits: Historical vs. Projected Average Yearly Growth
Average Yearly Growth
25.00%
20.00%
15.00%
34,000,000 29,000,000 \ 8.95%
10.00%
5.00%
0.00%
21.19% 21.70% 9.57% 7.21% 9.74% 5.96% 8.50% 4.74% 7.26%
Actual Optimistic Most Likely Pessimistic
Assets in Nonaccrual
200,000
150,000
100,000
Sample Average 2020 Average 2021 Average 2022 Average 2023 Forecast 2024 Forecast -
Thousand Dollars 2003q2 2003q4 2004q2 2004q4 2005q2 2005q4 2006q2 2006q4
250,000 Quarters
50,000
2020q4 2021q2 2021q4 2022q2
20 | Stanislaus State Banking and Capital Markets
Federal Deposit Insurance Corporation 2007q2 2007q4 2008q2 2008q4 2009q2 2009q4 2010q2 2010q4 2011q2 2011q4 2012q2 2012q4 2013q2 2013q4 2014q2 2014q4 2015q2 2015q4 2016q2 2016q4 2017q2 2017q4 2018q2 2018q4 2019q2 2019q4 2020q2
There was a clear change in the dynamics of the Valley’s community bank total deposits and net loans in 2022. This change resulted from Federal Reserve’s interest rate hikes, balance sheet reduction and tapering which began in the first quarter of 2021. Valley total bank deposits rose 9.57 percent in 2022 — about half the rate seen in 2020 and 2021. The 9.57 percent increase in 2022 was also consistent with the long-term benchmark rate of 8.95 percent, and therefore was more sustainable in the long run. Given the slowing activity, Valley total bank deposits are projected to increase at an average annual rate of 5.96 percent, a value below the benchmark rate, and pick up an increase of 8.50 percent in 2024, at rates more in line with the long-term benchmark growth rate.
Community banks became much stricter in extending loans in 2022 compared to 2021. This is reflected in the rate of increase in community banks net loans and leases, which came to an abrupt halt, registering a trivial 0.10 percent increase in 2022. This drastic drop in growth rate was quite significant considering net loans and leases increased 11.36 percent in 2021 and 17.63 percent in 2020. Furthermore, when compared with the benchmark growth rate of 7.75 percent, a 0.10 percent change basically reported no increase from the previous year. This phenomenon was a first since we started tracking the series in 2001, bringing with it worries of a deepening recession.
With interest rates continuing to rise further, balance sheet reduction and tapering on the part of the Federal Reserve, a faster falling trajectory of the economy is likely in the two-year period ahead. Projections point to net loans and leases increasing at an average yearly rate of 2.48 percent in 2023 — about one-third of the benchmark rate and 5.79 percent in 2024.
The worry is whether the recession will deepen, causing unemployment rates to rise significantly. Both community bank deposits and net loans and leases are likely to grow less than their benchmark growth rates in the coming months, only to improve to the rates consistent with expansion in 2024.
COMMUNITY BANKS BECAME MUCH STRICTER IN EXTENDING LOANS IN 2022
COMPARED TO 2021.
San Joaquin Valley Business Forecast, 2023 | Volume XII • Issue 1 | 21
Quarters Assets in Default 30+ Days Assets in Default 30-89 Days Assets in Default 90+ Days * 10 Thousand Dollars 2003q2 2004q1 2004q4 2005q3 2006q2 2007q1 2007q4 2008q3 2009q2 2010q1 2010q4 2011q3 2012q2 2013q1 2013q4 2014q3 2015q2 2016q1 2016q4 2017q3 2018q2 2019q1 2019q4 2020q3 2021q2 2022q1 K Completed UPDATED 11/14 Net Loans and Leases (in $
Net Loans and Leases Actual Projected Quarters
2003q1 2004q1 2005q1 2006q1 2007q1 2008q1 2009q1 2010q1 2011q1 2012q1 2013q1 2014q1 2015q1 2016q1 2017q1 2018q1 2019q1 2020q1 2021q1 2022q1 2023q1 2024q1 7.74% 17.63% 0.10% 11.36% 3.47% 6.80% 2.48% 5.79% 1.49% 4.79% Yearly Growth
Average Yearly
Actual Optimistic Most Likely Pessimistic 0.00% 2.00% 4.00% 6.00% 8.00% 10.00% 12.00% 14.00% 16.00% 18.00% 20.00% Sample Average 2020 Average 2021 Average 2022 Average 2023 Forecast 2024 Forecast
10,000 20,000 30,000 40,000 50,000 60,000 70,000 80,000
Thousands)
3,300,000 5,300,000 7,300,000 9,300,000 11,300,000 13,300,000 15,300,000 17,300,000
Net Loans and Leases: Historical vs. Projected
Growth
Given the Federal Reserve’s continuation of rate hikes, our projections point to slowing activity in the coming months. The Valley economy, along with the nation, has been in an official recession in the first and second quarters of 2022. However, during the same period, labor markets have been tight and unemployment rates incredibly low, therefore brightening the picture. With OPEC deciding to cut back oil production during its October 2022 meeting, high inflation driven by the price of oil may linger a bit longer.
Valley total employment is likely to decline in 2023 but will display some growth in 2024. In 2022, total employment in all counties grew at rates significantly higher than their respective benchmark growth rates. Fresno County reported the fastest growth, followed by Tulare County. Merced County registered the third fastest growth. Madera County was next in employment growth followed by San Joaquin County. Kings and Stanislaus counties were the remaining two counties that grew several times their typical growth rates.
The fastest-growing employment category was leisure and hospitality services, followed by information employment, a surprise since it is historically problematic in achieving sustained growth. Trade, transportation and utilities employment grew third fastest, followed by retail services employment. Manufacturing employment grew at the fourth fastest pace, followed by Valley construction employment. Education and health services employment displayed the once again robust behavior in 2022 and in prior years. Financial activities employment was the only category to report a decline in 2022, as it did in 2021 and 2020.
Home values increased 21.46 percent in 2022, bringing back worries of a housing market bubble. Any pull back will not likely be to the same degree seen during the 2008 recession simply because lenders are stricter in 2022 than the prior year, unemployment rates are still low and homeowners are holding on to their homes, indicating that any selling that takes place is likely due to a family event or is investment related. However, the double-digit increases seen in 2022 and 2021 are clearly not sustainable and a correction back to rates more in line with benchmark growth rates is expected.
Inflation is likely to decline at very gradual rates in the coming months but a fall to the Fed's target rate of 2 percent is not likely to occur in the very near future. Valley average weekly wages rose about 5 percent less than the inflation rate in 2022. Thus, there was a significant fall in purchasing power of the Valley consumer.
In 2022, Valley community bank total deposits increased about half the rate of the prior year. There was no growth whatsoever in Valley net loans and leases, reflecting the stricter stance of community banks in extending loans. Valley community bank assets in nonaccrual began trending more steeply in 2022 than in 2021 and are more likely to increase if unemployment rates significantly rise. Community bank assets in default 30 to 89 days and assets in default 90-plus days displayed a steeper increase in 2022 than previous years. There was a big spike in assets in default 90-plus days when at least one of the community banks reported a roughly ten-fold increase in the first and second quarters of 2022.
Given the economic landscape, it is increasingly important for Valley residents to leverage down, increase cash holdings, lock in fixed rates by switching from flexible rates and rent instead of purchase homes to protect their financial well-being in the coming months.
22 | Stanislaus State
Concluding
Remarks
Disclaimer
Although information in this document has been obtained from sources believed to be reliable, we do not represent or warrant its accuracy, and such information may be incomplete or condensed. This document does not constitute a prospectus, offer, invitation or solicitation to buy or sell securities and is not intended to provide the sole basis for any evaluation of the securities or any other instrument which may be discussed in it. All estimates and opinions included in this document constitute our judgment as of the date of the document and may be subject to change without notice. This document is not a personal recommendation, and you should consider whether you can rely upon any opinion or statement contained
in this document without seeking further advice tailored for your own circumstances. This document is confidential and is being submitted to selected recipients only. It may not be reproduced or disclosed (in whole or in part) to any other person without our prior written permission. Law or regulation in certain countries may restrict the manner of distribution of this document, and persons who come into possession of this document are required to inform themselves of and observe such restrictions. We, or our affiliates, may have acted upon or have made use of material in this document prior to its publication. You should seek advice concerning any impact this investment may have on your personal tax position from your own tax adviser.

2023 | Volume XII • Issue 1 | 23
San
Joaquin
Valley Business Forecast,
csustan.edu/sjvbf
