
of the
Past: Virtual Journey into
by Nika Jancsary andAenna Linzbauer (PP: University of Vienna) with contributions of exhibition data by Sarah Kiszter (UMJ) and other partners

Lost Landscapes Project Danube’sArchaeological eLandscapes (Output D.T.3.1.5)
1. Introduction 5
1.1 The project ”Danube’s archaeological eLandscapes” 5

1.2 The exhibition ”Stories of the Past“ 5 1 2 1 Introduction 5
1.2.2 Exhibition venues, durations and setups 6
2. Evaluation of the survey results 10
2 1 Summative overview 10
2.1.1Total number of visitors by age 10 2 1 2Total number of visitors by gender 11
2 1 3Total number of visitors by professional connection to Cultural Heritage 12 2 1 4Total number of visitors by country 13
2 1 5 Most visited sites in immersive VR 14
2.1.6 Most visited sites with app 15
2 1 7Total number of visitors by usage of digital tools and problems 16 2 1 8Total number of visitors by impact of digital tools 18
2 2 Evaluation by age groups 20
2.2.1Age 7-12 20 2 2 2Age 13-17 21 2 2 3Age 18-24 21 2 2 4Age 25-34 22 2 2 5Age 35-44 23 2.2.6Age 45-54 24 2 2 7Age 55-64 25 2 2 8Age 65+ 26
2 3 Evaluation by digital knowledge groups 27
2 3 1 Digital Natives 27
2 3 2 Mostly Digital Immigrants 28 2 3 3 Mostly traditional media 29
2 4 Experiences and impact by country 30
2 4 1 Visitors inAustria 30
2.4.2 Visitors in Bulgaria 31 2 4 3 Visitors in Croatia 33 2 4 4 Visitors in Hungary 34 2 4 5 Visitors in Romania 35 2 4 6 Visitors in Serbia 37
2.4.7 Visitors in Slovakia 38 2 4 8 Visitors in Slovenia 39
2.5 Usage of digital tools: Experiences and problems 41
2 5 1 Immersive Virtual Reality glasses 41
2.5.1.1Austrian sites in VR: Großklein & Flavia Solva 41 2 5 1 2 Bulgarian sites in VR: Cherven & Ivanovo 42 2 5 1 3 Croatian site in VR: Kaptol 42
2 5 1 4 Hungarian sites in VR: Villa Baláca & Vértesszőlős 42 2 5 1 5 Romanian sites in VR: Nufăru & Cârna 42 2.5.1.6 Serbian sites in VR: Vatin Bela Bara & VršacAt 42
2
2 5 1 7 Slovakian site in VR: Rankovce 42
2 5 1 8 Slovenian site in VR: Ulaka 43
2.5.2 (App on) touch screen 43
2 5 2 1Austrian sites with app: Großklein & Flavia Solva 43
2 5 2 2 Bulgarian sites with app: Cherven & Ivanovo 43 2 5 2 3 Croatian sites with app Vindija & Viskovci 43
2.5.2.4 Slovakian site: Rankovce 43 2 5 3 (App on) monitor 44
2 5 3 1Austrian sites with app and monitors: Großklein & Flavia Solva 44
2 5 3 2 Bulgarian sites with app and monitors: Cherven & Ivanovo 44 2 5 3 3 Croatian sites with app and monitors: Vindija & Viskovci & Kaptol 44 2.5.3.4 Hungarian sites with app and monitors: Vértesszőlős & Villa Baláca 44 2 5 3 5 Romanian sites with app and monitors: Nufăru & Cârna 44
2 5 3 6 Serbian sites with app and monitors: Vatin Bela Bara & VršacAt 45 2 5 3 7 Slovenian site with app and monitors: Ulaka 45
2.5.4 (App on) mobile phone 45 2 5 4 1 Romanian sites: Nufăru & Cârna 45 2 5 4 2 Slovenian sites: Ulaka 45 2 5 5 Usage by age 45 2 5 6 Usage by gender 46 2.6 Impact of the exhibition: 47 2 6 1 Impact by age 47 2 6 2 Impact by gender 48 2 6 3 Impact by professional connection to Cultural Heritage 48 2.7 Unhappy visitors and problems with digital tools 48 2 7 1 Unhappy visitors by age 48 2 7 2 Unhappy visitors by gender 48 2 7 3 Professional connection to Cultural Heritage (n=48) 49 2 7 4 Usage and problems 49 2.7.5 Impact 49 3. Key findings 49 3 1 Key findings regarding demographic groups 49 3 2 Key findings regarding exhibition visits in different countries/setups 50 3.3 Key findings regarding usage of digital tools and problems 51 3 4 Key findings regarding impact, learning and preferences 52 4. Comparison to guidelines for digital exhibition strategies 52 4 1 Museum media, digital storytelling and cultural heritage 52 4 2 Current and future use of digital tools in museums 53 4.3 Key points for good practice 54 5. Recommendations/Lessons learned 55 6 Sources 57 7 Appendix 59
3
5
1
1. Introduction
1.1 The project ”Danube’s archaeological eLandscapes”
The culturally rich and diverse Danube region, connecting ten countries through the river and nine others through its basin, stretches from theAlps across the Pannonian Plain, through the Carpathian Basin and the Balkans before the river empties into the Black Sea The archaeological heritage of the many communities that historically inhabited these areas „is a valuable remnant of millennia of development of European society and a carrier of essential data about our past ”1
It is therefore appropriate to research this common cultural area and its prehistoric development on a transnational basis and to present the rich cultural heritage to a broad public This is the basic idea of the project „Virtual archaeological landscapes of the Danube region/Danube ́sArchaeological eLandscapes“, which is co-financed by the Interreg Danube Transnational programme. Its priority is to increase the visibility of the archaeological Cultural Heritage regionally, nationally and internationally New technologies are employed throughout to increase attraction for an integration into the region’s tourism offers 2
The project focuses on a long-term cross-promotion campaign for archaeological Cultural Heritage in the region and also supports one of the largest networks of major archaeological institutions New transnational archaeological routes will be created as tools for preservation of this heritage and the exisiting route of the Iron-Age-Danube project (RegioStars 2018 finalist) will be promoted 3
1.2 The exhibition ”Stories of the Past“
1.2.1 Introduction
The key outcome of the project is the exhibition “Stories of the Past: Digital Journey into Lost Landscapes“, in the framework of which 10 European countries presented the most important and unique archaeological sites and landscapes in the Danube region to bring their Cultural Heritage closer to the public in a new and attractive way 4 The idea was to convey past worlds to visitors in virtual form, bringing the landscapes as a unifying theme back to life contextualised by archaeological excavations, written records and archaeological finds Additionally, visitors are offered insights into the creation of these reconstructions and the remains of the archaeological sites 5
Interreg DanubeTransnational Programme, July 2022
2 Balen, J. et al. 2021, 7; See also:Archaeology Museum Schloss Eggenberg, Universalmuseum Joanneum, 2022
4
3
Interreg DanubeTransnational Programme, 2020
Interreg DanubeTransnational Programme, July 2022
Archaeology Museum Schloss Eggenberg, Universalmuseum Joanneum, 2022
4
Cultural Heritage ranging from the Palaeolithic (e.g. Vértesszőlős in Hungary), Neolithic (e.g. Vršac-At in Serbia), BronzeAge (e g Cârna in Romania), IronAge (e g Kaptol in Croatia or Ulaka in Slovenia, or Rankovce in Slovakia), Roman Period (Flavia Solva inAustria), to the Medieval Period (e.g Cherven in Bulgaria) were presented, a joint exhibition catalogue was produced and some countries held additional workshops
Figure 1: Workshop in Kaptol, Croatia. Photo byAMZ/Interreg DAeL2022
Using new technologies like State-of-the-art Virtual Reality (VR) andAugmented Reality (AR) applications was used us to visualise archaeological knowledge in completely new ways. Visitors were encouraged to experience virtually reconstructed archaeological heritage in its original landscapes not only in their own country, but also in countries of other partners.6

1 2 2 Exhibition venues, durations and setups
Exhibitions were created inAustria, Bulgaria7 , Croatia, Czech Republic8 , Hungary, Romania, Serbia, Slovakia, and Slovenia Serbia, Slovakia and Slovenia presented a mobile exhibition, using some of the same mobile panels and digital tools, while adjusting the setups and contents.
Even though each country made its own archaeological contribution to the exhibition, the contributions of other partners could also be shown This is an advantage of the digital exhibition concept.The contents of the multimedia exhibition consisted of printed media, i.e. boards and banners and digital tools in varying setups Languages of texts and media were adjusted accordingly
Digital tools consisted of:
● VR glasses & cardboard VR
● touch screens &AR tablets ● monitors & projections ● mobile phone/app
● PC app
6 Interreg DanubeTransnational Programme, 2020
7 Limited data:According to the survey data at the time of evaluation, only 25 respondents visited in Bulgaria.
8 No data available:At the time of evaluation, the Czech exhibition did not open yet.
5


 Figure 2-3 (left column): Setup Croatia & Slovakia Photos byAMZ & ESMK/Interreg DAeL2022
6
Figure 4-6 (right column): SetupAustria, Romania & Mobile exhibition Slovenia Photos by UMJ, NMHR & NMS/Interreg DAeL2022
The
April 7th-Nov 30th
Austria UMJ
9 VR, 1 touchscreen, 1 projection, 1 monitor/PC (apps), 2 mobile tablets
8 VR glasses with: Flavia Solva (AT), Burgstallkogel, Großklein (AT), Vršac-At, Vatin - Bela Bara (SRB)
1 VR glass (PC) with: Vértesszőlős (HU), villa Baláca (HU), Ulaka (SLO), Cherven (BG), rock-hewn churches of Ivanovo (BG), Kaptol (HR)
x Vindija (HR), Viskovci (HR)
Ulaka (SLO)360° video YouTube; Cârna and Nufăru (RO)QR codes sketchfab
Großklein (AT), Flavia Solva (AT)
short videos of: Großklein (AT), Flavia Solva (AT), Ulaka (SLO), Kaptol (HR), Vatin/Bela Bara (SRB),At (SRB), Cherven (BG), Ivanovo (BG)
2 touchscreens with 3d objects and map
May 6th-Nov 30th mobile exh integrated in permanent exh
April 12th-May 28th (GalleryAMZ)
in June (at Kaptol)
Closing event (GalleryAMZ)
in December (at University in Zagreb)
Bulgaria RRMH
1 VR+1 monitor, 2 touchscreen (own app, 1 joint app)
2 sites: Medieval town of Cherven, rock-hewn churches of Ivanovo
x x x
Medieval town of Cherven, rock-hewn churches of Ivanovo
monitor (BG only), videos on screen
Medieval town of Cherven, rock-hewn churches of Ivanovo
Croatia AMZ +other venues
3 VR, 3 monitors, 4 touchscreens, 2 projection, 1 totem monitor/ PC (for visitor survey), 2 mobile tablets
VR glasses: Flavia Solva (AT), Burgstallkogel, Großklein (AT), Kaptol (HR), Ulaka (SLO) x x
Cârna and Nufăru (RO)QR codes sketchfab
Vindija (HR), Viskovci (HR) Großklein (AT), Flavia Solva (AT) (under installation)
short videos of: Ulaka (SLO), Vatin/Bela Bara (SRB),At (SRB), Cherven (BG), Ivanovo (BG), Vértesszőlős (HU), villa Baláca (HU)
mobile exh no data during survey!
Dec 8th-28th
Czech Republic
2 VR + monitors for stream 3AR - tablets 2 touchscreen
1 site: Rankovce 1 site: Rankovce
x x
All sites from other participating countries
Großklein (AT), Flavia Solva (AT), Vatin/Bela Bara (SRB)
Vršac -AT(SRB)
Cârna and Nufăru (RO)
under installation (Vindija (HR), Viskovci (HR) Großklein (AT), Flavia Solva (AT)
short videos of: Ulaka (SLO), Vatin/Bela Bara (SRB),At (SRB), Cherven (BG), Ivanovo (BG), Vértesszőlős (HU), villa Baláca (HU)
following table shows a more detailed overview of digital tools & contents presented in 2022: Exhibition duration Country Venues Kind and number of digital tools Sites shown in VR Sites shown viaAR Sites shown inApp on PC Sites shown on mobile phone /tablet Sites shown on touchscreen Sites shown on monitor /projection /videosApril 25th 2022February 29th 2023 Hungary HNM +other venue 6 VR glasses, 2 computer, 2 monitor, 2 tablets (and 1 touchscreen and 1 projector under installation)
site in
villa
site
Paleolithic
Vértesszőlős (HU), Roman
in Baláca (HU), Flavia Solva (AT), Großklein (AT), Ulaka (SLO), Vršac-At (SRB), Vatin - Bela Bara, Cârna (RO) and Nufăru (RO) x Paleolithic
in Vértesszőlős (HU), Roman villa in Baláca (HU), Ulaka (SLO)
7
May 12th-Dec 31st Romania NMHR
2 VR, 1 touchscreen, 2 monitors, 1 projection, 2 mobile tablets, mobile app
2 sites: Cârna (Bronze Age) and Nufăru (medieval) x Cârna (Bronze Age), Nufăru (medieval)
Cârna (Bronze Age), Nufăru (medieval)
July 15th-Sept 11th mobile exh Serbia GMV
Sept 30th-Nov 30th mobile exh Slovakia
East Slovak Museum in Košice
2 VR, 1 touchscreen, 2 monitors, mobile app?
2 VR + monitors for stream 3AR - tablets 2 touchscreen
Cârna (Bronze Age), Nufăru (medieval)
2 sites: Vršac-At, Vatin - Bela Bara x x x x
1 site: Rankovce
1 site: Rankovce
All sites from other participating countries
x All sites from other participating countries
short videos of: Großklein (AT), Flavia Solva (AT), Ulaka (SLO), Kaptol (HR), Vatin/Bela Bara (SRB), Cherven (BG), Ivanovo (BG)
2 sites: Vršac-At, Vatin - Bela Bara short videos of: Großklein (AT), Flavia Solva (AT
Großklein (AT), Flavia Solva (AT), Vatin/Bela Bara (SRB)
Vršac -AT(SRB)
April 23rd(part of the permanent exhibition)
Slovenia
NMS + other venues (Park of Military history Pivka, Snežnik Castle)
4 VR glasses, computer, 4 tablets (2 x for visitors survey, 2 x for app), 2 monitors (1 x for VR projection and / or promo movies, 1 x promo and short movies), mobile app
3 VR glasses: Flavia Solva (AT), Großklein (AT), Vršac-At (SRB), Vatin - Bela Bara (SRB), Kaptol (HR), Ulaka (SLO);
1 VR glasses with PC: Vértesszőlős (HU), villa Baláca (HU), Ulaka (SLO), Cherven (BG), rock-hewn churches of Ivanovo (BG)
1.3 Data sources and methodology
x x
Cârna and Nufăru (RO)Sketchfab; Ulaka (SLO)360° video YouTube
x
short videos of: Vértesszőlős (HU), villa Baláca (HU), Großklein (AT), Flavia Solva (AT), Ulaka (SLO), Kaptol (HR), Vatin/Bela Bara (SRB),At (SRB), Cherven (BG), Ivanovo (BG)
Amajor goal of the project was also to evaluate the virtual form of the exhibitions. For this purpose, a survey was created to get feedback from the visitors The chosen method of this survey consisted of continuous monitoring over the course of the exhibition (9 months total) and was both of quantitative and qualitative nature. It was carried out through a summative written individual survey and distributed to visitors in all participating exhibition sites via an online form, available through QR codes, or on tablets provided by the exhibitors The visitors filled the questionnaire with 13 closed questions during or after their visit 9 The answers were to identify the demographic groups of the visitors, whether they visited the exhibition from abroad or in their home country (accessibility) and whether their profession was relatedto Cultural Heritage The visitors were also questioned about the provided digital tools and the sites visited (usage and availability)
To improve future applications the survey sought to determine the usefulness of and interest in digital tools for heritage presentation and the likelihood of audiences visiting sites in the landscape or recommending the digital tour/experience to others 10
Summative evaluation is generally used at the end of an exhibition to produce reports, suggest further research, identify problems and plan for future projects through an understanding of existing programs The reception of the intended messages, the
9 Deutscher Museumsbund e. V. 2019, 22-32; See also: Foster, H., 2008, 9
10
Deutscher Museumsbund e. V. 2019, 32
8
satisfaction with the program as well as the performance of the marketing strategy can be reviewed 11
Visitor‘s responses were evaluated via cross tabulation and condensed; extracts of the information have been interpreted to form the basis of the recommendations/lessons learned at the end of this report
2. Evaluation of the survey results
2.1 Summative overview
4667 visitors answered the survey in analogue or digital form by November 30th 2022: 2 1 1 Total number of visitors by age
Figure 7:Age groups. Visitor survey by Interreg DAeL2022

Younger to middle aged audiences represented a larger proportion of the survey respondents The reported age ranged from 7 to over 65 years The biggest age group were 7-12 year old (20,35%) and about 35% of visitors were children and teenagers aged 7-17 (20,35% 7-12 years old; 14,83% 13-17 years old) about 29% adults aged 18-34 (14,77% 18-24; 14,10% 25-34) and about 30% 35-64 years old (12,41% 35-44; 9,21% 45-54; 8,22%
11 Walhimer, M., 2012.
9
55-64 years old). Only about 6% of the survey respondents were over 65 years old (6,10%). This age distribution is probably due to the fact that the exhibitions were visited by school classes
2.1.2 Total number of visitors by gender
Figure 8: Gender identities Visitor survey by Interreg DAeL2022
Of all the respondents, 49,62% of visitors identified as female, 45,32% as male and 1,99% as gender-diverse. 3,07% didn‘t answer the question.
Within the group of children and teenagers aged 7-17, female visitors (47,45%) represented a slightly larger proportion than male (46,58%) visitors; visitors who identify as gender-diverse (2,03%) were represented in small numbers in the exhibition. 3,94% didn‘t answer the question
Within the group of adults aged 18-65+, female visitors (50,80%) represented a slightly larger proportion than male (44,64%) visitors; visitors who identify as gender-diverse (1,96%) were represented in small numbers in the exhibition 2,60% didn‘t answer the question

10
2.1.3 Total number of visitors by professional connection to Cultural Heritage

82,54% of visitors reported no connection of their profession to Cultural Heritage Only 17,91% of adult male and 26% of adult female visitors have a profession connected to Cultural Heritage. Out of adult gender-diverse visitors 35,85% have a profession connected to Cultural Heritage
Divided into age groups, the percentage of people who have a professional connection to Cultural Heritage varies between 16 and 32,70 percent.The lowest percentage (16 %) falls within the group of 65+, followed by 18-24 (17,59%), 35-44 (21,23%), 55-64 (21,32%), 25-34 (27,80%) and 45-54 (32,70%)
Figure 9: Professional connection to Cultural Heritage Visitor survey by Interreg DAeL2022
11
2.1.4 Total number of visitors by country
Figure 10: Exhibition visits by country Visitor survey by Interreg DAeL2022
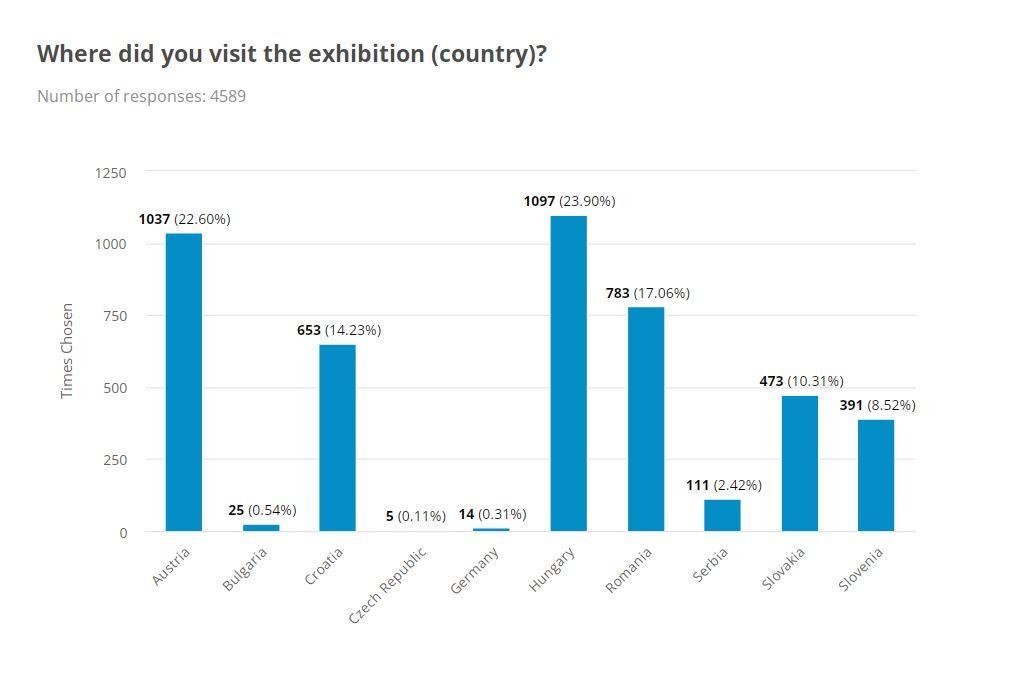
Figure 11: Exhibition visits in country and abroad Visitor survey by Interreg DAeL2022

12
The distribution of those visitors who answered the survey is highly uneven across the individual exhibitions: Most answers came from Hungary (23,90%), followed byAustria (22,60%), Romania (17,06%), Croatia (14,23%), Slovakia (10,31%), Slovenia (8,52%) Less than 5% of the respondents had visited the exhibitions in Serbia or Bulgaria. 80,54% of the responding visitors live in the country of the exhibition, 19,46% travelled there from abroad
2.1.5 Most visited sites in immersive VR
39,19% of visitors viewedAustrian sites in immersive VR, 23,58% looked at Hungarian sites, followed by Romanian (18,16%) Croatian (13,70%), Slovenian (8,73%), and Serbian sites (6,72%). Less than 5% visited other sites, while 12,48% did not give an answer or had different interests.
 Figure 12: Virtual site visits in immersive VR Visitor survey by Interreg DAeL2022
13
2.1.6 Most visited sites with app

Almost half of the visitors (43,22%) did not watch any of the sites with app, 17,69% had a look atAustrian sites, 17,49% viewed Hungarian sites, followed by Romanian (16,30%), Slovenian (6,37%), Slovakian (5,05%) or other (less than 5%) sites
Figure 13: Virtual site visits with app. Visitor survey by Interreg DAeL2022
14
2.1.7 Total number of visitors by usage of digital tools and problems
Figure 14: Usage of provided digital tools. Visitor survey by Interreg DAeL2022

Figure 15: Reported problems with provided digital tools Visitor survey by Interreg DAeL2022

15
Most visitors engaged with VR glasses (84,56%), followed by touch screen (29,25%), monitor (27,17%), and mobile phone (7,12%) Some indicated not enough time (8,99%) or experiencing technical errors (6,80%) Only a small percentage reported nausea (5,52%) Less than 5% reported other problems, while most had no problems using the provided digital tools (~77,42%)
VR
Visitors who experienced immersive VR glasses and had problems while using digital tools reported not enough time (9,51%) or experienced technical errors (6,09%) Only a small percentage reported nausea (5,83%) Less than 5% reported other problems, while most visitors had no problems (76,58%).
Touchscreens
Visitors who experienced touch screens and had problems while using digital tools reported technical errors (12,01%), not enough time (6,96%), unclear instructions (6,35%) or hygiene concerns (5,89%). Only a small percentage reported nausea (5,13%). Less than 5% reported other problems, while most visitors had no problems (77,58%)
Monitors
Visitors who experienced monitors and had problems while using digital tools reported technical errors (11,67%) or not enough time (7,40%). Only a small percentage reported hygiene concerns (5,67%), unclear instructions (5,51%) or nausea (5,09%). Less than 5% reported other problems, while most visitors had no problems (77,07%)
Mobile phones
Visitors who experienced mobile phones and had problems while using digital tools reported not enough time (11,41%), nausea (9,40%), technical errors (8,39%) or physical discomfort (7,72%) Only a small percentage reported COVID concerns (5,70%), unclear instructions (5,37%) and hygiene concerns (5,03%) Less than 5% reported other problems, while most visitors had no problems (78,19%).
16
2.1.8 Total number of visitors by impact of digital tools
Figure 16: Helpful digital tools Visitor survey by Interreg DAeL2022

Figure 17: Preferences regarding digital tools. Visitor survey by Interreg DAeL2022

17
Figure 18: Visiting sites in the landscape Visitor survey by Interreg DAeL2022

Figure 19: Recommendations Visitor survey by Interreg DAeL2022

18
This important question had a high number of positive responses: 92,59% of visitors found the digital tools helpful for learning about the exhibited Cultural Heritage sites and 91% preferred heritage presentations with digital tools 87,37% of visitors were encouraged to visit the visualised sites in the landscape and almost 95,10% would recommend the digital tour/experience to a family member or a friend
2.2 Evaluation by age groups
2.2.1Age 7-12 (n=948)
Gender
50,96% of children aged 7-12 identify as male, 43,36% as female, 1,82% as gender-diverse
Where did you visit? Where do you live?
22,51% visited the exhibition inAustria or Hungary, 17,10% visited in Romania,13,96% in Slovenia, 11,58% in Slovakia, 11,26% in Croatia or other (less than 5%) countries 91,75% live in the country of the exhibition, 8,25% travelled from abroad
Which sites in VR orApp?
VR
Most children experiencedAustrian (36,65%), Hungarian (23,30%), Romanian (18,10%), Croatian (11,99%) and Slovenian (10,52%) sites in immersive VR and 14,82% did not give an answer or had different interests. Less than 5% visited other sites.
App
Alot of children did not give an answer or had different interests (43,18%), Some experiencedAustrian (19,59%), Romanian (17,75%), Hungarian (12,49%) or Slovenian (6,30%) sites with app Less than 5% visited other sites
Which visualization tools? Which problems?
Children aged 7-12 experienced VR glasses the most (82,01%), followed by touch screen (23,29%), monitor (18,76%) and mobile phone (6,84%)
Some reported not enough time (17,30%), technical errors (7,59%), nausea (5,58%) Less than 5% reported other problems, while most had no problems using the provided digital tools (73,88%)
Were digital tools helpful? Preferences with/without digital tools? Encouraged to visit site? Would recommend to others?
89,07% of children found the digital tools helpful for learning about the Cultural Heritage sites and 88,70% preferred heritage presentations with digital tools. 80,14% were encouraged to visit the visualised sites in the landscape and 91,79% would recommend the digital tour/experience to a family member or a friend
19
2.2.2Age 13-17 (n=691)
Gender
40,67% of teenagers aged 13-17 identify as male, 52,97% as female, 2,32% as gender-diverse
Where did you visit? Where do you live? 26,24% of teenagers visited the exhibition inAustria, 20,26% in Hungary, 16,33% visited in Croatia,16,03% in Romania, 8,60% in Serbia, 6,71% in Slovenia, 5,39% in Slovakia or other (less than 5%) countries 91,37% live in the country of the exhibition, 8,63% travelled from abroad
Which sites in VR orApp?
VR
Most teenagers aged 13-17 experiencedAustrian (38,73%), Hungarian (20,42%), Romanian (17,85%), Croatian (15,13%), Serbian (9,53%) or Slovenian (5,60%) sites, 10,44% did not give an answer or had different interests. Less than 5% visited other sites.
App
Alot of teenagers aged 13-17 did not give an answer or had different interests (34,56%). Some experiencedAustrian (21,41%), Hungarian (17,89%), Romanian (16,67%), Serbian (8,72%) or Slovenian (5,35%) sites with app Less than 5% visited other sites
Which visualization tools? Which problems?
Teenage visitors experienced VR glasses the most (87,33%), followed by touch screen (27,42%), monitor (26,08%) and mobile phone (6,71%) Some reported not enough time (11,56%) Only a small percentage reported technical errors (5,56%), nausea (5,26%) or physical discomfort (5,11%). Less than 5% reported other problems, while most had no problems using the provided digital tools (76,58%) Were digital tools helpful? Preferences with/without digital tools? Encouraged to visit site? Would recommend?
93,57% of teenagers found the digital tools helpful for learning about the Cultural Heritage sites and 94,18% preferred heritage presentations with digital tools 86,35% were encouraged to visit the visualised sites in the landscape and 96% would recommend the digital tour/experience to a family member or a friend
2.2.3Age 18-24 (n=688)
Gender
44,53% of young adults aged 18-24 identify as male, 51,09% as female, 1,90% as gender-diverse
20
Where did you visit? Where do you live?
29,39% visited the exhibition in Romania, 24,08% visited in Hungary,14,33% in Croatia, 10,49% inAustria, 9,45% in Slovakia, 9,01% in Sloveniaor other (less than 5%) countries 66,77% live in the country of the exhibition, 33,23% travelled from abroad.
Which sites in VR orApp?
VR
Young adults aged 18-24 experienced Romanian (29,85%),Austrian (26,92%), Hungarian (24,15%), Croatian (12,77%), Serbian (7,23%), Slovenian (7,08%) sites in immersive VR and 14,31% did not give an answer or had different interests Less than 5% visited sites in other countries
App
Most young adults aged 18-24 experienced no sites at all (44,75%), Romanian (23,77%), Hungarian (19,14%),Austrian (10,80%), Slovenian (5,56%) or Serbian (5,25%) sites with app. Less than 5% visited sites in other countries.
Profession connected to CH? 92,11% of visitors reported no connection of their profession to Cultural Heritage.
Which visualization tools? Which problems?
Young adults aged 18-24 experienced VR glasses the most (82,23%), followed by touch screen (32,08%), monitor (31,48%) and mobile phone (10,39%).Afew reported nausea (6,08%) or technical errors (5,32%) Less than 5% reported other problems, while most had no problems while using the provided digital tools (83,59%)
Were digital tools helpful? Preferences with/without digital tools? Encouraged to visit site? Would recommend?
92,11% of young adults aged 18-24 found the digital tools helpful for learning about the Cultural Heritage sites and 94,73% preferred heritage presentations with digital tools About 89,89% were encouraged to visit the visualised sites in the landscape and 95,80% would recommend the digital tour/experience to a family member or a friend.
2.2.4Age 25-34 (n=657)
Gender
43,58% of adults aged 25-34 identify as male, 50,61% as female, 1,99% as gender-diverse.
Where did you visit? Where do you live?
26,58% of adults aged 25-34 visited the exhibition in Hungary, 25,35% visited in Romania,15,92% in Croatia, 15,77% inAustria, 9,74% in Slovenia or other (less than 5%) countries.
66,46% live in the country of the exhibition, 33,54% travelled from abroad
21
Which sites in VR orApp?
VR
Most adults aged 25-34 experiencedAustrian (35,09%), Romanian (26,63%), Hungarian (25,20%), Croatian (15,79%), Slovenian (10,37%) or Serbian (5,26%) sites in immersive VR and 6,38% did not give an answer or had different interests. Less than 5% visited sites in other countries
App
Most adults aged 25-34 experienced no sites at all (40,84%). Some visited Romanian (23,31%), Hungarian (16,72%),Austrian (11,58%), Slovenian (7,56%) or Croatian (6,43%) sites with app Less than 5% visited sites in other countries
Profession connected to CH?
72,20% of visitors reported no connection of their profession to Cultural Heritage
Which visualization tools? Which problems?
Adults aged 25-34 experienced VR glasses the most (90,25%), followed by touch screen (27,83%), monitor (25,47%) and mobile phone (7,86%)
Some reported nausea (6,35%), technical errors (6,19%) physical discomfort (6,03%) Less than 5% reported other problems, while most had no problems using the provided digital tools (78,89%).
Were digital tools helpful? Preferences with/without digital tools? Encouraged to visit site? Would recommend to others? 95,65% of adults aged 25-34 found the digital tools helpful for learning about the Cultural Heritage sites and 92,41% preferred heritage presentations with digital tools 89,30% were encouraged to visit the visualised sites in the landscape and 95,28% would recommend the digital tour/experience to a family member or a friend.
2.2.5Age 35-44 (n=578)
Gender
47,30% of adults aged 35-44 identify as male, 48,17% as female, 2,09% as gender-diverse
Where did you visit? Where do you live?
24,17% of adults aged 35-44 visited the exhibition in Slovakia, 18,74% visited in Hungary, 16,29% inAustria, 14,36% in Romania, 13,66% in Croatia, 8,41% in Sloveniaor other (less than 5%) countries 79,33% live in the country of the exhibition, 20,67% travelled from abroad.
22
Which sites in VR orApp?
VR
Alot of adults aged 35-44 experiencedAustrian (35,33%), Hungarian (19,57%), Romanian (16,67%), Croatian (13,77%), Slovenian (10,14%), Serbian (9,42%) or Slovakian (7,97%) sites in immersive VR and 22,83% did not give an answer or had different interests Less than 5% visited sites in other countries.
App
Alot of adults aged 35-44 experienced no sites at all (47,99%). Some experiencedAustrian (16,97%), Hungarian or Romanian (15,33%), Slovakian (10,58%), Slovenian (8,76%) or Croatian (6,02%) sites with app Less than 5% visited sites in other countries
Profession connected to CH?
78,77% of visitors reported no connection of their profession to Cultural Heritage
Which visualization tools? Which problems?
Adults aged 35-44 experienced VR glasses the most (75,51%), followed by touch screen (44,29%), monitor (41,07%) and mobile phone (6,79%). Some reported technical errors (10,79%), nausea (6,83%), unclear instructions (5,22%), or not enough time (5,04%) or Less than 5% reported other problems, while most had no problems using the provided digital tools (74,64%)
Were digital tools helpful? Preferences with/without digital tools? Encouraged to visit site? Would recommend to others? 93,60% of adults aged 35-44 found the digital tools helpful for learning about the Cultural Heritage sites and 92,31% preferred heritage presentations with digital tools. 90,64% were encouraged to visit the visualised sites in the landscape and 97,80% would recommend the digital tour/experience to a family member or a friend
2.2.6Age 45-54 (n=429)
Gender
41,22% of adults aged 45-54 identify as male, 54,57% as female, 1,41% as gender-diverse
Where did you visit? Where do you live?
33,41% visited the exhibition inAustria, 26,82% in Hungary, 16,47% in Croatia, 11,06% in Romania or other (less than 5%) countries 79,53% live in the country of the exhibition, 20,47% travelled from abroad
Which sites in VR orApp?
VR
Most adults aged 45-54 experiencedAustrian (53,51%), Hungarian (24,70%), Croatian (16,22%), Romanian (12,35%), Serbian (9,44%) or Slovenian (9,20%) sites in immersive VR
23
and 6,78% did not give an answer or had different interests. Less than 5% visited sites in other countries
App
Alot of adults aged 45-54 experienced no sites at all (44,42%) Some experiencedAustrian (23,06%), Hungarian (18,20%), Romanian (11,41%), Slovenian (6,55%) or Croatian (5,58%) sites with app Less than 5% visited sites in other countries
Profession connected to CH?
67,30% of visitors reported no connection of their profession to Cultural Heritage.
Which visualization tools? Which problems?
Visitors experienced VR glasses the most (90,24%), followed by touch screen (27,38%), monitor (23,57%) and mobile phone (6,67%) Afew reported not enough time (7,42%) Only a small percentage reported nausea (5,26%) Less than 5% reported other problems, while most had no problems using the provided digital tools (80,38% ).
Were digital tools helpful? Preferences with/without digital tools? Encouraged to visit site? Would recommend to others? 94,66% of adults aged 45-54 found the digital tools helpful for learning about the Cultural Heritage sites and 88,78% preferred heritage presentations with digital tools. 91,22% were encouraged to visit the visualised sites in the landscape and 96,58% would recommend the digital tour/experience to a family member or a friend
2.2.7Age 55-64 (n=383)
Gender
44,24% of adults aged 55-64 identify as male, 53,66% as female, 1,05% as gender-diverse
Where did you visit? Where do you live? 37,37% of adults aged 55-64 visited the exhibition inAustria, 28,42% in Hungary, 13,68% in Croatia, 11,58% in Slovakia or other (less than 5%) countries 81,05% live in the country of the exhibition, 18,95% travelled from abroad
Which sites in VR orApp?
VR
Most adults aged 55-64 experiencedAustrian (52,15%), Hungarian (27,15%), Croatian (12,10%), Slovenian (6,72%) or Romanian (5,11%) sites in immersive VR and 11,56% did not give an answer or had different interests.
App
Most adults aged 55-64 experienced no sites at all (47,03%) Some experiencedAustrian (20,81%), Hungarian (23,78%), Slovakian (6,22%) or Croatian (5,14%) sites with app. Less than 5% visited sites in other countries
24
Profession connected to CH?
78,68% of visitors reported no connection of their profession to Cultural Heritage
Which visualization tools? Which problems?
Adults aged 55-64 experienced VR glasses the most (84,70%), followed by touch screen (25,86%), monitor (27,70%) and mobile phone (5,01%) Some reported not enough time (6,40%), unclear instructions or technical errors (5,33%). Less than 5% reported other problems, while most had no problems using the provided digital tools (78,93%)
Were digital tools helpful? Preferences with/without digital tools? Encouraged to visit site? Would recommend to others?
92,43% of adults aged 55-64 found the digital tools helpful for learning about the Cultural Heritage sites and 88,35% preferred heritage presentations with digital tools 89,70% were encouraged to visit the visualised sites in the landscape and 95,66% would recommend the digital tour/experience to a family member or a friend
2.2.8Age 65+ (n=284)
Gender
47,69% of adults aged 65+ identify as male, 46,26% as female, 3,91% as gender-diverse.
Where did you visit? Where do you live? 35,48% visited the exhibition inAustria, 30,82% in Hungary,13,26% in Croatia, 10,75% in Slovakia and 6,09% in Slovenia or other (less than 5%) countries 86,59% live in the country of the exhibition, 13,41% travelled from abroad.
Which sites in VR orApp?
VR
Most adults aged 65+ experiencedAustrian (55,68%), Hungarian (28,57%), Croatian (11,36%), Slovenian (9,89%), Serbian (6,59%) or Slovakian (5,49%) sites in immersive VR and 8,42% did not give an answer or had different interests
App
Most adults aged 65+ experienced no sites at all (49,45%) Some experiencedAustrian (22,14%), Hungarian (25,09%) or Slovenian (5,54%) sites with app Less than 5% visited sites in other countries.
Profession connected to CH?
84% of visitors reported no connection of their profession to Cultural Heritage
Which visualization tools? Which problems?
Adults aged 65+ experienced VR glasses the most (87,91%), followed by touch screen
25
(26,74%), monitor (27,47%) and mobile phone (3,66%). Some reported not enough time (13,19%), technical errors (9,52%) or unclear instructions (5,86%) Less than 5% reported other problems, while most had no problems using the provided digital tools (71,79%).
Were digital tools helpful? Preferences with/without digital tools? Encouraged to visit site? Would recommend to others?
90,71% of adults aged 65+ found the digital tools helpful for learning about the Cultural Heritage sites and 82,90% preferred heritage presentations with digital tools 86,99% were encouraged to visit the visualised sites in the landscape and 92,91% would recommend the digital tour/experience to a family member or a friend
2.3 Evaluation by digital knowledge groups
Differentiation of visitors between those who are comfortable with technology and those who are not:
● Digital Native visitors, approx. 7-12, 13-17, 18-24, 25-34 years old
Those who grew up with computers, internet and social media, are used to receiving and processing information fast, prefer graphics before text and random (nonlinear) access (like hypertext), instant gratification, frequent rewards and games
● Mostly Digital Immigrants, approx 35-44, 45-54, 55-64 years old
Those who grew up with telephone, e-mail, SMS,TV, partly Internet and social media learn to adapt to their environment
● Mostly Traditional Media visitors, approx, 65+ years old
Those who grew up with traditional media: letters, phone, newspaper,TV etc can be categorised asTraditional media visitors12
2.3.1
Digital Natives
Gender
(age 7-34; n= 2984)
48,99% of digital native visitors identify as female, 45,45% as male, 1,99% as gender-diverse
Where did you visit? Where do you live?
Most live in the country of the exhibition (80,29%), 19,71% travelled from abroad 23,24% of Digital Natives visited the exhibition in Hungary, 21,51% visited in Romania, 19,12% inAustria, 14,18% in Croatia, 10,19% in Slovenia and 8,18% in Slovakia or other (less than 5%) countries
12 Aziz, M. N.A. et al. 2019; See also Prensky, M. 2001 and Kölliker, H., 2019
26
Which sites in VR orApp?
VR
Most Digital Natives experiencedAustrian (34,55%), Hungarian (23,25%), Romanian (22,64%), Croatian (13,75%), Slovenian (8,54%) or Serbian (6,09%) sites in immersive VR and 11,80% did not give an answer or had different interests Less than 5 % visited other sites
App
Most Digital Natives experienced Romanian (20,13%), Hungarian (16,23%),Austrian (16,20%) or Slovenian (6,19%) sites and 41,01% did not give an answer or had different interests. Less than 5 % visited other sites.
Profession connected to CH?
85,86% of visitors reported no connection of their profession to Cultural Heritage.
Which visualization tools? Which problems?
Digital Natives experienced VR glasses the most (85,12%), followed by touch screen (27,29%), monitor (24,89%) and mobile phone (7,86%). Some reported not enough time (9,93%), technical errors (6,28%) or nausea (5,79%) Less than 5% reported other problems, while most had no problems using the provided digital tools (77,86%).
Were digital tools helpful? Preferences with/without digital tools? Encouraged to visit site? Would recommend to others?
92,29% of Digital Natives found the digital tools helpful for learning about the Cultural Heritage sites and 92,21% preferred heritage presentations with digital tools 85,89% were encouraged to visit the visualised sites in the landscape and 94,48% would recommend the digital tour/experience to a family member or a friend
2.3.2 Mostly Digital Immigrants (age 35-64; n=1390)
Gender
51,66% of Digital Immigrant visitors identify as female, 44,58% as male, 1,59% as gender-diverse.
Where did you visit? Where do you live? Most live in the country of the exhibition (79,87%), 20,13% travelled from abroad. 27,40% of Digital Immigrant visitors visited the exhibition inAustria, 23,91% in Hungary, 14,75% in Slovakia, 14,53% in Croatia, 10,68% in Romania and 5,45 % in Slovenia or other (less than 5%) countries
Which sites in VR orApp?
VR
Most Digital Immigrant visitors experiencedAustrian (45,62%), Hungarian (23,26%), Croatian (14,06%) , Romanian (12,12%), Slovenian (8,90%), Serbian (8,08%) or Slovakian
27
(5,24%) sites in immersive VR and 14,73% did not give an answer or had different interests. Less than 5 % visited other sites
App
Most Digital Immigrant visitors experiencedAustrian (19,92%), Hungarian (18,57%), Romanian (11,05%), Slovakian (7,22%), Slovenian (6,92%) or Croatian (5,64%) sites and 46,62% did not give an answer or had different interests Less than 5 % visited other sites
Profession connected to CH?
75,22% of visitors reported no connection of their profession to Cultural Heritage
Which visualization tools? Which problems?
Digital Immigrant visitors experienced VR glasses the most (82,71%), followed by touch screen (33,92%), monitor (31,94%) and mobile phone (6,25%) Some reported technical errors (7,34%) or not enough time (6,15%). Only a small percentage reported nausea (5,56%) Less than 5% reported other problems, while most had no problems using the provided digital tools (77,61%)
Were digital tools helpful? Preferences with/without digital tools? Encouraged to visit site? Would recommend to others?
93,60% of Digital Immigrant visitors found the digital tools helpful for learning about the Cultural Heritage sites and 90,11% preferred heritage presentations with digital tools. 90,56% were encouraged to visit the visualised sites in the landscape and 96,83% would recommend the digital tour/experience to a family member or a friend
2 3 3 Mostly traditional media (Traditionalist) visitors (Age 65+; n=284)
Gender
47,69% of adults aged 65+ identify as male, 46,26% as female, 3,91% as diverse
Where did you visit? Where do you live?
86,59% live in the country of the exhibition, 13,41% travelled from abroad 35,48% visited the exhibition inAustria, 30,82% in Hungary,13,26% in Croatia, 10,75% in Slovakia and 6,09% in Slovenia or other (less than 5%) countries
Which sites in VR orApp?
VR
Most adults aged 65+ experiencedAustrian (55,68%), Hungarian (28,57%), Croatian (11,36%), Slovenian (9,89%) or Serbian (6,59%) or Slovakian (5,49%) sites in immersive VR and 8,42% did not give an answer or had different interests
App
Most adults aged 65+ experienced no sites at all (49,45%) Some experiencedAustrian (22,14%), Hungarian (25,09%) or Slovenian (5,54%) sites with app Less than 5% visited sites in other countries.
28
Profession connected to CH?
84% of visitors reported no connection of their profession to Cultural Heritage
Which visualization tools? Which problems?
Adults aged 65+ experienced VR glasses the most (87,91%), followed by touch screen (26,74%), monitor (27,47%) and mobile phone (3,66%) Some reported not enough time (13,19%), technical errors (9,52%) or unclear instructions (5,86%). Less than 5% reported other problems, while most had no problems using the provided digital tools (71,79%)
90,71% of adults aged 65+ found the digital tools helpful for learning about the Cultural Heritage sites and 82,90% preferred heritage presentations with digital tools 86,99% were encouraged to visit the visualised sites in the landscape and 92,91% would recommend the digital tour/experience to a family member or a friend
2.4
9
8
with: Flavia Solva (AT), Burgstallkogel, Großklein (AT), Vršac-At, Vatin - Bela Bara (SRB)
1 VR glass (PC) with: Vértesszőlős (HU), villa Baláca (HU), Ulaka (SLO), Cherven (BG), rock-hewn churches of Ivanovo (BG), Kaptol (HR)
Vindija (HR), Viskovci (HR)
Ulaka (SLO) - 360° videoYouTube; Cârna and Nufăru (RO) - QR codes sketchfab
Großklein (AT), Flavia Solva (AT)
short videos of: Großklein (AT), Flavia Solva (AT), Ulaka (SLO), Kaptol (HR), Vatin/Bela Bara (SRB), At (SRB), Cherven (BG), Ivanovo (BG)
Usage of digital tools and problems
Visitors inAustria experienced VR glasses the most (96,60%), followed by touch screen (10,39%), monitor (9,22%) and mobile phone (5,24%). Some indicated not enough time (16,55%), technical errors (6,56%) or physical discomfort (6,17%). Less than 5% reported other problems, while most had no problems using the provided digital tools (65,72%)
Were digital tools helpful? Preferences with/without digital tools? Encouraged to visit site? Would recommend to others?
Visitors inAustria at Universalmuseum
Kind and number of digital tools Sites shown in VR Sites shown inApp on PC Sites shown on mobile phone/tablet Sites shown on touchscreen Sites shown on monitor /projection/videos
Experiences and impact by country 2.4.1
Joanneum (n=1037)
VR, 1 touchscreen, 1 projection, 1 monitor/PC (apps), 2 mobile tablets
VR glasses
29
Sites visited virtually 97,64% of the responding visitors inAustria experienced Austrian sites in immersive VR, 7,28% looked at Serbian sites Less than 5% visited any of the other sites or none 49,51% of the responding visitors inAustria viewed Austrian sites with app, 47,04% did not give an answer or had different interests Less than 5% visited any of the other sites
Impact 80,18% of the responding visitors inAustria felt encouraged to visit the site in the landscape. 96,54% would recommend this digital tour/experience to a family member or a friend

2.4.2 Visitors in Bulgaria at Rousse Regional Museum of History (n=25)
Figure 20:Austrian exhibition with digital tools Photos by UMJ/Interreg DAeL2022
Kind and number of digital tools Sites shown in VR Sites shown on touchscreen Sites shown on monitor/projection/videos 1 VR+1 monitor, 2 touchscreen (own app, 1 joint app) 2 sites: Medieval town of Cherven, rock-hewn churches of Ivanovo 2 touchscreens with 3d objects and map Medieval town of Cherven, rock-hewn churches of Ivanovo vr link monitor (BG only), videos on screen Medieval town of Cherven, rock-hewn churches of Ivanovo 30
Usage of digital tools and problems
Visitors in Bulgaria experienced mobile phone the most (68,18%), followed by monitor (50%), touch screen (9,09%) and VR glasses (13,64%) Some reported nausea, physical discomfort, hygiene concerns, COVID concerns, unclear instructions or not enough time (15,79%) or technical errors (10,53%), while most had no problems using the provided digital tools (84,21%)
Sites visited virtually 46,67% of the responding visitors in Bulgaria experienced Bulgarian sites in immersive VR, looked at Romanian (13,33%), followed by Hungarian (6,67%) sites 40% did not give an answer or had different interests.
66,67% of the responding visitors in Bulgaria viewed Bulgarian sites, 8,33% looked at Slovenian sites with app, 33,33% did not give an answer or had different interests
Impact
66,67% of the responding visitors in Bulgaria felt encouraged to visit the site in the landscape 83,33% would recommend this digital tour/experience to a family member or a friend
 Figure 21: Bulgarian exhibition with digital tools Photos by RRMH/Interreg DAeL2022
31
2.4.3 Visitors in Croatia at Archaeological Museum in Zagreb, GalleryAMZ, at Kaptol and

of Zagreb (n=653)
Usage of digital tools and problems
Visitors in Croatia experienced VR glasses the most (84,85%), followed by touch screen (77,13%), monitor (61,21%) and mobile phone (8,04%). Some indicated not enough time (11,59%), technical errors (10,05%), physical discomfort (7,57%), unclear instructions (7,26%), nausea (6,80%), hygiene concerns (5,72%) or COVID concerns (5,10%), while most had no problems using the provided digital tools (74,03%)
University Kind and number of digital tools Sites shown in VR Sites shown on mobile phone/tablet Sites shown on touchscreen Sites shown on monitor/projection/videos 3 VR, 3 monitors, 4 touchscreens, 2 projection, 1 totem monitor/ PC (for visitor survey), 2 mobile tablets VR glasses: Flavia Solva (AT), Burgstallkogel, Großklein (AT), Kaptol (HR), Ulaka (SLO) Cârna and Nufăru (RO)QR codes sketchfab Vindija (HR), Viskovci (HR) Großklein (AT), Flavia Solva (AT) (under installation) short videos of: Ulaka (SLO), Vatin/Bela Bara (SRB),At (SRB), Cherven (BG), Ivanovo (BG), Vértesszőlős (HU), villa Baláca (HU)32
Figure 22: Croatian exhibition with digital tools Photos byAMZ/Interreg DAeL2022
Sites visited virtually 77,98% of the responding visitors in Croatia experienced Croatian sites in immersive VR, 65,74% looked at Austrian, followed by Slovenian (18,76%) sites 12,56% did not give an answer or had different interests. Less than 5% visited any of the other sites. 82,17% of the responding visitors in Croatia viewed no sites with app, 13,49% looked at Croatian, followed by Austrian (8,53%) sites Less than 5% visited any of the other sites
Impact
83,67% of the responding visitors in Croatia felt encouraged to visit the site in the landscape 88,79% would recommend this digital tour/experience to a family member or a friend
2.4.4 Visitors in Hungary at Hungarian National Museum & other venue (n=1097)
6 VR glasses, 2 computer, 2 monitor, 2 tablets (and 1 touchscreen and 1 projector under installation)
Paleolithic site in Vértesszőlős (HU), Roman villa in Baláca (HU), Flavia Solva (AT), Großklein (AT), Ulaka (SLO), Vršac-At (SRB), Vatin - Bela Bara, Cârna (RO) and Nufăru (RO)
Paleolithic site in Vértesszőlős (HU), Roman villa in Baláca (HU), Ulaka (SLO)
Usage of digital tools and problems
Cârna and Nufăru (RO)
under installation (Vindija (HR), Viskovci (HR) Großklein (AT), Flavia Solva (AT)
short videos of: Ulaka (SLO), Vatin/Bela Bara (SRB),At (SRB), Cherven (BG), Ivanovo (BG), Vértesszőlős (HU), villa Baláca (HU)
Visitors in Hungary experienced VR glasses the most (98,26%), followed by monitor (8,88%) Less than 5% usage of touch screens and mobile phones were reported Some indicated not enough time (9,62%). Less than 5% reported other problems, while most of the visitors had no problems using the provided digital tools (82,23%)
Sites
Kind and number of digital tools
shown in VR Sites shown inApp on PC Sites shown on mobile phone/tablet Sites shown on touchscreen Sites shown on monitor/projection/vid eos
33
Sites visited virtually 88,07% of the responding visitors in Hungary experienced Hungarian sites in immersive VR, 13,49% looked at Austrian sites Less than 5% visited any of the other sites 59,93% of the responding visitors in Hungary viewed Hungarian, followed byAustrian (7,54%) sites. Less than 5% visited any of the other sites, while 36,12% did not give an answer or had different interests
Impact 90,24% of the responding visitors in Hungary felt encouraged to visit the site in the landscape 95,02% would recommend this digital tour/experience to a family member or a friend 2.4.5 Visitors in Romania at National History Museum of Romania (n=783)
 Figure 23: Hungarian exhibition with digital tools. Photos by HNM/Interreg DAeL2022
Kind and number of digital tools Sites shown in VR Sites shown in App on PC Sites shown on mobile
Sites shown on touchscreen Sites
34
phone/tablet
shown on monitor/projection/videos 2 VR, 1 touchscreen, 2 monitors, 1 projection, 2 mobile tablets, mobile app 2 sites: Cârna (Bronze Age) and Nufăru (medieval) Cârna (BronzeAge), Nufăru (medieval) Cârna (BronzeAge), Nufăru (medieval Cârna (BronzeAge), Nufăru (medieval short videos of: Großklein (AT), Flavia Solva (AT), Ulaka (SLO), Kaptol (HR), Vatin/Bela Bara (SRB), Cherven (BG), Ivanovo (BG)
Usage of digital tools and problems
Visitors in Romania experienced VR glasses the most (93,59%), followed by touch screen (9,15%), monitor (6,93%) and mobile phone (10,85%) Afew reported nausea (6,31%) Less than 5% reported other problems, while most had no problems using the provided digital tools (88,30%)
Sites visited virtually 96,68% of the responding visitors in Romania experienced Romanian sites in immersive VR Less than 5% visited any of the other sites 86,19% of the responding visitors in Romania looked at Romanian sites with app, 12,47% did not give an answer or had different interests Less than 5% visited any of the other sites
Impact
93% of the responding visitors in Romania felt encouraged to visit the site in the landscape. 98,38% would recommend this digital tour/experience to a family member or a friend
 Figure 24: Romanian exhibition with digital tools Photos by NMHR/Interreg DAeL2022
35
2.4.6 Visitors in Serbia at City Museum Vršac (n=111)
Kind and number of digital tools Sites shown in VR Sites shown on monitor/projection/videos
2 VR, 1 touchscreen, 2 monitors, mobile app? 2 sites: Vršac-At, Vatin - Bela Bara 2 sites: Vršac-At, Vatin - Bela Bara short videos of: Großklein (AT), Flavia Solva (AT
Usage of digital tools and problems
Visitors in Serbia experienced VR glasses the most (92,59%), followed by touch screen (7,41%), monitor (13,89%) and mobile phone (2,78%). Some reported nausea (25%), physical discomfort (9,26%), hygiene concerns (6,48%) or technical errors (5,56%) Less than 5% reported other problems, while most of the visitors had no problems using the provided digital tools (69,44%)

Sites visited virtually 93,46% of the responding visitors in Serbia experienced Serbian sites in immersive VR, 6,54% looked at Austrian sites, 6,54% did not give an answer or had different interests. Less than 5% visited any of the other sites.
Figure 25: Serbian exhibition with digital tools Photos by GMV/Interreg DAeL2022
36
80,19% of the responding visitors in Serbia viewed Serbian sites with app, 16,98% did not give an answer or had different interests Less than 5% visited any of the other sites
Impact
87,50% of the responding visitors in Serbia felt encouraged to visit the site in the landscape 96,15% would recommend this digital tour/experience to a family member or a friend 2.4.7 Visitors in Slovakia at East Slovak Museum in Košice (n=473)

Usage of digital tools and problems
Visitors in Slovakia experienced touch screen the most (98,51%), followed by monitor (97,66%), VR glasses (34,61%) and mobile phone (0,64%) Some indicated technical errors (13,86%), hygiene concerns or unclear instructions (6,40%) Less than 5% reported other problems, while most had no problems using the provided digital tools (81,02%)
Kind and number of digital tools Sites shown in VR Sites shown viaAR Sites shown on touchscreen Sites shown on monitor/projection/videos 2 VR + monitors for stream 3AR - tablets 2 touchscreen 1 site: Rankovce 1 site: Rankovce All sites from other participating countries Großklein
(AT), Flavia Solva (AT), Vatin/Bela Bara (SRB) Vršac -AT(SRB)
37
Figure 26: Slovakian exhibition with digital tools Photos by ESMK/Interreg DAeL2022
Sites visited virtually 34,12% experienced Slovakian sites, 18,76% looked at Austrian sites, followed by Serbian (13,86%), Slovenian (8,96%), Bulgarian (8,53%), Hungarian or Romanian (8,32%) or Croatian (8,10%) sites in immersive VR, while 64,82% of the responding visitors in Slovakia did not give an answer or had different interests, 41,63% looked at Slovakian sites, followed by Hungarian (17,17%), Austrian (16,52%), Slovenian (12,45%), Croatian (11,59%), Romanian (9,44%), Serbian (9,01%), or Bulgarian ( 7,94%) sites with app, while 57,51% of the responding visitors in Slovakia did not give an answer or had different interests,
Impact 95,27% of the responding visitors in Slovakia felt encouraged to visit the site in the landscape. 98,06% would recommend this digital tour/experience to a family member or a friend 2.4.8
3 VR glasses: Flavia Solva (AT), Großklein (AT), Vršac-At (SRB), Vatin - Bela Bara (SRB), Kaptol (HR), Ulaka (SLO); 1 VR glasses with PC: Vértesszőlős (HU), villa Baláca (HU), Ulaka (SLO), Cherven (BG), rock-hewn churches of Ivanovo (BG)
Usage of digital tools and problems
Cârna and Nufăru (RO) - Sketchfab; Ulaka (SLO) - 360° videoYouTube
short videos of: Vértesszőlős (HU), villa Baláca (HU), Großklein (AT), Flavia Solva (AT), Ulaka (SLO), Kaptol (HR), Vatin/Bela Bara (SRB),At (SRB), Cherven (BG), Ivanovo (BG)
Visitors in Slovenia experienced VR glasses the most (58,50%), followed by touch screen (42,62%), monitor (25,35%) and mobile phone (24,23%) Some reported nausea (10,53%), technical errors (10,23%) or not enough time (7,60%). Less than 5% reported other problems, while most of the visitors had no problems using the provided digital tools (77,19%)
Kind and number of digital tools Sites shown in VR Sites shown on mobile phone/tablet Sites shown on
VR glasses, computer, 4 tablets (2 x for visitors
2 x for app), 2 monitors (1 x for VR
/ or promo
1 x promo and short
Visitors in Slovenia at National Museum of Slovenia, Park of Military history Pivka and Snežnik Castle (n=391)
monitor/projection/videos 4
survey,
projection and
movies,
movies), mobile app
38
Sites visited virtually 60,68% of the responding visitors in Slovenia experienced Slovenian sites in immersive VR, 19,20% looked at Austrian sites, followed by Serbian (8,67%), Croatian (8,36%) and Bulgarian (5,57%) sites. Less than 5% viewed any of the other sites, while 30,34% did not give an answer or had different interests 52,60% of the responding visitors in Slovenia viewed Slovenian sites with app, 14,61% looked at Austrian sites, followed by Croatian (6,82%) and Serbian (5,84%) sites Less than 5% viewed any of the other sites, while 36,69% did not give an answer or had different interests
Impact
84,30% of the responding visitors in Slovenia felt encouraged to visit the site in the landscape 92,10% would recommend this digital tour/experience to a family member or a friend
 Figure 27: Slovenian exhibition with digital tools Photos by NMS/Interreg DAeL2022
39
2.5 Usage of
Comparability is limited due to different setups: produced digital content and tools VR glasses video playlist on monitor or projection App / eLearning tool on mobile, VR Touch "game" on touch screen 3D-models (e g via sketchfab) on PC or via QR 360° video on VR, tablet or via QR AR tablet Country arch site AT Großklein Flavia Solva BG Cherven Ivanovo HR Kaptol Vindija Viskovci HU Villa Baláca Vértesszőlős RO Nufăru Cârna SRB Vatin Bela Bara VršacAt SLO Ulaka SK Rankovce) 2.5.1 Immersive Virtual Reality glasses 2.5.1.1Austrian sites in VR: Großklein & Flavia Solva (n=1686) Visitors who experiencedAustrian sites in VR and had problems with digital tools
reported not enough time (14,35%), technical errors (9,13%), physical discomfort (6,82%), nausea
and unclear instructions
Less
reported other problems,
had no problems 40
digital tools: Experiences and problems
mostly
(6,05%)
(5,81%)
than 5%
while 67,50%
2.5.1.2 Bulgarian sites in VR: Cherven & Ivanovo (n=119)
Visitors who experienced Bulgarian sites in VR and had problems with digital tools mostly reported technical errors (18,49%), physical discomfort or unclear instructions (13,45%), nausea (12,61%), hygiene concerns, COVID concerns or not enough time (7,56%) 64,71% had no problems
2.5.1.3 Croatian site in VR: Kaptol (n=572)
Visitors who experienced Croatian sites in VR and had problems with digital tools mostly reported technical errors (11,70%), not enough time (10,31%), unclear instructions (8,22%), physical discomfort (8,04%), nausea (6,29%), hygiene or COVID concerns (5,07%) 72,90% had no problems.
2.5.1.4 Hungarian sites in VR: Villa Baláca & Vértesszőlős (n=1026)
Visitors who experienced Hungarian sites in VR and had problems with digital tools mostly reported not enough time (9,65%) Less than 5% reported other problems, while 81,38% had no problems
2.5.1.5 Romanian sites in VR: Nufăru & Cârna (n=777)
Visitors who experienced Romanian sites in VR and had problems with digital tools mostly reported nausea (6,69%) Less than 5% reported other problems, while 86,36% had no problems
2.5.1.6 Serbian sites in VR: Vatin Bela Bara & VršacAt (n=280)
Visitors who experienced Serbian sites in VR and had problems with digital tools mostly reported nausea (18,57%), technical errors (12,14%), physical discomfort (9,64%), not enough time (6,43%), unclear instructions (5,71%) or hygiene concerns (5,36%) Less than 5% reported other problems, while 66,07% had no problems.
2.5.1.7 Slovakian site in VR: Rankovce (n=178)
Visitors who experienced Slovakian sites in VR and had problems with digital tools mostly reported technical errors (15,17%), unclear instructions (8,43%), nausea or hygiene concerns (7,87%) or physical discomfort (6,18%) Less than 5% reported other problems, while 72,47% had no problems.
41
2.5.1.8 Slovenian site in VR: Ulaka (n=336)
Visitors who experienced Slovenian sites in VR and had problems with digital tools mostly reported nausea (14,58%), technical errors (11,61%), physical discomfort (9,82%), not enough time (8,04%), unclear instructions (7,44%) Less than 5% reported other problems, while 67,56% had no problems
2.5.2 (App on) touch screen
2 5 2 1Austrian sites with app: Großklein & Flavia Solva via touch “game” (n=213)
Visitors who experiencedAustrian sites with app and touch screens and had problems with digital tools mostly reported technical errors (19,25%), unclear instructions (9,39%), hygiene concerns or not enough time (8,92%), physical discomfort (7,98%), nausea (6,57%). Less than 5% reported other problems, while 64,79% had no problems
2 5 2 2 Bulgarian sites with app: Cherven & Ivanovo via touchscreens (n=72)
Visitors who experienced Bulgarian sites with app and touch screens and had problems with digital tools mostly reported technical errors (22,22%), unclear instructions (19,44%), physical discomfort or not enough time (12,50%), nausea (11,11%) or hygiene or COVID concerns (9,72%) 68,06% had no problems
2.5.2.3 Croatian sites with app Vindija & Viskovci via eLearning tool (n=136)
Visitors who experienced Croatian sites with app and touch screens and had problems with digital tools mostly reported technical errors (15,44%), unclear instructions (13,97%), physical discomfort, hygiene concerns or not enough time (9,56%), nausea or COVID concerns (6,62%) 67,65% had no problems
2.5.2.4 Slovakian site: Rankovce viaAR tablet (n=205)
Visitors who experienced Slovakian sites with app and touch screens and had problems with digital tools mostly reported technical errors (16,59%), unclear instructions (10,73%) hygiene concerns (9,76%) Less than 5% reported other problems 76,10% had no problems
42
2.5.3 (App on) monitor
2 5 3 1Austrian sites with app and monitors: Großklein & Flavia Solva via short videos (n=194)
Visitors who experiencedAustrian sites with app and monitors and had problems with digital tools mostly reported technical errors (18,04%), not enough time (11,86%), hygiene concerns or unclear instructions (9,28%), physical discomfort (7,22%), nausea (6,70%) Less than 5% reported other problems while 62,89% had no problems
2.5.3.2 Bulgarian sites with app and monitors: Cherven & Ivanovo via VR link monitor, videos (n=71)
Visitors who experienced Bulgarian sites with app and monitors and had problems with digital tools mostly reported technical errors (18,31%), unclear instructions (16,90%), not enough time (14,08%), physical discomfort (12,68%), nausea (11,27%), hygiene or COVID concerns (9,86%). 71,83% had no problems.
2.5.3.3 Croatian sites with app and monitors: Vindija & Viskovci via PC and Kaptol via short videos (n=125)
Visitors who experienced Croatian sites with app and monitors and had problems with digital tools mostly reported technical errors (17,60%), unclear instructions (12,80%), physical discomfort or not enough time (9,60%), nausea (8,80%) hygiene or COVID concerns (8%) 67,20% had no problems
2.5.3.4 Hungarian sites with app and monitors: Vértesszőlős & Villa Baláca via PC and short videos (n=146)
Visitors who experienced Hungarian sites with app and monitors and had problems with digital tools mostly reported not enough time (16,44%), technical errors (15,75%), hygiene concerns (10,96%) ,unclear instructions (10,27%), physical discomfort (6,85%) or COVID concerns (6,16%). Less than 5% reported other problems while 62,33% had no problems.
2.5.3.5 Romanian sites with app and monitors: Nufăru & Cârna via PC (n=96)
Visitors who experienced Romanian sites with app and monitors and had problems with digital tools mostly reported technical errors (14,58%), unclear instructions (11,46%), nausea or not enough time (10,42%), hygiene concerns (7,29%), physical discomfort (6,25%) or COVID concerns (5,21%). 69,79% had no problems.
43
2.5.3.6 Serbian sites with app and monitors: Vatin Bela Bara & VršacAt via short videos (n=74)
Visitors who experienced Serbian sites with app and monitors and had problems with digital tools mostly reported technical errors (22,97%), unclear instructions (20,27%), nausea or hygiene concerns (14,86%), physical discomfort or not enough time (10,81%) or COVID concerns (9,46%). 66,22% had no problems.
2.5.3.7 Slovenian site with app and monitors: Ulaka via PC and short videos (n=114)
Visitors who experienced Slovenian sites with app and monitors and had problems with digital tools mostly reported technical errors (14,04%), unclear instructions (11,40%), not enough time (10,53%), physical discomfort (9,65%), nausea (7,89%), hygiene or COVID concerns (6,14%) 72,81% had no problems
2.5.4 (App on) mobile phone
2.5.4.1 Romanian sites: Nufăru & Cârna via QR codes: 3D models on Sketchfab (n=63)
Visitors who experienced Romanian sites with an app and used a mobile phone and had problems with digital tools mostly reported not enough time (11,11%) and nausea (7,94%) Less than 5% reported other problems, while 79,37% had no problems
2.5.4.2 Slovenian sites: Ulaka via mobile phone: 360° video onYouTube (n=60)
Visitors who experienced Slovenian sites with an app and used a mobile phone and had problems with digital tools mostly reported technical errors or not enough time (11,67%), nausea (10%), COVID concerns (8,33%), physical discomfort, hygiene concerns or unclear instructions (6,67%) 81,67% had no problems
2.5.5
Usage by age
VR (n= 3813)
Of the visitors who experienced VR glasses, 19,49% were 7-12 years old, 15,37% were aged 13-17, 15,05% were aged 25-34 14,32% were aged 18-24, 11,12% were aged 35-44, 9,94% were aged 45-54, 8,42% were aged 55-64 and 6,29% were 65+ years old. Some reported not enough time (9,51%), technical errors (6,09%) and nausea (5,83%) Less than 5% reported other problems, while most had no problems using the provided digital tools (76,58%)
44
Touch screens (n= 1319)
Of the visitors who experienced touch screens, 18,80% were aged 35-44, 16,15% were aged 18-24, 16% were aged 7-12, 13,95% were aged 13-17, 13,42% were aged 25-34, 8,72% were aged 45-54, 7,43% were aged 55-64 and 5,53% were 65+ years old Some reported technical errors (12,01%), not enough time (6,96%), unclear instructions (6,35%), hygiene concerns (5,89%) or nausea (5,13%) Less than 5% reported other problems, while most had no problems using the provided digital tools (77,58%).
Monitors (n= 1225)
Of the visitors who experienced monitors, 18,78% were aged 35-44, 17,06% were aged 18-24, 14,29% were aged 13-17, 13,88% were aged 7-12, 13,22% were aged 25-34, 8,57% were aged 55-64, 8,08% were aged 45-54, and 6,12% were 65+ years old
Some reported technical errors (11,67%), not enough time (7,40%), hygiene concerns (5,67%), unclear instructions (5,51%) or nausea (5,09%). Less than 5% reported other problems, while most had no problems using the provided digital tools (77,07%)
Mobile phones (n= 321)
Of the visitors who experienced mobile phones, 21,50% were aged 18-24, 19,31% were aged 7-12, 15,58% were aged 25-34, 14,02% were aged 13-17 11,84% were aged 35-44, 8,72% were aged 45-54, 5,92% were aged 55-64 and less than 5% were 65+ years old.
Some reported not enough time (11,41%), nausea (9,40%), technical errors (8,39%), physical discomfort (7,72%), COVID concerns (5,70%), unclear instructions (5,37%) or hygiene concerns (5,03%), while most had no problems using the provided digital tools (78,19%).
2.5.6 Usage by gender
Males (45,32% of visitors; n=2098)
Males experienced VR glasses the most (82,58%), followed by touch screen (27,15%), monitor (26,96%) and mobile phone (6,41%)
Some reported not enough time (8,74%) or technical errors (7,35%) Less than 5% reported other problems, while most had no problems using the provided digital tools (78,97%)
Females (49,62% of visitors; n= 2297)
Females experienced VR glasses the most (86,55%), followed by touch screen (29,31%), monitor (26,01%) and mobile phone (7,53%).
Some reported not enough time (8,30%), nausea (6,37%) or technical errors (5,52%) Less than 5% reported other problems, while most had no problems using the provided digital tools (77,02%).
45
Gender-diverse visitors (1,99% of visitors; n=92)
Gender-diverse visitors experienced VR glasses the most (79,76%), followed by touch screen (47,62%), monitor (33,33%) and mobile phone (13,10%)
Some reported not enough time (23,81%), nausea, physical discomfort, hygiene concerns or technical errors (16,67%), COVID concerns or unclear instructions (11,90%), while most had no problems using the provided digital tools (60,71%).
2.5.7 Usage by professional connection to Cultural Heritage
86,62% of the Cultural Heritage professionals experienced VR glasses, 38,09% touch screen, 34,01% monitor and 12,61% mobile phone
Some reported nausea (8,90%), physical discomfort (8,39%), technical errors or not enough time (8,26%). Less than 5% reported other problems, while most had no problems using the provided digital tools (75,10%)
2.6 Impact of the exhibition:
Learning about Cultural Heritage site, preference with/without digital tools, visiting in the landscape and recommendations
2.6.1 Impact by age
Of the visitors who found the digital tools helpful (n= 4602), 19,05% were 7-12 years old, 15,04% were aged 13-17, 14,65% were aged 18-24. 14,62% were aged 25-34, 12,60% were aged 35-44, 9,60% were aged 45-54, 8,42% were aged 55-64 and 6,01% were 65+ years old
Of the visitors who prefer heritage presentations with digital tools (n= 3984), 19,30% were 7-12 years old, 15,44% were aged 13-17, 15,34% were aged 18-24 14,36% were aged 25-34, 12,65% were aged 35-44, 9,14% were aged 45-54, 8,18% were aged 55-64 and 5,60% were 65+ years old.
Of the visitors who were encouraged to visit the sites in the landscape (n= 3819), 18,17% were 7-12 years old, 15,13% were aged 18-24, 14,74% were aged 13-17, 14,43% were aged 25-34, 12,94% were aged 35-44, 9,79% were aged 45-54, 8,67% were aged 55-64 and 6,13% were 65+ years old
Of the visitors who recommend this digital tour/experience to a family member or a friend (n= 4150), 19,13% were 7-12 years old, 15,04% were aged 13-17, 14,84% were aged 18-24 14,12% were aged 25-34, 12,84% were aged 35-44, 9,52% were aged 45-54, 8,51% were aged 55-64 and 6% were 65+ years old
46
2.6.2 Impact by gender
Males
92,99% of male visitors found the digital tools helpful for learning about the Cultural Heritage sites and 91,66% preferred heritage presentations with digital tools 86,80% were encouraged to visit the visualised sites in the landscape and 95,64% would recommend the digital tour/experience to a family member or a friend
Females
93,38% of female visitors found the digital tools helpful for learning about the Cultural Heritage sites and 91,76% preferred heritage presentations with digital tools. 89,41% were encouraged to visit the visualised sites in the landscape and 96,10% would recommend the digital tour/experience to a family member or a friend
Gender-diverse visitors
72,29% of gender-diverse visitors found the digital tools helpful for learning about the Cultural Heritage sites and 72,29% preferred heritage presentations with digital tools 66,27% were encouraged to visit the visualised sites in the landscape and 68,29% would recommend the digital tour/experience to a family member or a friend.
2.6.3 Impact by professional connection to Cultural Heritage
91,28% of the Cultural Heritage professionals reported the digital tools as helpful to learn about the Cultural Heritage site, 87,67% prefer heritage presentations with digital tools and 87,90% felt encouraged to visit the site in the landscape 93,60% would recommend this digital tour/experience to a family member or a friend.
2.7 Unhappy visitors and problems with digital tools
Visitors who would not recommend this digital experience (n=214)
2
7 1 Unhappy visitors by age
33,18% of visitors who would not recommend this digital experience were aged 7-12, 13,55% were 25-34 years old, 12,62% were 18-24 years old,12,15% were 13-17 years old, 8,88% were 65+ years old, 7,48% were 55-64 years old, 6,54 % were 45-54 years old and 5,61% were 35-44 years old
2.7.2
Unhappy visitors by gender
Of those visitors who would not recommend this digital experience, 40,19% identified as male, 39,72% identified as female and 12,15% identified as gender-diverse
47
2.7.3 Professional connection to Cultural Heritage (n=48)
22,43% of unhappy visitors have a profession connected to Cultural Heritage 66,67% of the Cultural Heritage professionals who would not recommend this digital experience reported the digital tools as not helpful to learn about the Cultural Heritage site, 75% prefer heritage presentations without digital tools. 66,67% of those visitors were not encouraged to visit these sites in the landscape
2.7.4 Usage and problems
The visitors who would not recommend this digital experience experienced VR glasses the most (82,24%), followed by touch screen (34,58%), monitor (32,24%) and mobile phone (14,49%)
Some reported not enough time (28,97%), nausea (20,09%), physical discomfort (18,22%), technical errors (17,29%), hygiene concerns (15,42%) unclear instructions (14,95%), or COVID concerns (11,68%), while almost half had no problems while using the provided digital tools (47,20%)
2.7.5 Impact
56,07% of visitors who would not recommend this digital experience reported the digital tools as not helpful to learn about the Cultural Heritage site. 61,68% prefer heritage presentations without digital tools 71,03% of those visitors were not encouraged to visit these sites in the landscape
3. Key findings
3.1 Key findings regarding demographic groups
● The exhibition received a diverse audience profile and saw a mix of mostly local but also interregional visitors.The majority was living in the country of the exhibition, slightly more than half of the visitors were female and most visitors didn’t have a professional connection to cultural heritage
● Younger to middle aged audiences represented a larger proportion of the survey respondents.This age distribution is probably due to the fact that the exhibitions were visited by school classes or students The largest visitor group aged 7-34 can be summarized as Digital Natives
● In the Digital Immigrant group, slightly more than half of visitors identify as female, in the traditional media group, more people identify as gender-diverse (or misunderstood the question)
● Next to children and teenagers aged 7-17, adult visitors aged 65+ were less mobile, most live in the country of the exhibition More than a third of visitors 55-64 or 65+ visited inAustria
48
3.2
● Aprofessional connection to cultural heritage was much more prevalent in Digital Immigrant visitors, than in the other groups
● Slightly less than half of adult visitors identified as female.
● Only within the group of children aged 7-12 more people identified as male than female or gender-diverse
● Gender-diverse identifying visitors were most represented in age groups 65+ and 13-17.
● Children and teenagers were living in the country of the exhibition more often than adults, regardless of Gender
● Gender-diverse and female visitors reported a professional connection to cultural heritage much more often than male visitors
● Visitors aged 25-64, especially age group 45-54 reported a professional connection to cultural heritage more often than other age groups.
● Of visitors who would not recommend this digital experience, children aged 7-12 were the biggest age group (about one third)
● About a third of the adult Cultural Heritage professionals who would not recommend this digital tour/experience to a family member or a friend travelled from abroad Most were between 25-34 or 55-65+ years old
Key findings regarding exhibition visits in different countries/setups
● Most visitors live in the country of the exhibition and visited it in Hungary,Austria, Romania or Croatia.
● In immersive VR, more than a third of visitors experiencedAustrian sites, almost a quarter looked at Hungarian sites, many visited Romanian or Croatian and some viewed Slovenian or Serbian sites
● With app,Austrian, Hungarian and Romanian sites were by far the most visited sites.
● In all countries, most visitors were Digital Natives (7-34 years old)
● In Serbia, almost half of the visitors were 13-17 years old, in Slovakia more than a quarter of visitors were 35-44 years old, in Slovenia more than a third were 7-12 years old Most visitors over 45 visited inAustria
● Most children and teenagers aged 7-17 visited the exhibition inAustria, Hungary, Romania, Romania or Croatia.
● 18-44 years old were the most mobile visitors and travelled from abroad more than other age groups
● Almost a quarter of visitors travelling from abroad experienced the Romanian, and almost a third experienced the Hungarian exhibition.
● In immersive VR, more than half of traditional media visitors (65+) experienced Austrian sites the most, Digital Natives (7-34) viewed mostlyAustrian, Hungarian,
49
Romanian and Croatian sites and Digital Immigrants (35-64) visitedAustrian sites far more than any other sites
● With app, Romanian, Hungarian andAustrian sites were the most frequented by Digital Natives and Digital Immigrants looked mostly atAustrian and Hungarian sites. Almost a quarter of traditionalist visitors visited Hungarian orAustrian sites with app
3.3 Key findings regarding usage of digital tools and problems
● All visitors regardless of age used VR glasses and touch screens the most, far more than monitors and mobile phones.This distribution is probably due to the fact that all exhibitions provided between 1 and 9 VR glasses and at least 1 touchscreen
● VR glasses and mobile phones were used more among younger Digital Natives, especially children and teenagers
● 35-44 year old and younger Digital Natives used touch screens more than other age groups, visitors aged 45 or older
● Monitors were used the most by 35-44 year old and by younger Digital Natives and the least by 65+ year old
● Mobile phones were used the most by younger Digital Natives and much less by visitors aged 45 or older
Of those visitors who reported problems, most did not have enough time with the digital tools, reported technical errors or nausea
● 65+ year old reported the least problems with digital tools, 7-12 year old reported the most.
● Not having enough time was most reported from visitors aged 7-12 and 13-17
● Technical errors were most reported by 7-12 and 35-44 year old Nausea while using the provided digital tools was reported most by 7-12, 18-34 and 35-44 year old
● Physical discomfort was reported the most by 7-12, 25-34 and 13-17 year old.
● Unclear instructions were reported the most by 7-12 year old and 35-44 year old
● Of problems reported with the digital tools, both Digital Natives andTraditionalists reported not enough time the most. Digital Immigrants reported more technical errors
● Digital Natives and Digital Immigrants reported COVID concerns the least, Traditionalists reported nausea while using the provided digital tools the least
Visitors who would not recommend the digital experience used VR glasses less and touch screens, monitors more and mobile phones much more compared to all visitors They also reported more problems in comparison
50
3.4 Key findings regarding impact, learning and preferences
The digital tools were altogether received as helpful, a heritage presentation with digital tools was preferred Most audiences were encouraged to visit the sites in the landscape and even more would recommend this digital tour/experience to a family member or a friend.
● Digital Natives, especially children, teenagers and young adults reported the most positive feedback regarding impact of digital tools (they were also the biggest responding groups):They found them most helpful, preferred heritage presentations with digital tools, were more encouraged to visit the sites in the landscape and would recommend this digital tour/experience the most to family or friends
● Although all groups seemed to be positively influenced by their experience in the exhibition, Digital Immigrant visitors were the most encouraged to visit the sites in the landscape and to recommend the digital tour/experience to a family member or a friend.
● About two thirds of visitors who would not recommend the digital experience found the digital tools not helpful, preferred heritage presentations without digital tools and most were not encouraged to visit these sites in the landscape
4. Comparison to guidelines for digital exhibition strategies
4.1 Museum media, digital storytelling and cultural heritage
Museum visits are often educational in nature, but also part of an excursion with friends or family or a (touristic) sightseeing tour
Conveying information to families is a particular challenge, since younger audiences are especially fascinated by new media and would like to try them out With the right preparation of information, the different motivations, information needs, attention spans and reception habits of heterogeneous visitor groups can be well served 13
Multimedia applications, especially new immersive and evocative technologies help to mediate contexts, narratives and perspectives in a vivid and aesthetic way, and encourage visitors to interact and temporarily step into another world, beyond old-fashioned exhibition collections that were dominated by passive knowledge consumption 14
Digital storytelling is an innovative approach for educational work in museums and opens up new possibilities for making the core tasks of collecting and conveying knowledge more participatory and digital The transmission of knowledge in the form of stories, as a central, 14 Linzbauer,A. 2019, 132 13 Flügel, C. et al, 2019, 83
51
ancient cultural technique is given a new dimension through the media techniques available today 15
Cultural heritage can be mediated in several illustrative ways: A3D representation or 360-degree view allows objects to be shown in their entirety, the historical context, provenance, object biography, function or production can be explained via an accompanying text or through the integration of animations 16
Successful digital application in museums needs target group orientation, necessity, accessibility, comprehensibility, added value and reconnection To achieve a high degree of user-friendliness, information should also be presented in a comprehensible and appealing way, if necessary, also across different media.17
Comprehensible and target group-oriented storytelling of historical data often requires openness for interpretation.
(Digital) archaeological visualisations show only a temporary interpretation, as historical data is dynamic in its nature Archaeologists have become increasingly open about the ambiguity of the source data and possible multiple interpretations. Several charters and guidelines are now standardising the practices on the inclusion of scientific processes into the resulting computer-aided visualisation, for example the London Charter (London Charter Initiative, 2009) and Seville Principles (International Forum of VirtualArchaeology & International Council of Museums and Sites (ICOMOS), 2017).18
Due to its interdisciplinary approach, computer-aided visualisation of cultural heritage has great potential in the presentation of knowledge.
Immersive virtual applications based on extensive data usually produce the most intense learning and emotional experiences, but with the proper planning and approach, sites with fewer source data can also be effectively presented and reach their full potential in revealing their hidden stories and knowledge.19
4.2 Current and future use of digital tools in museums
According to the Museum Innovation Barometer 2021, 23% of replying museums designed new formats and tools for digital revenue and expanded online offers during the worldwide pandemic, although most of them were closed The pandemic accelerated the production, use, consideration and implementation of new digital contents and solutions. Many museum websites and apps were updated during times of closure and with reopening touch-free tools were implemented 20
15 Newrly, P. and Kramer, H. (eds.) 2014. 33
16 Flügel, C. et al, 2019, 83
17 Flügel, C. et al, 2019, 115-116
19 Jancsary, N. 2022, 133 18 Jancsary, N. 2022, 71
20 Tykhonova, O. and Widmann, S.(eds.), 2021, 11-12
52
In 85% of responding museums, audio and video elements are used on a regular basis, 68% use projections and visual displays of information Smart objects (47%), online exhibitions (42%), interactive surfaces and responsive environments (36%) or sound spatialisation (36%) are less commonly used. Almost half of responding institutions use web and/or mobile applications, about a third uses live streaming or podcasts and almost a quarter uses gamification elements, games or portable multimedia guides
In future exhibitions, audio and video elements will still be used predominantly (78%), online exhibitions (67%) and visual information displays (59%) or projections (52%) will still be relevant The usage of technologies likeAR, VR, sounds spatialisation, and 3D elements will also be expanded. Smart objects or interactive surface and responsive environments, games and gamification elements are planned by less than half of respondents 21
4.3 Key points for good practice22
Visitors:
● Who are the current visitors and user groups of the museum?Analysis and overview: which target group should be addressed with which medium?
● Which groups are engaged online and offline with the thematic focus of the institution? Where and how are they engaging?
● Inclusion of audiences: Multilingual options, possible choices between audible and written text, possible tactile content for the sensory impaired
Structural conditions and sustainability:
● Feasibility should be clarified in advance of the planning stage
● Necessary digital infrastructure for the successful operation of an application (wifi etc for online use or downloads of mobile apps)
● Development and purchase of digital products, but also follow-up costs i.e. items for operation (software updates) of media assistance are required
● Long-term usability and upkeep of media stations:Do not leave visitors feeling unsatisfied with broken or unusable elements
● Suitable locations for media stations: They attract attention and should never compete directly with the exhibits or block the passageways
● Augmented media: Ensure it works as an enhancement to the original (archaeological) object
● Price:The most important content should be provided free of charge
21 Tykhonova, O. and Widmann, S.(eds.), 2021, 15-19
22 Flügel, C. et al, 2019. 102-103; 118 and Linzbauer,A. 2019, 118-120 and Beck, C. et al. 2013, 6-7; See also: Morris Hargreaves McIntyre, 2019
53
Media / form of presentation:
● Which form of presentation is suitable for what? Find appropriate medium for each content, combining text, audio, image and video
● Does application correspond to the current reception habits of the
● target group(s)? Is the technology up to date?
● Media serve to expand the mediation concept and represent added value. It should not be used as an end in itself
● Loan devices or BYOD? Both in the best case, to include all visitor groups
● Engage visitors and make applications multi-sensory and intuitively comprehensible.
● Reduce the time of use or running time, provide additional monitors
● Mobile applications: Use as personal guide through the exhibition? Provide possible cross-references between exhibits and ares and basic information
Content:
● Select appropriate content and language for medium and target audience
● Consider levels of depth: whether and how much additional information does the exhibit or topic really need?
● Convey content in a narrative form (e g audio or video formats)
● Incorporate subjective perspectives and emotional elements, realise narrative in a sensual and cross-media way
● Use gamification: Entertaining or playful content contributes to the experience and immersion in the past
● Design content according to CI/CD guidelines to fit it into the design of the exhibition
5. Recommendations/Lessons learned
The major goal of Danube´sArchaeological eLandscapes project has been to make archaeological landscapes of the Danube region, regionally, nationally and internationally more visible 23
In the case study exhibition “Stories of the Past: Virtual Journey into Lost Landscapes” Digital storytelling, immersive and interactive media were used to convey the narrative of our common European cultural heritage in an engaging and emotive way FromApril to December 2022, varying setups and digital contents in the international exhibition venues allowed a wide variety of audiences to be included, ranging from 7 to over 65 years old and of diverse backgrounds
Of the numerous visitors in 9 participating countries24 , 4667 people responded to the questionnaire in analogue or digital form during the survey.The (travelling) exhibition made 24 No data available:At the time of evaluation, the Czech exhibition did not open yet. 23 See also: Balen, J. et al. 2022
54
archaeological and historical heritage more attractive for its integration into sustainable cultural tourism by making it accessible and visible to visitors in their own countries and visitors from abroad Most reported positive feedback regarding the provided and intensively used digital tools and were encouraged to visit the visualised sites in the landscape. Most visitors would recommend this digital tour/experience to family or friends
According to the current and planned usage of digital technologies in museums, the media used in this exhibition VR,AR, touch screens, audio/video elements and mobile applications will continue to be relevant for museums and future exhibitions, as well as for their audiences applicable key points for good practice were also observed Nonetheless, a few improvements can be recommended for future digital exhibitions and their surveys:
● QR codes had a limited validity and had to be replaced
● The varying setups and durations of the exhibitions limited the comparability of the survey results: Every country had a different setup and partly different contents for partly different digital tools
● Exhibition survey evaluation was almost finished when Czech exhibition started: there is no analysable data from the exhibition (travelling exhibition through Serbia, Slovakia and Czech Republic)
● Survey data from Bulgaria was very limited, analysis of data is not representative
● Visitors may not have differentiated between touch screen and monitor (or projection) or app and touch screen/monitor/mobile phone (or tablet)
● Visitors engagement decreased with the length of the questionnaire
● Additional feedback from visitors was collected:
○ When asked if they prefer heritage presentations with or without digital tools, some of the visitors in theAustrian and Hungarian exhibitions answered “both” or “a combination”
○ In theAustrian and Hungarian exhibitions, visitors also reported that the VR glasses were too heavy.
○ When experiencing immersive VR glasses, some of the visitors in the Hungarian exhibition remarked that they were either too big or heavy and slipped down.
○ Trying Serbian sites (Vršac-At, Vatin - Bela Bara) in VR often created nausea in visitors This problem is likely due to scene changes, jumping or walking unintentionally
55
6. Sources
Archaeology Museum Schloss Eggenberg, Universalmuseum Joanneum, 2022. Stories of the Past: Digital Journey into Lost Landscapes https://wwwmuseum-joanneum at/en/archaeology-museum-schloss-eggenberg/exhibitions/exhibitions /events/event/11174/stories-of-the-past-1 (last accessed 16 12 2022)
Aziz, M N A et al 2019 Classifying Digital Natives and Digital Immigrants as the Museum Visitors: AConceptual Framework, In Journal ofAdvanced Research in Dynamical and Control Systems
Balen, J et al 2021 Sustainable touristic value from digitization of archaeological heritage Digital approaches to the promotion of archaeological landscapes in the Danube region Graz: Universalmuseum Joanneum, 7
Balen, J et al 2022 Stories of the Past: Virtual Journey into Lost Landscapes National Museum of Slovenia, Ljubljana 2022
Beck, C et al 2013 In: Haldi, S (ed) Besucher im Museum: Ein Leitfaden Normen und Standards –Empfehlungen des VMS 2013, Verband der Museen der Schweiz VMS und Bundesamt für Kultur BAK, 6-7
DAeLVisitor Survey 2022 Survey Results on SurveyHero com https://surveyhero com/results/985037/84xydo9ayvmkbk8ysfg3mf32v40mm2kk (last accessed 16 12 2022)
Deutscher Museumsbund e. V. 2019. Leitfaden: Hauptsache Publikum! Besucherforschung für die Museumspraxis, Berlin, 22-42
Flügel, C. et al, 2019. Landesstelle für die nichtstaatlichen Museen in Bayern beim Bayerischen Landesamt für Denkmalpflege (eds ), Das erweiterte Museum: Medien,Technologien und Internet, 83; 102-103; 115-116
Foster, H , 2008 Evaluation toolkit for museum practitioners, East of England Museum Hub, 9
Interreg DanubeTransnational Programme, 2020 Danube’s archaeological eLandscapes: Virtual archaeological landscapes of the Danube region. https://wwwinterreg-danube eu/approved-projects/danube-s-archaeological-elandscapes (last accessed 16 12 2022)
Interreg DanubeTransnational Programme,April 2022 Danube’s archaeological eLandscapes: Playlist Visualisatons - Stories of the Past https://wwwinterreg-danube eu/news-and-events/programme-news-and-events/7811 (last accessed 16.12.2022)
Interreg DanubeTransnational Programme, July 2022 Danube’s archaeological eLandscapes:Tales of the Past: Journey to Lost Landscapes - Virtual exhibition in Zagreb, Croatia. https://wwwinterreg-danube eu/news-and-events/programme-news-and-events/7530 (last accessed 16 12 2022)
56
Jancsary, N 2022 Information and Communication Potential of Computer-Aided Visualisation of Archaeological Objects, Doctoral Dissertation, University of Ljubljana: Ljubljana, 71; 133
Kölliker, H., 2019. Digital Natives stellen bald die Mehrheit der aktiven Schweizer Bevölkerung – doch was zeichnet diese Zielgruppe aus?, blog carpathia ch https://blog carpathia ch/2019/12/23/digital-natives-stellen-bald-die-mehrheit-der-aktiven-schweizer-be voelkerung-doch-zeichnet-diese-zielgruppe-aus/ (last accessed 16 12 2022)
Linzbauer,A 2019 Multimediale Inszenierung vonArchäologie in ausgewählten Museen im Osten Österreichs Master’sThesis, University of Vienna: Vienna, 118-120; 132
Morris Hargreaves McIntyre, 2019 Breaking new ground:Asummative report of Manga London: British Museum
Newrly, P and Kramer, H (eds ) 2014 OPEN UP! Museum, Wie sich Museen den neuen digitalen Herausforderungen stellen– Ein Leitfaden aus Baden-Württemberg, MFG Innovationsagentur Medienund Kreativwirtschaft Baden-Württemberg, 33
Prensky, M 2001 Digital Natives, Digital Immigrants In On the Horizon, MCB University Press, Vol 9 No 5, October 2001
Tykhonova, O and Widmann, S (eds ), 2021 Museum Innovation Barometer, Wien: Museum Booster, 11-12; 15-19
Walhimer, M , Museum Exhibition Design, Part VI, Exhibition Evaluation, 2012 https://wwwmuseumplannerorg/museum-exhibition-design-part-vi/ (last accessed 16 12 2022)
57
Online survey decision options:25
Question
“Age” 7-12 13-17 18-24 25-34 35-44 45-54 55-64 65+
Decision options
“Gender” male female diverse no answer
“Where did you visit the exhibition (country)?” Austria Bulgaria
7.Appendix
25 DAeLVisitor Survey 2022 58
“Where do you live?”
Croatia
Czech Republic Germany Hungary Romania Serbia Slovakia Slovenia
I live in the country of the exhibition
I travelled here from abroad
“Is your profession connected to Cultural Heritage?”
Yes No
“Which visualisation tools did you experience?“ mobile phone monitor touch screen VR glasses
“Did you experience any problems while using the digital tools?”
none nausea physical discomfort hygiene concerns
59
COVID concerns unclear instructions technical errors not enough time
“Which sites did you see in the immersive VR?“
none Austria Bulgaria Croatia Czech Republic Germany Hungary Romania Serbia Slovakia Slovenia
“Which sites did you see with the app?“
none Austria Bulgaria Croatia Czech Republic Germany Hungary Romania Serbia Slovakia Slovenia
“Did the digital tools help you learn about the Cultural Heritage site?“ Yes
60
No
“Do you prefer heritage presentations with or without digital tools?“ With Without
“Did these visualisations encourage you to visit these sites in the landscape?”
Yes No
“Would you recommend this digital tour/experience to a family member or a friend?”
Yes No
Museums mentioned in this evaluation: Museum Homepage
Universalmuseum Joanneum https://www.museum-joanneum.at
Rousse Regional Museum of History https://www.museumruse.com
Archaeological Museum in Zagreb https://www.amz.hr/
Museum of West Bohemia https://www.zcm.cz
Hungarian National Museum https://mnm.hu/
National History Museum of Romania https://www.mnir.ro/
City Museum Vršac https://muzejvrsac.org.rs
East Slovak Museum in Košice https://www.vsmuzeum.sk/
National Museum of Slovenia https://www.nms.si/
Playlist of digital content made for the exhibitions available on YouTube: DAeLPlaylist onYouTube / https://youtu be/epCJtJc17ds
61