QUARTERLY MARKET REPORT
Second Quarter 2024 ~ April - June

QUARTERLY MARKET REPORT
Second Quarter 2024 ~ April - June
Pelican Bay
Vanderbilt Beach
Kalea Bay, The Dunes
New Buffalo, Three Oaks
Union Pier
Lakeside, Harbert
Sawyer Grand Beach, Michiana, Long Beach
Lake Geneva, Williams Bay
Fontana, Linn
Delavan, Como
Kenilworth,
Valley Old Town/Park City/Mountain Resort
The Canyons/The Colony
Thaynes Canyon, Park Meadows
Sun Peak/Bear Hollow
Silver Springs Area/Old Ranch Road/Kimball
Trailside Park/Quinn’s Junction
Silver Creek Estates/South
Prospector
Jeremy Ranch/Pinebrook/Summit Park
Heber City/Midway
Kamas
Jordanelle/Mayflower Jordanelle
Hideout
Glenwild
Promontory, Red Ledges
Tuhaye, Victory Ranch
#1
TEAM IN MIDWEST 2
#1
TEAM IN ILLINOIS 3
#1
TEAM IN SOUTHWEST FLORIDA 4
#1
TEAM IN UTAH 5
The DMG Difference is the power of our incomparable network. Our team receives daily calls from our global real estate partners with buyers who are interested in our markets in Illinois, Florida, Michigan, Utah and Wisconsin. These connections give us the ability to tap into a different buyer pool in a matter of seconds.
We operate as a true team. Our resident Chicago, Hinsdale, Lake Forest, Lake Geneva, Naples, New Buffalo and Park City agents cover the full spectrum of properties, handling both sales and rentals at all price points.
We work with clients across the nation. As Coldwell Banker’s top team in Illinois, the Midwest, Southwest Florida and Utah, our network extends beyond our markets to qualified buyers from all over the US and beyond.
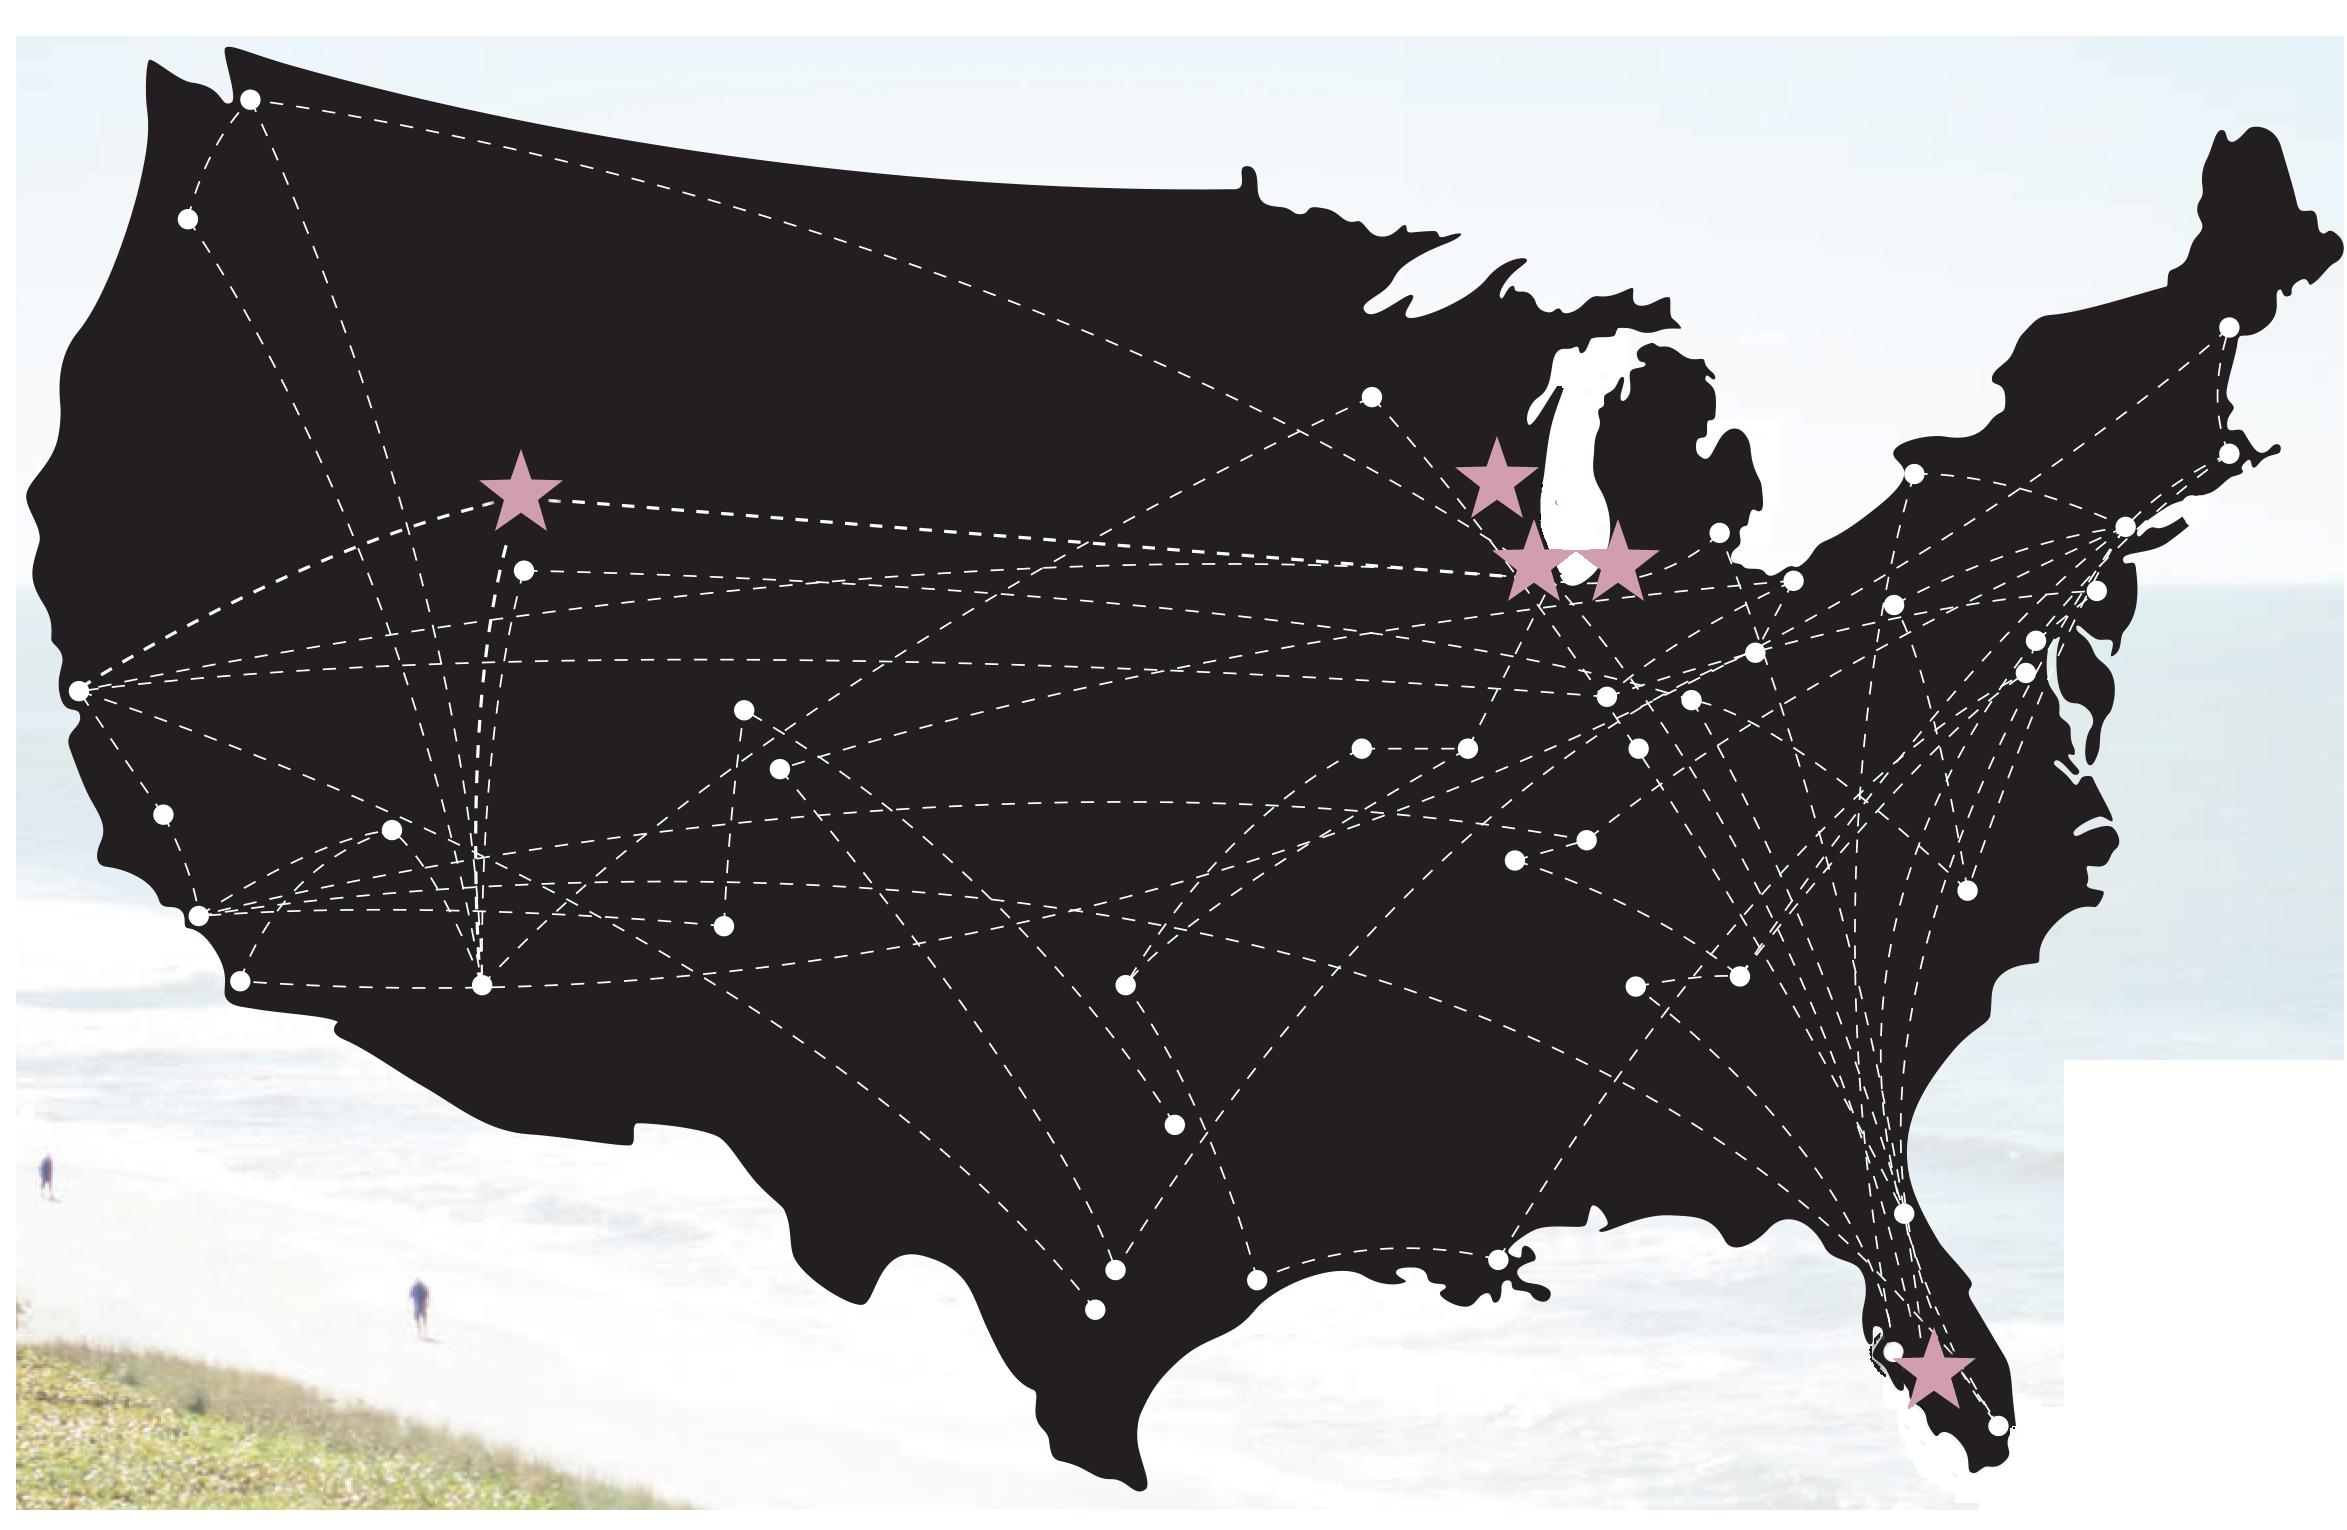
• Chicago, Lake Forest/ Lake Bluff and Winnetka, Illinois
• Lake Geneva, Wisconsion
• Naples, Flordia
• New Buffalo, Michigan
• Park City, Utah
• Arizona
• California
• Colorado
• Connecticut
• District of Columbia
• Florida
• Georgia
• Hawaii
• Illinois
• Indiana
• Long Island
• Louisiana
• Maine
• Maryland
• Massachusetts
• Michigan
• Minnesota
• Nevada
• New Jersey
• New York/ Long Island
• North Carolina
• Oregon
• South Carolina
• Tennessee
• Utah
• Virginia
• Washington
• Belgium
• Canada
• France
• Italy
• London
• Luxembourg
• Mexico
• Monaco
• Switzerland

The second quarter of 2024 showcased a resilient but challenging real estate market, characterized by high demand, rising prices, and a continued inventory shortage.
Inventory levels remained historically low, particularly in desirable urban and suburban areas. This persistent shortage has intensified competition among buyers in many markets, driving up home prices. Although there was a slight increase in new listings compared to the first quarter of 2024, it was not sufficient to significantly alleviate the overall shortage.
Home prices continued to rise, although the rate of increase slowed slightly compared to previous quarters. The national median home price1 increased in the second quarter of 2024 year-over-year by 4.6%, with some regions, particularly in the West and South, seeing higher price growth compared to the Midwest and Northeast.
Mortgage rates averaged between 6.5%7.0%2 for a 15 and 30-year fixed-rate mortgage during June 2024. However, demand remained strong, enhanced by increasing numbers of millennials entering their peak homebuying years. Rates continue to impact affordability, particularly for firsttime homebuyers, with many being priced out of competitive markets.
The rental market saw strong demand, particularly for single-family homes. This trend was driven by those unable to purchase homes due to high prices and mortgage rates as well as a lack of resale inventory. Rents increased across most markets, with some of the highest growth seen in suburban and secondary cities.
Real estate investors, including institutional investors, remained active, purchasing singlefamily homes and multi-family properties for rental income. The market for short-term rentals rebounded, particularly in vacation destinations, as travel picked up.
There continues to be a growing interest in sustainable and energy-efficient homes. Buyers are increasingly looking for properties with green certifications and eco-friendly features.
The market outlook for the remainder of 2024 is cautiously optimistic. While challenges such as high prices and mortgage rates persist, underlying demand remains strong.
Whether we’re helping you find your first apartment in the big city, relocating to a new home in the suburbs, or searching for a well-earned second home in the countryside, sunshine destination, or winter resort. We value the confidence you place in us and take that responsibility seriously.
Founder of the Dawn McKenna Group of Coldwell Banker

During the second quarter of 2024, the overall number of sales in both communities saw an increase compared to the first quarter of 2024 and the second quarter of 2023, particularly in the condo and townhome segments.
However, single-family home sales in Gold Coast declined quarter-over-quarter but remained consistent with year-overyear sales. The condo/townhouse market experienced a rise in sales, especially in the higher price bands compared to the second quarter of 2023.
APRIL 1 - JUNE 30, 2024 VS. SAME PERIOD 2023
Old Town generally experienced an overall increase in sales, with notable growth in the $1-2 million range for single-family homes and the $250,000 to $500,000 range for condominiums.
Many of these sales are being driven by a younger demographic. With the introduction of One Chicago and five new rental buildings, expect greater vibrancy to return to these highly desirable areas, further enhanced by new shops and restaurants, including the reopening of The Foxtrot Market, The Fresh Market.
APRIL 1 - JUNE 30, 2024 VS. SAME PERIOD 2023
$2,815,000
Median Sales Price
24 3.6 127
46 Months Supply of Inventory Months Supply of Inventory
$430,000
Median Sales Price
Avg. Market Time Avg. Market Time

APRIL 1 - JUNE 30, 2024 VS. SAME PERIOD 2023
$1,950,000
Sales Price
9
APRIL 1 - JUNE 30, 2024 VS. SAME PERIOD 2023
Market Time
$390,000
Median Sales Price
1.5 53 20 Months Supply of Inventory Months Supply of Inventory
Market Time
These predominantly high-rise communities are about to see increased activity with the addition of new developments.
After a long hiatus, one such development, The Spire, is starting construction, with the northernmost tower set to rise 72 stories and reach a height of 855 feet, and in phase 2, the second south tower will offer 60 stories. Additionally, two new rental buildings have been approved for development, along with the finalization of the Riverwalk.
CONDO/TOWNHOUSE
APRIL 1 - JUNE 30, 2024 VS.
River North saw sales remain on par with the second quarter of 2023 and increase significantly compared to the first quarter of 2024, with the highest number of sales in the $250,000 to $500,000 price range. The biggest change in demand (by percentage growth) was for condos valued over $2 million.
Streeterville experienced similar results, with an increase in sales across all price bands both year-over-year and quarter-over-quarter.
Prices in both markets have increased compared to the first quarter of 2024, and the average time on the market has declined.
$440,000
3.9
42 Months Supply of Inventory
CONDO/TOWNHOUSE
$450,000 5.8
56

Overall, both markets continue to be highly desirable, with sales only limited by the lack of inventory, particularly for condominiums, which had just one month’s supply remaining at the end of June.
Multiple offers on properties for sale are common, especially for those listed under $800,000.
The median sales price has risen in both markets and segments, while the average time on the market continues to fall as homes are quickly snapped up, often
APRIL 1 - JUNE 30, 2024 VS. SAME PERIOD 2023
without contingencies. Demand for singlefamily homes in the $1-2 million range remains strong quarter-over-quarter and year-over-year. Condominiums in the $500,000-$1 million range saw the highest level of sales in both markets.
In response to this high demand, the developer Fern Hill is moving forward with the overhaul of the old Walgreens on Wells Street, featuring a design that reflects the unique character of the area while providing a 36-story apartment tower.
APRIL 1 - JUNE 30, 2024 VS. SAME PERIOD 2023
$3,600,000
Sales Price Median Sales Price
$1,632,500 $453,750 3.9 1.2 38 16 Months Supply of Inventory

APRIL 1 - JUNE 30, 2024 VS. SAME PERIOD 2023
APRIL 1 - JUNE 30, 2024 VS. SAME PERIOD 2023
$1,795,000
2.7
1 32 20 Months Supply of Inventory Months Supply of Inventory
$625,010
Expect these neighborhoods to come alive this summer with plenty of festivals and activities, such as the Burger Fest and Retro on Roscoe.
Both neighborhoods continue to see strong demand, reflected in a slight increase in the median sales price, a lack of inventory, and a decrease in the average time on the market.
North Center single-family homes saw a slight increase in sales compared to both the second quarter of 2023 and the first quarter of 2024. In the condominium market, sales jumped over 100% in all price bands compared to the first quarter of 2024.
APRIL 1 - JUNE 30, 2024 VS. SAME PERIOD 2023
In Lincoln Square, a lack of inventory limited sales during the second quarter of 2024, with less than a month’s supply in both the single-family and condo/townhouse property markets.
A new development of single-family homes in North Center, priced around $1 million, is expected to help meet demand in the near future. And in Lincoln Square, DMG is representing the upcoming sale of a luxury apartment complex featuring 12 unitsThe Trieuth.
APRIL 1 - JUNE 30, 2024 VS. SAME PERIOD 2023
$2M+
$1,260,000
$565,000 1.9
$3,600,000
Median Sales Price Median Sales Price
16 Months Supply of Inventory Months Supply of Inventory
Market Time
0.6 19

APRIL 1 - JUNE 30, 2024 VS. SAME PERIOD 2023
APRIL 1 - JUNE 30, 2024 VS. SAME PERIOD 2023
$1,070,000
$370,000 1 0.9 24 13 Months Supply of Inventory Months Supply of Inventory Avg. Market Time Avg. Market Time
Median Sales Price
A lack of inventory, particularly for properties priced below $800,000, is a major trend in these three communities, with many homes receiving multiple offers and selling for over the asking price.
West Town/Wicker Park remains consistent year-over-year in sales levels. However, sales in the $1-2 million range for condo/townhomes increased significantly compared to both the second quarter of 2023 and first quarter of 2024.
Demand in the Humbolt neighborhood is equally strong, with the number of sales for single-family properties increasing significantly compared to the first quarter of 2024.
In Logan Square and Bucktown, sales of single-family homes in the $500,000 to $1 million range have increased year-overyear and quarter-over-quarter. While condominium sales saw little change yearover-year, they experienced a significant increase compared to the first quarter of 2024.
Overall, the median sales price has risen in all three markets, along with an increase in the entry price point, especially in Logan Square.
Construction is on the rise, with growing investment opportunities for buyers interested in older buildings that require or are currently undergoing renovation.
APRIL 1 - JUNE 30, 2024 VS. SAME PERIOD 2023
$1,171,500
CONDO/TOWNHOUSE
APRIL 1 - JUNE 30, 2024 VS. SAME PERIOD 2023
$3,600,000
$599,900 2.1 1.3 27
19 Months Supply of Inventory
SINGLE-FAMILY
APRIL 1 - JUNE 30, 2024 VS. SAME PERIOD 2023
CONDO/TOWNHOUSE
APRIL 1 - JUNE 30, 2024 VS. SAME PERIOD 2023
SINGLE-FAMILY
APRIL 1 - JUNE 30, 2024 VS. SAME PERIOD 2023
CONDO/TOWNHOUSE
APRIL 1 - JUNE 30, 2024 VS. SAME PERIOD 2023
Median Sales Price
Market Time
Median Sales Price
Market Time
Median Sales Price
Median Sales Price $908,500 $320,000 $522,500 $174,950 1.9 3.9 1 5.5 19 26 21 41 Months Supply of Inventory Months Supply of Inventory Months Supply of Inventory Months Supply of Inventory
New construction is on the rise in both communities after a 10-year hiatus, promising greater opportunities for buyers over the coming years.
The West Loop has seen a significant increase in sales for both single-family homes and condo/townhouse properties compared to the first quarter of 2024, matching sales levels from the second quarter of 2023. Demand for condominiums priced between $250,000 and $500,000 remains high, more than doubling quarter-over-quarter in 2024.
APRIL 1 - JUNE 30, 2024 VS. SAME PERIOD 2023
The Loop and Lakeshore East show similar sales demand, with condominium sales in the $250,000 to $500,000 range doubling compared to the first quarter of 2024 and remaining consistent year-over-year.
New stores and restaurants continue to offer exciting options for homeowners and visitors alike. Recently announced, local residents can expect a full-time market called Sunlife, recognized for its upscale quality food, to arrive in the neighborhood.
$764,000
Median Sales Price
APRIL 1 - JUNE 30, 2024 VS. SAME PERIOD 2023
$3,600,000
Median Sales Price
$398,000 4.3 2.3 27 24 Months Supply of Inventory Months Supply of Inventory Avg. Market Time
Market Time
$403,500 3.1
42 Months Supply of Inventory Avg. Market Time
Enjoy the Outdoor Summer Concert Series in Lake Forest on Thursday nights, visit Lake Bluff’s Farmer’s Market on Fridays mornings, or catch the upcoming Les Misérables performances by Uptown Theater of Highland Park, from the end of July to mid-August to name a few.
All three communities continue to experience low levels of available inventory, putting upward pressure on prices. As a result, highly desirable properties often receive multiple offers and sell for over the asking price.
Lake Bluff has seen a greater number of sales compared to the second quarter of 2023, with properties in the $500,000 to $750,000 range seeing the highest number of sales.
Lake Forest shows a decline in the number of sales year-over-year. However, with less than 2.5 months of inventory, this decline is likely linked to limited availability.
In contrast, Highland Park has seen an increase in sales year-over-year as well as quarterover-quarter, with the greatest number of sales in the $500,000 to $1 million range.
APRIL 1 - JUNE 30, 2024 VS. SAME PERIOD 2023
APRIL 1 - JUNE 30, 2024 VS. SAME PERIOD 2023
$830,000
Median Sales Price Median Sales Price
22
$1,195,000 1.3 2.3
37 Months Supply of Inventory Months Supply of Inventory Avg. Market Time

$785,000 1.3
Sales Price
29 Months Supply of Inventory
Summer is abuzz in New Trier Township. In Winnetka, enjoy the “Wednesday in the Woods” free concert series which takes place from 7-8:30pm each week and runs through August. On Saturday mornings, take a stroll through the Winnetka Farmer’s Market, open from 7:30am-12:30pm, or the Wilmette French Market from 8am-1pm. While in Wilmette, check out Wayfair’s first ever concept store which just opened at Eden’s Plaza.
From a sales perspective, Glencoe continues to show strong performance, with sales on par with the same quarter in 2023 and more than doubling in the $1-2 million range compared
to the first quarter of 2024. Winnetka saw a slight decline in sales year-over-year, but with only a two-month supply of inventory available, this is likely a significant factor. However, there was a substantial uptick in sales compared to the first quarter of 2024.
Kenilworth also experienced a slight decline in sales compared to the second quarter of 2023, likely due to the impact of having only a one-month supply of inventory. Wilmette remains steady in terms of the number of sales, with the $2-3 million price band showing a significant increase over both quarters.
APRIL 1 - JUNE 30, 2024 VS. SAME PERIOD 2023
APRIL 1 - JUNE 30, 2024 VS. SAME PERIOD 2023
Median Sales Price
1.8
$1,756,000 $1,750,000
28
13 Months Supply of Inventory Months Supply of Inventory Avg. Market Time
Median Sales Price
2
APRIL 1 - JUNE 30, 2024 VS. SAME PERIOD 2023
$0
APRIL 1 - JUNE 30, 2024 VS. SAME PERIOD 2023
Sales Price
Median Sales Price $1,476,000 $1,162,000 1.1
0.8 44 20 Months Supply of Inventory Months Supply of Inventory Avg. Market Time Avg. Market Time
The communities of Northbrook, Northfield, and Glenview continue to see strong sales compared to the same quarter in 2023, despite having less than a month and a half of inventory available.
SINGLE-FAMILY
APRIL 1 - JUNE 30, 2024 VS. SAME PERIOD 2023
In Northbrook and Glenview, the greatest number of sales are for homes valued between $500,000 and $1 million, indicating high demand in this price range. In Northfield, although the median sales price is higher, the majority of homes sold also fall within the $500,000 to $1 million range.
APRIL 1 - JUNE 30, 2024 VS. SAME PERIOD 2023
APRIL 1 - JUNE 30, 2024 VS. SAME PERIOD 2023
Median Sales Price
$810,000 1.5
18 Months Supply of Inventory
Avg. Market Time
Median Sales Price
$1,047,000 1
19 Months Supply of Inventory
Avg. Market Time
$850,000
Median Sales Price
1.4
13 Months Supply of Inventory
Avg. Market Time

1 2 3 4 5 6 7 8 9 10
Affordable Living: Compared to other major cities in the U.S. Chicagoland offers comparatively more affordable living in and out of the city, for those looking to buy or rent.
World Class Cuisine and Dining: Chicagoland offers a diverse and thriving culinary culture that ranges from Michelin Star restaurants and international fine dining to deep-dish pizza and Chicago-style hot dogs.
Theatre and Festivals: Chicago is the perfect place to be if you are looking to be wowed by entertainment. There are musicals, ballet performances, shows at the Chicago Symphony Orchestra, and outdoor concerts with a view of the skyline at Northerly Island.
Access to Lake and Outdoor Spaces: Lake Michigan shoreline and beaches, including swimming, boating and fishing. In winter, activities abound.
Excellent Education System: Many schools, colleges and universities have been recognized as being in the U.S. Top 10 percentile for their category.
Midwestern Warmth: Extends even into downtown Chicago, where people are fast to say hello and offer a helping hand.
Easy Transportation System: Chicago has one of the most highly rated transportation systems, including the Chicago Transit System (the “L”), bus lines, water taxis, Amtrak and access to two international airports.
Exciting Sports Options: Sports in Chicagoland offer a diverse range of excitement, from baseball and basketball to football, hockey, soccer, and thrilling college sports events.
Vibrant Arts and Culture Scene: Museums, theaters, galleries, music venues, and festivals that cater to a wide range of interests and provide a captivating cultural experience.
Abundant Job Opportunities: Chicagoland presents a multitude of job opportunities across various industries, thanks to its thriving economy, diverse sectors, and the presence of major corporations, making it an attractive destination for professionals seeking career growth.
This summer, get ready to enjoy a variety of exciting events, festivals, and farmer’s markets. Additionally, don’t miss the opening of Petite Vie, a new French brasserie by Paul Virant, in Western Springs.
These communities continue to feel the impact of limited inventory, causing upward pressure on prices, multiple offers, and properties selling for over the asking price.
Western Springs saw little change in the number of sales compared to the second quarter of 2023. However, sales have nearly
APRIL 1 - JUNE 30, 2024 VS. SAME PERIOD 2023
doubled in the $1-2 million range compared to the first quarter of 2024.
La Grange shows a similar trend, with sales volume on par year-over-year. Despite having less than a month’s supply of inventory, the number of sales has doubled compared to the first quarter of 2024 and tripled for homes in the $500,000 to $750,000 price range.
La Grange Park and La Grange Highlands also show stable year-over-year sales but significant increases compared to the first quarter of 2024.
APRIL 1 - JUNE 30, 2024 VS. SAME PERIOD 2023
$855,500
Median Sales Price Median Sales Price
23
$664,000 1.2
0.6
9 Months Supply of Inventory Months Supply
Inventory Avg. Market Time
APRIL 1 - JUNE 30, 2024 VS. SAME PERIOD 2023
$0
APRIL 1 - JUNE 30, 2024 VS. SAME PERIOD 2023
$468,125
$440,000 1.2
3 16 12 Months Supply of Inventory Months Supply of Inventory
Market Time
Market Time
These communities continue to see sales hampered by low inventory levels, with less than a two-month supply available.
Despite this, overall sales in the second quarter of 2024 remained close to the number of sales in the same quarter of 2023 and rose significantly—two to three times the volume seen in the first quarter of 2024.
Downers Grove saw strong sales numbers in the $0 to $500,000 range, with the greatest percentage increase compared to the second
SINGLE-FAMILY
SINGLE-FAMILY
quarter of 2023 occurring in the $750,000 to $1 million price range.
Naperville and Elmhurst both registered similar median sold prices and saw high demand for homes in the $500,000 to $750,000 price range.
In a slightly higher price bracket, Oak Brook also saw an increase in sales during the second quarter, particularly in the $1-$2 million price range.
$515,000
$710,000 1.2 1 17 15 Months Supply of Inventory Months Supply of Inventory
Market Time
APRIL 1 - JUNE 30, 2024 VS. SAME PERIOD 2023
$665,000
25
APRIL 1 - JUNE 30, 2024 VS. SAME PERIOD 2023
$1,125,000 1.2
40 Months Supply of Inventory Months Supply of Inventory
Market Time
Sales Price Median Sales Price
2
Despite Clarendon Hills and Hinsdale experiencing inventory levels at all-time lows with less than a month’s supply, the number of sales has surprisingly increased significantly compared to both the second quarter of 2023 and the first quarter of 2024.
Demand in both communities remains very high and competitive for potential buyers. However, Hinsdale will see a little relief with the construction of a small development of eight single-family homes by J. Jordan Homes.
SINGLE-FAMILY
APRIL 1 - JUNE 30, 2024 VS. SAME PERIOD 2023
While Burr Ridge and Willowbrook have slightly better inventory levels at just under two and three months, respectively, overall sales have remained on par with the second quarter of 2023.
In other news, DMG, headquartered in Hinsdale, is set to move into new offices this summer—more details will be forthcoming shortly.
SINGLE-FAMILY
APRIL 1 - JUNE 30, 2024 VS. SAME PERIOD 2023
$950,000
Median Sales Price
0.3
29
Avg. Market Time
$1,350,000
Median Sales Price
0.8
22 Months Supply of Inventory Months Supply of Inventory
Market Time
APRIL 1 - JUNE 30, 2024 VS. SAME PERIOD 2023
APRIL 1 - JUNE 30, 2024 VS. SAME PERIOD 2023
$1,150,000
$485,000 1.9
26
31 Months Supply of Inventory Months Supply
2.7
Port Royal and Aqualane Shores are not only two of the wealthiest communities in Naples, but Port Royal is now recognized as one of the top 10 most expensive neighborhoods in the U.S.
Port Royal Beach Club, devastated by Hurricane Ian, sees 20 months of design work involving the input from its 660 members nearing completion - with August 21st slated for the Naples City Council to consider its new proposal.
Both communities have seen year-over-year increases in inventory levels, providing more
SINGLE-FAMILY
APRIL 1 - JUNE 30, 2024 VS. SAME PERIOD 2023
opportunities for buyers. This is evident as sales have remained steady, matching the typically busier first quarter of 2024.
Demand for higher-priced homes remains strong as affluent buyers appreciate the exclusive range of homes available, thanks to the increased inventory offering greater choice.
Despite a significant rise in prices, both communities have returned to traditional norms regarding selling rates, with average time on market over 200 days and months of supply exceeding 12 months.
$12,000,000
Median Sales Price
12
270 Months Supply of Inventory
Avg. Market Time
SINGLE-FAMILY
APRIL 1 - JUNE 30, 2024 VS. SAME PERIOD 2023
$10,900,000
14
209
Olde Naples welcomes the much-anticipated mixed-use project from M Development and their affiliate Fifth Avenue South Holdings. This 4.32-acre site will feature condominiums, boutique retail spaces, and restaurants. DMG will handle the sale of 50 luxury condominium units situated above the shops and restaurants.
Royal Harbor is also undergoing transformation as developers and buyers recognize the opportunity to purchase properties at comparatively lower prices than other luxury markets. Spec homes similar to those in Aqualane are being built here.
SINGLE-FAMILY
APRIL 1 - JUNE 30, 2024 VS. SAME PERIOD 2023
Increased inventory levels in all these communities have created more opportunities for buyers. Remarkably, for the most part, the number of sales has risen compared to the first quarter of the year, a time typically known for higher winter sales.
Notably, Royal Harbor has seen an increase in sales over $5 million, while in Olde Naples and The Moorings, there is strong demand for condo/townhouses priced under $2 million.
$6,195,000
Sales Price
12.5
186 Months Supply of Inventory
APRIL 1 - JUNE 30, 2024 VS. SAME PERIOD 2023
CONDO/TOWNHOUSE
APRIL 1 - JUNE 30, 2024 VS. SAME PERIOD 2023
$6,300,000
Median Sales Price
19
96
$940,000
Median Sales Price
9.5
113 Months Supply of Inventory Months Supply of Inventory Avg. Market Time
Market Time
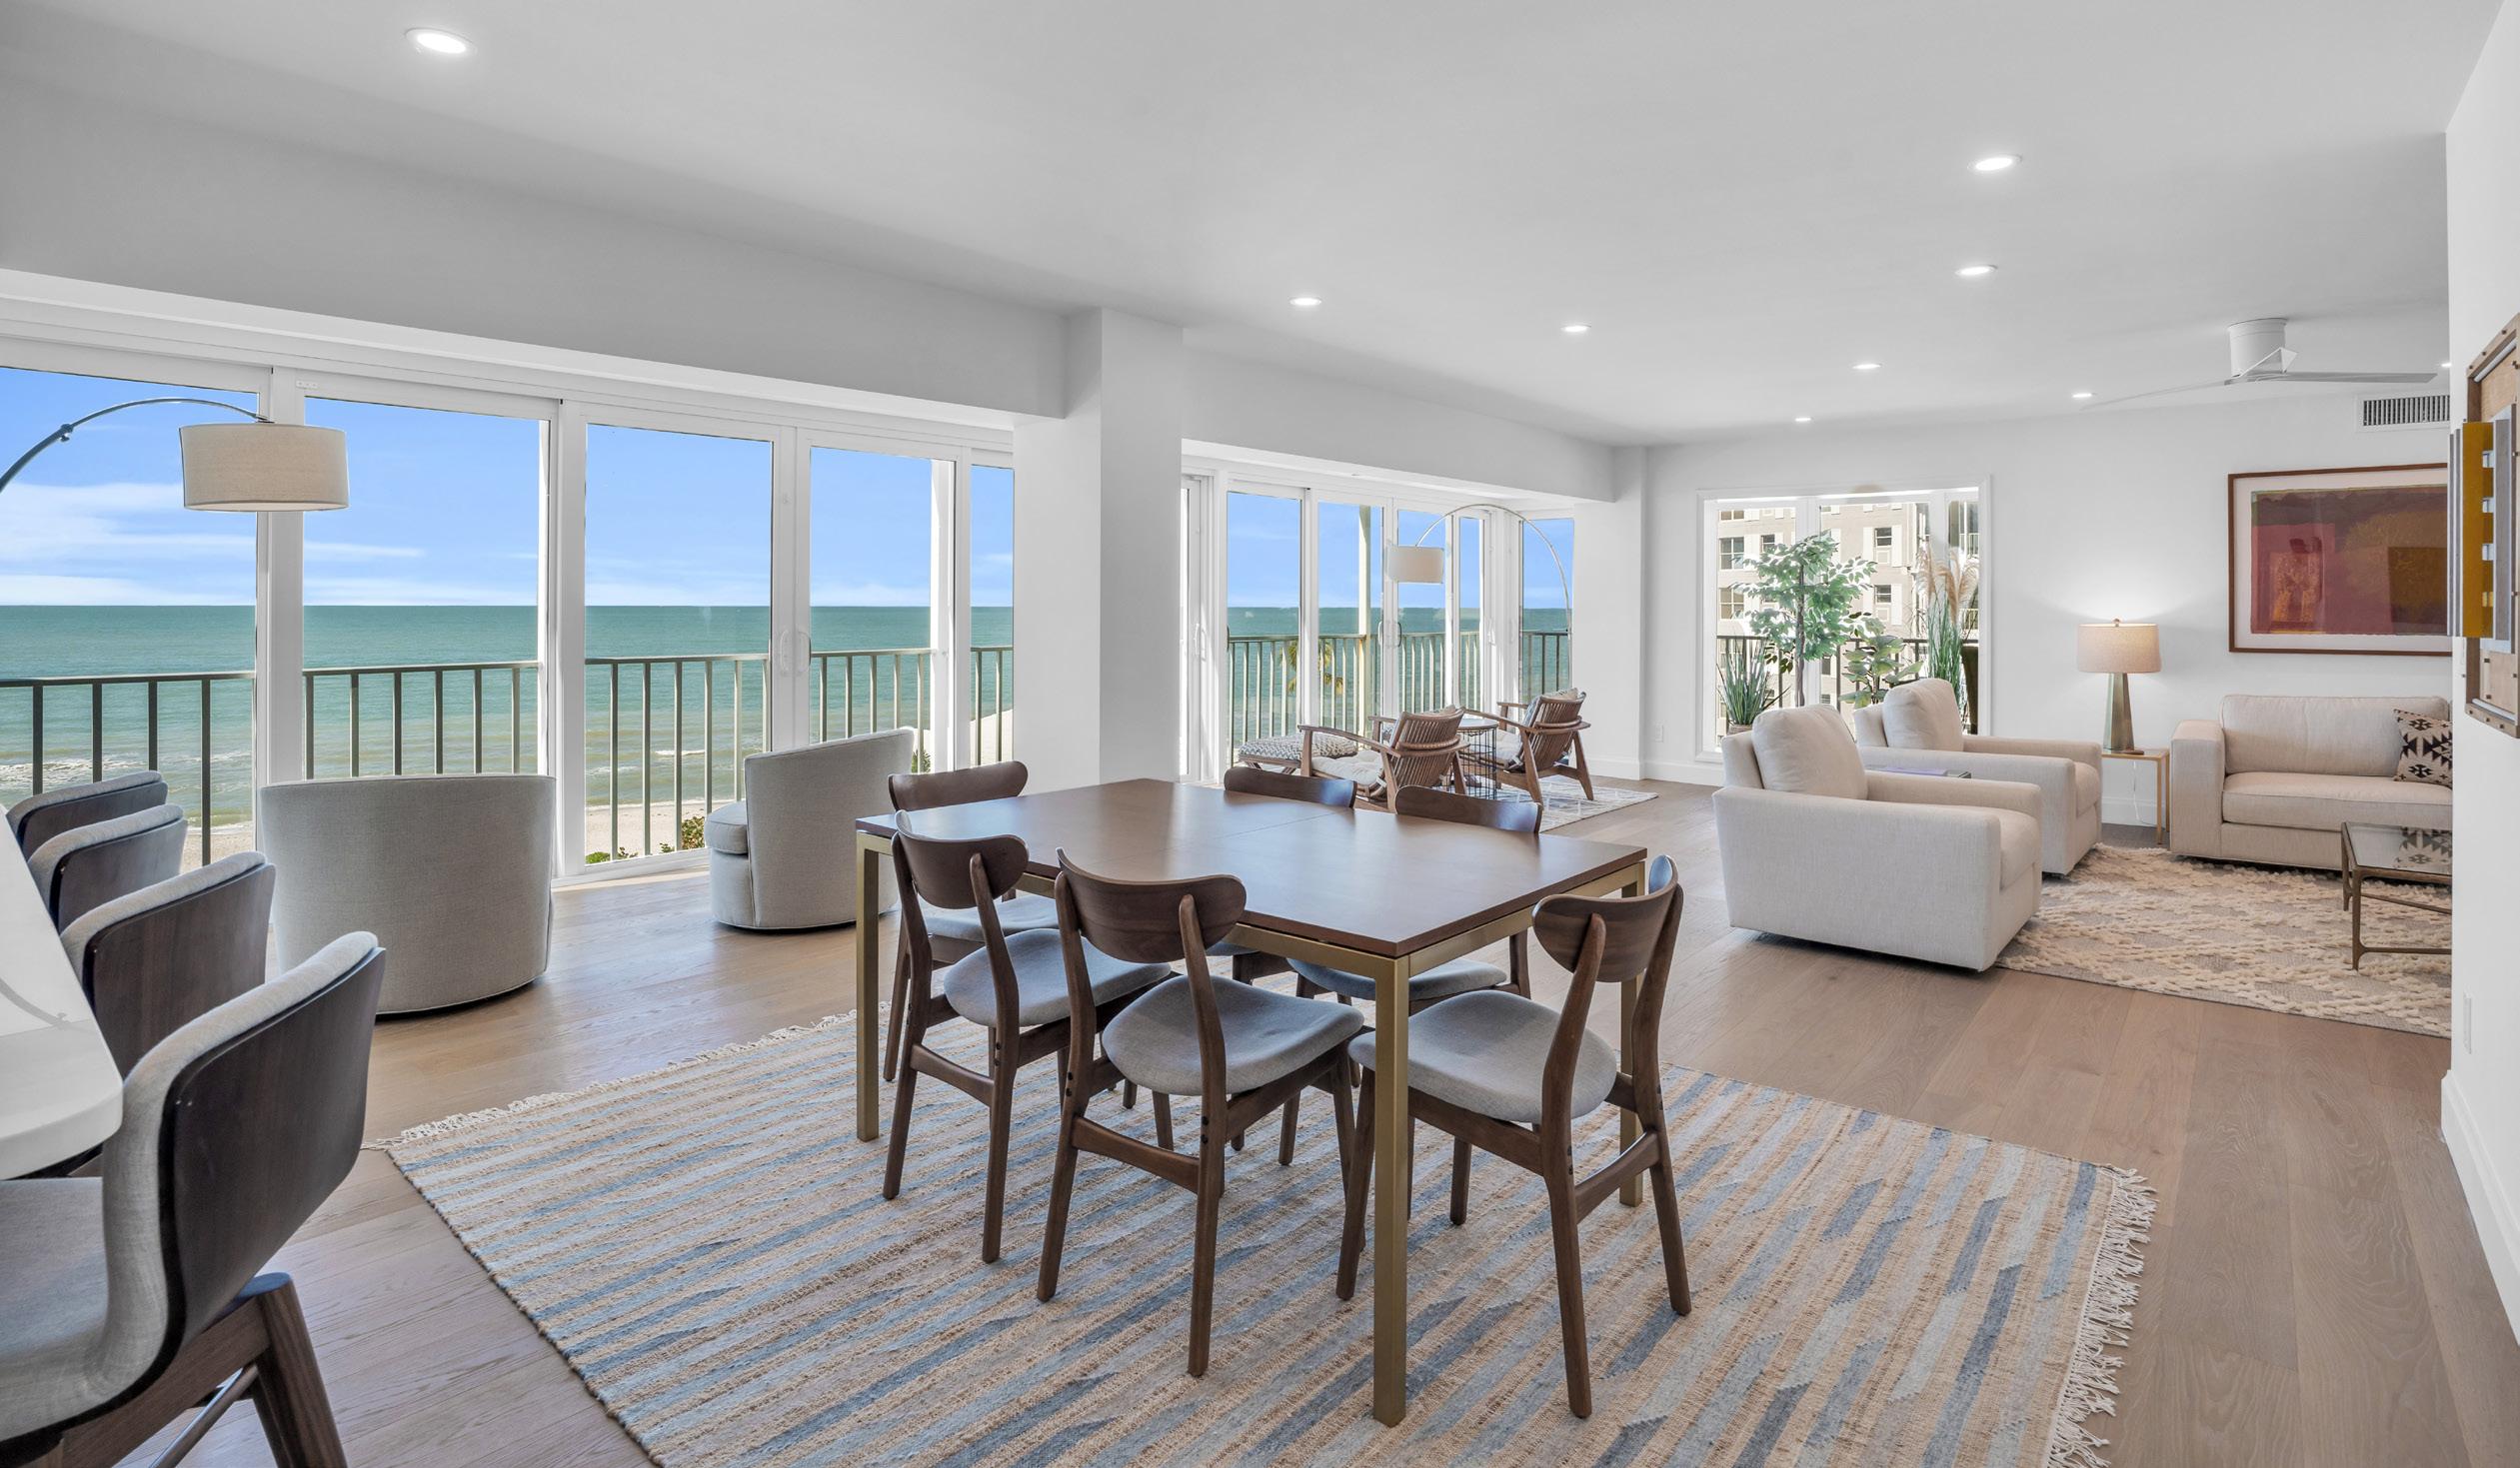
NAPLES - 222 HARBOUR DRIVE 508
DMG represented the Seller
APRIL 1 - JUNE 30, 2024 VS. SAME PERIOD 2023
$2,500,000
CONDO/TOWNHOUSE
APRIL 1 - JUNE 30, 2024 VS. SAME PERIOD 2023
$3,600,000
$502,000 11 12 114
150 Months Supply of Inventory Months Supply of Inventory
Market Time
Market Time
APRIL 1 - JUNE 30, 2024 VS. SAME PERIOD 2023
$5,575,000
APRIL 1 - JUNE 30, 2024 VS. SAME PERIOD 2023
Market Time
$990,000
Supply of Inventory
18 6 121 78 Months Supply of Inventory
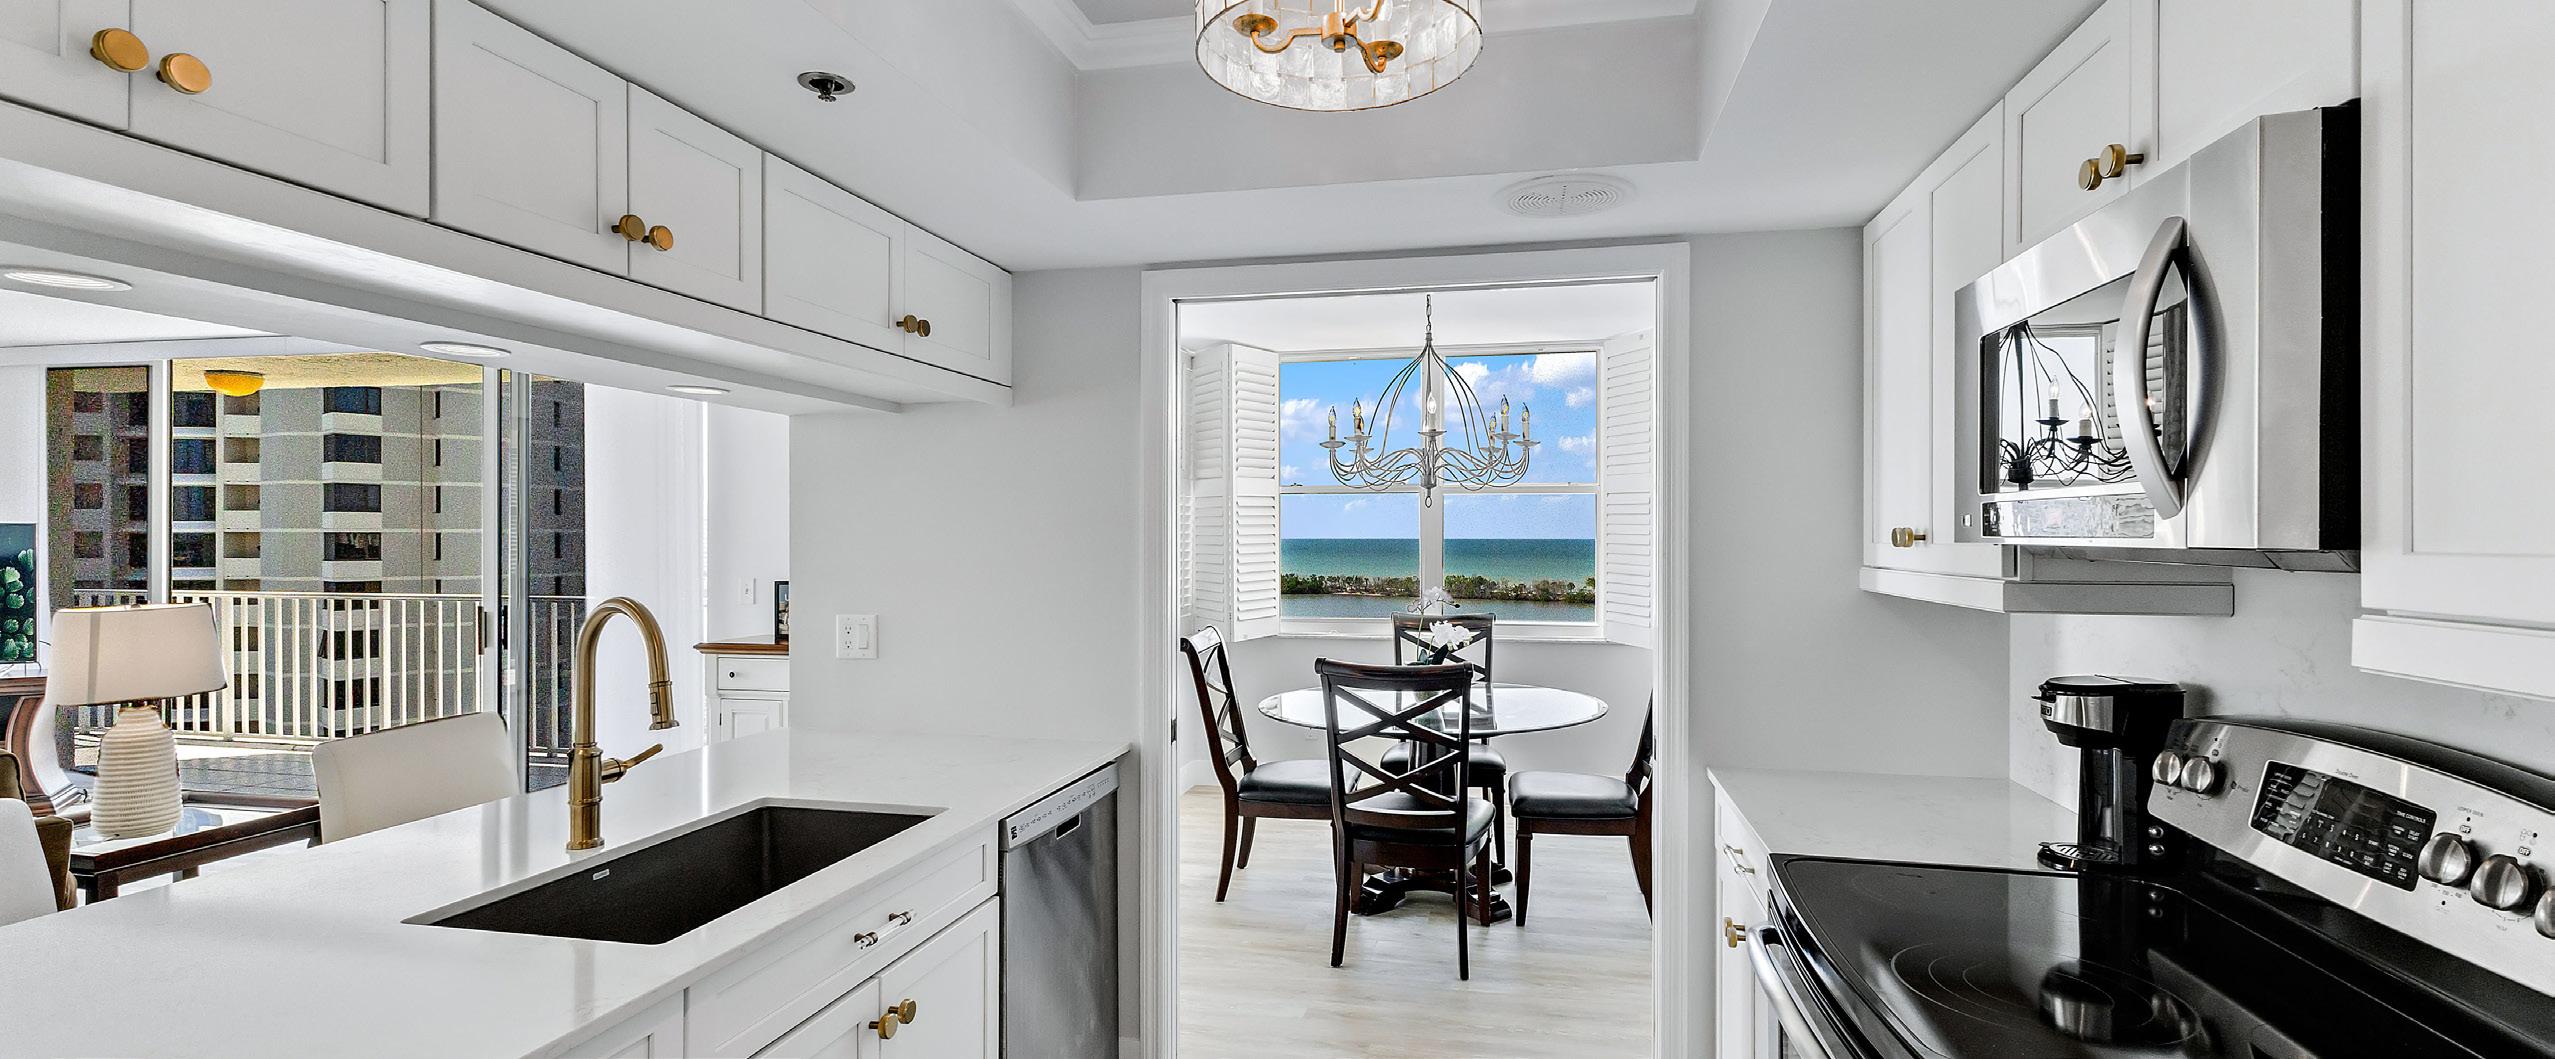
Inventory levels for single-family homes in Park Shore, Seagate, and Pelican Bay have increased substantially over the last quarter, maintaining the consistency in the number of sales compared to the second quarter of 2023.
Sales in Park Shore have remained steady compared to the first quarter of 2024. In contrast, Pelican Bay has seen a significant uptick, with strong demand for properties over $4 million.
APRIL 1 - JUNE 30, 2024 VS. SAME PERIOD 2023
The condo/townhouse property market in Park Shore and Pelican Bay experienced a robust second quarter, with sales increasing compared to both the second quarter of 2023 and the first quarter of 2024.
The majority of sales in the second quarter were driven by condominiums priced between $800,000 and $2 million. Notably, there was also an increase in sales for properties in the $3-4 million range in Park Shore and those priced above $4 million in Pelican Bay.
CONDO/TOWNHOUSE
APRIL 1 - JUNE 30, 2024 VS. SAME PERIOD 2023
$5,300,000
Sales Price
149
$3,600,000
32 10.5
$1,800,000
Median Sales Price
102 Months Supply of Inventory Months Supply of Inventory
$1,512,500 4
86 Months Supply of Inventory Avg. Market Time
APRIL 1 - JUNE 30, 2024 VS. SAME PERIOD 2023
CONDO/TOWNHOUSE
APRIL 1 - JUNE 30, 2024 VS. SAME PERIOD 2023
Median Sales Price
$3,600,000
Market Time
Median Sales Price $3,600,000 $1,365,000 18.5 5.2 81 84 Months Supply of Inventory Months Supply of Inventory
Market Time

1 2 3 4 5 6 7 8 9 10
Naples has been recognized by US News and World Report as one of the top 10 best places to live in America for the years 2023 and 2024, based on quality of life, value, job market and desirability.
Tropical Paradise: The year-round warm weather allows for outdoor activities and a relaxed lifestyle.
Outdoor Recreation: From boating, fishing and kayaking there are countless water activities. Naples is also recognized for being both the “Golf and Pickleball Capital of the World”, with a choice of over 80 championship golf courses and 160 public pickleball courts.
Golfing Galore: There are 108 courses within a 15-mile radius of Naples, 16 of which are public courses and 82 are private courses. There are 86 18-hole courses and 22 nine-hole layouts.
Diversifying Population: Naples has long been a popular retirement and second home community, however the growth in the last five years has evolved into full-time residents that include younger and multigenerational families.
Shopping & Dining: Naples offers a wealth of upscale shopping and dining experiences.
Thriving Real Estate Market: As a national vacation hot spot, real estate in Naples has consistently been a good investment.
Cultural Hub: A world-class zoo, a stunning botanical garden, and numerous museums and galleries, such as Artis Naples, The Naples Philharmonic, Naples Players, and Gulfshore Playhouse, make art, culture, and entertainment the way of life in Naples.
You’re Well-Connected: Naples is conveniently located near larger cities like Sarasota, Marco Island, Fort Myers and even Miami, which is only 2 hours away.
A Robust Economy & Job Market: There are plenty of exciting work opportunities, thanks to the city’s impressive growing economy, that includes many Fortune 500 companies.
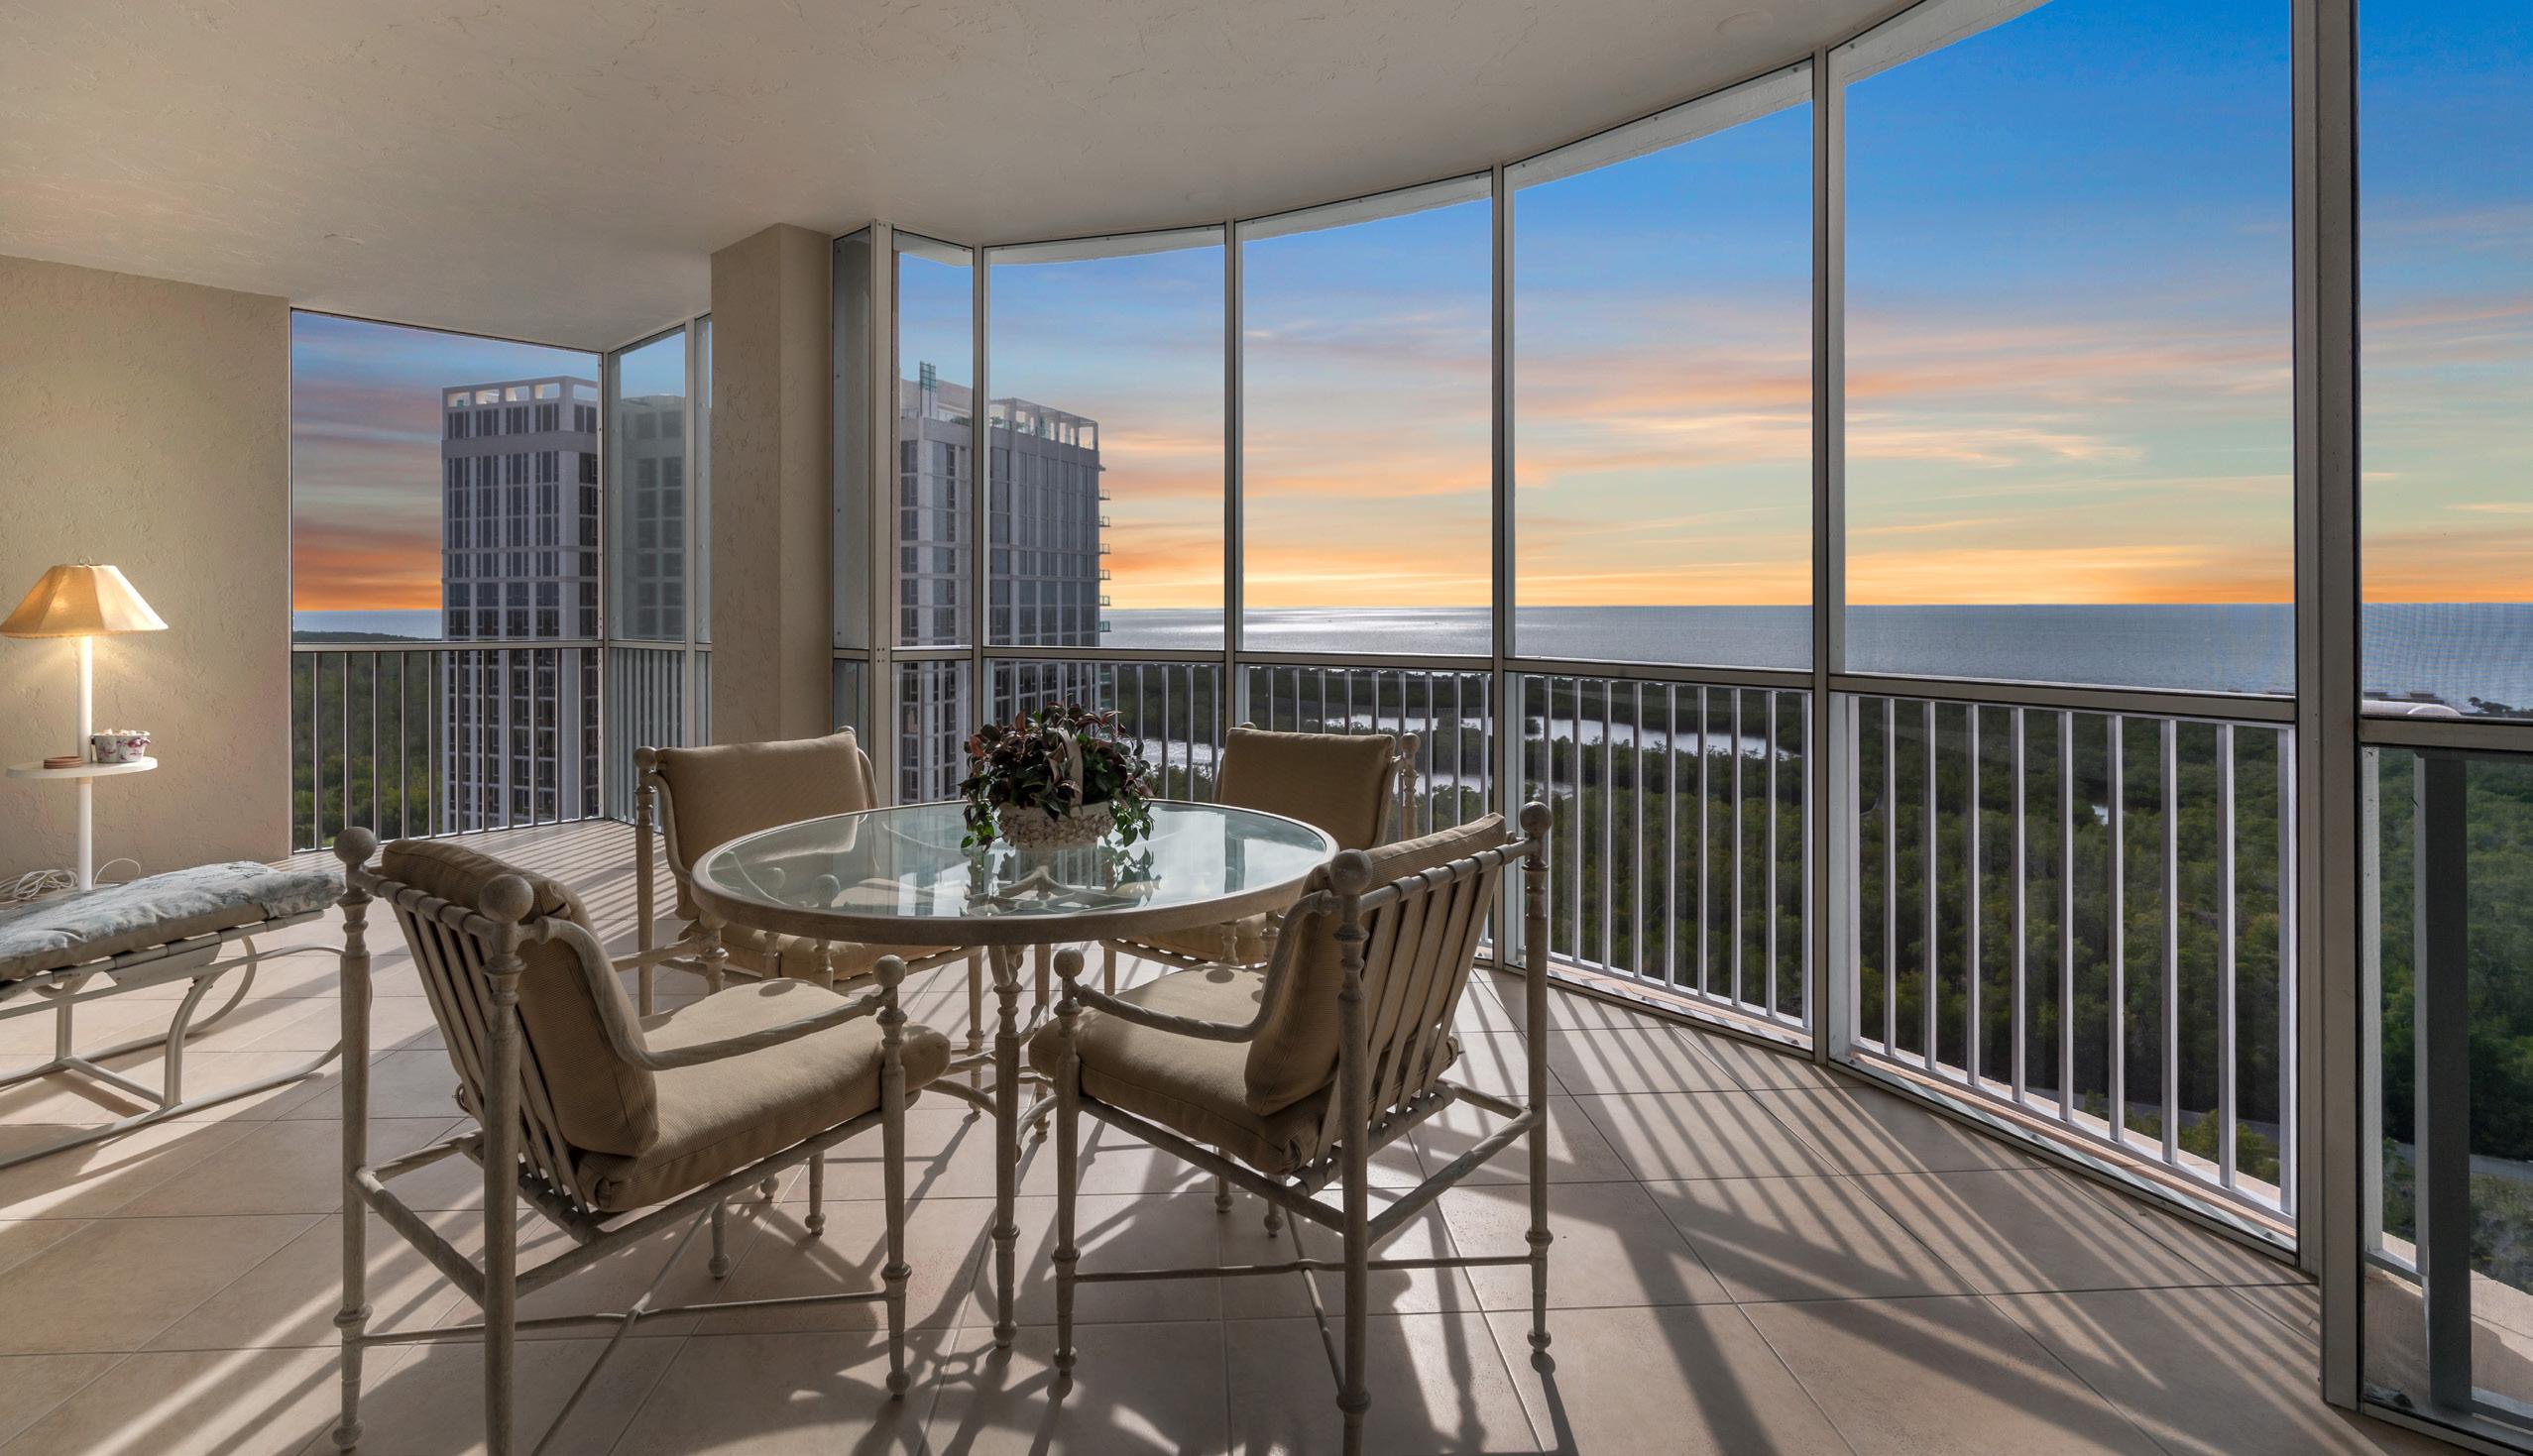
Stretching from Immokalee Road to Vanderbilt Beach Road, Vanderbilt Beach is a stunning area featuring homes with gulf access, beachfront condos, and high-end hotels.
Inventory levels for both single-family and condo/townhouse properties have increased over the last quarter, leading to a strongerthan-expected number of sales compared to both the first quarter of 2024 and the second quarter of 2023.
APRIL 1 - JUNE 30, 2024 VS. SAME PERIOD 2023
Just north of Vanderbilt Beach are two notable developments. During the second quarter of 2024, a significant number of preconstruction sales in the $2-3 million range were finalized with the completion of the fourth tower in Kalea Bay. These units are now selling for $4-5 million in today’s market.
The Dunes continues to experience strong demand in the second quarter of 2024, particularly for properties in the $1-2 million and $2-3 million ranges.
CONDO/TOWNHOUSE
APRIL 1 - JUNE 30, 2024 VS. SAME PERIOD 2023
$3,450,000
Median Sales Price
132
$985,000
$3,600,000
Median Sales Price
30 12.5
125
CONDO/TOWNHOUSE
APRIL 1 - JUNE 30, 2024 VS. SAME PERIOD 2023
CONDO/TOWNHOUSE
APRIL 1 - JUNE 30, 2024 VS. SAME PERIOD 2023
Median Sales Price
$2,700,000 11
67 Months Supply of Inventory Avg. Market Time
$2,160,000
Median Sales Price
9.5
98 Months Supply of Inventory
Market Time
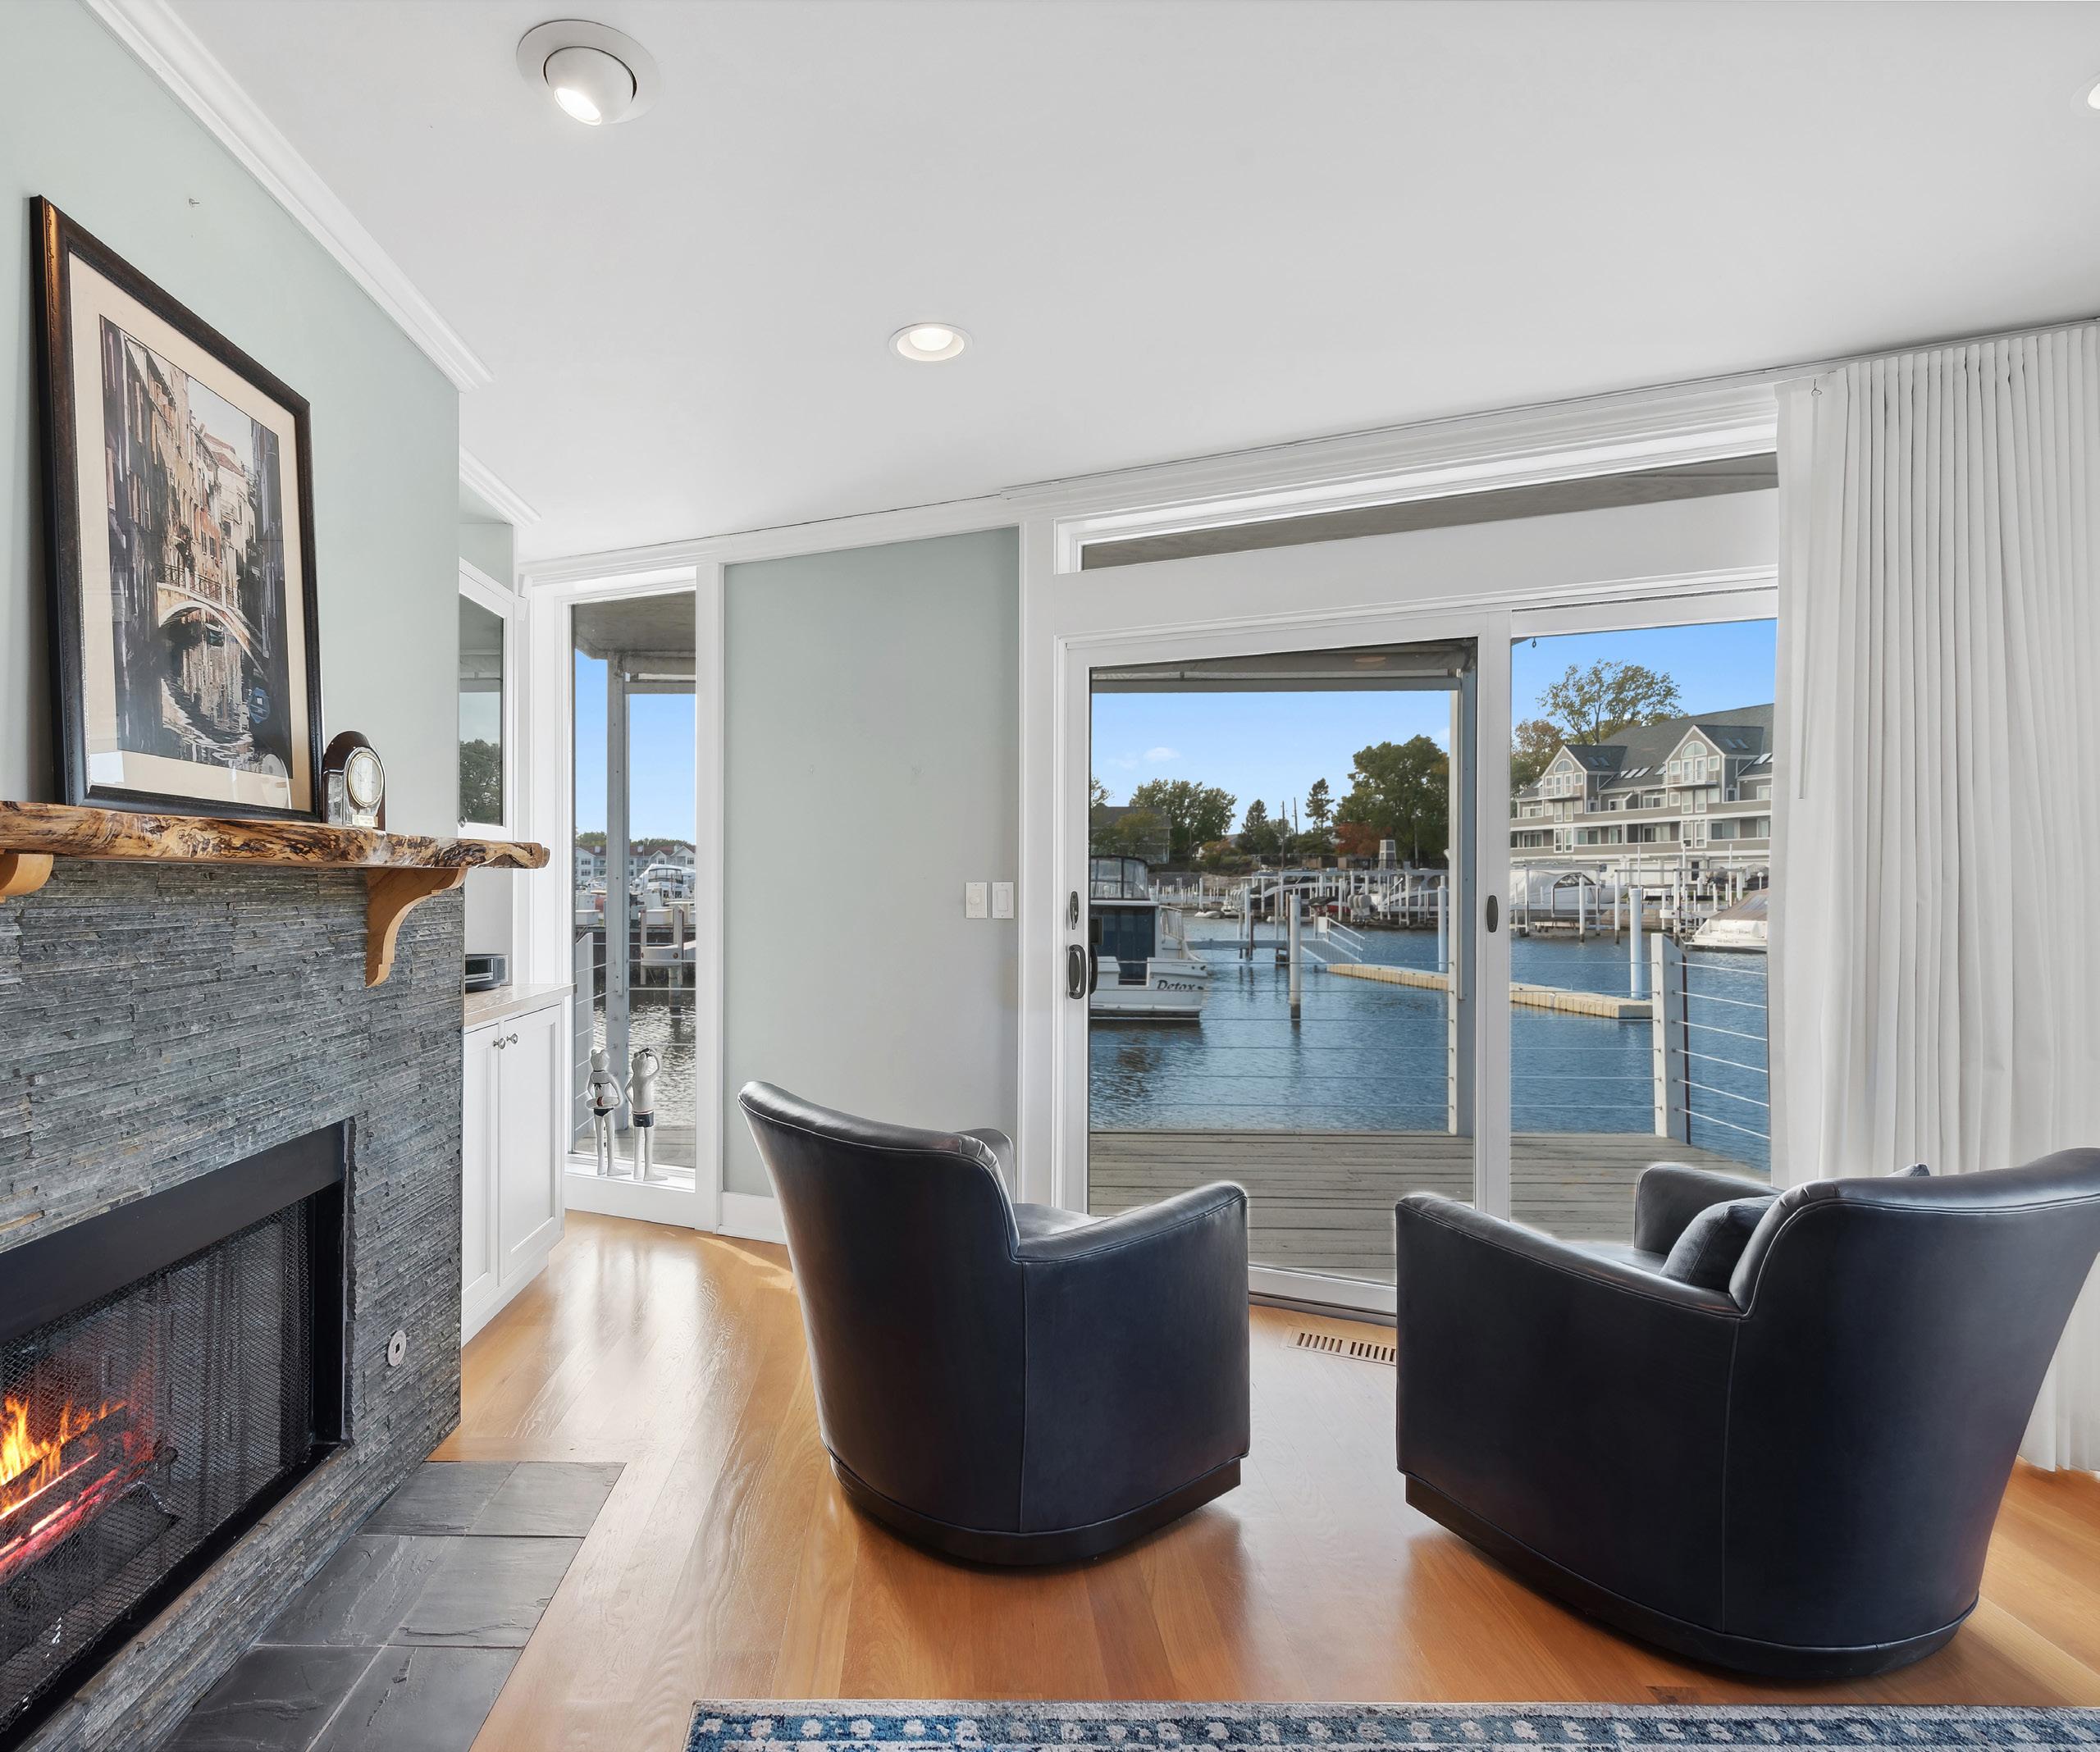
Expect to see changes this summer across all three of these communities as they embrace new developments and retail stores.
New Buffalo has welcomed six new retail stores and a new restaurant, significantly enhancing its appeal. This influx is especially impactful for a small community, highlighting its growing popularity. Additionally, home sales have increased compared to the second quarter of 2023 and have nearly doubled from the first quarter of 2024.
SINGLE-FAMILY
APRIL 1 - JUNE 30, 2024 VS. SAME PERIOD 2023
Three Oaks experienced a decrease in sales year-over-year, with only a slight uptick from the first quarter of the year. However, this artsy town has benefited from several new stores opening and expects to see a number of new restaurants by the end of summer or early fall. Its lower price point offers more opportunities for those looking to establish themselves in Harbor Country.
Union Pier also saw a decline in sales during the second quarter compared to 2023. However, buyer opportunities are expected to rise with the upcoming Driftwood development, featuring 17 new homes.
$412,000
Median Sales Price
3.7
41 Months Supply of Inventory Avg. Market Time
SINGLE-FAMILY
APRIL 1 - JUNE 30, 2024 VS. SAME PERIOD 2023
$282,000 8
91 Months Supply of Inventory
$1,466,500 20 23 Months Supply of Inventory
Market Time
Growing confidence and investment in these three communities are driving changes that enhance features and opportunities.
Developers are purchasing land, with new homes priced in the $1-1.3 million range expected over the next couple of years. Sawyer will welcome a new French Bistro by the end of the summer, but in the meantime check out the live music events being hosted by Window Shopping and Susan’s.
The Lake Michigan walkway project is steadily extending northward and this year will also mark an inaugural 5K run.
In Lakeside and Harbert, sales remain slow due to a lack of appropriately priced inventory and properties requiring significant renovations.
Sawyer, in contrast, has experienced an increase in sales compared to both the second quarter of 2023 and the first quarter of 2024, thanks to its lower price points.
SINGLE-FAMILY
APRIL 1 - JUNE 30, 2024 VS. SAME PERIOD 2023
$0
N/A 6 N/A Months Supply of Inventory Avg. Market Time
SINGLE-FAMILY
APRIL 1 - JUNE 30, 2024 VS. SAME PERIOD 2023
$1,635,000 4
90 Months Supply of Inventory
Sales Price $550,500 6 26 Months Supply of Inventory
Low inventory levels continue to characterize the real estate market in these popular lakeside villages, yet the number of sales has mostly increased compared to both the second quarter of 2023 and the first quarter of 2024.
SINGLE-FAMILY
APRIL 1 - JUNE 30, 2024 VS. SAME PERIOD 2023
$820,000 2
62 Months Supply of Inventory Avg. Market Time
SINGLE-FAMILY
APRIL 1 - JUNE 30, 2024 VS. SAME PERIOD 2023
$1,202,500
Median Sales Price
5
122 Months Supply of Inventory
Avg. Market Time
APRIL 1 - JUNE 30, 2024 VS. SAME PERIOD 2023
$1,200,000
Median Sales Price
1.8
17 Months Supply of Inventory
Avg. Market Time

1 2 3 4 5 6 7 8 9 10
Scenic Beauty: Boasts stunning natural landscapes, including sandy beaches along Lake Michigan, lush forests, and rolling dunes. The area’s picturesque beauty provides a tranquil and serene environment.
Lake Michigan: Living here means access to one of the largest freshwater lakes in the world. Residents can enjoy water activities, including swimming, boating, fishing, sailing, paddleboarding, kayaking and relaxing on the beach.
Quaint Small Towns: Home to charming small towns such as New Buffalo, Sawyer, and Three Oaks. These towns offer a relaxed pace of life, friendly communities, and unique local shops and restaurants.
Culinary Scene: The region is known for its diverse culinary scene, featuring farm-to-table dining, wineries, distilleries, breweries, and artisanal food producers. Residents can explore a variety of dining options that showcase local flavors.
Arts and Culture: Has a vibrant arts and culture community, with galleries, theaters, and cultural events throughout the year. This adds a creative and enriching aspect to the community.
Outdoor Recreation: Beyond the beaches, residents can enjoy hiking, biking, and exploring nature trails in the area. Warren Dunes State Park and Indiana Dunes National Park are popular destinations for outdoor enthusiatsts.
Seasonal Activities: Experiences all four seasons, each offering unique activities. From summer beach days to fall foliage tours, winter sports, and springtime blossoms, residents can enjoy a variety of seasonal experiences.
Winery, Brewery and Distillery Tours: The region is known for its wineries, breweries and distilleries, making it a paradise for wine and beer enthusiasts. Residents can explore local vineyards and tasting rooms.
Community Events: Hosts various community events and festivals, fostering a sense of community and providing opportunities for residents to come together and celebrate.
Proximity to Chicago: Conveniently located near Chicago, making it an ideal getaway for city dwellers. The short drive or a fast train journey, through a new high-speed rail system from Chicago, will allow residents quick access to the the peacefulness of Harbor Country.
Overall, the real estate market in the four communities around Geneva Lake have seen sales remain on par with the second quarter of 2023, with a significant increase compared to the first quarter of 2024.
Inventory levels have increased compared to both previous quarters, providing more opportunities for buyers, especially in areas with more reasonable price points. However, lakefront homes remain scarce, and their prices reflect this limited supply.
Lake Geneva has seen recent changes, including a newly elected mayor and a refocus
APRIL 1 - JUNE 30, 2024 VS. SAME PERIOD 2023
on developing the Hillmoor Golf Course project to include additional housing. Other notable projects include a new women’s center in Williams Bay and a 17-townhouse development in Fontana.
In Lake Geneva, sales in the $250,000 to $500,000 range saw the biggest uptick, while in Williams Bay, homes in the $500,000 to $1 million range proved most popular. Fontana experienced an increase in sales in the $500,000 to $750,000 range, whereas Linn saw equal demand across all price points.
APRIL 1 - JUNE 30, 2024 VS. SAME PERIOD 2023
Median Sales Price
$475,000 $640,000
64
3 8.6
67 Months Supply of Inventory Months Supply of Inventory Avg. Market Time
Median Sales Price
APRIL 1 - JUNE 30, 2024 VS. SAME PERIOD 2023
$0
4.7
26
APRIL 1 - JUNE 30, 2024 VS. SAME PERIOD 2023
$622,000 $990,000
35 Months Supply of Inventory
Market Time
13.7
The increasing prices around Geneva Lake have fueled buyer interest in both of these lakeside communities in recent years, and the second quarter of 2024 reflects this heightened demand.
Delavan saw a significant increase in sales compared to the first quarter of 2024, with growth in both lower and higher price bands compared to the second quarter of 2023. Sales in Como jumped by 75% in the $250,000
APRIL 1 - JUNE 30, 2024 VS. SAME PERIOD 2023
to $500,000 price range compared to the same quarter in 2023.
Delavan is poised to benefit from a new development called Harbor Club at Lake Lawn Resort, offering executive homes with unparalleled access to Delavan Lake. Meanwhile, Como has seen an increase in lakeshore sales due to its more affordable price points compared to properties on Geneva Lake.
SINGLE-FAMILY
APRIL 1 - JUNE 30, 2024 VS. SAME PERIOD 2023
Median Sales Price
53
Avg. Market Time
$310,000 $415,000 4.1 9.3
28 Months Supply of Inventory Months Supply of Inventory
Median Sales Price
Market Time

Natural Beauty: Boasts stunning natural beauty with its crystal-clear waters, picturesque shoreline, and surrounding scenic landscapes.
Recreational Activities: The area offers a plethora of recreational activities, including boating, fishing, swimming, hiking, biking, and golfing, providing ample opportunities for outdoor enthusiasts.
Water Sports: The expansive Geneva Lake is a haven for water sports enthusiasts, offering activities such as sailing, jet skiing, paddleboarding, and kayaking in the summer and ice boating, ice fishing and snowshoeing in the winter.
Resort Town Charm: Exudes a charming resort town atmosphere, with its quaint shops, boutiques, restaurants, and cafes lining the streets, creating a delightful ambiance.
Historic Architecture: The town showcases beautiful historic architecture, including grand mansions and estates, adding a touch of elegance and history to the area.
Events and Festivals: Hosts a variety of events and festivals throughout the year, including the Venetian Festival, Winterfest, and the Lake Geneva Restaurant Week, providing entertainment and cultural experiences for residents.
Proximity to Chicago: Close proximity to Chicago allows residents to enjoy a peaceful lakeside lifestyle while still having access to the amenities and opportunities of a major city.
Family-Friendly Environment: The area is known for its family-friendly environment, offering excellent schools, safe neighborhoods, and a range of activities and attractions suitable for all ages and known as a childhood paradise.
Shopping and Dining: Features a vibrant shopping and dining scene, with a mix of local boutiques, specialty stores, antiquing and a wide array of restaurants, ensuring residents have plenty of options to explore.
Community Spirit: Has a strong sense of community spirit, with friendly residents, community events, and a welcoming atmosphere that fosters a sense of belonging and connection among its residents. 1 2 3 4 5 6 7 8 9 10
The second quarter of 2024 demonstrates a steady resilience in sales for both communities, maintaining similar numbers when compared to the second quarter of 2023 and the first quarter of 2024.
Deer Valley officials continue to develop plans for a major project at Snow Park, which are set to include curated food and beverage as well as elevated retail experiences, in a walkable, pedestrian-friendly new ski-base.
Meanwhile, residents and visitors can enjoy a variety of summer activities, including concerts, farmers’ markets, and festivities
APRIL 1 - JUNE 30, 2024 VS. SAME PERIOD 2023
in Deer Valley, Old Town, and Park City Mountain Resort.
In Deer Valley, the most significant year-overyear change is the number of single-family homes purchased in the $5-10 million range and condominiums in the $2-3 million range.
In Old Town and Park City Mountain Retreat, sales of single-family homes remain consistent both year-over-year and compared to the last quarter. However, the condominium market has seen a substantial increase in sales in the $1-2 million range.
APRIL 1 - JUNE 30, 2024 VS. SAME PERIOD 2023
$8,000,000
Sales Price
44
$3,600,000
6 3.4
Months Supply of Inventory Avg. Market Time
$2,510,000
102 Months Supply of Inventory
APRIL 1 - JUNE 30, 2024 VS. SAME PERIOD 2023
$0
CONDO/TOWNHOUSE
APRIL 1 - JUNE 30, 2024 VS. SAME PERIOD 2023
$3,950,000
Median Sales Price
$1,210,500 25 7.6 147
73 Months Supply of Inventory Months Supply of Inventory Avg. Market Time Avg. Market Time
Median Sales Price
Expect a variety of summer events in these communities, from free concerts in the Plaza to a Farmers’ Market every Wednesday from 11 am to 5 pm.
In The Canyons, while inventory has increased as expected for this time of year, the number of sales in the single-family market has decreased. However, the condominium market has seen not only an uptick in sales compared to the same quarter in 2023 but
also a significant increase compared to the first quarter of 2024.
Thaynes Canyon’s sales have remained steady, with only a slight increase in available inventory.
In Park Meadows, despite a significant decrease in inventory levels for both singlefamily homes and condominiums, sales numbers have remained comparable.
APRIL 1 - JUNE 30, 2024 VS. SAME PERIOD 2023
CONDO/TOWNHOUSE
APRIL 1 - JUNE 30, 2024 VS. SAME PERIOD 2023
Median Sales Price
$3,600,000
Median Sales Price $5,000,000 $1,300,000 10 7.1 268
106 Months Supply of Inventory Months
APRIL 1 - JUNE 30, 2024 VS. SAME PERIOD 2023
$4,850,000
Median Sales Price
7
87 Months Supply of Inventory
Avg. Market Time
APRIL 1 - JUNE 30, 2024 VS. SAME PERIOD 2023
$2,850,000
Median Sales Price
3
CONDO/TOWNHOUSE
APRIL 1 - JUNE 30, 2024 VS. SAME PERIOD 2023
$3,600,000
2 121 35 Months Supply of Inventory Months Supply of Inventory
$2,037,500
Median Sales Price
Avg. Market Time Avg. Market Time
Inventory levels rose during the second quarter of 2024, boosting buyer opportunities in both communities.
Sun Peak and Bear Hollow experienced an uptick in condominium sales compared to both the second quarter of 2023 and the first quarter of 2024, although single-family home sales stayed on par.
Within this community, the Olympic Park is hosting exciting events this summer, from Olympic Day featuring a spectacular aerial
show to weekly performances by the Flying Aces Freestyle Team who perform every Friday and Saturday evening.
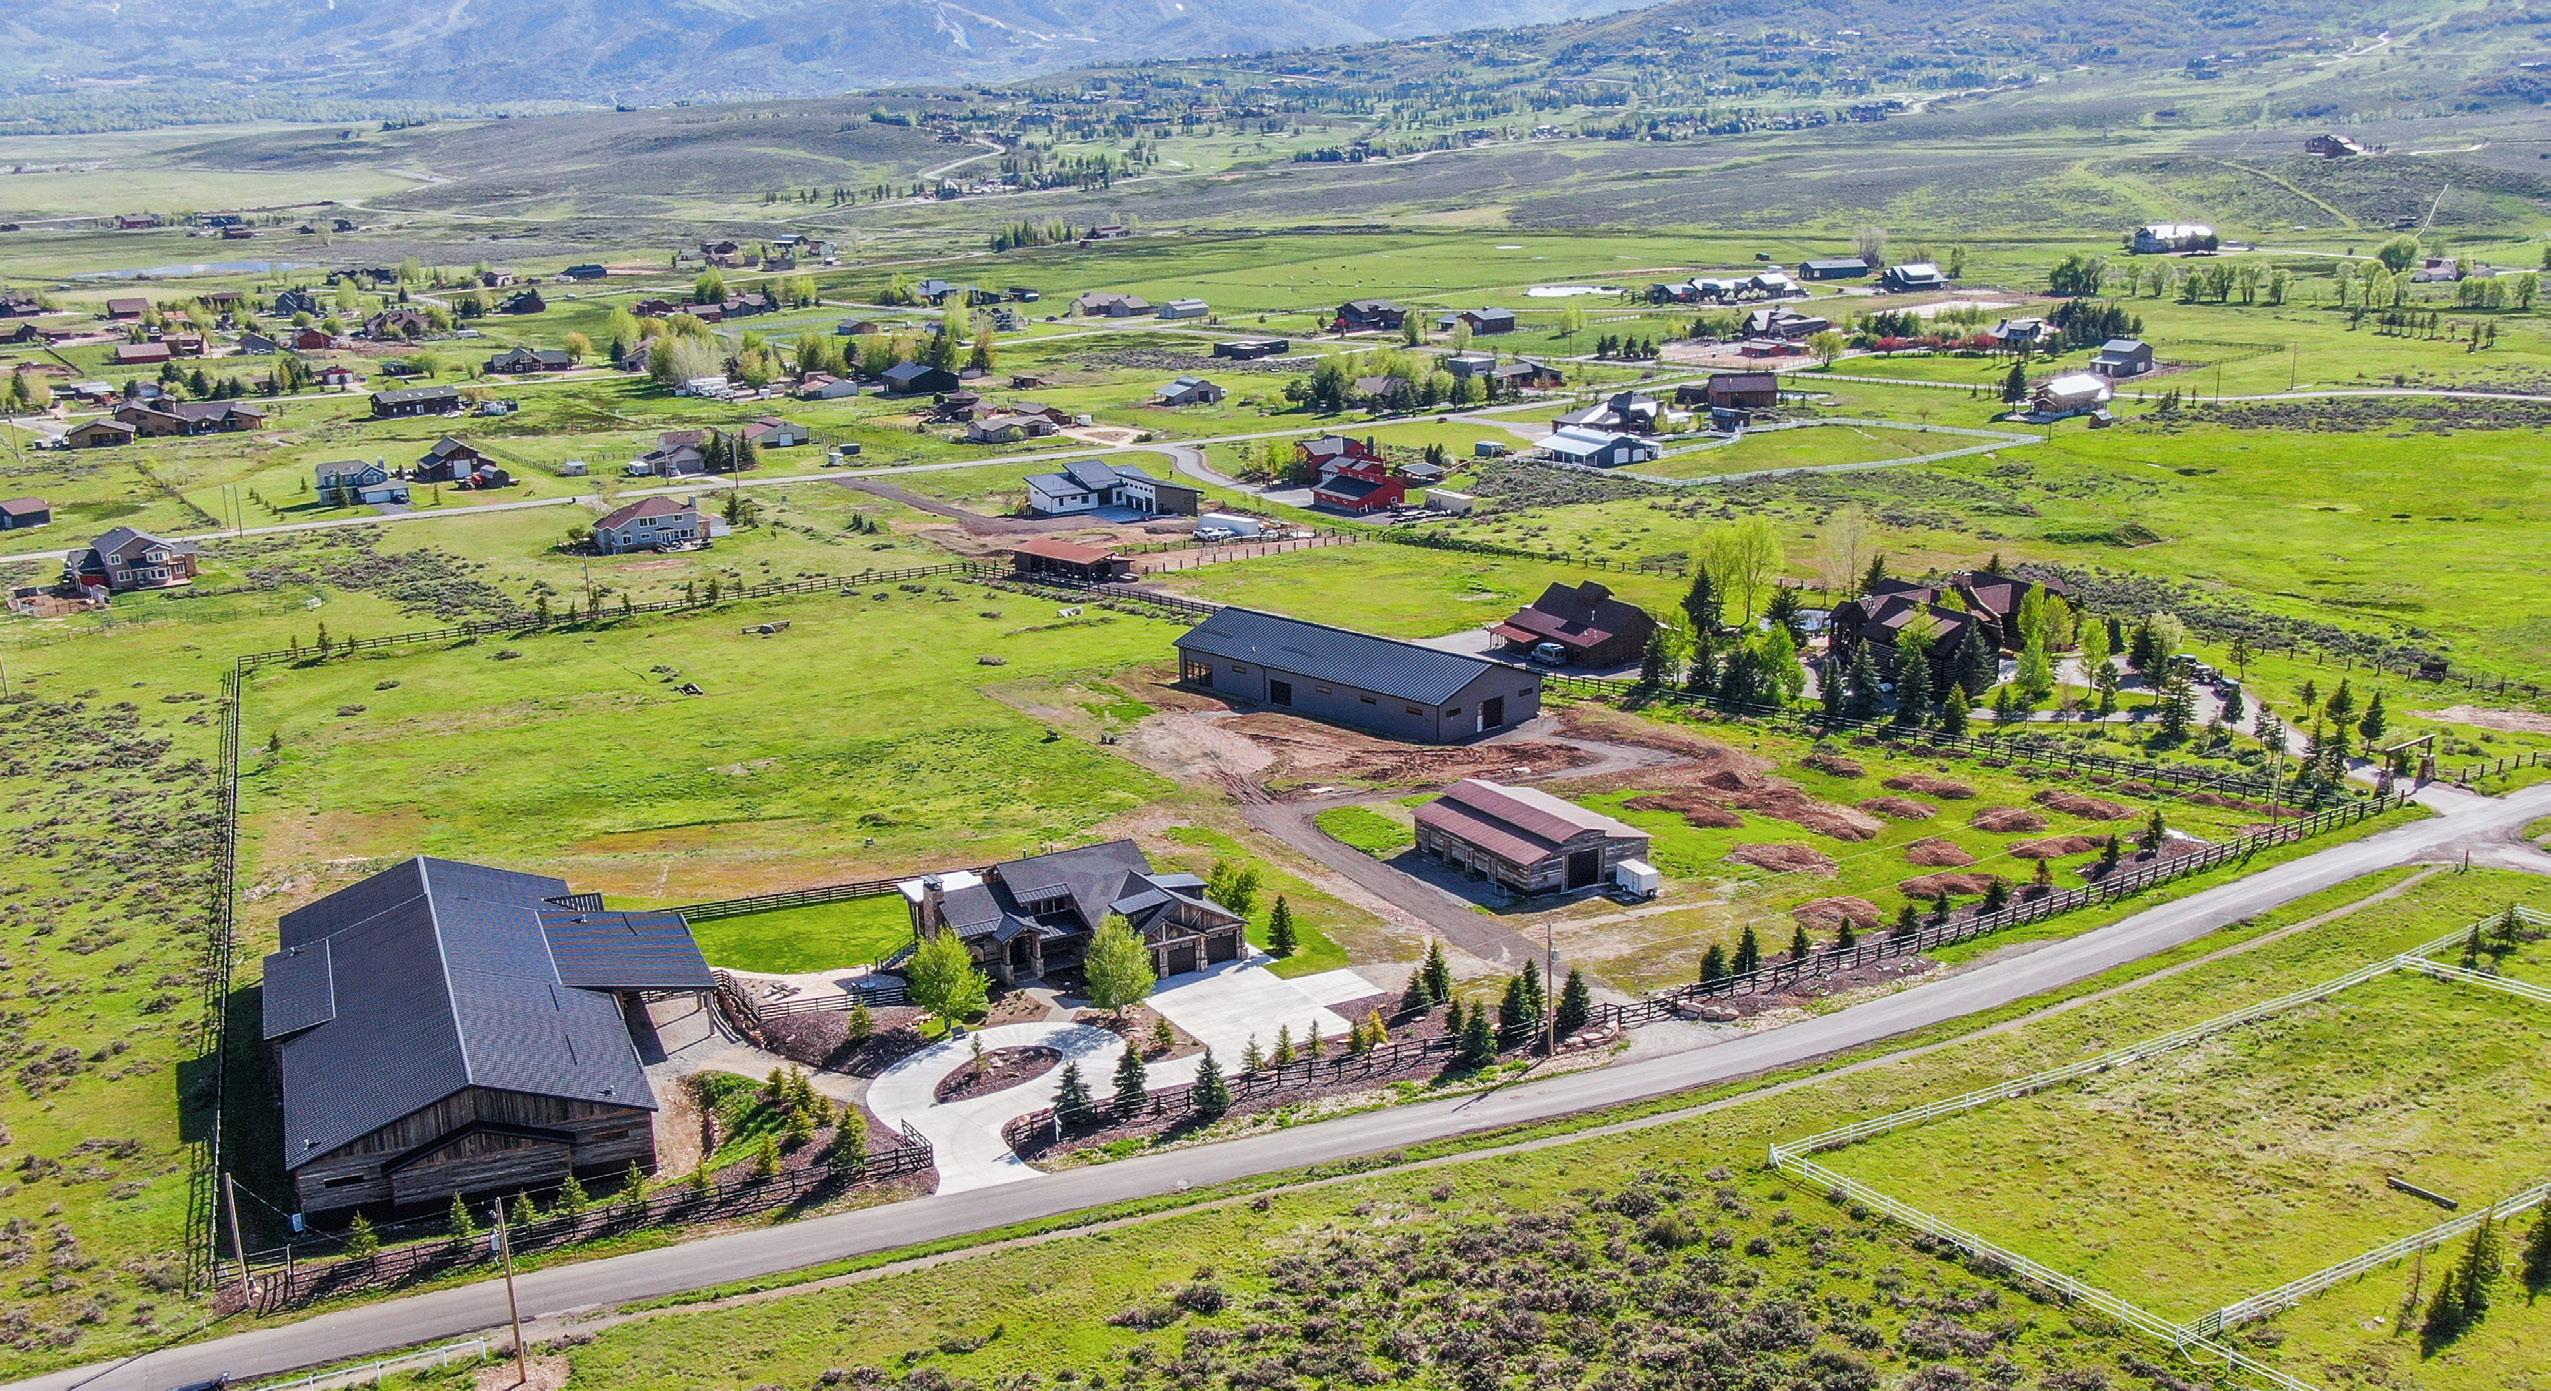
In contrast, Silver Springs, Old Ranch Road, and Kimball experienced increased demand for single-family homes, especially in the $1-2 million price range. As Silver Creek Village develops its infrastructure to offer more amenities and resources, the surrounding homes are expected to become even more popular.
APRIL 1 - JUNE 30, 2024 VS. SAME PERIOD 2023
CONDO/TOWNHOUSE
APRIL 1 - JUNE 30, 2024 VS. SAME PERIOD 2023
Median Sales Price
$3,600,000
$2,265,000 $1,100,000 9 6 9
39 Months Supply of Inventory Months Supply of Inventory Avg. Market Time
Median Sales Price
APRIL 1 - JUNE 30, 2024 VS. SAME PERIOD 2023
$1,912,500
Median Sales Price
CONDO/TOWNHOUSE
APRIL 1 - JUNE 30, 2024 VS. SAME PERIOD 2023
$3,600,000
Median Sales Price
$800,000 8.3 26 54 47 Months Supply of Inventory Months Supply of Inventory Avg. Market Time
Market Time
The second quarter of 2024 saw an uptick in sales compared to the first quarter of 2024, driven by the increasing popularity of these communities and a slight increase in available inventory.
Sales in the $1-2 million range have been particularly popular in Trailside Park and Quinns Junction, while Silver Creek Estates has seen a more even distribution of sales across all price ranges for single-family
homes. Conversely, the greatest increase in sales for condominiums and townhomes has been in the $1-2 million range.
Some of this demand is likely driven by the anticipation of the South Summit School District taking the next step in preparations for the Silver Creek Village Center development, which is expected to bring up to 750 students into the district.
APRIL 1 - JUNE 30, 2024 VS. SAME PERIOD 2023
Median Sales Price
$1,626,300 7 13 Months Supply of Inventory Avg. Market Time
APRIL 1 - JUNE 30, 2024 VS. SAME PERIOD 2023
$2,139,510
43
CONDO/TOWNHOUSE
APRIL 1 - JUNE 30, 2024 VS. SAME PERIOD 2023
$3,600,000
71 Months Supply of Inventory
3.3 125
$1,125,000
Inventory levels have increased slightly compared to the first quarter of 2024 and the second quarter of 2023, providing more opportunities for buyers in recent months.
The lack of inventory in Prospector, combined with high demand, means that properties rarely stay on the market for long.
In the communities of Jeremy Ranch, Pinebrook, and Summit Park, where demand is also high, the second quarter saw a
SINGLE-FAMILY
APRIL 1 - JUNE 30, 2024 VS. SAME PERIOD 2023
substantial increase in sales for single-family properties listed between $1-2 million, as well as growth in the $2-3 million range. In contrast, the condominium market remained steady compared to other quarters.
These communities, offering a diverse array of homes, estates, and condo/townhouse developments with quick access to the slopes and Salt Lake City, are anticipated to continue experiencing strong demand.
CONDO/TOWNHOUSE
APRIL 1 - JUNE 30, 2024 VS. SAME PERIOD 2023
$2,050,000
Sales Price Median Sales Price
$356,500
$3,600,000
5 4 185
30 Months Supply of Inventory Months Supply of Inventory Avg. Market Time
APRIL 1 - JUNE 30, 2024 VS. SAME PERIOD 2023
CONDO/TOWNHOUSE
APRIL 1 - JUNE 30, 2024 VS. SAME PERIOD 2023
$3,600,000
$1,612,500 $975,000 5.3 5.3 70 83 Months Supply of Inventory Months Supply of Inventory
Market Time
Expect some changes this summer in these communities, along with exciting festivals and events.
Heber City will welcome a new Smith’s Marketplace store, over 123,000 square feet, offering an expanded grocery selection, clothing, and other retail stores. Midway will feature weekly farmers’ markets and the popular Swiss Days event in September.
Real estate is also on the upswing, with the second quarter seeing an increased level of
CONDO/TOWNHOUSE
APRIL 1 - JUNE 30, 2024 VS. SAME PERIOD 2023 APRIL 1 - JUNE 30, 2024 VS. SAME PERIOD 2023
sales compared to the second quarter of 2023, particularly for single-family homes in the $1-3 million range.
Kamas will host its own farmers’ market on Thursdays, featuring live music. From July 20th-27th, Fiesta Days will showcase a rodeo and derby events.
Despite a slight increase in inventory, sales have remained on par with the same quarter of 2023, but have jumped considerably compared to the first quarter of 2024.
$1,032,500
Median Sales Price
$609,900 5.8
$3,600,000
73 Months Supply of Inventory Months Supply of Inventory Avg. Market Time
10 45
Median Sales Price

In June, it was announced that Military Installation Development Authority (MIDA) plans to implement more affordable housing as part of the Wasatch County project. This development is a key component of Deer Valley’s East Village resort expansion and will include 42 units of moderate-income housing and 600 units of affordable housing in Marina West, located on the east side of U.S. 40 next to the Jordanelle Reservoir.
With the supply of condo/townhouse properties in Jordanelle at less than five months and a significant increase in sales compared to both the second quarter of 2023 and the first quarter of 2024, the importance of this development for buyers is clear.
Hideout, a smaller community, also saw an increase in sales for both single-family homes and condominiums in the second quarter of 2024.
SINGLE-FAMILY
APRIL 1 - JUNE 30, 2024 VS. SAME PERIOD 2023
$4,132,024
21
CONDO/TOWNHOUSE
APRIL 1 - JUNE 30, 2024 VS. SAME PERIOD 2023
$3,600,000
77 Months Supply of Inventory Months Supply of Inventory
4.7 119
$1,175,000
Market Time
APRIL 1 - JUNE 30, 2024 VS. SAME PERIOD 2023
LAND AT GOLDEN EAGLE DEVELOPMENT
APRIL 1 - JUNE 30, 2024 VS. SAME PERIOD 2023
APRIL 1 - JUNE 30, 2024 VS. SAME PERIOD 2023
$2,425,000
Median Sales Price
8.5
Market Time
$1,412,553
$3,600,000
Median Sales Price
16 3 203 103 Months Supply of Inventory Months Supply of Inventory Months Supply of Inventory
Market Time
Over the past few years, Park City has witnessed the rise of golf communities in the surrounding areas.
Increased inventory levels for land, spec homes, and resale properties have led to a slight uptick in overall sales during the second quarter of 2024.
APRIL 1 - JUNE 30, 2024 VS. SAME PERIOD 2023
Notably, there has been a significant number of land sales across these communities, as well as an increase in sales of properties in the $2-3 million range.
$0 -
$4,425,000
Median Sales Price
22
APRIL 1 - JUNE 30, 2024 VS. SAME PERIOD 2023
Avg. Market Time
4.3
58 Months Supply of Inventory Months Supply of Inventory
APRIL 1 - JUNE 30, 2024 VS. SAME PERIOD 2023
APRIL 1 - JUNE 30, 2024 VS. SAME PERIOD 2023
APRIL 1 - JUNE 30, 2024 VS. SAME PERIOD 2023
$4,850,000 8.7 19.7 142 Months Supply of Inventory Months Supply of Inventory Avg. Market Time
APRIL 1 - JUNE 30, 2024 VS. SAME PERIOD 2023
Median Sales Price
74 Months Supply of Inventory Months Supply of Inventory
Market Time
$3,175,000 15.7 14.7
SINGLE-FAMILY
APRIL 1 - JUNE 30, 2024 VS. SAME PERIOD 2023
APRIL 1 - JUNE 30, 2024 VS. SAME PERIOD 2023
APRIL 1 - JUNE 30, 2024 VS. SAME PERIOD 2023
APRIL 1 - JUNE 30, 2024 VS. SAME PERIOD 2023
$4,250,000 7.5 6.2
Median Sales Price
$4,756,500
Median Sales Price
16
144 Months Supply of Inventory Avg. Market Time
7.7
95 Months Supply of Inventory Months Supply of Inventory Months Supply of Inventory Avg. Market Time

Natural Beauty: Nestled in the stunning Wasatch Mountains, offering breathtaking views and access to outdoor activities like hiking, skiing, and mountain biking.
World-Class Skiing: Renowned for its exceptional ski resorts, including Park City Mountain Resort and Deer Valley Resort, providing unparalleled winter sports opportunities.
Outdoor Recreation: Beyond skiing, Park City offers a plethora of outdoor activities year-round, such as hiking, mountain biking, fishing, golfing, and horseback riding.
Festivals and Events: Hosts various festivals and events throughout the year, including the Sundance Film Festival, Kimball Arts Festival, and Park City Food & Wine Classic, providing a vibrant cultural scene.
Small-Town Charm: Despite its popularity, Park City maintains a smalltown charm with a tight-knit community, friendly locals, and a welcoming atmosphere.
Quality Education: Boasts excellent schools, making it an ideal place for families seeking quality education for their children.
Proximity to Salt Lake City: A short drive away from Salt Lake City, offering access to additional amenities, international airport, and urban attractions.
Strong Economy: Economy is robust, driven by tourism, outdoor recreation, and a growing tech industry, providing ample job opportunities.
Health and Wellness: Prioritizes health and wellness, with numerous fitness centers, spas, yoga studios, and access to outdoor activities that promote an active lifestyle.
Community Engagement: Has a strong sense of community engagement, with numerous volunteer opportunities, community events, and a supportive network of residents who care about the town’s well-being. 1 2 3 4 5 6 7 8 9 10
All data included represents a review of January 2023 through June 2024. The data is sourced from the Multiple Listing Systems of each market represented in the report, ie. Chicagoland, Lake Geneva, Naples, New Buffalo and Park City.
The data is represented quarterly throughout the report, using medians, averages, totals, and percentages. The figures (in terms of inventory, solds or list prices), are based on closed sales reported before the end of the period, ie. the last day of the month. Any property closed after the quarterly analysis period was not included. Property-specific sales records were standardized, inaccurate sale prices were corrected when necessary and all duplicate records were manually excluded. As a result, statistics available via the source data providers may not correlate to this analysis.
A stand-alone house is a free-standing residential building with no common party wall. It is sometimes referred to as a detached home but is not a multi-family residential dwelling.
An condo/townhouse means that a home shares a common party wall usually on both sides of the property (including condominiums, duplexes and townhomes).
A new property that has become available within the last quarter.
Figures based on known closings recorded at the time the report is prepared and recorded in their respective quarters.
The variance by percentage between each quarter compared.
The middle price of the given dataset.
The number of months it would take for the current inventory of homes on the market to sell given the current sales pace.
The average number of days all properties were on the market prior to being sold.
312.750.9333
HINSDALE
8 E. HINSDALE AVENUE
HINSDALE, IL 60521
630.686.4886
LAKE FOREST
675 FOREST AVENUE LAKE FOREST, IL 60045
847.737.4775
BAY ROAD GLENCOE IL 60022
847.807.3660