Energy Transition Supplement
The role of data centers in a world where energy is changing

The figures don’t add up
> Why we need to measure data center energy consumption
No more easy wins
> We’ve plucked the low-hanging fruit. Now comes the hard part
Self sufficient cell towers
> Solar and wind power can get started on the mobile network
Sponsored by
INSIDE
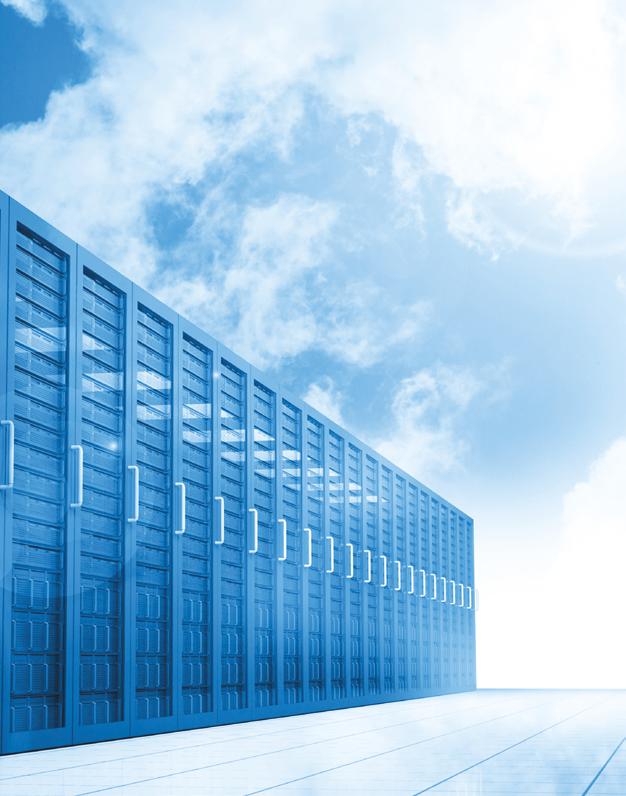
SOLVING YOUR CARBON-NEUTRAL DATA CENTER CHALLENGES Consuming 100% carbon-free energy, 100% of the time Supporting the decarbonization of your local neighbours Becoming a benefit to the electricity grid Ensuring high availability Wherever you need us, let’s reach your decarbonization objectives together 1. By 2030 : our target is to reach 80 GW of renewable capacity 2. By 2025 : with an aim to push this to 31 GW of low carbon distributed energy infrastructures 3. By 2030 : our target is to get 4 GW of green hydrogen capacity 34.4 GW1 of renewable energy capacity 1.4 GW of Corporate Power Purchase Agreements delivered to the data center industry 23 GW2 of low carbon distributed energy infrastructures 4 GW3 of green hydrogen capacity Target 2030 ENGIE SA au capital de 2 435 285 011 € RCS Nanterre 542 107 651 Crédit photo : AdobeStock For further information www.engie.com/en/campaign/green-data-centers> 17 Accredited Tier Designer
Sponsored by
Contents
Change is coming
Thecurrent energy crisis in Europe is an acceleration of the underlying trends.
With Russia's invasion of Ukraine putting prices up, nations are rushing to reduce their dependence on gas.
But the need to get off fossil fuels was already there, and already at crisis point. There are clear signs of global heating around us, with climate breakdown causing floods and fires.
This should not make us feel powerless, because it simply points up the urgency of decarbonization.
This supplement looks at three pieces of the puzzle from the viewpoint of the tech industry.
Making it add up
The data center sector is, by and large, eager to stand up and be counted in the fight against climate change.
But the tricky point is in the counting (p4).
How much carbon is the sector responsible for? And how much will it produce in future?
It has been close to impossible to predict data center energy demands reliably - and that has consequences.

Planners can't approve the right number of data centers, and communities can see their energy budgets shattered by super-fast developments.
If data centers are going to join the whole of society in moving to a carbon-free future, then there must be clear and open data on emissions.
That's not necessarily comfortable to hear, but it's vital.
Don't expect an easy ride
Our industry has been complacent for the last few years, for understandable reasons.
The 2010s began with predictions of an uncontrollable growth in energy used in data centers. But at the midpoint of the decade, new data showed that energy use had plateaued (p10).
Technology had come to the rescue, with cloud efficiencies canceling out growth in demand.
The turnaround was revealed in research from Lawrence Berkeley National Laboratories, led by Dr. Arman Shehabi.
We talked to Shehabi and the news isn't great. There are signs that these efficiency gains may be reaching their limits.
Moore's Law is reaching its end, and cloud efficiency can only be applied once.
Any future efficiencies will have to come from somewhere else.
Cell towers leading the way?
In the tech sector, there's plenty of talk about using renewable sources directly, putting facilities on a microgrid and taking responsibility for our own emissons.
That's not feasible for a 10MW data center, but the idea can get started on a small scale in cell towers.

With power demands as little as 4kW, cell towers are often located in inaccessible locations, so going off grid has multiple benefits.
There are still hurdles to overcome of course, including storing enough energy to cover the hours when there's no solar energy.
But there's plenty of operators ready to find the way.
4 Energy Transition Supplement | 3
10 4. The trouble with data center energy figures Why we need better numbers to forecast energy use - and how we can get them 10. Don't look to the past for tomorrow's efficiencies We've made vast improvements, but it can't go on forever 13. Self sufficient cell towers Remote cellular network equipment could be the earliest to transitition 13 Energy Transition
This winter, everyone will be monitoring their energy consumption, as prices soar.
Data centers will wonder if they can still turn a profit when electricity prices go up, and at least one data center firm has already closed, blaming the energy crisis.
But what about the bigger question? What impact does the entire data center sector have on world energy consumption? It’s an important question for policymakers - but it seems the answers we have are not reliable.
Most data center professionals will shrug, and say facilities use “about two percent of the world’s electricity.” They’ll say the figure came from a newspaper article, an analyst firm, or from their own marketing department’s slide deck. They may also say they have heard data center energy use is plateauing, thanks to virtualization and the cloud.

Others will give a higher figure, saying that data centers use seven percent of electricity or more in some counties, and are on track to use 51 percent of the world’s electricity by 2030 Ask them where the figure came from, and they will quote a different set of newspaper pieces, analysts and marketing literature.
That’s not a good basis for discussion, says entrepreneur and academic David Mytton, who has tracked these estimates to their sources, to see where the discrepancies come from.
It’s important work, because bad data can lead to poor decisions.
Bad data, bad actions
“This large variance… serves to confuse the general public who want to help tackle environmental issues,” says Mytton, and colleague Masao Ashtine, in a paper for the scientific journal Joule Review. It can lead to misguided efforts to save energy, for instance by deleting old social media photos.
More importantly, the unreliable figures mean data center operators don’t treat the issue with the right seriousness, energy grids can’t plan for their demands, it’s impossible to get a true picture of data centers’ role in global warming, and we see a series of heated but inconclusive arguments.
“Unexpected demand places stress on electricity transmission and local distribution capacity, which has a long lead time for upgrades and can have knock-on effects on other users of the electricity grid,” says Mytton.
Three boroughs In West London have approved new data centers which are using
The trouble with data center energy figures
Peter Judge Global Editor

electricity equivalent to tens of thousands of homes. As a result, new housing developments can’t get connections.
In Ireland, power demands increased 144 percent in five years (from 1.2TWh in 2015 to 3.0 TWh in 2020). Data centers are projected to use 27 percent of all Irish electricity demand by 2029, and several operators have delayed or canceled data center projects in the country.
Amsterdam paused data center construction in 2010 because of concern over the sector’s energy and land demands.
Meanwhile, 15 percent of Danish electricity will be used by data centers by 2030 according to projects.
In all these cases, better predictions might have avoided headline-grabbing pauses or cancellations.
When electricity is put in the context of total energy use, things get complex. The majority of electricity is still generated from fossil fuels, so data centers’ electricity use contributes maybe two or three percent of global CO2 emissions (a figure based on guesswork).
Even if data centers can opt for green energy, it may not help. Countries have a
limited amount of electricity from renewable sources - if data centers use that, there’s less available for heating and transport, which are sectors that urgently need to decarbonize.
Bad data makes this a minefield for any policy makers, leaving them at the mercy of special pleading.
The data center industry can rightly claim that digitization can be a help in decarbonization. For instance, if Zoom meetings replace business travel - but others will say that no sector should get a free pass for unlimited increases in energy use.
Without accurate data, lawmakers cannot balance these two arguments.
“The lack of accurate information about data center energy consumption and how that will grow is already having an impact,” warn Mytton and Ashtine.
Reliable figures
For their analysis, Mytton and Ashtine gathered up the reports on data center energy use published in the last 16 years, a period dating from the launch of Amazon Web Services which kicked off the era of the cloud in 2006.
They want to help the industry produce
4 DCD Supplement • datacenterdynamics.com
Here’s how to get reliable energy dataand why we badly need it
Energy Transition Supplement
better figures on energy use: “We do not aim to criticize individual publications or suggest that a particular estimate is more accurate than another. Our goal is the broad analysis of common methodological problems within this research field so that future readers can have more confidence in the reliability of estimates.”
Any report is only as good as its data: “We focus on source provenance and data inputs because they are the foundational component that determines scientific reliability.”
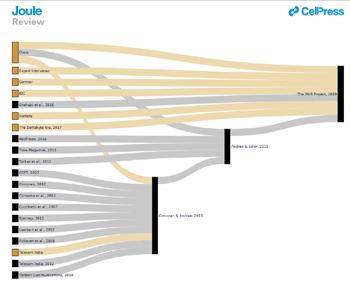
The Mytton and Ashtine track citations back from one paper to previous ones, using “Sankey diagrams.” Many of them refer back to the first major data center energy report, commissioned by the United States Congress and produced in 2007, by researchers at Lawrence Berkeley National Labs (LBNL) including Jon Koomey, Arman Shehabi, and others.
The pair checked any publication in English which attempted to calculate the energy consumption of data centers, either globally or within a region such as the US or Europe.
They came up with a list of 46 publications. This might seem surprisingly a surprisingly small output from 16 years of research on such a hot topic, but there’s a reason for this. Many publications simply quote or refer to others.
Following these links back, Mytton and Ashtine found 676 individual “data provenance traces” or original sources of data. Many of these are no longer available, either because links are broken (so called “link rot”), or there is no trace of the original document. Some were commercial information only seen by the original researcher, and some give no methodology for how they were arrived at.
The problem with missing data is that information may have been available on publication, but is not now: “Web links are not permanent and the web pages used as references are no longer available (a particular problem when Cisco is cited). The problem is compounded by how there are few available sources of market data, which are generally only available from private/ commercial reports or databases.”
The reports are often based on secondary data. For instance, the amount of energy used by servers in a given year is often estimated by taking the number of servers that have been shipped, using that to estimate the number which were in use in that year, and from that, the likely amount of energy those servers used.
Some sources got quoted more than others. For instance, despite the difficulty of seeing their data firsthand, analyst firm IDC
Fig 1 : Global data center energy estimates for 2010, 2020, and 2030 in TWh. There is a wide range of estimates, which expands as forecasters look further into the future. The whiskers indicate the minimum and maximum values. Five estimates between 2,000 TWh and 8,253 were omitted to allow for scaling. (Mytton and Ashtine)
and Cisco were quoted in 43 percent and 30 percent of the publications, respectively. The actual dependence on these figures is higher, because some papers cite earlier ones that rely on Cisco or IDC data without explicitly referencing it.
And there are questions over reliability, as only a third of sources were from peerreviewed publications. A further 38 percent were simply from “Reports” which could mean industry publications or self-published articles. Some data points made it into published papers despite having no year of publication.
The papers handled data in different ways - some citing carbon emissions, others direct energy use. To make comparison possible, all were converted to the same units - teraWatt hours (TWh) per year.
Estimation and extrapolation

It’s worth emphasizing that all these quoted energy use figures are estimates. There is no single energy authority, classifying and adding all the energy consumers in the world, or even within individual regions.
The reports use different methods to bring together their sources and calculate an estimate of data center energy use, then use other data points and assumptions to extrapolate that to give a likely figure for future energy use.
They also take such different approaches, that comparing them can be a nightmare, says Mytton: “Koomey excludes storage and networking components, Somavat et al take the US total from Brown et al, then double it on the assumption that the United States represents half the global total, Andrae and Edler exclude internal data center networks, instead counting them as part of global networking as a whole, and Masanet et al exclude Bitcoin whereas Montevecchi et al include it.”
To take all this and produce figures, there are essentially three approaches: bottom-up, top-down, and extrapolation
Bottom-up modeling will combine figures such as the specified power draw of servers, combine that with estimates of the installed base and multiply that by the average power
usage effectiveness (PUE) of data centers to get a figure for how much energy is used in the facility.
That’s fine, but published figures may not give the whole picture. For instance, some reports base energy usage on SPECpower benchmark data, but this can be skewed. A report from Van Heddeghem and colleagues found that the SPECpower database is biased toward more energy-efficient servers, while less efficient volume servers are the largest group by power consumption.
The problem gets worse when the model has to project energy use forwards based on today’s figures and observed trends. This is tricky, because equipment can change, becoming more efficient, or else more power-hungry systems start to come through because of a shift to more demanding tasks.
“The further out, the wider the range of estimates due to the difficulty of accounting for energy efficiency improvements and changing trends in equipment,” says Mytton.
The 2007 LBNL paper provides a sterling example of the dangers of extrapolation. The study found that data center energy use in the US had grown by 90 percent between 2000 and 2005, and warned that this would be unsustainable in the long term.
Then in 2011, a follow-up report from Jon Koomey in 2011 noted that growth in the US had actually slowed. After that, a 2016 LBNL report saw energy use actually plateauing.
The reason for this was that cloud applications had grown rapidly, but were delivered more efficiently than the same services provided within the in-house data centers which the cloud was beginning to replace.
Future changes
But what’s happened since 2016? It’s possible that the efficiencies provided by the cloud may be reaching their limits, or that the hyperscale data centers providing them may be driving a large expansion in consumer services (see page 10).
In 2007, the LBNL report discounted hyperscale data centers, regarding them as insignificant. That report’s 2016 sequel led
Energy Transition Supplement | 5
Energy figures
by Arman Shehabi reckoned that hyperscale capacity would make up more than 40 percent of the entire 2020 server installed base.
It seems that there are many more hyperscale data centers in the US (about 400 of the world's fleet of 700). “This US focus has been suggested as a reason why data center energy consumption continues to rise in regions outside of the United States, because the United States has benefited from the improved efficiencies of these facilities,” says Mytton.
Cryptocurrency is another big unknown that energy estimates have trouble digesting. It emerged entirely during the period since 2006, as the initial Bitcoin whitepaper was published in 2008, and now energy use by cryptocurrencies is hotly debated, and reckoned to be as large as a small country.
In July this year, Digiconomist estimated 132.05 TWh per year of Bitcoin energy consumption (roughly the electricity consumption of Sweden). Other estimates put the figure as low as 80 TWh (the electricity consumption of Belgium). While there are other blockchain applications, it’s reckoned that Bitcoin makes up two thirds of the total cryptocurrency energy demand.
It’s worth pointing out that this unknown figure is not just “noise.” These figures are hugely significant compared to the estimates of the world’s total data center energy. They are more than half the size of the lower scenarios in most of the papers.
Data center energy researchers may
However, these studies are very rare, because of the difficulty of getting hold of that kind of data: Mytton and Ashtine only found one top-down study, by Jens Malmodin, which is highly regarded, but only covered Sweden.
There are small signs this may be changing. In January 2022 the Irish Central Statistics Office released data center electricity consumption figures based on actual meter readings collected by the Electricity Supply Board (ESB Networks). It’s going to be updated annually, so future policy in one of the most controversial data center markets could be based on good data.
However, top-down models don’t have any magic to make them better at predicting future trends.
Fig 2
Sankey diagram showing the flow of citations between papers. Missing sources, indicated in orange, are assumed to have existed at the time of publication but are now unavailable or insufficiently referenced (Mytton and Ashtine
have trouble getting real data out of the cryptocurrency market, but they ignore it at their peril.
Even new technologies in data centers are difficult to predict. Liquid cooling might replace the energy-hungry airconditioning units used in data centers today, but Mytton warns: “there is a general expectation that direct liquid cooling of data center equipment will become more widely deployed within the next seven years, but few operators currently have high-density racks that would justify it.”
Top-down modeling might be more reliable on current statistics, because it is based on “actual data” in the form of regional totals provided by government statistics.
Extrapolation models take a baseline from one of the other models, and then assume there’s a correlation between demand and consumption to apply a growth factor.
“Most extrapolation calculations are based on energy intensity per unit of data transmitted, with assumptions about energy efficiency improvements for future projections,” says Mytton.
This can produce differences. For instance, when Anders Andrae and Peter Corcoran took Koomey’s bottom-up estimates, they applied a bigger growth rate, because new consumer cloud services will boost growth and increase energy demand, even if the services are more efficient.
Papers by Andrae tend to calculate the average energy used per CPU instruction, and then extrapolate the number of CPU instructions the world will use in a given year.
How much energy?
Given this diversity of data, it’s not surprising that Mytton and Ashtine don’t present a solid figure for data center energy use. In any case, that wasn’t their aim.
In total, the paper finds 258 estimates of
Fig 3: US data center energy use, published in 2016. Future growth was projected in various scenarios, with assumptions including a major shift to hyperscale, applications of best practices, and improved management. Another line shows how energy use would have grown if 2010 efficiency levels continued

6 DCD Supplement • datacenterdynamics.com
Energy Transition Supplement
data center energy consumption, including 179 for the whole world. 24 for the USA and 19 for Europe. Those “Europe” figures cover another level of diversity, as they cover a variety of groupings depending on whether EU, EEA, or other countries are included. There are also single country estimates for Germany, Sweden, and China.
Taking the global estimates, there’s good agreement for how much energy data centers used back in 2010, but estimates diverge in 2020 and, by 2030, they are miles apart.
“The further into the future, the wider the ranges,” says the paper. “This is to be expected given that past estimates can be calculated from actual data, whereas future estimates must make assumptions about key parameters such as energy efficiency and server shipments.”
Mytton and Ashtine report an order of magnitude difference between the smallest and largest predictions for total data center energy use in 2030 - from 146TWh to 1929 TWh per year.
The actual figure is even higher, because they excluded five outlying estimates that predicted data center energy would leap to as much as 8,253 TWh per year.
Most of these variations are due to the impossibility of predicting technology changes. “On one hand, proof-of-work blockchain mining requires a significant amount of energy, but on the other hand, many IT workloads have moved from inefficient enterprise data centers to more efficient hyperscale cloud systems,” says Mytton. “The smartphone has become an important computing device with more energy-efficient processors compared with desktop computers, but questions remain about the power profile of new 5G cellular networks.”
Shift happens
The big problem with predictions is that extrapolation will increase and expand existing weaknesses in the data. “This snowballed bias is a problem where publications rely on earlier estimates without critically assessing their assumptions and sources,” warns Mytton.
For instance, he’s quite critical of work by Anders Andrae, an analyst employed by Huawei, who published three projection papers in 2019, which are based on an assumption that energy use would be correlated with network traffic. This was adopted by French think tank, The Shift Project, in its paper Lean ICT - Towards Digital Sobriety
“Despite the unavailability of most of the sources supporting the estimates published by The Shift Project, this report has been
Box: How to read (and create) figures
Mytton recommends that end users (and journalists) looking at data center energy reports ask three questions:
1. How old is the publication, and how up-to-date are the key sources?
2. What is the basis for the estimates? Are they based on bottom up or top-down data, and what assumptions are made in any extrapolations?
3. Are the sources and the calculations available to examine?
For researchers, Mytton makes a request: share your data. “Open data sharing is the core of good scientific practice,” he says. There is a set of “FAIR” principles for scientific data, which include making sure the data provenance is good and it can be checked and reused by others.
They should also state their boundaries and assumptions clearly - so a US estimate isn’t confused with a global one, for instance, and it is clear which parts of the data center universe are included in a figure.
Ideally, the models used should be open and clearly described, so others can run the same calculations. Like readers, researchers should assess all data sources critically.
And we can’t rely on end users to check the data, say Mytton and Ashtine: “The key takeaway of our review is that the onus is on us, researchers in the scientific community, to ensure that critical points and procedures of data provenance are transparently demonstrated within publications and research.”
cited by a large number of mainstream media outlets,” say Mytton and Ashtine.
That assumption, that there was a direct link between network traffic and energy consumption, was recycled unexamined in research since 2013 but was refuted by Jens Malmodin and Dag Lunden in at least two papers.
In particular, there’s direct evidence from the last couple of years. There was a shift to home working during the pandemic which increased network traffic, and an increase in energy use wasn’t reported.
It’s worth mentioning that although the Shift Project report gets regularly quoted, it stands out in Mytton’s Sankey diagrams, for quite the wrong reason. All but two of its major sources are no longer available.
What we need now
We need to have better data to base future strategies on - and this means that the private companies who run the cloud and data centers need to be more transparent, Mytton acknowledges that Google and Microsoft have led the way, with both publishing top-level statistics about their energy consumption, renewable energy purchases and PUE figures.
“Other major data center owners are not as transparent,” says Mytton. “Amazon only reports a single number for carbon emissions that aggregates all their operations and so makes it difficult to break out data centers from e-commerce logistics.”
All three of the largest hyperscale cloud providers give their customers a calculator to show the carbon footprint of their cloud workloads.
“This transparency is important because migrating IT workloads to the cloud outsources the operational emissions of running that infrastructure to the cloud provider,” says Mytton. It’s also good marketing of course, as the cloud resources will usually be less energy-hungry than the equivalent resources running in-house.
Colocation providers and data center operators like Digital Realty and Equinix also provide some figures, but research from Uptime Institute suggests that data center owners are far more likely to report their energy efficiency (which has an impact on costs) than carbon emissions and environmental footprints.
Actual energy figures for cryptocurrency are vital for governments who want to make energy available for regular use. “Simple bans on cryptocurrency mining activities have been shown to cause displacement to more carbon-intensive regions,” warns Mytton.
Fundamentally, data centers can be built (and are being built) quicker than power capacity. This leads to the (literal) power struggles in Amsterdam, London, Ireland, and elsewhere.
Better predictions could lead to better planning, and maybe avoid negative consequences.
“The solution to cap demand introduced by Amsterdam is able to provide certainty so that the grid operator can deliver appropriate infrastructure upgrades, but it also places constraints on the ability for IT providers to grow their services within the region,” says Mytton.
“When demand outpaces supply, prices will inevitably rise, potentially having an impact on the ability of people in lower income brackets to benefit from access to digital services.”
Energy Transition Supplement | 7
Energy figures
Microgrids and Data Centers: A Converging Partnership
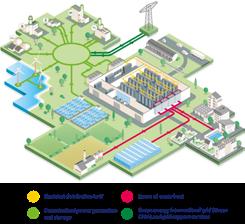
A s the climate crisis rages on, there is an urgent need to achieve truly sustainable data centers. But what does it actually mean to be green?
A data center cannot be truly green if it is not consuming 24/7 carbon free energy (CFE). This can be achieved through a combination of grid supplied power (such as corporate power purchase agreements), renewable onsite
incorporating interconnected loads and decentralized low Carbon energy resources (e.g. generators/turbines, renewables, energy storage systems).
Community support is also a key role of the green data center, achieved by integrating its electrical and thermal generation assets into the local energy ecosystem. Although historically, ‘green’ wasn’t exactly a word synonymous with the data center, in recent years they have become increasingly useful drivers when it comes to the decarbonization of assets of neighboring communities via waste heat export delivered directly to buildings and industries, … or through innovative district cooling and heating projects.
In the same vein, the connection between the microgrid power distribution system and the main power grid will, in certain countries, enable data centers to provide grid services such as capacity and frequency regulation services.
Securing resiliency and economics
The traditional design for data center energy supply architecture, combining a connection to the grid and the implementation of backup systems, has established a high level of confidence in their capability to overcome nearly all grid anomalies or failures. However, this approach does not take into consideration the previously discussed requirement of either carbon emissions reductions, or enabling future technologies integration into green Data Centers.
With the new energy approach that is proposed, the microgrid is designed with the usual high availability requirements in order to be compliant with Tier requirements.
generation (solar panels, wind turbines, …) and renewable energy backup, as well as thermal and/or electrical energy storage.
To reach this objective, we need to abandon the classic scenario of connecting data centers to national electricity and water networks, and to be looking more towards microgrids. A microgrid is a resilient local energy grid, able to operate in grid-connected mode or in island mode,
For each of the power systems forming part of the microgridwhatever type of network - the gensets, UPS, Battery Energy Storage System (BESS) or the renewable generation assets are defined as energy sources for the IT load. At a given time, each are able to sustain this IT load for a given duration, from a few minutes for the UPS / BESS, to a few hours / days for the gensets depending on the fuel storage capacity and from a few to many hours for the BESS combined with any of the renewable energy sources available based on intermittency of supply.
8 DCD Supplement • datacenterdynamics.com
The N+K microgrid, an effective alternative to the traditional N+1 or 2N resiliency
Energy Transition Supplement
Depending on the time of day when an outage occurs, a combination of these energy systems will be brought on line to ensure the continuity of energy supply to the data center. As for any backup system in a traditional Data Center, we have to admit that the different equipment of the microgrid may encounter technical issues. In a traditional Data center, we use a terminology stating that “N” is the number of items of equipment required to satisfy the load. In order to satisfy the high availability constraints, more equipment is installed in order to manage these potential equipment failures (N+1, 2N, …).
When it comes to a microgrid, we can look at another scenario known as “N+k”, where k represents the additional power systems capable to satisfy the load. In other words, these k additional items of equipment will not (only) be the gensets but also all the other assets forming part of the microgrid, such as photovoltaic panels, hydrogen-based systems, energy storage, etc…. The main added value is to merge what we previously called main supply and back-up supply in a traditional Data Center, into one unique system capable to optimize value as much as possible in the production of energy while ensuring High Availability.
To illustrate this concept of microgrid High Availability, we show below a case study analysis for a theoretical 10 MW IT Data Center supplied by:
• 2 gensets of 10 MW each
• 2 blocks of PV panels, 11 MW capacity per block
• 2 blocks of BESS, 10 MW capacity per block
The first graph below illustrates the percentage of time where the different technologies are contributing to the Data Center power load, therefore enabling a specific N+k availability.
different technologies form part of a specific N+k availability (represented by the bars on the chart with one color per technology type). The green line, measured on the right vertical axis, measures the percentage of time where at least N+k assets are available. In this example, six assets are all available for 45% of the time, and at last four are available for almost 95% of the time
ENGIE’s and RED’s key figures/missions
ENGIE and RED Engineering
– a company of ENGIE - Dare committed to accelerating the transition towards a carbon-neutral world with integrated low-carbon and high-performance solutions that enable a reliable, sustainable, agile and energy-efficient data center. We bring unrivalled sector expertise to the Design, Build, Operation and Maintenance of energy infrastructures. Combined with green energy supply capabilities, we support the data center industry in achieving its objective of 24/7 carbon-neutrality.
to supply energy to the data center (due to the PV capacity factor of around 30%).
This second graph illustrates the period of autonomy of the whole energy system when there is a network outage combined with power supply asset failures.
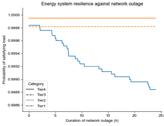
The horizontal axis represents the duration of the network outage (in hours). The vertical axis shows the probability that the local Microgrid satisfies the energy needs of the Data Center. The graph has been generated using a generic example for 100 million scenarios with different combinations of asset failures and network outages. Asset failure scenarios are based on the Mean Time to Repair and Mean Time Between Failures. The probability of satisfying the load of the Data Center takes into account the energy demand hourly profile, energy production hourly profile per asset, a random simulation of grid outage events of 24 hours over the year and several scenarios of asset failures.
Merging the functions of main supply and back-up supply of a Data Center into a microgrid based on renewable energy sources enables Data Centers to achieve their sustainability objectives, to increase their resiliency against external events (such as grid outage and equipment failure), while generating additional revenues by providing new services to the grid (supply of renewable energy in case of on-site production surplus, capacity and frequency regulation services, …) and by valuing the waste heat to local communities. But this is another story which will be developed in future editorials.
ENGIE
34.4 GW of renewable capacity, with the goal to reach 80 GW by 2030
4 GW of green H2 capacity by 2030
1.4 GW of cPPA delivered to the data center industry

€190 million dedicated to Research & Innovation
900 researchers, 22 thematic expertise labs; dedicated research program on green data centres
RED Engineering
17 Accredited Tier Designers worldwide
Over 800 commissions completed
Projects delivered from 300kW to > 480MW IT load
24 Uptime Institute Certifications across 16 data centres
In 2020 alone Red master-planned > 5 GW IT load on different sites.
The horizontal axis shows the total number of power supply assets available. The left vertical axis measures the percentage of time when the
Such High Availability Green Energy Systems are now a reality and ENGIE is committed to develop these solutions in order to co-construct a greener future with Data Center companies

Energy Transition Supplement | 9
ENGIE | Advertorial
Don't look to the past for tomorrow’s data center efficiencies
Vast improvements in data center power use are to be celebrated, but not expected

"There's going to need to be other ways of having orders of magnitude efficiency increases to balance the orders of magnitude increases in services that we can expect from the industry"

10 DCD Supplement • datacenterdynamics.com
Sebastian Moss Editor-in-Chief
Energy Transition Supplement
Source: Sebastian Moss
The history of the data center industry is one of unprecedented growth. As the world grew connected, facilities sprouted up around the world to serve both people and enterprises.
Every day brings the news of a major new facility, with higher and higher power envelopes, filled with beefier chips. And, despite all this, the industry has been able to avoid significant energy jumps - a testament to tremendous innovation and a shift in how the sector operates.
But can the good times last?
In 2020, Northwestern University, Lawrence Berkeley National Laboratory (LBNL), and Koomey Analytics published a groundbreaking study into the global energy use of data centers.
They found that, between 2010 and 2018, compute jumped a whopping 550 percent. Internet protocol (IP) traffic increased more than 10-fold, and data center storage capacity increased by an estimated factor of 25.
In that same timeframe, energy use grew just six percent to 203TWh.
This startling disparity is worth notingin times of increasing grid uncertainty, and with data centers already under focus for their impact on carbon emissions, it's hard to imagine how the sector would be treated it if had grown linearly with compute.
Flawed metrics and analysis have long oversimplified the connection between data center demand and power, for years predicting ballooning energy usage that would overwhelm the grid (see page 4). "A quick way of trying to predict data center

look to the past
power use is to take that electricity use and scale it with some other values, so you could be scaling it with the number of people that are watching online videos, or with the population increase or with the general size of the of the market from a financial point of view," the paper's co-author Dr. Arman Shehabi, of LBNL, told DCD.
"And you would start finding strange extrapolations there because there are multiple variables that are really changing every year, like you have more servers going in, but how those servers are being used is changing. So many different parts are becoming more efficient, or the storage is becoming more efficient, the processors are changing, the cooling systems that are used in data centers have changed over time.”
All this has to be included, he said: “What's the stored capacity of storage? How much is IP traffic increasing? How many workloads are we seeing? All of these things have to be taken into account."
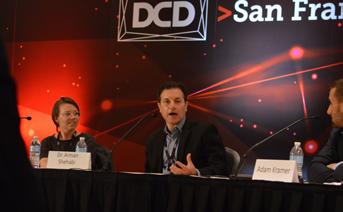
He explained that some approaches look at how much data was used for streaming video in the early years of the century, and how much power it required, and then try to scale it to today's streaming demand. "But did the energy usage increase accordingly? Of course not," he said.
What happened was a remarkable feat of engineering. On the semiconductor level, processor designers like Intel and AMD eked out more and more efficiencies from processors as they followed Moore's Law. New data centers were created and then followed best practices on cooling and design. Old facilities were slowly phased out in favor of advanced data centers built by hyperscalers. The cloud also meant that server utilization has skyrocketed, leaving fewer servers idling, and needlessly drawing power.
"Back in 2005, I visited a data center at LBNL," Shehabi recalled. "There were racks of servers in there, and then these different computer room air conditioners that were just on the floor, just randomly placed in different locations. There were all these different places where the hot air was mixing with the cold air, and these desk fans in different locations blowing the air around. It was just grossly inefficient. It is like building a refrigerator and not putting the door on.
"So once you figure out 'let's put the door on,' your efficiency is going to jump so much from that."
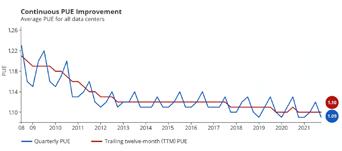
In his efforts to track energy use at the time, he found data centers and server rooms the cooling used twice as much power as the IT. That equates to an enormous power usage effectiveness (PUE) of 3.0 - a figure which has fallen substantially, to a point where
Retail Edge Supplement | 11
Don't
hyperscalers like Google claim a PUE of just 1.10.
A colleague, Jonathan Koomey, also studied the prevalence of 'zombie servers,' that is servers that were left operating despite serving no purpose. He found a massive 10 percent of the world's servers could be classed as zombie servers, simply frittering away power because no one switched them off. "So that was another big opportunity for efficiency increases," he said. Harder to track were servers that did have a use, but at a low utilization rate - meaning most of the compute was not used - but that number has also improved with the growth of cloud.
This is all something that should be celebrated. Without the combined effort of hundreds of thousands of data center, IT, and semiconductor workers, the sector would have been unable to support its growth as the grid simply would not have been able to meet the needs of the digital world.
But, as is always the curse of early success, maintaining the pace is not guaranteed. "I think going into the future, it's going to be harder, because those obvious low-hanging fruit opportunities aren't really there," Shehabi said. "And there's going to need to be other ways of having orders of magnitude efficiency increases to balance the orders of magnitude increases in services that we can expect from the industry."
There is no sign of the pace of data center build-outs slowing, particularly since the pandemic entrenched the need for hyperconnected workers. Maintaining that growth without power usage spiralling out of control will be one of the great challenges of our time.
At the chip level, there is already cause for concern. Semiconductors are simply not advancing as fast as they used to: The death of Moore's Law is now a given, but its demise came as a long drawn-out whimper, not a sudden bang. Transistor density improvements began to slow as early as
cities, or micro data centers that could be as small as a half-rack. This will mean a loss of that scale, but Edge vendors argue that they will reduce the power needed to shuttle data back and forth. The story of the Edge is still in its infancy, so it is too early to say which will outweigh the other.
Facing increasing scrutiny over energy use, and hotter servers, many data center operators are embracing water.
Source: Google
2010, and the pace has gradually picked up. Manufacturers are hitting the physical limits of transistors, and it's not clear how much further they can go after 2-3nm process nodes.
Chip designers have responded gamely, exploring new avenues for improving performance beyond transistor density. But they have also maintained compute improvements by increasing the thermal design power (TDP) of processors, essentially gaining more compute power by pushing more electrical power through the chip. But that increases both the power demands of the server, and the need for cooling.
Then there's data center layouts. While there are some old facilities still clinging on, and engineers are happy to share stories of the inefficiencies of their competitors, the reality is that many of the obvious improvements have been made. Average data center PUE has fallen, but is beginning to plateau at the bleeding edge. Studies differ on what the average PUE is, but modern efficiency-focused facilities (in forgiving climates) are believed to be around 1.2. Even if that is brought lower, dropping from 1.2 to 1.1 simply won't show the same improvement as falling from 2.5 to 1.2.
At the same time, the conditions for lowering one's PUE are getting harder, and not just because chips are getting hotter. More problematic is that the world is getting hotter. This summer, Google and Oracle data centers in the UK simply stopped working amid a blistering heat wave. The facilities were built for a pre-climate change world that is going away. Expect future facilities to have more cooling equipment built in, running more regularly, as ambient air can't be trusted.
Hyperscalers have also been able to lower waste with efficiencies of scale, building vast server farms that can share infrastructure equipment. Now they are targeting the Edge - either with smaller data centers within
Direct liquid cooling is a long term goal as water’s superior heat absorption, it can mean much less cooling power is required. But that means a big change in data center hardware. A shorter term approach is to use evaporative cooling, which increases water consumption.
"With a strong focus on the PUE metric the industry has reacted and said: 'let's throw water at it.' But now you're consuming a lot more water - and so you've plugged one hole by creating another" said Shehabi.
Done right, water use could indeed help stave off massive power increases, but again it is not clear how many data center plans truly take into account the changing world. The US is in the midst of a historic and unrelenting drought, and yet data centers are still trying to compete for water (often, even, drinking water), and gain access to nonrenewable aquifer reserves.
In the UK, utility Thames Water launched a data center water probe in London and Slough, claiming the sector was using too much water amid a drought. But that declaration came as the Greater London Authority said that new housing projects in West London could be blocked for more than a decade because data centers have taken up all the electricity capacity - highlighting the delicate balance the sector will have to navigate as both power and cooling solutions become hard to secure.
Shehabi remains hopeful, pointing to specialist chips that are more efficient for certain workloads, and the wonderful inventiveness of the industry. But he cautioned that the challenge was immense.
The US Congress has officially kicked off the long bureaucratic process that will eventually lead to Shehabi's team creating a new report on data center power usage. "The industry has changed completely since we last looked at this, and I expect it to be a really groundbreaking report, frankly. What I don't know is how the trend of electricity use is going to look - if it's going to be the same as what we've seen in the past, or if we're going to see a bigger increase or maybe a decrease. We just don't know."
12 DCD Supplement • datacenterdynamics.com
Energy Transition Supplement
Self-sufficient cell towers
On-site solar and wind are growing, but can cell sites ever be independent of the grid at scale?
Dan Swnhoe Editor

Compared to data centers, the energy requirements of individual cell towers are a pittance. A 4kW cell site pales in comparison to the 20-50kW rack densities we are now seeing. But with more than 400,000 cell tower sites in the US alone, they outnumber data centers and their power footprint totals a not-insubstantial 21 million megawatt hours (MWh) of power per year.
As energy prices soar, ESG continues to grow in importance, and 5G’s increased power demands loom, a number of cell tower owners and telco operators are looking at deploying wind and solar power generation systems at the cell sites themselves.

Are we close to self-sufficient cell sites at scale, or even a potential transition to off-grid cell towers en masse?
Wind turbines at cell sites
The start of this year saw Vodafone-owned Vantage Towers announce plans to install 750 wind turbines on 52 of its cell towers in Germany. The project will create a generation capacity of up to 650 MWh per year.
The installation of the micro wind turbines is scheduled by the end of the year, provided that all necessary permits have been issued by then.
“By generating renewable power directly on site, we create a cost-efficient and maintenance-friendly way to cut down energy costs for our customers while at the same time accelerating Europe’s sustainable digitalization,” says Enrico Schadock, senior business development manager at Vantage Towers, who is managing the Mowea rollout.
Schadock explains either 4, 8, or 16 turbines will be installed at each tower depending on the power requirements of the tower in question combined with wind quantity & speed. Each pair of turbine units has a nominal capacity of 1kW in winds of 3.5m/s or more; the units have an approximate energy output of 1,500kWh per year.
Vantage operates around 83,000 macro sites in Europe, so 52 sites is still a small trial. But assuming the pilot project goes well, the companies aim to expand to more locations in Germany and Vantage Towers’ other markets in Europe.
Energy Transition Supplement | 13
Self-sufficient cell towers
Testing on-site power
While operators in emerging markets where the grid is less developed or reliable have long deployed solar and wind at cell sites, it is only in recent years that companies are starting to look at similar deployments in more developed markets such as Europe.
And unlike in developing markets, high land prices and little space combined with resilient energy grids can make it hard to justify the cost. Add in the fact many northern European markets don’t get much sun for large portions of the year, and further challenges arise.
But Vantage’s trial is one of a number of small-scale pilots and projects around deploying on-site renewable power at cell towers in Europe and elsewhere. While the results seem promising in isolation, none of the companies are deploying such solutions at scale yet.
Also in Germany, Deutsche Telekom is partnering with Ericsson to test self-sufficient cell towers. The German telco and Swedish OEM have conducted a trial at a live cell tower site in Germany where it was able to operate entirely from wind and solar energy generated by on-site panels and turbines.
The site – in the Bavarian municipality of Dittenheim, about 120km north of Munich – has been part-powered by energy from 12 sqm of solar modules installed more than a year ago. The two companies have since added a wind turbine, capable of providing up to five kilowatts of additional power, as a second renewable energy power source. Initial tests showed that on windy days, more renewable energy could be generated than was consumed by site operations.
In the UK, Vodafone has been working with Crossflow Energy for two years to use the latter’s wind turbine technology in combination with solar and battery technologies to create a self-powered mobile network tower
Founded in 2008, Crossflow Energy has developed a unique transverse axis wind turbine designed to generate power from ‘small wind;’ locally generated wind power for single locations. Created in collaboration with Swansea University, the turbine incorporates a patented shield which delivers optimum lift and drag performance across a wide range of wind speeds, keeping low rotational speed and minimal vibration.
The companies said the Eco-Towers will enable the deployment of new mobile sites in remote locations, without the usual difficulty and cost of connecting to the electricity grid. The new sites will be owned and managed by Cornerstone Telecommunications Infrastructure Limited and not part of Vodafone's own tower network.

In Australia, Telstra has installed an off-grid solar and battery storage solution at one of its cell towers in Mount Ney, east of Esperance, Western Australia, The company partnered with local energy firm Horizon Power and its subsidiary Boundary Power to transition a remote mobile tower from an overhead power supply to a standalone power system (SPS).
The SPS unit is powered by eight kilowatt (kW) solar panels, a 16.8kW hour battery and a 26kW back-up generator, which together can deliver 12kW of continuous power. The companies said at least six more mobile tower SPS will be deployed throughout Horizon Power’s service area over the coming 24 months.
Richard Webb, director of network infrastructure, CCS Insight, tells DCD he estimates that less than 10 percent of cell towers have at least some of their power generated directly at the cell site by renewable energy, possibly as low as the ‘low single digits.
But he notes the interest and demand is there as part of these companies’ wider sustainability drives.
“Energy is a big part of operators' operational expenditure,” he says. “So they all want to reduce their energy bills; reduce costs, you're improving profits.”
“I do think there is a challenge to change [the status quo], because if you've got power and it works, and you're happy with it, it's a cost to you as an operator to decide to change that. So it is a big operational and capex-based decision.”
Energy price rises
While many major telcos are signing power purchase agreements (PPAs) to procure renewable energy at the grid level, reducing energy network costs is always a priority for operators looking to reduce their opex. At a time when energy prices are soaring, more on-site energy generation at cell sites is growing in urgency.
“The interest in sustainable energy solutions within the industry has definitely increased over the past years; mobile network operators (MNOs) have been trying to reduce their overall energy consumption for years,” says Vantage’s Schadock. “By generating sustainable energy directly onsite, we have found a cost-effective way to meet this demand and the current surge in energy prices further accelerates this development.”
Latvian telco LMT has had a small trial of solar-powered base stations running for several years. The company found that during the summer months, cell tower sites
Non consed et, nimusam ea verate cuscim labor repudam dolum nonsene iuria et eum alique simenistiis unt alit hit, cusam, ut lacius exceat quam se
Energy Transition Supplement
may cover their energy requirements for a total of around one month, but generated almost no power during the winter months. As things currently stand, LMT doesn’t have the option to go fully solar-powered.
However, Aigars Benders, LMT’s technical director, tells DCD that in the wake of rising energy costs this year, the company has explored the feasibility of deploying solar panels at all of its 1,500 sites.
It found the ROI for sub-3kW sites was still effectively zero, and so still hard to justify from a cost perspective. But some sites with loads around 6KW start to create a positive return on investment after 8-15 years. If the prices continue to rise, more sites start to show a positive ROI.
“Five years ago, the reason for this experiment was to discover opportunities to be more environmentally friendly. Now, with rising energy expenses, it has an entirely different meaning from a business perspective and even risk management,” he says. “The bigger the site, the better the business case, that’s the conclusion [now].”
Vantage told us that it isn’t planning donating energy it generates at cell-sites back to the grid; if more energy is generated than is consumed, the turbines will be throttled by the turbine’s control systems. However, Latvia’s LMT is considering a different tack.
The telco hopes to create solar farms to power the equivalent multiple base stations. The company has large land plots at around 10 sites where bigger solar projects could be deployed.
“By building one big solar farm we can feed many sites. Upcoming changes in the legislation will say that if for instance we build up a solar site with 100 kilowatt power – there is no such base station sites – we can feed the electricity back to the electrical network,” says LMT’s Benders.
“Most probably the kilowatts generated at cell sites will be exchanged for money. So when we generate an excess amount of power and feed it back to the grid, for that price we can the next day, next few days, we can power other sites.”
Futureproofing for 5G
The turn-off of legacy 3G networks and more energy efficient RAN hardware might help reduce some of the power requirements of cell tower sites, but the future is still likely to be a more power-hungry network.
5G hardware is currently a small part of the overall traffic managed by operators, but as roll-out continues, it will soon become the main source of the mobile landscape’s
energy requirements. Not only will the hardware potentially require more energy, but there will be more sites, compounding the energy demand.
“The energy efficiency of 5G is significantly higher than that of previous mobile phone generations (e.g. UMTS or LTE), so the energy requirement per megabyte is significantly lower with 5G, but the overall consumption at the site increases due to the much higher possible bandwidths,” says Vantage’s Schadock. “This is another reason why Vantage Towers is working on solutions to develop a 100 percent selfsufficient power supply with a combination of wind, solar, hydrogen, and LNG.”
A typical 3-sector base station site holding hardware from several carriers could draw anywhere between 2.5 to 10 kW, but would typically sit somewhere in the middle. MTN Consulting estimates operators spend around 5-6 percent of their operating expenses, excluding depreciation and amortization, on energy costs.
But the analyst firm says a typical 5G base station consumes up to twice or more the power of a 4G base station; it notes that the industry consensus is that 5G will double to triple energy consumption for mobile operators, once networks scale. Likewise, ABI Research predicts energy consumption is expected to increase 160 percent between 2020 to 2030 due to the energy demands of network elements like massive MIMO, the proliferation of 5G cell sites, and the flexibility of the 5G networks in both consumer and enterprise use cases. In the future, ABI predicts a typical 3.5GHz site deploying massive MIMO with four transmitters and four receivers – also supporting 2G, 3G and 4G – might draw 14kW on average and up to 19kW under peak load.
In 2019, China Mobile EVP Li Zhengmao said that its electricity costs were rising fast – with 5G sites seeing a fivefold increase in traffic compared to LTE – and said Chinese telcos need preferential electricity pricing or subsidies to aid 5G network deployment. Huawei data from FierceWireless suggest the typical 5G site has power needs of over 11.5kW, up nearly 70 percent from a base station deploying a mix of 2G, 3G, and 4G radios.
While energy-efficiency is constantly improving as OEMs introduce new hardware iterations, one benefit of 5G is the application of greater intelligence to network management; hardware can be powered down during off-peak hours, meaning sites will require less energy during quieter periods of the day. How much smarter network management will offset greater data demands is still unclear at this point.
“Yesterday was the time to act if they're not already,” warns CSS’s Webb. “Any operators that aren't being very, very serious about getting their energy bills down, using all the tools that are available, they're sitting on a time bomb.”
The paradox of on-site renewables
However, the practical roll-out of 5G poses a problem. Power-hungry 5G hardware will initially be deployed in metro areas where space is at a premium and power networks are most reliable. This makes it harder to find sites where it is practical to deploy turbines or solar panels, and harder still to make the costs work. The added challenge that sites are more likely to be leased also adds to the complications.
Conversely, more rural cell sites might well have space available at a reasonable cost, but lower data traffic means lower power requirements and therefore makes the cost of deployment harder to justify.
But as solar panels become more efficient and more able to generate larger amounts of power in smaller footprints, the ROI inevitably becomes easier to justify. The same applies to battery storage.
“The whole industry needs to be more focused now on those alternative energy sources. The complete solution is solar, wind, battery backups, plus grid as well,” says LMT’s Benders. “The industry really needs to look at different aspects and come together and discuss now what else can be done.”
CCS Insight’s Webb, adds: “It will proliferate, I have absolutely no doubt about that. How far and to what extent, I don't know.
“Technology is improving. As renewables improve in terms of performance and efficiency, more cell sites can incorporate that. And of course, as you go up in volume, that equipment should come down in price.”
He warns of a “chicken and egg standoff,” where “volume orders will get put in when the prices come down but prices will only come down when volume orders are put in.
“Someone's got to move first and it's good to see Vodafone and others doing that. As more operators do it the technology should come down in price and therefore be an easier pill to swallow in terms of investment.”
Retail Edge Supplement | 15 Self-sufficient cell towers
SHOP FOR
SOLUTIONS
AT EVERY STEP OF YOUR VALUE CHAIN


On-site
Off-site
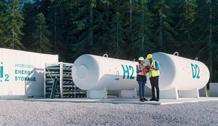
Power Supplement 16 DCD Supplement • datacenterdynamics.com YOUR ONE-STOP
ENERGY
renewable energy production including photovoltaic and green hydrogen For further information www.engie.com/en/campaign/green-data-centers> 17 Accredited Tier Designer Green back-up Storage Services to the grid Waste heat export
renewable energy supply ENGIE : SA au capital de 2 435 285 011 € RCS Nanterre 542 107 651 - Crédits photos : @Shutterstock, ENGIE / Miro / Meysonnier Antoine, AdobeStock


