1 minute read
Table 2. Summary of monitoring strategies

Weather data will be logged on a half-hourly basis. It is important to check logging capacity to ensure full duration can be recorded. Data will then be converted to an EnergyPlus weather file (epw) to be assessed in a simulation.
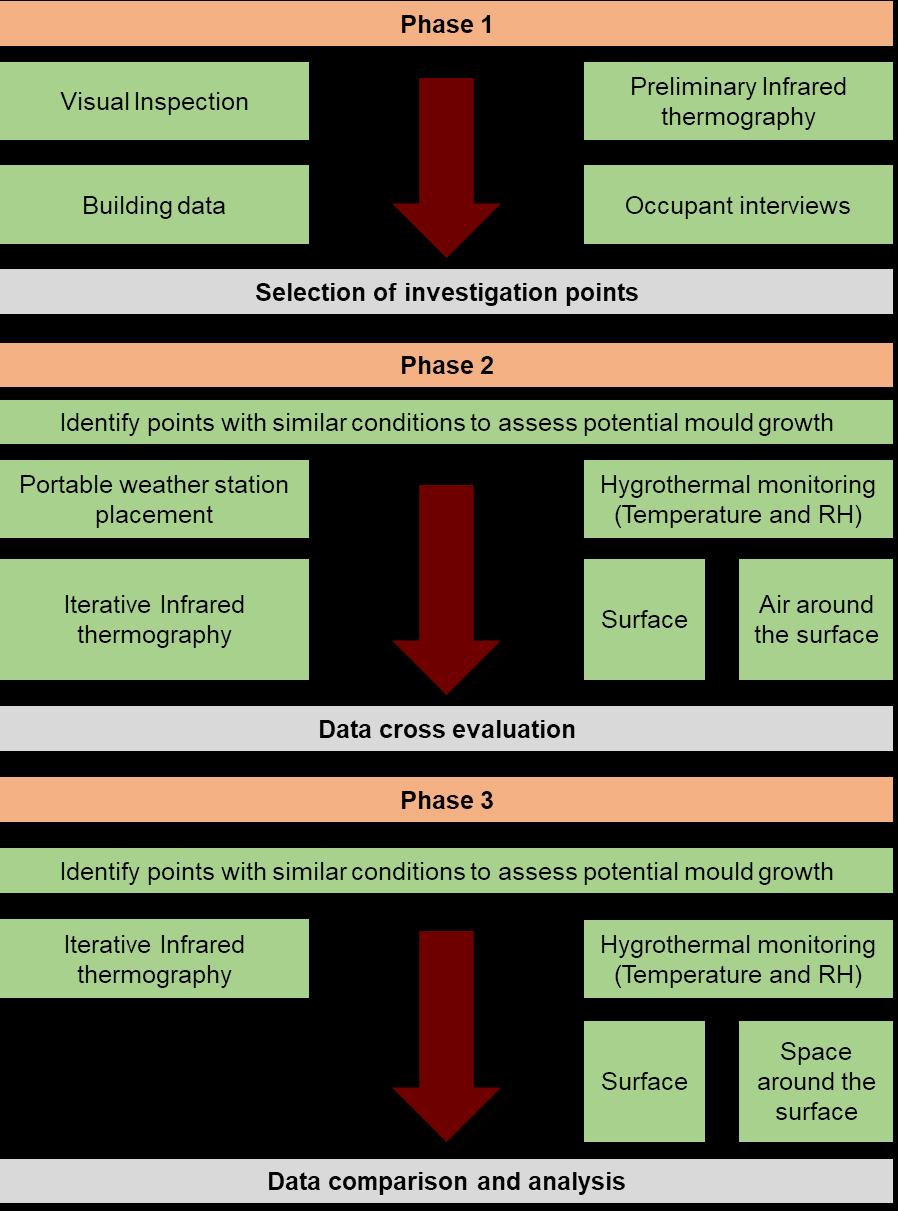
Table 2 depicts the summary of monitoring strategies. The total duration of the monitoring is 1 year to account for all seasonal changes. The preliminary inspection will take up to 2 days to identify all data points. These data points will be monitored for 10 days in each season to provide a conclusive data in normal and extreme weather conditions.
Advertisement
Table 2. Summary of monitoring strategies.
Activity Aim Instrument/ Standard Time period
Preliminary inspection and first IRT
Weather data inspection
Iterative IRT and wall surface gridding
Assessment of the wall surface temperature and identification of damp and dry areas – Selection of data points
Inspection of microclimate around external wall data points. Measure wind speed, directions, globe temperature, external air temperature and RH.
Inspection of average surface temperature for calculation of surface temperature factor IR Camera (EN 13187) Short term | 1-2 days
Portable Weather station (BPE guide 2021) Seasonal | 4 times | 10 days
IR Camera, tape and cord (EN 13187) Seasonal | 4 times | 10 days
Hygrothermal measurement of the air
Monitoring of relative humidity, dry air temperature, mixing ratio and dew point temperature
HOBO Loggers (EN 16242) Seasonal | 4 times | 10 days
Hygrothermal measurement of the envelope Monitoring of surface temperature and RH
IR Camera (EN 13187) Moisture meter (BPE guide 2021) Seasonal | 4 times | 10 days