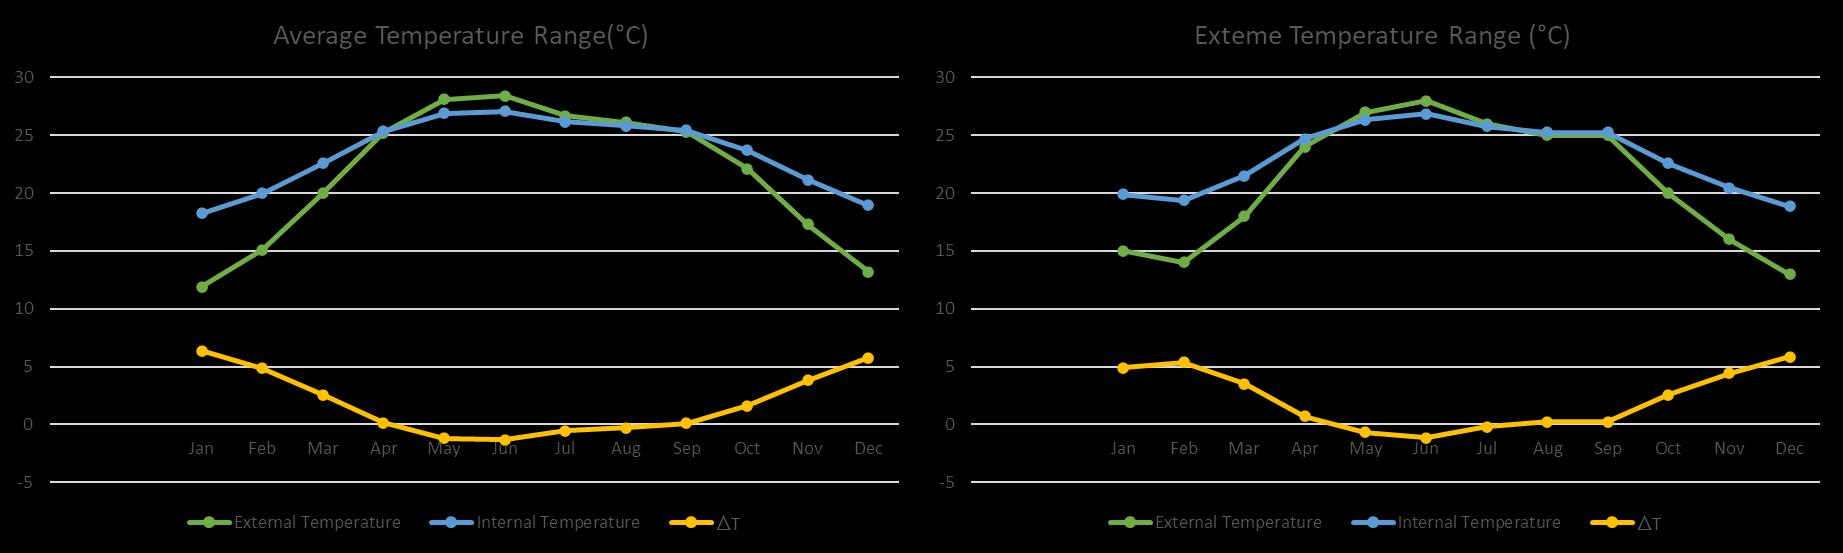
Figure 5. Heat transfer through conduction graphs. (a) Annual Heat Transfer for average and extreme conditions, (b) monthly break-up (c) Break-up of elements for average condition, (b) Break-up of elements for extreme condition.
In average conditions, annual energy demand accounts to ~11,000 kWh (Appendix E). Extreme conditions result in additional 2000 kWh of energy demand. Extreme conditions will therefore be analyzed for heat transfer calculation. Heat transfer through fabric suggests heat loss during the months of September to April. Summer months of May, June and July suggest heat gains. Heat transfer through external wall, floor is higher in average conditions in winter months, whereas extreme conditions state higher energy demand in summer months. Heat transfer through floor accounts for maximum heat transfer across all months. Roof and door have negligible impact on the energy demand. A lower U value for floor, glazing and external wall elements may result in drastic decrease in energy demand.
Heat transfer through ventilation is calculated using the following equation, Qv = nV/3(To-Tei) where: Qv = heat transfer across the envelope due to ventilation and infiltration; kWh n = ventilation flow rate + infiltration rate; ac/h @ 50 Pa V = Volume of the space; m 3 Heat transfer has been calculated for both, occupied and unoccupied hours. Occupied hours are assumed to be naturally ventilated for 9 hours a day and 5 days a week. Unoccupied hours are calculated for the rest of the time when the windows are shut and only infiltration losses take place.
8