Hygrothermal performance evaluation of ground floor of the Pierhead Building
21/22 ART627 Sustainable Mega-buildings Overview MSc Sustainable Mega-Buildings
By Deepak K Sadhwani March 2022
1
Table of Contents Declaration Form……………………………………………………….…………………………………....…1 Table of Contents…………………………………………………….…………………………………....…...2 List of Figures………………………………………………………….…………………………....................3 1. Introduction………………………………………………………….………………………………….…….3 2. Literature Review.……………………………………………………………………………………………4 3. Monitoring Questions….……………………………………………………………………………………..6 4. Monitoring Plan……………………………………………………………………………………………….7 4.1. Local Weather Data.……………………………………………………………………………………….7 4.2. Building Data.……………………………………………………………………………………………….7 4.3. Identifying condensation sources..……………………………………………………………………….7 5. Monitoring techniques.…..………………………………………..………………………………………....9 6. Data Analysis.………………………………………………………………………………………………..10 7. Conclusions………………………………………………………………………………………………….11 References……………………………………………………………………………………………………...12
2
List of Figures
Figure 1. Moisture damage observed on the walls of the Pierhead Building.........................................…3 Figure 2. Monitoring Strategy …………..……………………….…………………………...………..............8 Figure 3. Seasonal void relative humidity and temperature at 4 different data points.….......................10 Figure 4. Isothermal distribution of temperature ………………………..……….………………………….11
List of Tables
Table 1. A classification of NDT of assessing moisture content in building materials……………………5 Table 2. Summary of monitoring strategies.…………………………..……………………………………...9
3
Hygrothermal performance evaluation of ground floor of the Pierhead Building
1. Introduction During the site visit to Pierhead building, a visual inspection was performed to identify mould growth. Spaces were inspected for signs of moisture infiltration including discoloration of interior walls, floors, and ceilings; bubbling or peeling dry-wall or plaster; visible mould or mildew; or a musty smell. Figure 1 highlights the signs of condensation on external walls towards the South and West. In both cases, walls on which condensation is observed seem to be constructed in brick masonry and are near external windows. Area marked in orange shows wet areas which might show signs of moisture damage upon investigation.
Figure 1. Moisture damage observed on the walls of the Pierhead Building. © Author
These observations form the basis of this report. The aim of this report is to understand why condensation is forming on the walls by monitoring the hygrothermal performance of walls. This report focuses on the elements of the ground floor only. Interstitial condensation and HVAC are not a focus of this report.
4
2. Literature Review CIBSE Guide L (2020) suggests that surface condensation is usually found in areas that are typically unventilated (cupboards, voids, areas behind furniture). The monitoring approach can be informed by a combination of internal humidity sources (ex. wet areas) as well as external forces such as driving rain, ventilation, checks for thermal bridging, and heat and moisture transfer through the construction layers. According to WELL Standard V2 (2022), moisture can infiltrate a building in the following ways: 1. Bulk water enters the building in the form of leaks. These leaks can be due to damaged, unmaintained, or incorrectly specified building envelope. It can also enter through plumbing or malfunctioning HVAC systems. 2. Capillary water infiltrates a building through porous building materials and finishes. 3. Air transported moisture, or humidity. When relative humidity of indoor air is high, cool surfaces draw in the vapour and cause it to condense onto the surfaces. 4. Vapour diffusion is the infiltration of water vapour through a vapour-permeable material, such as gypsum board, concrete blocks, and bricks. Moisture can be present in any wall system in three thermodynamic physical states: the solid state (ice), the liquid state, and the vapour state. Hygrothermal behaviour of such system is characterised by the moisture storage function, vapour permeability, liquid conductivity, thermal conductivity, and specific heat capacity. Moisture in the walls have destructive impact which is caused by natural cycles of wetting-drying and freezing-thawing. (Bottino-Leone, Larcher, Troi and Grunewald, 2021) A study by Sedlbauer (2002) concluded with the lowest relative humidity level to induce mould growth in buildings is approximately 70%. Another research by Gradeci, Labonnote, Time and Köhler (2017) indicate that critical RH is between 70-85%. Several research have dealt with historic building deterioration. Kubičár, Hudec and Dieška, (2016) innovated a hygrothermal monitoring method based on thermal conductivity of porous materials. Two moisture sensors were placed on the pillars of a church. Heat flows and moisture transfer were the key identifiers in the study. An observation on the effects of freezethaw were made in the winter period. Hot ball sensors were used in this study for measurement of thermal conductivity. The hot ball sensors are placed at 10cm and 40cm depth to monitor porosity of the external wall. This kind of intervention would not be allowed in Grade 1 status of the Pierhead building. A study by Litti, Khoshdel, Audenaert and Braet (2015) and Bajno, Bednarz, Matkowski and Raszczuk (2020) showcased several indirect non-invasive envelope monitoring strategies for monitoring hygrothermal aspects on a historical building in Belgium. In both studies, a preliminary onsite inspection was conducted to identify mould growth and spaces to be targeted for further testing. Table 1 shows all the non-destructive techniques (NDT) which can be used for moisture detection in the Pierhead building.
5
Table 1. A classification of NDT of assessing moisture content in building materials
Method
Investigation Depth
Type
Constraints
Measured Parameter
Indicator paper method
Surface
Qualitative
Indicates only the presence of moisture
Change in indicator paper colour in influence of damp material
Infrared thermography (IRT)
Surface
Qualitative
Nuclear magnetic resonance
Up to 20mm
Quantitative
Moisture meter
Up to 30mm
Holographic radar
Up to 200mm
Sensitive to Surface temperature variation environmental condition
Presence of iron within the surface, organic Electrical impedance materials Presence of iron within Quantitative the surface, organic Electrical impedance materials Applicable only on flat Amplitude modulated by phase Qualitative surfaces variation
Building performance evaluation guide (2021) suggests a site visit/ and or conversation with occupants to check for signs of visible condensation and mould growth. A study on understanding whether building fabric introduces high risk of thermal bridging, discontinuity of insulation at junctions and penetrations is also a must. Assessing thermal bridges is suggested as an important factor as these are not just a location of heat loss but can also lead to condensation and mould growth. It also suggests to study both, inwards and outwards moisture flows if moisture levels are too high over long periods. Inwards moisture flow relates to moisture generated indoors (toilets, other wet areas), whereas outwards moisture flows relate to moisture from outdoor air, rain, and ground. A further inspection can be made on how the envelope is protected from water damage. Furthermore, thermography can be used to identify cold spots on cold cloudy days (preferably early morning/ early evening). These could indicate either air leakage or thermal bridging. However, this is only qualitative and would not solve all issues. BS 7913-2013 Guide to conservation of historical buildings states that in case of evidence of moisture in the building fabric, the internal environment should be examined for possible sources of condensate and appropriate ventilation measures should be applied. To mitigate surface condensation, CIBSE AM13: 2000 suggests the use of moisture sensors to prevent condensation. They may automatically trigger switching ‘on’ a mechanical system to dehumidify the space.
6
3. Monitoring Questions Mould thrives in constantly moist environments that have continuous exposure to moisture due to weather damage, leaks, or improper construction experiencing mould growth. In many cases mould may continue to build up behind walls and fixtures and may be difficult to locate. Mould spores can trigger asthma attacks, headaches and allergies, and other serious respiratory ailments. High humidity levels sustained over time promote mould growth. Beyond health effects, humidity levels affect thermal comfort and overall air quality. Based on the site visit, and literature review, hygrothermal performance of the Pierhead Building is identified as a case to be monitored to assess a response to the following questions: A. Where is condensation observed?
B. Where is mould growth observed? Are there any signs of prominent mould spores?
D. What are the favourable conditions for the cause of condensation and mould growth?
D. Where is mould most likely to grow in future?
E. Does the occupant survey show any signs of respiratory ailments?
F. Is there a need for mechanical ventilation (dehumidifying or exhaust) in affected spaces?
G. Is there a need for moisture sensing/ regulating systems for the preservation of historical elements?
7
4. Monitoring Plan 4.1 Local Weather data According to Building performance evaluation guide (2021), condensation should be avoided by ensuring that surfaces are well above dew point temperature of the adjacent air. It is essential to take account of actual weather in the monitoring period and assess microclimate of the space by measuring: A. Air temperature B. Wind speed and direction C. Relative humidity D. Local water table
4.2 Building data According to the WELL Standard V2 (2022), it is essential to have information on building penetrations (doors and windows) to monitor thermal bridges, if there are any. Further an inspection on water infiltration from internal sources can be conducted to assess the following: A. Plumbing leaks B. Equipment directly connected to water supply C. Porous building materials connected to interior water source D. Porous building materials connected to exterior water source E. Finished floors in potential damp or wet rooms 4.3 Identifying Condensation sources An inspection will be carried out for air leakage that could wet exposed interior elements or hidden interstitial materials through condensation. For example, the timber panes of insulating glazing units may also provide environment for the mould to thrive as well as causing decay and performance reduction of the insulating panes. Thermal bridges may exacerbate the problem as heat flow is higher. Therefore, a qualitative assessment of the thermal specifications of the building envelope using IRT can help predict moisture condensation in the structure. Condensation can also occur on cooler surfaces such as slab-on-grade floors or cabinets/ closets on the exterior walls. Oversized AC units that cycle on/off too quickly may prevent moisture from being removed from the interior air.
8
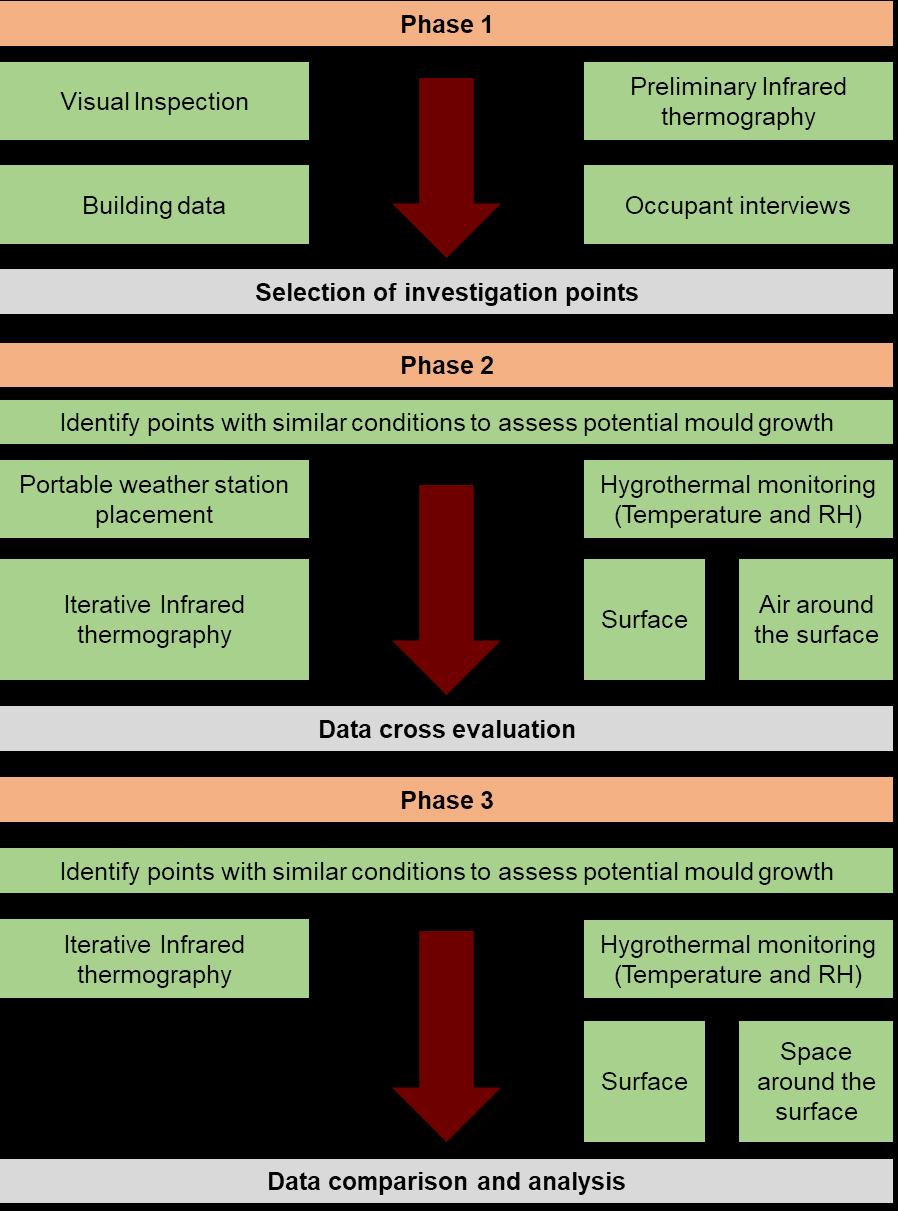
The monitoring has been planned in three phases. Phase 1 comprises of initial visual inspection, occupant surveys and preliminary IRT to select the investigation points where mould growth is observed. Phase 2 would comprise of weather and microclimate study around the targeted points. Iterative IRT and hyrgothermal monitoring of the targeted surface and air around the surface would provide the necessary data to create the isopleths. Lastly, a further IRT and hygrothermal monitoring will be conducted to identify spaces which may show signs of condensation/ mould growth. (Figure 4)
Figure 2. Monitoring Strategy. © Author
9
5. Monitoring Techniques Weather data will be logged on a half-hourly basis. It is important to check logging capacity to ensure full duration can be recorded. Data will then be converted to an EnergyPlus weather file (epw) to be assessed in a simulation. Table 2 depicts the summary of monitoring strategies. The total duration of the monitoring is 1 year to account for all seasonal changes. The preliminary inspection will take up to 2 days to identify all data points. These data points will be monitored for 10 days in each season to provide a conclusive data in normal and extreme weather conditions. Table 2. Summary of monitoring strategies.
Activity
Aim
Instrument/ Standard
Time period
Preliminary inspection and first IRT
Assessment of the wall surface temperature and identification of damp and dry areas – Selection of data points
IR Camera (EN 13187)
Short term | 1-2 days
Weather data inspection
Inspection of microclimate around external wall data points. Measure wind speed, directions, globe temperature, external air temperature and RH.
Portable Weather station (BPE guide 2021)
Seasonal | 4 times | 10 days
Iterative IRT and wall surface gridding
Inspection of average surface temperature for calculation of surface temperature factor
Hygrothermal measurement of the air
Monitoring of relative humidity, dry air temperature, mixing ratio and dew point temperature
Hygrothermal measurement of the envelope
Monitoring of surface temperature and RH
IR Camera, Seasonal | 4 times tape and cord | 10 days (EN 13187)
HOBO Loggers (EN 16242)
Seasonal | 4 times | 10 days
IR Camera (EN 13187) Seasonal | 4 times Moisture meter | 10 days (BPE guide 2021)
10
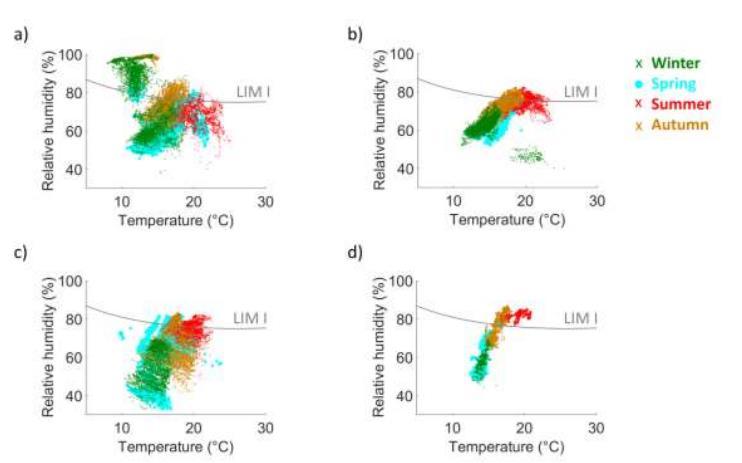
6. Data Analysis Data analysis will be done in two parts. 6.1. Seasonal Analysis using lowest isopleth for moulds (LIM) Isopleths are curves of relative humidity threshold as a function of the temperature. They describe the lowest condition for with significant mould growth risk and are specific to the type of mould spore (Pelsmakers, Vereecken, Airaksinen and Elwell, 2019). However, Sedlbauer (2002) developed LIM, below which no mould will grow. These isopleths also indicate critical temperature and RH threshold to initiate mould spore germination for a specified period. In case of Pierhead building, a seasonal analysis of all data points can be assessed. LIM iIsopleths can be created for all data points to identify the ideal conditions for mould growth with respect to different times of the year. Figure 7 shows a similar comparative graph prepared by Sedlbauer (2002).
Figure 3. Seasonal void relative humidity and temperature for uninsulated floors at 4 different data points. (Source: Sedlbauer. 2002)
6.2. WUFI-Bio hygrothermal model to predict mould growth by computer simulation Building performance evaluation guide (2021) suggests the use of moisture dynamic analysis. This technique incorporates a dynamic hygrothermal simulation tool to predict the way heat and moisture move through the building envelope. It can be used to assess the potential risk of moisture accumulation within any part of the envelope. WUFI simulation tool can be used to perform this analysis. It is performed by analysing data obtained from humidity and temperature measurements and material parameters. Figure 7 shows the output data from an 18-month WUFI simulation to quantitatively assess the moisture diffusion through the envelope.
11
Figure 4. Isothermal distribution of temperature in the corner of an uninsulated wall (Source: WUFI 2D v 3.4 software)
7. Conclusion Phase 1 completion will identify the locations of mould growth in the Pierhead building. These can be segregated between condensation and those which show signs of mould spores. Completion of Phase 2 will provide the data necessary to create LIM isopleths for all data points. The conditions necessary for mould growth can then be identified. The points which showed signs of condensation, but no mould spores can be tested in Phase 3 to assess whether they are likely to show signs of mould growth or not. A conclusive iterative IRT and hygrothermal monitoring in the Phase 3 will identify areas with favourable temperature and RH conditions for mould growth. An occupant survey in Phase 1 can help identify whether they show any signs of respiratory ailments. If yes, then these can be examined with their time spent in the areas with mould spores. As per BS 7913-2013 Guide to conservation of historical buildings, appropriate ventilation measures can be applied to the problematic areas. These can be in the form of sensors and dehumidification devices. These can be permanent or even portable ones to cater to the needs of the problematic space.
12
References
[1] Alamdari, F., Arnold, D., Bordass, W., Ho, K., Oughton, R. and Twinn, C., 2000. Mixed Mode Ventilation - CIBSE Applications Manual AM13: 2000. London: CIBSE. [2] Bajno, D., Bednarz, L., Matkowski, Z. and Raszczuk, K., 2020. Monitoring of Thermal and Moisture Processes in Various Types of External Historical Walls. Materials, 13(3), p.505. [3] Bottino-Leone, D., Larcher, M., Troi, A. and Grunewald, J., 2021. Hygrothermal characterization of a fictitious homogenized porous material to describe multiphase heat and moisture transport in massive historic walls. Construction and Building Materials, 266, p.121497. [4] 2013. BS 7913:2013 Guide to the conservation of historic buildings. BSI Standards Publication. [5] 1999. BS EN 13187 Thermal Performance of Buildings - Qualitative Detection of Thermal Irregularities in Building Envelopes - Infrared Method. London: BSI. [6] 2012. BS EN 16242:2012 Conservation of cultural heritage. Procedures and instruments for measuring humidity in the air and moisture exchanges between air and cultural property. London: BSI. [7] Cheshire, D., 2020. CIBSE Guild L Sustainability. Chartered Institution of Building Services Engineers. [8] Diamond, S., 2021. Building Performance Evaluation Guide 2021. 1st ed. Cardiff: Good Homes Alliance. [9] Gradeci, K., Labonnote, N., Time, B. and Köhler, J., 2017. Mould growth criteria and design avoidance approaches in wood-based materials – A systematic review. Construction and Building Materials, 150, pp.77-88. [10] Kubičár, Ľ., Hudec, J. and Dieška, P., 2016. MONITORING THE HYGROTHERMAL REGIME OF THE CHURCH SAINT JAMES IN LEVOČA. European Journal of Science and Theology, 12(1), pp.283291. [11] Litti, G., Khoshdel, S., Audenaert, A. and Braet, J., 2015. Hygrothermal performance evaluation of traditional brick masonry in historic buildings. Energy and Buildings, 105, pp.393-411. [12] Pelsmakers, S., Vereecken, E., Airaksinen, M. and Elwell, C., 2019. Void conditions and potential for mould growth in insulated and uninsulated suspended timber ground floors. International Journal of Building Pathology and Adaptation, 37(4), pp.395-425. [13] Sedlbauer, K., 2002. Prediction of Mould Growth by Hygrothermal Calculation. Journal of Thermal Envelope and Building Science, 25(4), pp.321-336. [14]
WELL
Standard.
2022. WELL
Standard
https://v2.wellcertified.com/en/wellv2/overview
13
V2.
[online]
Available
at: