

Welcome to our new publication, the 2025 Competitiveness Bluebook! The pages inside offer a data-driven look at key measures of Delaware’s economic health. They offer a side-by-side comparison of how our state ranks on dozens of indicators and how we compare to other states.
The data sources were carefully selected and, in most cases, are drawn from federal government agencies and departments. There are bright spots in the data, as well as sobering assessments of where we really stand on key issues. We cannot—and will not—improve our standing if we do not accurately measure where we are and work together to make progress.
Delaware is, on average, home to an older population than most states. This presents a challenge for employers looking to invest in a place where a steady flow of potential employees already exists. An older demographic also places an increased demand on our health care providers, as this population requires more extensive care.

On a positive note, our overall spending on research and development is strong and we rank very high among the 50 states. Similarly, we rank in the top 10 for tech workers. Unsurprisingly, our judiciary ranks at the very top, and we fare well for venture capital investments.
At the Delaware State Chamber of Commerce, we are committed to increasing jobs, raising incomes, and reducing poverty rates in our state. These are the same shared goals of our elected leaders and even some advocacy groups that engage with the General Assembly or seek to influence our elections. Where we differ is how we elevate wages and incomes, create more jobs, and move people out of poverty. In today’s fast-paced, ever-changing world, we need regulators to move at the “speed of business”, work with us to build affordable homes for working-age adults to live, reduce the cost of doing business, and better prepare our future workforce with the skills needed to succeed.
Building a stronger Delaware relies on a clear focus and strategic action to drive job creation, economic activity, and quality of life. By centering efforts on what makes Delaware unique—its talented workforce, innovative businesses, and vibrant communities—we can build a more competitive state. This requires aligning our passion for progress with the policies and practices that yield the greatest impact. Through collaboration, advocacy, and a shared commitment to excellence, Delaware can solidify its place as one of the nation’s top destinations to live, work, and play.

Michael J. Quaranta President, Delaware State Chamber of Commerce
(Sept. 2014 – Sept. 2024)
(Q2 2023 – Q1 2024)
1 Austin-Round Rock-San Marcos, TX
2 Raleigh-Cary, NC
3 Denver-Aurora-Centennial, CO
4 Washington-Arlington-Alexandria, DC-VA-MD-WV
5 Charlotte-Concord-Gastonia, NC-SC
6 Portland-Vancouver-Hillsboro, OR-WA
7 San Francisco-Oakland-Fremont, CA
8 Seattle-Tacoma-Bellevue, WA
9 Tampa-St. Petersburg-Clearwater, FL
10 Phoenix-Mesa-Chandler, AZ
11 Jacksonville, FL
12 Atlanta-Sandy Springs-Roswell, GA
12 Minneapolis-St. Paul-Bloomington, MN-WI
14 Salt Lake City-Murray, UT
15 Sacramento-Roseville-Folsom, CA
16 Boston-Cambridge-Newton, MA-NH
17 Orlando-Kissimmee-Sanford, FL
18 Nashville-Davidson--Murfreesboro--Franklin, TN
19 Philadelphia-Camden-Wilmington, PA-NJ-DE-MD
20 Columbus, OH
21 Richmond, VA
22 Dallas-Fort Worth-Arlington, TX
23 Baltimore-Columbia-Towson, MD
24 San Jose-Sunnyvale-Santa Clara, CA
25 San Diego-Chula Vista-Carlsbad, CA
26 Kansas City, MO-KS
27 Chicago-Naperville-Elgin, IL-IN
28 Pittsburgh, PA
29 Indianapolis-Carmel-Greenwood, IN
29 Los Angeles-Long Beach-Anaheim, CA
31 San Antonio-New Braunfels, TX
32 Miami-Fort Lauderdale-West Palm Beach, FL
33 Milwaukee-Waukesha, WI
34 St. Louis, MO-IL
35 Detroit-Warren-Dearborn, MI
36 New York-Newark-Jersey City, NY-NJ
37 Cincinnati, OH-KY-IN
38 Cleveland, OH
39 Houston-Pasadena-The Woodlands, TX
40 Louisville/Jefferson County, KY-IN
41 Grand Rapids-Wyoming-Kentwood, MI
42 Las Vegas-Henderson-North Las Vegas, NV
43 Virginia Beach-Chesapeake-Norfolk, VA-NC
44 Riverside-San Bernardino-Ontario, CA
45 Buffalo-Cheektowaga, NY
46 Providence-Warwick, RI-MA
47 Birmingham, AL
48 Oklahoma City, OK
49 Memphis, TN-MS-AR
50 Fresno, CA
(3rd Quarter 2019 – 3rd Quarter 2024)
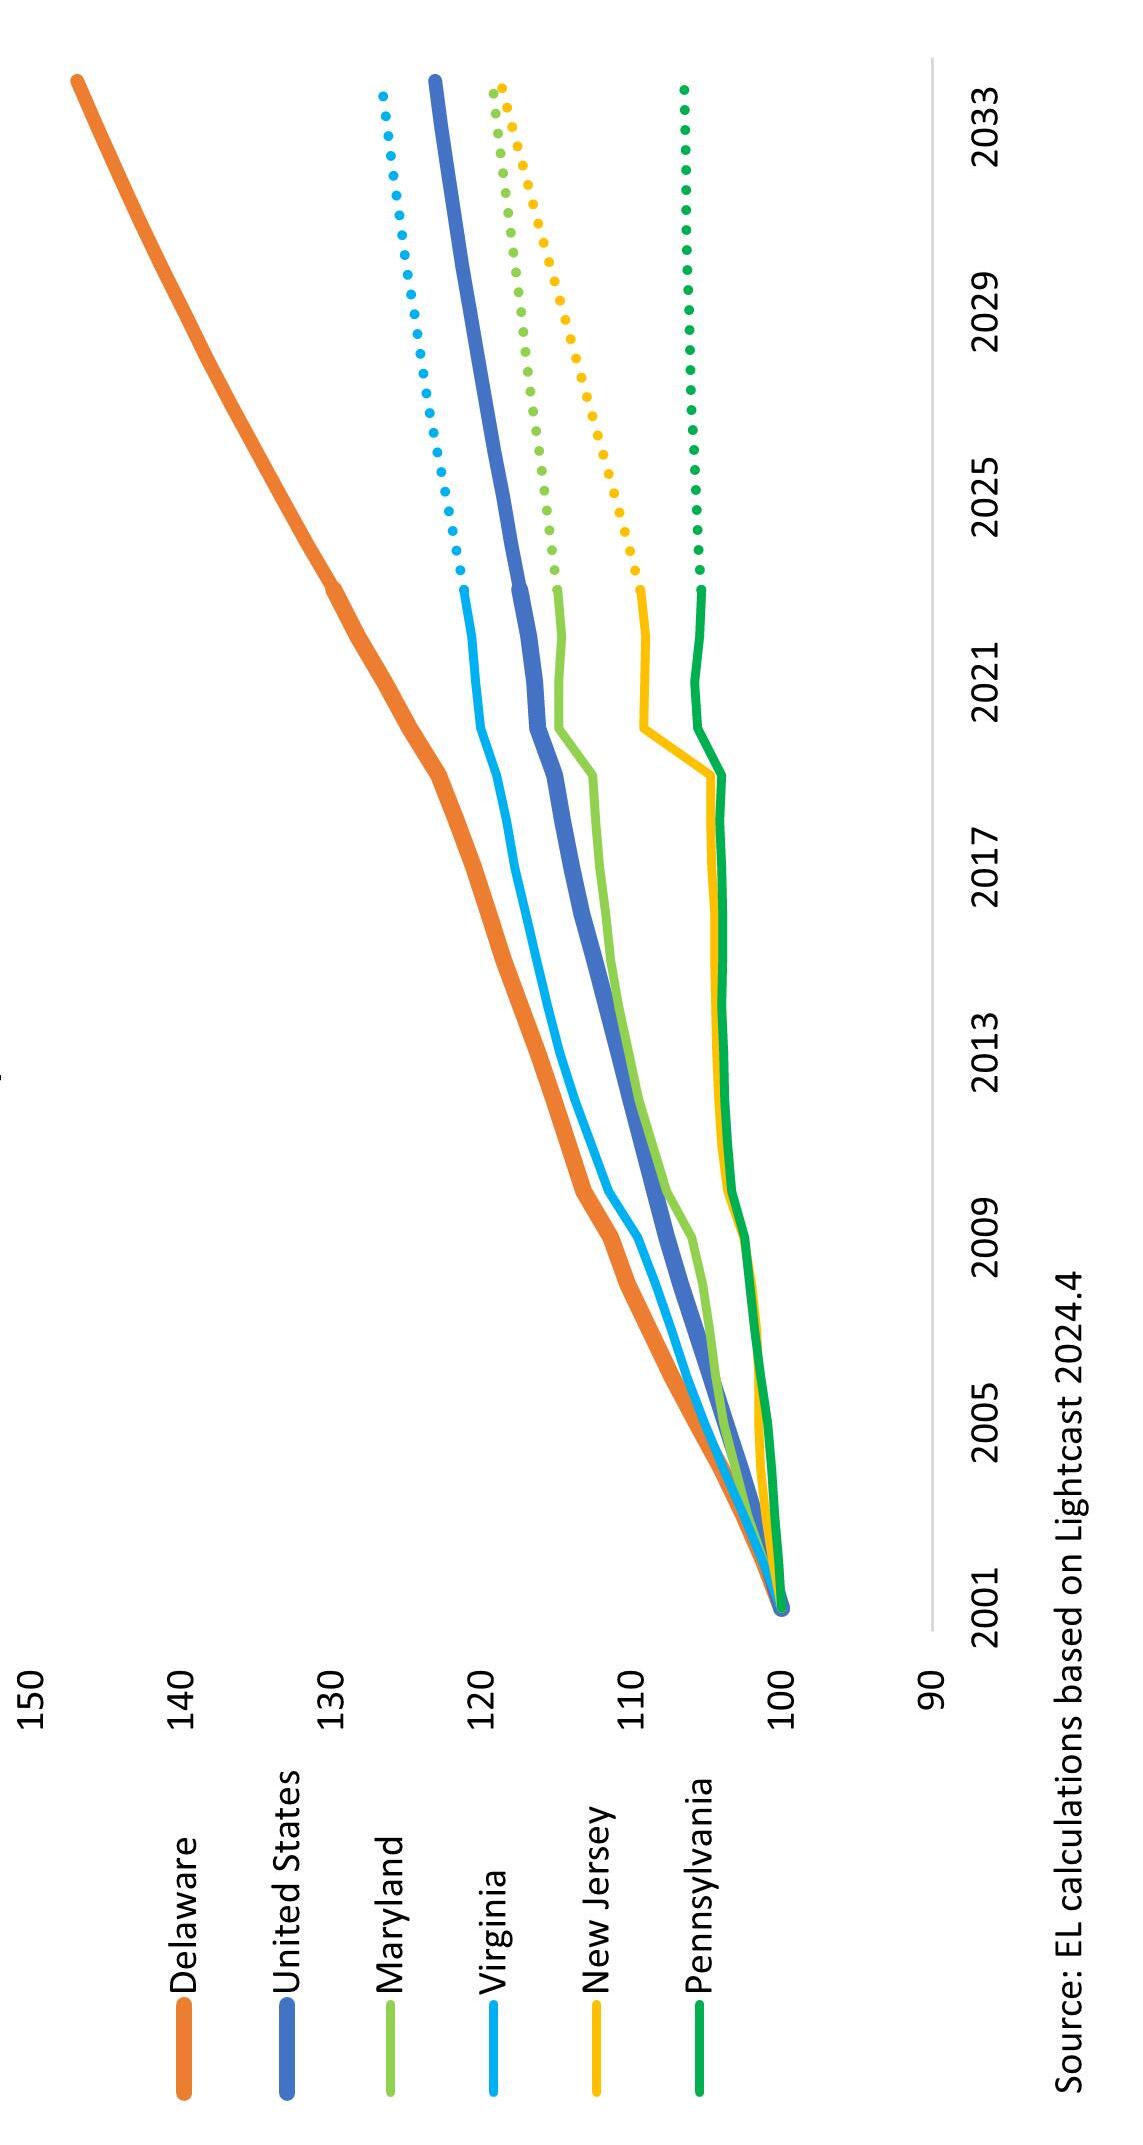
100 = 2001 Population Levels
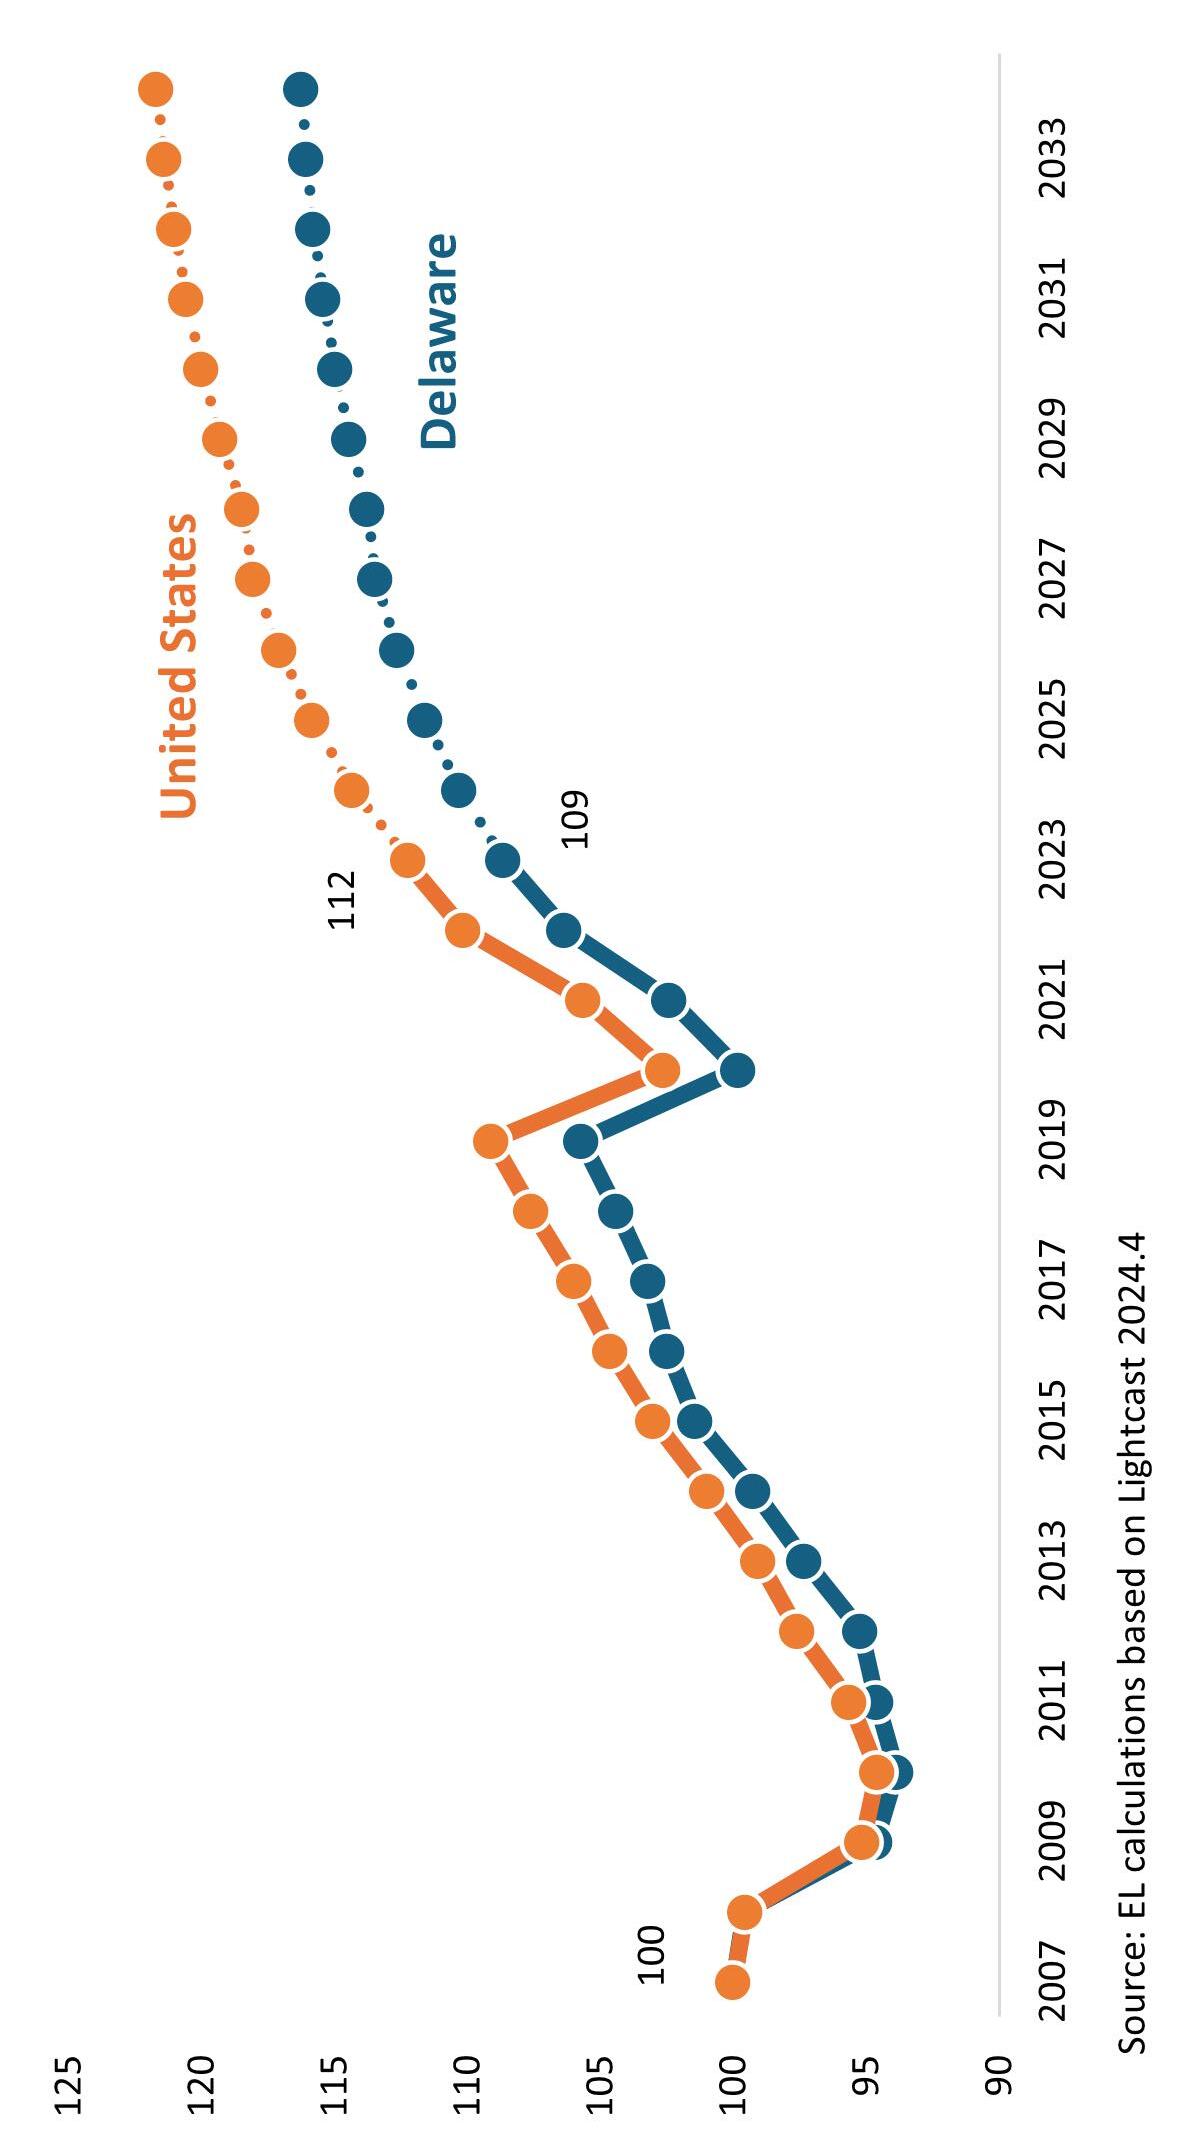
100 = 2007 Employment Levels
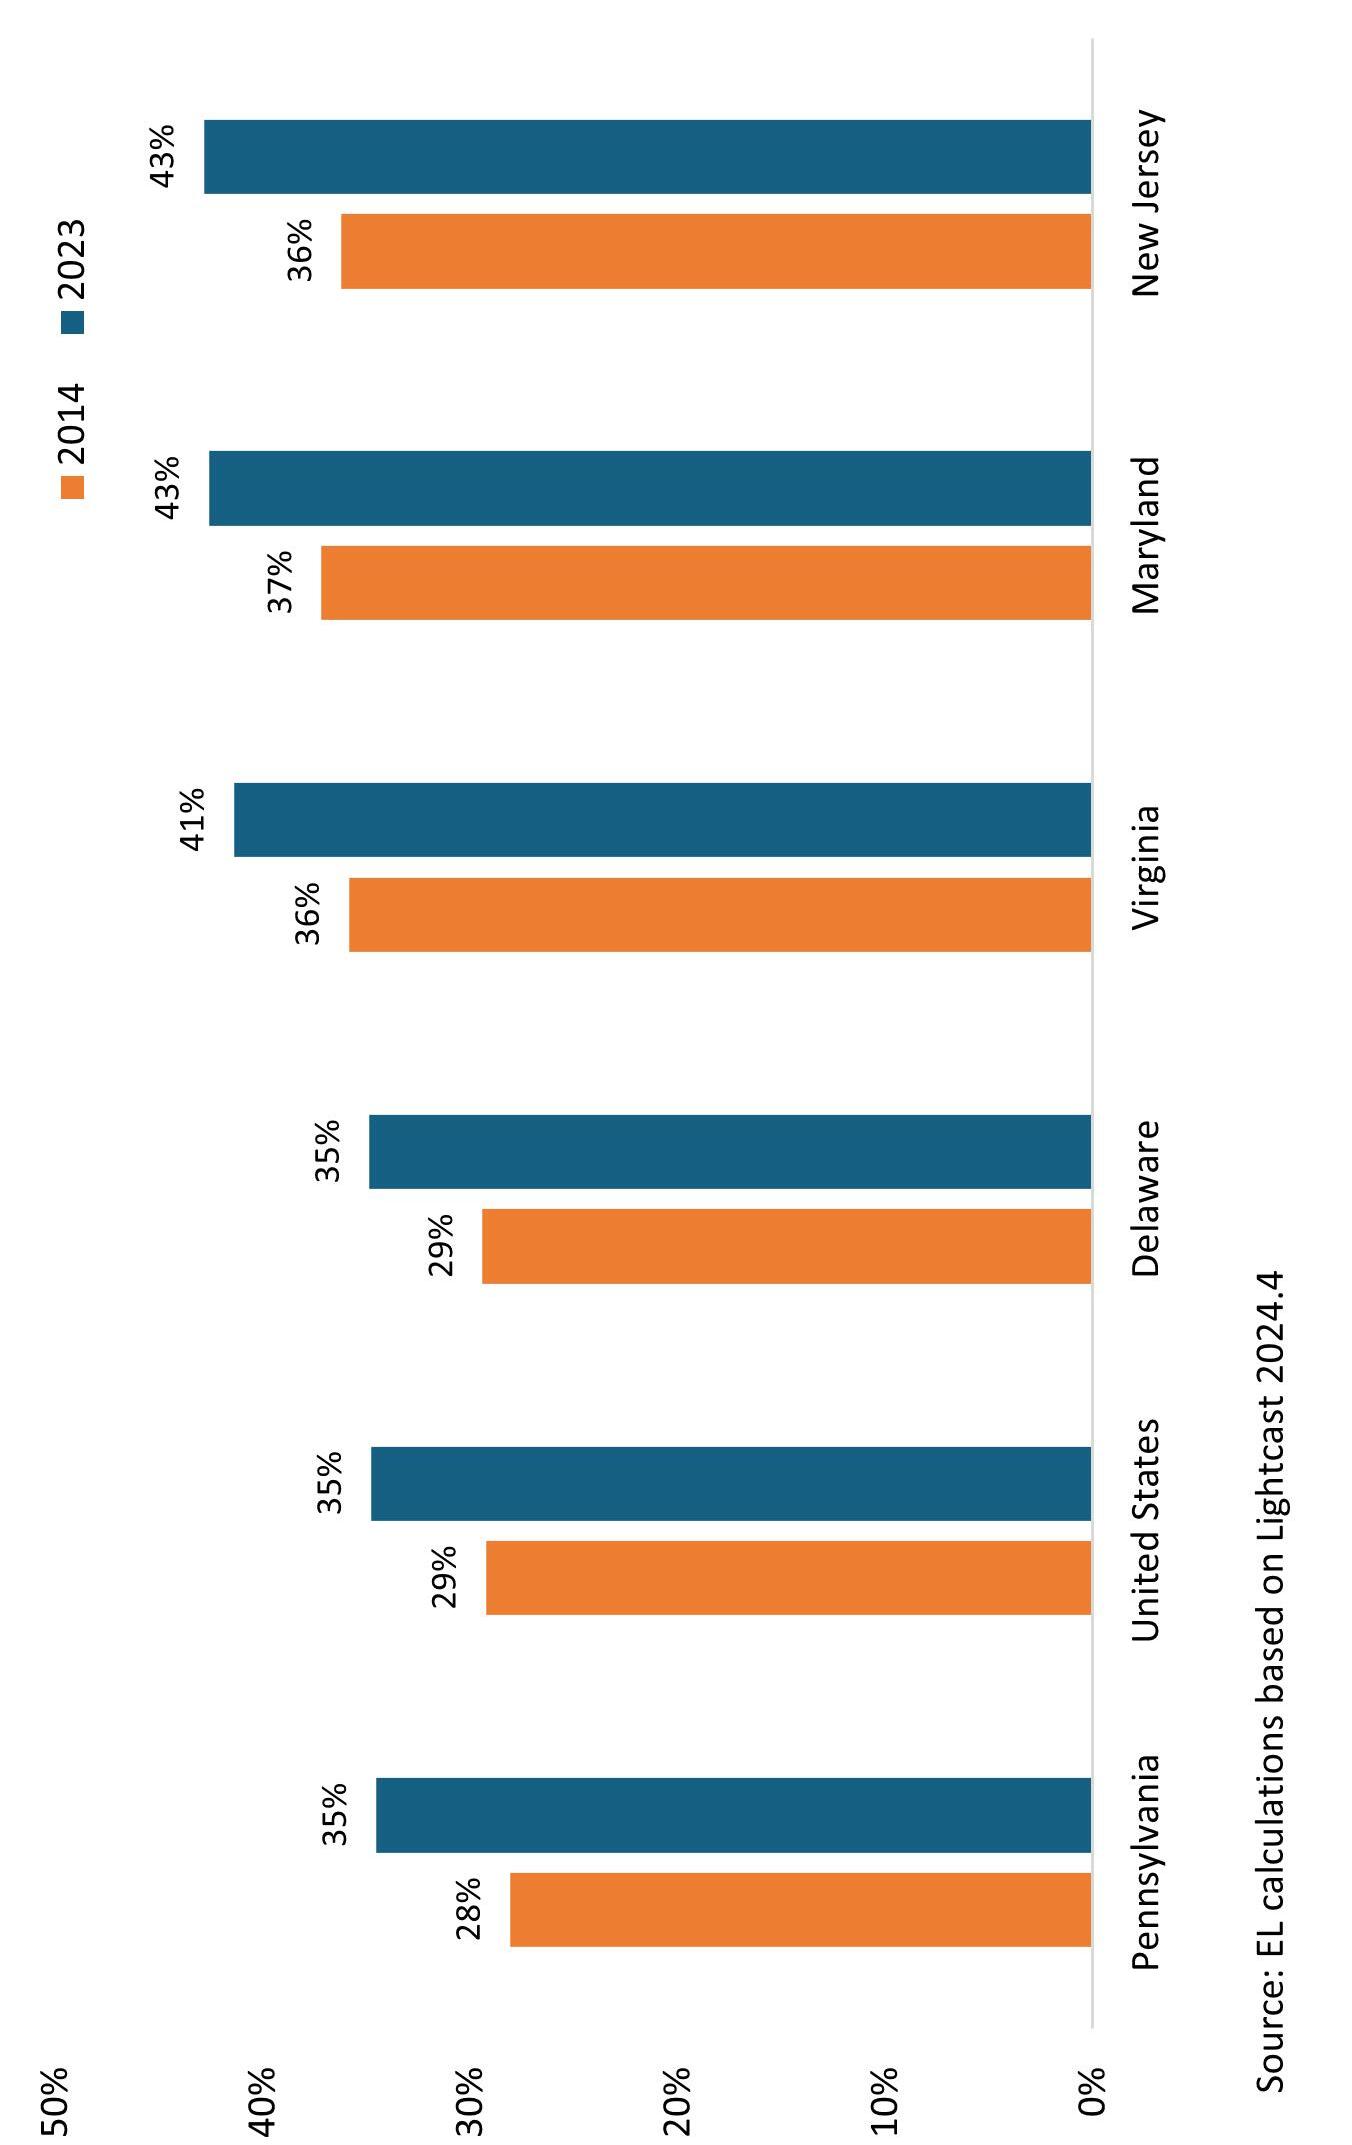
Percentage of Adult Population with a Bachelor’s Degree or Higher