


Welcome to the Detroit Regional Chamber’s 10th annual State of the Region report. Once again, we are pleased to partner with Citizens to provide this comprehensive analysis of economic and social progress – and our trajectory forward. Here are some key themes in this year’s State of the Region.
Economic Perception Disconnect: Despite a demonstrably strong economy –dramatically cooling inflation, record consumer spending levels, unemployment at or below 4%, and surprisingly strong GDP growth (including almost 5% in Q3 2023), voters continue to be pessimistic about economic conditions. Our statewide polling work with the Glengariff Group Inc. found that 69% of voters expect the economy to weaken and almost half think inflation will increase despite strong evidence to the contrary. Additionally, while consumer sentiment numbers rebounded modestly in 2023, they reached record lows in 2022.
Businesses in Good Position: Both nationally and throughout Michigan, business leaders report positive outlooks. U.S. large business leader confidence is up sharply, 56% to 73% year-over-year, 64% of small business owners report they are in “good health”, and perhaps most important for Michigan’s outlook is that new business applications recorded their second-best year – a strong indication of future economic growth.
Challenges Remain: Despite our strong assets, including 18 Fortune 500 company global headquarters (nine in the Detroit Region alone), we continue to shallow against peer regions. Key areas such as labor force participation and educational attainment continue to be challenges, as do equity gaps that harm both our economy and society – all of which can be tied in part to our state and Region’s lack of population growth.

 Sandy K. Baruah President and Chief Executive Officer, Detroit Regional Chamber
This 2024 report once again demonstrates the strength and fortitude of the Detroit Region in the face of evolving economic conditions.
Despite factors like higher interest rates and a labor strike that affected more than 50,000 workers, Michigan’s GDP grew more than 2% in every quarter of 2023, wages and salaries in the Detroit Region rose year-over-year, and unemployment remained near historic lows.
Inflation is a lingering concern for many residents in our area, but it is clear that the outlook is improving and the innovative and entrepreneurial spirit of our Region is alive and well. After all, business applications in Michigan reached their secondhighest level on record in 2023.
At Citizens, we have served clients in Detroit for many years, and we look forward to partnering with many of these new businesses to help them achieve their goals.
We also believe that for our businesses and economy to thrive, our communities must also thrive. That is why we are proud to partner with programs such as The Greening of Detroit, Year Up, Grow Detroit’s Young Talent, Great Lakes Women’s Business Council, and Gleaners Community Food Bank to support workforce development, financial empowerment, and a more diverse, equitable, and inclusive Detroit community.
As we look ahead, there are plenty of reasons to be optimistic, and Citizens will continue to serve as a trusted advisor to our clients and community partners as we strive together toward a brighter future for Detroit and our Region.
 Yasmeen Jasey
Michigan Market Executive, Citizens
Yasmeen Jasey
Michigan Market Executive, Citizens
2 detroitchamber.com/sor
Despite Continued Strong Economy, Disconnect Remains With Negative Perceptions
ECONOMIC CONDITIONS STRONG
increase in Michigan's GDP every quarter during 2023, with two quarters of remarkable national economic growth.
year-over-year increase in wages and salaries in the Detroit Region, maintaining recent elevated rates.
unemployment in the Detroit Region for 22 consecutive months.
SURVEYS INDICATE LINGERING NEGATIVITY
Nationally, consumer sentiment in 2023 sat 30 index points below its 2019 levels.
In the Detroit Regional Chamber’s December 2023 Michigan Voter Poll, 61% of respondents say they are doing better or the same economically as before the pandemic and 80% of employed respondents are not concerned about losing their jobs. Yet –
45%

increase in goods spending and 7% increase in services compared to 2019.
think the economy is weakening.
believe in ation will get worse in the next year.
of voters across all demographics believe the next generation will have a worse standard of living.
Michigan Voter Poll
Over the past several years, the Detroit Regional Chamber has worked with premier research firm and polling partner, the Glengariff Group Inc., on an ongoing series of perception polls of registered voters in Michigan. Highlights can be found throughout this report.
3
DEFINING THE REGION
RANKING
LARGEST POPULATION GROWTH
Livingston (7.3%)
Washtenaw (3.9%)
Oakland (3.7%)
LARGEST POPULATION DECLINE
Genesee (-3.9%)
Wayne (-2.2%)
Shiawassee (-1.9%)
The Detroit Region is a dynamic, united 11-county area encompassing more than 300 municipalities and 7,062 square miles with rich geographic, human, and business assets.
Home to more than 530,000 business locations, including nine Fortune 500 companies, 5.4 million people, and 34 educational institutions, the Detroit Region has a diverse economy, low cost of living, and a highly skilled workforce.
OVERVIEW
The 11-county Detroit Region’s population reached 5.4 million, an increase of 0.8% since 2012.
The city of Detroit’s population declined 11.6% over the past decade, dropping to 620,000 residents.
Michigan’s overall population grew 1.4% from 2012, totaling over 10 million in 2022.
4 detroitchamber.com/sor Source: U.S. Census Bureau’s American Community Survey One-Year Estimates, Lightcast POPULATION PERCENT CHANGE 2012-2022 < -1% -1% - 3% 3% - 7% > 7%
1 1 2 2 3 3
68,022 196,161 366,376 98,567 155,609 874,195 1,269,431 1,757,043 401,983 88,780 160,151
POPULATION
By County 2012-2022
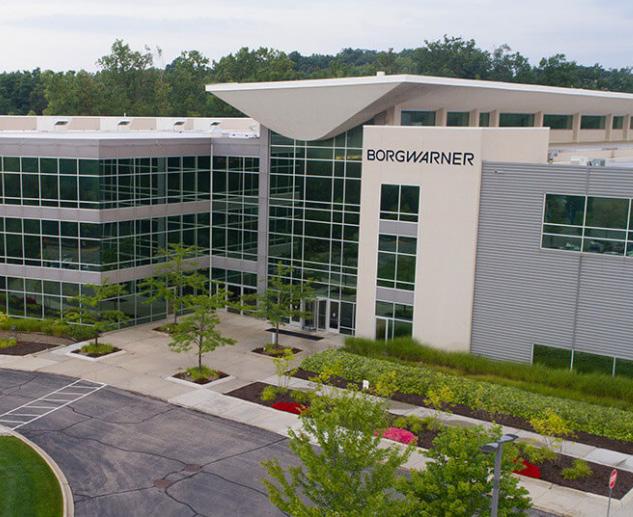
The Detroit Region is home to 98 of the 100 top automotive suppliers to North America, with 65 headquartered here, including BorgWarner’s global Propulsion Technical Center in Auburn Hills. Photo courtesy of BorgWarner.
POPULATION BY PEER REGIONS
In 2023, the State of Michigan created the Growing Michigan Together Council to support the state’s population growth, setting the goal to be a top-10 state for population growth by 2050. The Detroit MSA plays a major part in the goal’s success as it accounts for 43% of the state’s population.
While the Region’s population increased over the past decade, it only grew 1.0%, ranking 16th out of 20 peer regions.
The aging population is also a notable concern. In 2022, 18% of the Region’s population was 65 years or older, placing it as the fifth-oldest among peers. Respectively, the Region’s 20-39-year-old population increased 7.7%, while the over-65 population increased 30.2% since 2012.
According to the Citizens Research Council of Michigan, international immigration provides a consistent inflow to the population. The Region’s total population is 10% foreign born (15th) and has increased 17% over the past decade (12th).
5 PEER REGION POPULATION 2022 PERCENTAGE CHANGE (20122022) 20-39-YEAROLD GROWTH (2012-2022) GDP GROWTH (2018-2022) Austin 2,421,115 32.0% 30.7% 29.7% Nashville 2,046,828 20.1% 26.8% 20.8% Dallas 7,943,685 19.6% 19.8% 17.0% Charlotte 2,756,069 18.8% 48.0% 13.2% Phoenix 5,015,678 15.8% 18.2% 19.7% Tampa 3,290,730 15.7% 22.4% 18.8% Atlanta 6,222,106 14.3% 13.4% 10.2% Seattle 4,034,248 13.3% 21.3% 16.8% Denver 2,985,871 12.6% 21.5% 18.2% Indianapolis 2,141,779 11.0% 21.5% 11.2% Portland 2,509,489 9.6% 12.2% 9.3% Minneapolis 3,693,729 8.4% 9.9% 4.5% Boston 4,900,550 5.2% 10.2% 11.7% Baltimore 2,835,672 2.9% 2.2% 3.8% San Francisco 4,579,599 2.8% -0.5% 16.8% Detroit 4,345,761 1.0% 7.7% 3.1%
Louis 2,801,319 0.1% 1.0% 7.3% Cleveland 2,063,132 -0.1% 7.6% 5.8% Pittsburgh 2,349,172 -0.5% 4.8% -0.6% Chicago 9,441,957 -0.9% -1.9% 2.1% Source: U.S. Census Bureau’s American Community Survey One-Year Estimates, Lightcast
St.
POPULATION GROWTH RANKING Austin Nashville 1 2 3 16 20-39-YEAR-OLD GROWTH RANKING Charlotte Austin 1 2 3 14 Nashville Detroit GDP GROWTH RANKING Austin Nashville 1 2 3 18 Phoenix Detroit Dallas Detroit
JOBS BY INDUSTRY
Care, Government, Manufacturing, Retail , Top Four Industries in the Detroit Region
Of the 2.4 million people employed in the Detroit Region, 1.2 million or 50% are employed in the top four industries.
While jobs have recovered from pandemic lows, employment is still down 2.3% compared to 2019.
75% reported not having trouble finding a good paying job, and 66% reported good jobs are available in the market.
6 detroitchamber.com/sor
JOBS BY INDUSTRY
Source: Lightcast Note: Other includes Utilities, Agriculture, Forestry, Fishing and Hunting, and Mining and Oil and Gas Extraction industries.
Health
Detroit Region, 2023
G overnment 309,831 12.9% Retail Trade 240,292 10.0% Health Care and Social Assistance 329,928 13.7% Manufacturing 284,973 11.9% Professional, Scienti c, and Technical Services 221,758 9.2% Transportation and Warehousing 103,928 4.3% Wholesale Trade 92,230 3.8% Accommodation and Food Services 187,806 7.8% Administrative Support and Waste Management 142,120 5.9% Finance and Insurance 96,105 4.0% Construction 96,301 4.0% Management of Companies 53,927 2.2% Other Services (except Public Admin.) 94,195 3.9% Educational Services 35,304 1.5% Information 1.2% Arts 1.2% Other 0.7% Real Estate 36,558 1.5% Michigan Voter Poll
Source: Detroit Regional Chamber and the Glengariff Group Inc., December 2023 Voters Remain Confident in Employment Situation
FORTUNE 500 AND LARGEST PRIVATE COMPANIES
The Detroit Region is Home to Nine of Michigan’s 18 Fortune 500 Companies With Headquarters in the State
As the epicenter of the global automotive industry, Ford Motor Company and General Motors are among the top of the Fortune 500.
Stellantis, with its North American headquarters in Auburn Hills, employs almost 39,500 people in Southeast Michigan and earned $91.2 billion in revenue in 2022.
7
RANK HEADQUARTERED CITY 2022 REVENUE ($M) 19 Dearborn $158,057 21 Detroit $156,735 147 Bloomfield Hills $27,815 189 Southfield $20,892 212 Detroit $19,228 262 Auburn Hills $15,801 338 Detroit $10,690 429 Auburn Hills $8,842 436 Livonia $8,680
FORD MOTOR COMPANY GENERAL MOTORS PENSKE AUTOMOTIVE GROUP LEAR CORP. DTE ENERGY BORGWARNER ALLY FINANCIAL AUTOLIV MASCO RANK HEADQUARTERED CITY 2022 REVENUE ($M) 1 Bloomfield Hills $41,000 2 Southfield $4,814 3 Detroit $4,400 4 Novi $4,000 5 Warren $3,940 6 Plymouth $3,874 7 Detroit $3,603 8 Farmington Hills $3,200 9 Southfield $3,181 10 Highland $2,463
COMPANIES PENSKE CORP. BARTON MALOW HOLDINGS LLC
HOLDINGS INC. LINEAGE LOGISTICS LLC MOROUN FAMILY HOLDINGS PLASTIPAK HOLDINGS INC. WALBRIDGE H.W. KAUFMAN GROUP INC./BURNS & WILCOX LTD. PISTON GROUP LAFONTAINE AUTOMOTIVE GROUP Source: Crain’s Detroit Business Source: Fortune Media, 2023
FORTUNE 500 COMPANIES
LARGEST PRIVATE
IlITCH
KEY ECONOMIC INDICATORS

The real gross domestic product (GDP) measures economic activity by measuring the value of goods and services produced while adjusting for inflation.
U.S. economic growth has been remarkable in 2023, with two quarters of strong quarterly growth closing out the year.
Michigan’s GDP grew over 2% quarterly though 2023 at a much slower rate than the nation.
8 detroitchamber.com/sor
QUARTERLY REAL GDP United States and Michigan ANNUAL REAL GDP United States, Michigan, and Detroit MSA Source: U.S. Bureau of Economic Analysis Note: *Annual 2023 and Michigan Q4 2023 data not available at time of publication. 1.6% 1.9% 2.3% 3.0% 2.1% 0.2% 2.5% -0.1% -3.0% -2.2% -4.3% 5.8% 5.8% 5.9% 1.8% 2018 2019 2020 2021 2022* Michigan Detroit MSA United States -8% -4% 0% 4% 8% -8% -4% 0% 4% 8% Q1 2023 Q2 2023 Q3 2023 Q4 2023* 2.2% 2.2% 2.9% 4.9% 3.3% 1.4% 2.1% Michigan United States
U.S.
Demonstrating
Michigan’s economy continues to grow with low unemployment and increasing median household income. Photo courtesy of Kelly Services. UNITED STATES MICHIGAN 4.9% Q3 2023 2.9% Q3 2023 3.3% Q4 2023 14th Largest State Economy
REAL GDP
Economy
Strong Growth Through 2023, Increasing 3.3% in Q4 After Impressive 4.9% Q3 Growth
Down 2% in Detroit Region, Up 3% Nationally Since 2019
Total nonfarm employment continued to recover from its historic pandemic declines, increasing by 8.0% from December 2020 to December 2023.
Regional employment in several sectors remains below pre-pandemic levels in 2023. -9.8%
and
UNEMPLOYMENT RATE
Resilient Economy Keeps Unemployment
Near 4% in the Detroit Region
Unemployment in the Detroit Region stayed at or below 4% for 22 straight months, falling for the third consecutive year in 2023. Economists generally attribute an unemployment rate that hovers between 3% and 5% to a healthy economy.
Individuals with higher educational attainment continue to experience lower levels of unemployment throughout 2023. Unemployment for individuals with a bachelor’s degree held steady at 2.0%, over half that of those with just a high school diploma (4.3%).
Detroit Region
9
TOTAL NONFARM EMPLOYMENT
TOTAL
NONFARM EMPLOYMENT
MONTHLY UNEMPLOYMENT RATE Detroit MSA and United States 4.1% Detroit MSA 4.3% Michigan Monthly Unemployment Rate Dec. 2023 3.7% United States
U.S. Bureau of Labor Statistics Note: Not seasonally adjusted. December 2023 is preliminary. Source: Current Population Survey (CPS), Michigan Center for Data and Analytics, DTMB, U.S. Bureau of Labor Statistics Note: Seasonally adjusted. December 2023 is preliminary.
Source:
1,60 0,000 1,80 0,000 2,00 0,0 00 2,20 0,000 2,40 0,000 2,60 0,000 Jun. 2019 Jan. 2019 Number of Employees Nov 2019 April 2020 Sep. 2020 Feb. 2021 July 2021 Dec. 2021 May 2022 Oct. 2022 March 2023 Aug. 2023 Dec. 2023 1.83 M April 2020 2.41 M Jan. 2019 2.48 M Dec. 2019 2.44 M Dec. 2023 0% 5% 10% 15% 20% 25% Dec. 2019 April 2020 Aug. 2020 Dec. 2020 April 2021 Aug. 2021 Dec. 2021 April 2022 Aug. 2022 Dec. 2022 April 2023 Aug. 2023 Dec. 2023 8.3% Dec. 2020 3.7% Dec. 2022 4.7% Dec. 2021 Detroit MSA 4.1% Dec. 2023 United St ates 3.7% Dec. 2023 3.9% Dec. 2019 3.6% Dec. 2019
Leisure
Hospitality
-5.1% Manufacturing -2.5% Education and Health Services
MEDIAN HOUSEHOLD INCOME
Increased 22% in the Detroit Region Since 2017, Nearly Matching the National Growth of 24%
In 2022, the regional median household income was $71,265 – an increase of 6% from the 2021 estimate of $67,153.
AND
Growth Remains Elevated at 4.1% Year-Over-Year, Down From 5.1% in 2022
In the Detroit Region, wages and salaries for private industry workers increased at a 4.1% pace year-over-year.
The Detroit Region’s average weekly wages for private sector workers totaled $1,346 in 2022, increasing 16.5% since 2018.
United States and Detroit MSA
10 detroitchamber.com/sor
MEDIAN HOUSEHOLD INCOME
CHANGES IN WAGES AND SALARY FOR PRIVATE INDUSTRY WORKERS United States and Detroit CSA Source: U.S. Census Bureau, 2021 American Community Survey One-Year Estimates Note: The U.S. Census Bureau did not release American Community Survey 1-year estimates for 2020. Source: U.S. Bureau of Labor Statistics Note: Not seasonally adjusted. December 2023 is preliminary.
WAGES
SALARY
$60,513 $61,937 $60,336 $58,411 $63,474 $65,712 $69,717 $67,153 $71,265 Detroit MSA $74,755 United St ates $55,0 00 $60,0 00 $65,0 00 $70,0 00 $75,0 00 2017 2018 2019 2021 2022
+4.1% Detroit CSA +4.6% United States Q1 2019 Q3 2019 Q1 2020 Q3 2020 Q1 2021 Q3 2021 Q1 2022 Q1 2023 Q3 2022 Q3 2023 0% 2% 4% 6% $43,493
Median
Income
Black or African American $64,525 Hispanic or Latino, Any Race $112,804 Asian
Household
by Race 2022 $80,879 White
INFLATION IMPACTS

CONSUMER SENTIMENT
Hit Record Lows in 2022, Improved in 2023, Surged in January 2024
The 2023 annual sentiment reached levels last seen in 2008 during the Great Recession after dipping to a 60-year series low in 2022.
While consumer sentiment hit record lows in this period, recent monthly numbers notably rebounded, surging to 79.0 in January 2024.
Consumer Sentiment by Political Affiliation United States, December 2023
90.6 Democrat
64.5 Independent
57.0 Republican
Michigan Voter Poll
Consumer Sentiment Varies Greatly by Political Party in Michigan
52.5% of Leaning Republicans in the state say they are worse off economically than before the COVID-19 pandemic, compared to 31.5% of Leaning Democrats.
Source: Detroit Regional Chamber and the Glengariff Group Inc., December 2023
11 11
consumer sentiment, spending continues
increase. Photo courtesy of Amazon
Despite challenging
to
ANNUAL INDEX OF CONSUMER SENTIMENT United States Source: University of Michigan Note: Shaded areas indicate U.S. recessions defined by the NBER. Index 1996: Q1=100 40 60 80 100 120 2003 2001 2005 2007 2009 2011 2013 2015 2017 2019 2021 2023 63.7 2008 Dot-Com Bubble The Great Recession 98.4 2018 89.2 2001 59.0 2022 65.3 2023 COVID-19 Pandemic
CONSUMER SPENDING
Is Strong Despite Low Consumer Sentiment and Tightening Interest Rates
While consumers are pessimistic about the economy, they continue to spend strongly, amassing a record spending sum of $15.6 trillion.
The Federal Reserve Board began raising interest rates in March 2022 to ease inflation, raising rates 11 times before stabilizing with three consecutive meetings of unchanged rates since July 2023.
Nationally, credit card debt spiked to record balances in Q3 2023, with delinquency rates rising from 2021 historic lows.
Nationally, the personal savings rate has decreased to 4.0% as of Q3 2023, much lower than the 7.0% experienced in Q3 2019.
Michigan Voter Poll
Despite sour views toward the economy, voters have consistently expressed strong confidence in their own economic situations – 61% saying they are doing better or the same economically as before the pandemic. Source:
12 detroitchamber.com/sor
CONSUMER SPENDING VS. SENTIMENT United States
University of Michigan, U.S. Bureau of Economic Analysis Source: U.S. Bureau of Economic Analysis
Source:
Detroit Regional Chamber and the Glengariff Group Inc., December 2023 Voters Secure in Personal Economic Situations, Remain Negative on Economy Overall Dec. 2019 April 2020 Aug. 2020 Dec. 2020 April 2021 Aug. 2021 Dec. 2021 April 2022 Aug. 2022 Dec. 2022 April 2023 Aug. 2023 Dec. 2023 $15.6 T Consumer Spending 69.7 Consumer Sentiment 99.3 $14.1 T +69% Recreational Goods and Vehicles +10% Health Care +20% Furnishings and Durable Household Equipment +10% Food and Accommodations +20% Clothing and Footwear +6% Housing and Utilities $4.5 T +17% +2% $5.3 T $5.4 T $9.4 T +1% +6% $9.5 T $10.1T 2019 2021 2023 2019-2023 Goods 20% 7% Services CONSUMER SPENDING BY TYPE
CONSUMER PRICE INDEX
Inflation Has Cooled to 4.5% Year-Over-Year in the Region, Higher Than National Rate of 3.4%*
Consumer Price Index (CPI) spiked to a 40-year high in mid-2022, with inflation significantly leveling over 2023.
Cooling inflation does not necessarily translate to a decrease in prices of goods and services; items are still higher than pre-pandemic and continue to affect individual consumers.
2023,
Dec. 2019: $0.57 per lb.
Dec.
CONSUMER
PRICE INDEX
Detroit MSA
9.7%
All Items Peak
7.8%
Core Peak
5.5% Core (All Items Excluding Food and Energy) 4.5% All Items
THE BITTER TASTE OF RISING COSTS
Dec. 2019: $1.36 per lb.
Dec. 2023: $2.02 per lb.
Dec. 2019: $1.54 per dozen
Dec. 2023: $2.51 per dozen
Dec. 2019: $3.18 per gallon
Dec. 2023: $4.00 per gallon
13
U.S. Bureau of Labor Statistics Note: Not seasonally adjusted. Detroit MSA CPI is reported bimonthly. 12-Month Percentage Change 4.5% All Items 3.4% All Items 1.5% Food 2.7% Food -0.6% Energy -2.0% Energy 5.5% Core 3.9% Core DETROIT UNITED STATES
Source:
2023: $0.63 per lb. Bananas Bread Eggs Whole Milk
Dec. 2019: $1.42 per 16 oz.
Dec. 2023: $1.75 per 16 oz. Beer
+48% +63% +26% +23% +9%
12.0% 8.0% 4.0% 0.0% Dec. 2020 April 2021 Aug. 2021 Dec. 2021 April 2022 Aug. 2022 Dec. 2022 April 2023 Aug. 2023 Dec. 2023
0.7% 1.3%
Index
Change
the latest data available at time of publication.
Consumer Price
December
12-Month %
*December 2023 was
BUILDING PERMITS
Total Permits Decreased 23% in the Region Compared to 2022, Almost Double the National Decline of 12%
High interest rates impacted permits in 2023. Multifamily units decreased 42% compared to the previous year, while single-family units decreased 10%.
HOME PRICES
Increased 6.3% in Q3 , Surpassing the National Growth of 3.6%
14 detroitchamber.com/sor
TOTAL BUILDING PERMITS AUTHORIZED Detroit MSA MEDIAN SALE PRICE OF EXISTING SINGLE FAMILY HOMES United States and Detroit MSA Source: U.S. Census Bureau Note: Not seasonally adjusted. 2023 is preliminary. Source: Federal Reserve Bank of New York Source: National Association of REALTORS Note: Not seasonally adjusted. Q3 2023 is preliminary. Source: Freddie Mac, National Association of Realtors, S&P Dow Jones Indices
2019 2020 2021 2022 2023 5,193 5,666 4,698 2,620 5,193 7,813 7,165 8,598 8,065 6,197 1,972 2,932 3,367 4,246 1,951 Multifamily Units Single-Family Units 2020 2021 2022 2023 Q1 2023 Q2 2023 Q3 $100,0 00 $20 0,0 00 $30 0,0 00 $40 0,0 00 $50 0,0 00 $30 0,20 0 $357,100 $245,70 0 $392,80 0 $371,000 $402,50 0 $406,90 0 United St ates $266,60 0 Detroit MSA $265,30 0 $227,000 $250,90 0 $221,30 0 2.2% 2019 0.1% 2021 5.0% 2023 Average effective federal funds rate, the rate at which the Federal Reserve Bank sets
banks to borrow and lend money, reached
20-year high in 2023. Average Mortgage Rate United States Median Days on Market Detroit MSA Active Housing Inventory Detroit MSA Case-Shiller Home Price Index Detroit MSA 3.9% 2019 46 Days 2019 126.9 2019 13,500+ 2019 6.8% 2023 42 Days 2023 168.9 2023 6,900+ 2023 2019 2020 2021 2022 2023 5,193 5,666 4,698 2,620 5,193 7,813 7,165 8,598 8,065 6,197 1,972 2,932 3,367 4,246 1,951 Multifamily Units Single-Family Units
for
a
NEW BUSINESS APPLICATIONS
Up 56% From Pre-Pandemic Levels , Michigan’s Second-Strongest
Year on Record
New business applications are a leading indicator of future economic growth and entrepreneurial activity. In Michigan, applications remain high, increasing 6.8% year-over-year, suggesting sustained economic conditions for growth.
Michigan ranked 21st for business applications per capita in 2023. Out of nearly 148,000 applications in 2023, over 10% are businesses with planned wages, contributing to job creation throughout the state.


Gig work varies by demographic groups, with the largest shares including 13.8% of 18-29-year-old respondents, 11.7% of Black respondents, and 9.3% of women indicating they have a gig job.
15
NEW BUSINESS APPLICATIONS Michigan TOP BUSINESS APPLICATIONS BY INDUSTRY SECTOR United States Source: U.S. Census Bureau Note: Not seasonally adjusted. 2007 2009 2011 2013 2015 2017 2019 2023 2021 40,0 00 80,0 00 120,00 0 160,00 0 Number of Applicants 79,480 2007 94,760 2019 147,755 2023 151,880 2021 PROFESSIONAL, SCIENTIFIC, AND TECHNICAL SERVICES CONSTRUCTION ADMINISTRATIVE AND SUPPORT AND WASTE MANAGEMENT Increased Federal Investments Rise of Gig Economy Growth in Black, Female, and Hispanic Entrepreneurship Shift in Consumer Habits and Economic Demands Factors Driving the Surge in New Business Applications
Michigan Voter Poll
Source: Detroit Regional Chamber and the Glengariff Group Inc., December 2023
of Michigan Voters Have a Gig Job
6.2%
WHAT BUSINESS LEADERS ARE THINKING

U.S. CEOs’ PERCEPTIONS
Improving Confidence as Business Leaders Optimistic Interest Rate Hikes to End
A sense that inflation is under control led to a positive end to 2023, with 42% of leaders expressing that conditions will improve 12 months out, among the highest levels of 2023.
In 2023, leaders navigated inflation, interest rate increases, labor shortages, and bank failures. Concerns going into 2024 include persistent inflation, a tight labor market, geopolitical turmoil, and an unpredictable stock market.
project increases up from 56% in November 2023.
expect increases, reversing a downward trend since mid-2023.
CAPITAL EXPENDITURES HIRING
expect increases after two months of decline.
project increases up from only 37% in October 2023.
16 detroitchamber.com/sor
Chief Executive’s
Confidence Index, December 2023
73% 44% 63% 49% Source:
CEO
Austan Goolsbee, Federal Reserve Bank of Chicago’s President and Chief Executive Officer, at the Detroit Economic Club with Sandy K. Baruah, Detroit Regional Chamber President and Chief Executive Officer and the Chicago Fed’s former Detroit Branch Board Chair.
Photo courtesy of the Detroit Economic Club / Jeff Kowalsky.
REVENUE PROFITS
SMALL BUSINESS INDEX
Concerns About Inflation Remain Top Challenge – By Far
For the sixth consecutive quarter, over 50% of small businesses cite inflation as the most significant challenge they are facing, with no other concern coming close to this level – revenue (22%), rising interest rates (19%), or supply chain issues (17%).
In Q4 2023, small business confidence dropped eight points from Q3 (69.2 to 61.3), returning to levels seen in early 2023 and 2022.
believe their business is in good health, stable from the previous quarter’s levels, and consistent with the previous year.
of all small businesses agree it is challenging to keep up with existing employees’ salary expectations.
MANUFACTURING PMI
Contracted Throughout 2023 After 30 Months of Consecutive Growth
The 2023 U.S. manufacturing sector experienced the longest stretch of contraction since the Great Recession.
Nationwide UAW strikes at Ford Motor Company, General Motors, and Stellantis assembly plants likely affected the purchasing and supply chain networks just as the Manufacturing PMI reached a 2023 high of 49.0.
believe the U.S. economy is in good health, down eight percentage points from the previous quarter, but similar to readings from late 2022 and early 2023.
of those who have searched for talent in 2023 say it is hard to find candidates with the experience or skills their business needs.
MANUFACTURING PMI ®
of small businesses say they plan to offer more flexible working hours over the next year to attract new talent.
17
Source: U.S. Chamber of Commerce and MetLife, Inc., Q4 2023 Small Business Index Source: Institue of Supply Management ® Yet
United States
Only
30 % 40 % 50 % 60 % 70 % 48.7% 41.7% A value above 48.7% indicates an expansion of the manufacturing sector. March 2020 Dec. 2019 June 2020 Sep. 2020 Dec. 2020 March 2021 June 2021 Sep. 2021 Dec. 2021 March 2022 June 2022 Sep. 2022 Dec. 2022 March 2023 June 2023 Sep. 2023 Dec. 2023 64.7% 47.4%
EDUCATION AND TALENT
Michigan Voter Poll
Voters Question Four-Year Degree Value But Support Additional Education, Training After High School
Only 27.5% of Michigan voters say a four-year degree was worth the money. However, 80% support state financial aid for two additional years after high school for skills training, community college, or college for every student in Michigan.
90% of Michigan voters aged 18-29 with only a high school diploma are open to an additional two years of free education or training.
Source: Detroit Regional Chamber and the Glengariff Group Inc., March 2023 and May 2023
EDUCATIONAL ATTAINMENT
Detroit Region Lags Peers and Nation in Educational Attainment Despite 3.1 Percentage Point Gain
The Detroit Region’s educational attainment increased by 3.1 percentage points from 2018 to 2022, continuing to lag peer regions and the national average.
Among working-age adults in the Region, 492,000 have some college credit but no degree, which is the highest share (22%) among peer regions.

EDUCATIONAL ATTAINMENT

18 detroitchamber.com/sor
Associate Degree or Higher, Population 25-64 Years Old
Source: U.S. Census Bureau Note: Short-term credentials not included.
Boston 40% 45% 50% 55% 60% 65% Austin Minneapolis Seattle Pittsburgh Atlanta Chicago Nashville St. Louis Cleveland United States Detroit 2022 2018 61.7% 59.9% 57.6% 58.6% 54.5% 52.1% 51.4% 51.0% 50.8% 47.7% 46.3% 59.5% 53.5% 51.4% 49.2% 48.7% 45.6% 47.3% 44.5% 43.2% 46.5% 43.2% 54.8% 56.2%
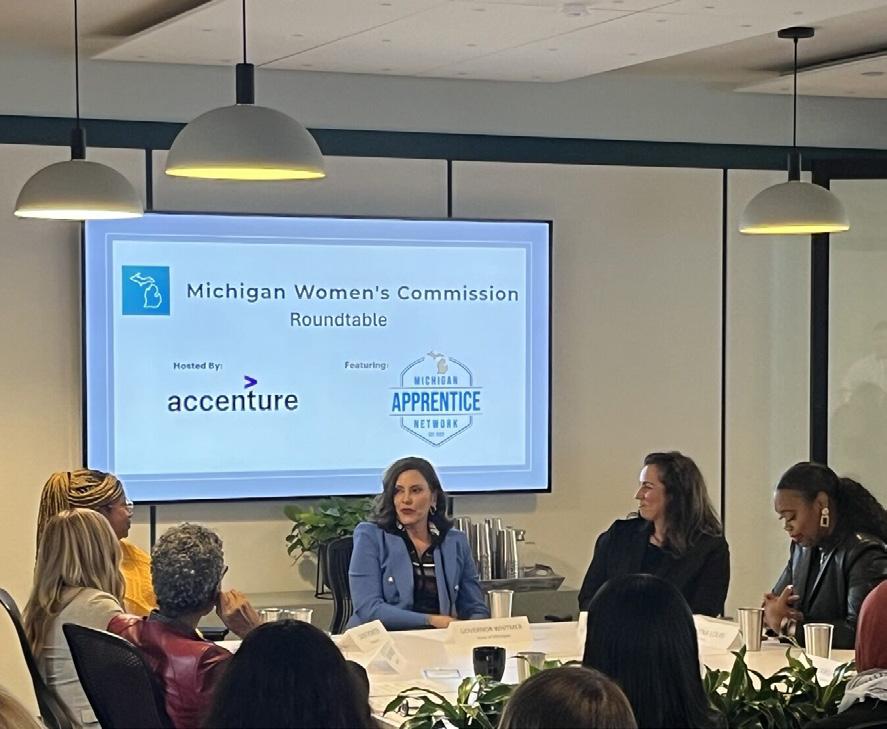
Accenture and the Michigan Women’s Commission hosted Gov. Gretchen Whitmer for the launch of the Women in Apprenticeships roundtable series. Photo courtesy of Accenture.
Michigan’s December 2023 Rate Reached 14-Year High of 62.2%

Michigan’s labor force participation rate improved by 2.5 percentage points year-over-year in December 2023, but sits in the bottom third of the nation, ranking 39th among states in 2022.

19
FORCE PARTICIPATION: MICHIGAN
LABOR
LABOR FORCE PARTICIPATION RATE
2022 Source: U.S. Bureau of Labor Statistics Note: Seasonally adjusted. 87.8% Bachelor’s Degree or Higher 63.5% United States 68.8% Hispanic or Latino, Any Race 80.2% Some College or Associate Degree 61.6% Michigan 69.3% High School Graduate 62.6% Detroit MSA 67.5% Asian 62.5% White 59.8% Black
By
and Ethnicity Detroit
Detroit
Annual Labor Force Participation 2022 AUSTIN BOSTON M I NNEAPOLIS SEATTLE A TLANTA C HICAGO S T. LOUIS TINU E D STATES C LEVELAND P I T TSBURGH DETROIT 72% 70% 69% 69% 68% 67% 65% 64% 63% 63% 63%
United States and Michigan BY SELECTED PEER REGIONS
or African American
Race
MSA, 2022 By Educational Attainment
MSA, 2022
56% 58% 60% 62% 64% April 2019 Dec. 2018 Aug. 2019 Dec. 2019 April 2020 Aug. 2020 Dec. 2020 April 2021 Aug. 2021 Dec. 2021 April 2022 Aug. 2022 Dec. 2022 April 2023 Aug. 2023 Dec. 2023 61.8% Dec. 2018 63.0% 62.2% Dec. 2023 62.5% Michigan United States Source: U.S. Census Bureau, 2022 American Community Survey LABOR FORCE PARTICIPATION: DETROIT REGION
Ranked Ninth Among Peers , the Detroit Region Lags by Nearly 10 Percentage Points
JOB POSTINGS S
Fall 39% Year-Over-Year as Labor Demand Cools
Regional job postings have declined more than 53% from March 2022, a peak of more than 234,000. In December 2023, job postings reached a low of almost 110,700, declining 39% year-over-year.
The health care industry remains the Detroit Region’s largest hiring industry, with registered nurses being the top occupation in demand.
JOB POSTINGS
Detroit Region

TOP JOB POSTINGS BY OCCUPATION
REGISTERED NURSES
37,280
RETAIL SALES
22,739
Source:
TOP JOB POSTINGS BY INDUSTRY
HEALTH CARE AND SOCIAL ASSISTANCE
106,623
ADMINISTRATIVE AND SUPPORT; WASTE MANAGEMENT AND REMEDIATION SERVICES
75,020

RETAIL STORE MANAGERS
15,873
RETAIL TRADE TRUCK DRIVERS
13,823
PROFESSIONAL, SCIENTIFIC, AND TECHNICAL SERVICES
72,366
65,575
SOFTWARE DEVELOPERS
13,260
MANUFACTURING
62,152
20 detroitchamber.com/sor
Lightcast
Lightcast
January-December
Source:
Note: Unique postings are from
2023.
10 0,000 50,000 150,000 20 0,000 250,000 April 2020 Dec. 2019 Aug. 2020 Dec. 2020 April 2021 Aug. 2021 Dec. 2021 April 2022 Aug. 2022 Dec. 2022 April 2023 Aug. 2023 Dec. 2023 161,839 Dec. 2019
March 2022 110,677 Dec. 2023
234,319
REMOTE WORK AND DAILY DOWNTOWN WORKERS
Downtown Worker Rates Continue to Greatly Lag Behind Recovering Visitors Rate
According to the Downtown Detroit Partnership, 2023 trends showed a continued increase in visitation, bolstered by the return of significant inperson events that drew large numbers.
Nationally, Gallup has reported the trends in work flexibility are here to stay according to leaders of large companies. Five in 10 remote-capable employees are working hybrid, with another three in 10 exclusively remote and two in 10 working entirely on-site.
Regional Office Vacancy Rates 2.1 Percentage Points
Below the Nation

The Detroit Region’s office vacancy rates remain high in 2023, increasing 2.7 percentage points since 2019. Industrial vacancy rates held steady at 3.8%, signaling a demand for industrial spaces.
21
OFFICE AND INDUSTRIAL VACANCY RATES
OFFICE AND INDUSTRIAL VACANCY RATES Detroit Region AVERAGE DAILY DOWNTOWN DETROIT ACTIVITY Visitors 83,629 Dec. 2023 Workers 27,280 Dec. 2023 Dec. 2019 April 2020 Aug. 2020 Dec. 2020 April 2021 Aug. 2021 Dec. 2021 April 2022 Aug. 2022 Dec. 2022 April 2023 Aug. 2023 Dec. 2023 0 50,0 00 10 0,0 00 150,0 00 10 0,685 Dec. 2019 58,999 Dec. 2019 Source: Placer.ai, Compiled by the Dowtown Detroit Partnership Source: CoStar, compiled by the Detroit Regional Partnership
Share of Workers Working fFrom Home Detroit MSA 4% 2019 16% 2022 20% 2021 Source: U.S. Census Bureau, American Community Survey 8.7% 3.7% 4.3% 4.0% 3.8% 3.8% 9.6% 10.5% 11.6% 11.4% 2019 2020 2021 2022 2023 0% 4% 8% 12% 16% Industrial Office Vacancy Rates 2023 3.8% 11.4% 5.7% 13.5% Detroit Region Industrial Office United States Downtown Detroit Activity Dec. 2019
Dec. 2023 Dec.
Dec. 2023
to
2021 to
Growing Our Population
Michigan’s House
is On Fire, said Sandy K. Baruah on the severity of the state’s population crisis.

In 2023, the State of Michigan created the Growing Michigan Together Council to support the state’s population growth and become a top-10 growth state by 2050. The Council released a report with recommendations to address these challenges in December 2023.
The Council’s Three-Element Cycle of Virtuous Growth
Develop an economic growth plan that establishes Michigan as the innovation hub of the Midwest and puts the state in the top 10 for median income
Create a lifelong K-14 education system that makes the state an education leader
Foster thriving, resilient communities that attract young talent and improve net talent migration
Today Michigan Ranks:
49th in Population Growth
Population increased 1% compared to 18% nationally from 2000 to 2020.
Source:
37th in Median Household Income
The average household income was $66,986 in 2022, or 90% of the national average ($74,755)
35th in Educational Attainment
39th in Labor Force Participation
51.1% of 25-64-yearold Michiganders have a postsecondary degree or credential, lagging behind the 2022 national average of 54.3%
Michigan’s labor force participation rate (61.6%) was 1.9 percentage points below the national average (63.5%) in 2022.
22 detroitchamber.com/sor
Citizens Research Council of Michigan, Lumina Foundation, U.S. Census Bureau, American Community Survey 1-Year Estimates
Let’s Detroit hosted a networking event and panel focused on women leading in tech and provided an opportunity for talent in the area to learn more about regional careers in the high-tech industry. Photo courtesy of Let’s Detroit.
With more than 4.3 million people in the Detroit MSA and nearly half of Michigan’s population concentrated in the 11-county Detroit Region, the Region plays a vital role in becoming a top state by 2050. But where does it stand today? Benchmarking the Detroit MSA to 19 other peer and aspirational regions to key indicators can inform where the Region can improve to meet the Council’s Three-Element Cycle of Virtuous Growth.
Detroit Plays a Vital Role in Becoming a Top State by 2050
Peer Region Comparisons
Michigan Voter Poll
26% of Michigan Residents Aged 18 to 29 Years Old See Themselves Living Somewhere Other Than Michigan in the Next Decade
Fundamentals such as housing costs, reliable infrastructure, low crime rates, affordable higher education, and thoughtful placemaking emerged as decision-making factors for Michigan’s young residents when considering where to locate. Getting those factors right is integral to improving Michigan’s competitiveness and attracting and retaining population.
23
Young Adult Population Growth % Change 2012-2022, 20-39-Year-Olds Educational Attainment Associate or Higher 25-64-Year-Olds, 2022 Public Transit Performance Score Based on a one to 10 scale Median Household Income Growth 2018-2022 Cost of Living Index 2022 Homeownership Rate Under 30 Years Old Detroit 7.7% Peer Rank 14th U.S. 7.0% Top Region 48.0% Detroit 46.3% Peer Rank 19th U.S. 46.5% Top Region 62.7% Detroit 17.8% Peer Rank 15th U.S. 20.7% Top Region 28.6% Detroit 104.3 Peer Rank 11th U.S. 100 Top Region 86.3 Detroit 48.7% Peer Rank 1st U.S. 36.6% Top Region 48.7% Detroit 2.8 Peer Rank 16th U.S. 2.8 Top Region 6.8 Charlotte San Francisco San Francisco Detroit St. Louis Phoenix
Detroit Regional Chamber and Business Leaders for Michigan’s Survey of Michiganders Ages 18-29, September 2023 Source: U.S. Census Bureau, AllTransit Center for Neighborhood Technology, Council for Community and Economic Research, Lumina Foundation
Source:
RACIAL JUSTICE AND ECONOMIC EQUITY

POPULATION BY RACE AND ETHNICITY
In 2022, the Detroit Region’s population was 65% white residents, with Black or African American residents accounting for 21% and Latino or Hispanic and Asian residents at 5% each.
The Region has a higher share of Black or African American population compared to the national share of 12%.
DATA NOTE: Census Classification Changes Integrated in 2024 Report
In 2020, the U.S. Census Bureau broadened options for respondents to identify their race and ethnicity to reflect a more complete picture of the U.S. population. Due to the significant changes, comparisons to previous years will not be included in this report.
SHARE OF POPULATION BY RACE AND ETHNICITY
Detroit MSA
Total Population
4,345,761
5% Asian
21% Black or African American
5% Hispanic or Latino
Source: U.S. Census Bureau, 2022 American Community Survey 1-Year Estimates
Note: Hispanic or Latino are of any race. Percentage does not add to 100%.
65% White
7%
Two or More Races
2%
Some Other Race
24 detroitchamber.com/sor
Outdoor recreational resources like the Dequindre Cut create community spaces and attract diverse audiences for events like Detroit Harvestfest.
Photo courtesy of the Detroit Riverfront Conservancy.
EDUCATIONAL ATTAINMENT
Stark Disparities Persist in Educational Attainment
Among Racial and Ethnic Groups
Detroit Regional Chamber Educational Attainment Goal: 60% Attainment by 2030 and Halve the Racial Equity Gap Associate Degree or Higher (Including Short-Term Credentials)
HOMEOWNERSHIP RATE
Black Homeowners and Buyers Have Disproportionately Higher Denial Rates, Lower Homeownership Rate
25
35.7% 34.5% 66.2% 37.3% 26.3% 19.1% 1.3% 2.6% 3.4% United States Bachelor’ s Degr ee or Higher Detroit MSA Asian White Black or African American Hispanic or Latino, Any Race 0.0% 20% 40% 60% 80% 65.2% 71.5% 80.3% 67.8% 61.4% 46.5% 1.3% 2.6% 3.4% United States Homeownership Rate Detroit MSA White Asian Black or African American Hispanic or Latino, Any Race 0.0% 25% 50% 75% 10 0% BACHELOR’S DEGREE OR HIGHER Population 25
Older, Detroit MSA
and
HOMEOWNERSHIP
Detroit MSA
U.S.
Survey, 1-Year Estimates Source: U.S. Census Bureau, 2022 American Community Survey, 1-Year Estimates Source: National Associations of Realtors Equity Gap 18.9% 60.0% Goal 53.0%* 2022 50.6% 2018 37.4% Black or African American 2022 56.4% White 2022 100% 9% Asian 9% Hispanic 11% White 22% Black Denial Rates for Applicants Michigan 2021 *2022 is the latest data available at time of publication.
RATE
Source:
Census Bureau, 2022 American Community
CENTER ON BLACK VOICES PARTNERSHIP
In 2023, the Detroit Regional Chamber and the Gallup Center on Black Voices released the Detroit Resident Voices Survey Report, highlighting Detroiters’ daily experiences and perceptions. The survey is designed to elevate issues central to Detroiters’ quality of life and provide insights that can be used in the public, private, and philanthropic sectors to develop new programs and initiatives to identify and close equity gaps. The Detroit Resident Voices Survey is part of the Chamber’s Racial Justice and Economic Equity Initiative, reflecting its commitment to generating new data and research on racial disparities and the experiences of Detroit’s Black community.
Detroit Resident Voices Survey Report: Key Findings
Wellbeing
Detroit city residents are less likely than residents of the suburbs to rate their lives highly enough to be considered thriving.
Education and Employment Opportunities
Job availability satisfaction varies with substantial gaps among city and suburban residents.
Health and Healthcare
Half of Detroit city residents are satisfied with the availability of quality health care services in their area, compared to three-fourths of Americans overall.
Social Capital and Social Opportunities
Detroiters are not optimistic about social cohesion in their neighborhoods but feel like they have social networks to rely on.
To inquire about the report’s findings and future efforts from the Detroit Regional Chamber and the Gallup Center on Black Voices, please contact:
Marnita Harris
Vice President of Racial Justice and Economic Equity
Detroit Regional Chamber
mharris@detroitchamber.com
detroitchamber.com/equity
Neighborhood Environment and Living Conditions
Access to services and amenities is considerably higher among Detroit suburban residents than among Detroit city residents.
Crime and Policing
Most Detroit city residents would welcome closer police community relations.
40% of Detroit city residents give life evaluations that classify them as “thriving”
39% of Detroit city residents are satisfied with the availability of good jobs
51% of Detroit city residents are satisfied with the availability of quality health care in their area
35% of Detroit city residents agree that people in their community care about each other
27% of Detroit city residents have easy access to extracurricular activities for children and teenagers
59% of Detroit city residents would like the police to spend more time in their area
52% Detroit suburban residents
72% Detroit suburban residents
76% United States
68% of Detroit city residents have relatives or friends to count on in times of trouble
61% Detroit suburban residents
30% United States
26 detroitchamber.com/sor
INFRASTRUCTURE AND THE ECONOMY
Michigan received an overall grade of C- on the 2023 Michigan’s Infrastructure Report Card, the same rating as the national infrastructure report card. Despite improving from the previous report’s D+ rating in 2018, infrastructure maintenance and age remain challenges, like other states throughout the Midwest. Michigan continues to enact an efficient and judicious infrastructure improvement plan in response to these factors, with commitments from the Bipartisan Infrastructure Law and Inflation Reduction Act.
27
Source: American Society of Civil Engineers, 2023 Infrastructure Report Card
The Innovate Mound project, located in Macomb County, has reached completion as one of the most technologically advanced roadways in the U.S. The project to reconstruct this modernized roadway was led by the Macomb County Department of Roads with HNTB Corporation.
AVIATION TRANSIT PUBLIC PARKS BRIDGES RAIL DRINKING WATER WASTEWATER ENERGY DAMS ROADS STORMWATER C CC D+ C D+ C D CD D D+ 2018 C2023 Michigan Overall Ranking Improved 2023 REPORT CARD FOR MICHIGAN’S INFRASTRUCTURE
Photo courtesy of HNTB.
ROAD QUALITY AND FUNDING
One-Third of Regional Roads in Poor Condition , Steady
From Previous Year
Despite a 26% increase in road funding since 2018, the Detroit Region’s road conditions still have a long way to go, with only 24% reported in good condition – a one percentage point increase from 2021.
2022 PAVEMENT CONDITIONS
Detroit Region
Good
Fair
Source: Michigan Transportation Asset Management Council Reporting Dashboard
Poor
Down 41% in Region, Compared to 2019
Ridership remains well below 2019 levels, despite annual increases since 2020, including a 16% increase in 2023.
Transit Ridership
Detroit Region November Year-to-Date
Michigan Voter Poll
Michigan Voters Want Leaders to Get the Fundamentals Right DDOT and
990,000+ Trips
410,000+ Trips
66% of Michigan voters support investment in education and infrastructure over cutting taxes.
Nearly 50% of Michigan voters consider the state’s infrastructure to be a disadvantage.
Source: Detroit Regional Chamber and the Glengariff Group Inc., December 2023
PUBLIC TRANSIT RIDERSHIP
All Modes, Detroit Region
28 detroitchamber.com/sor
24%
43%
33%
PUBLIC TRANSPORTATION RIDERSHIP
Source: National Transit Database +16% 2022 to 2023
-44% 2019
to 2023
2019 Feb. Jan. March April May June July Aug. Sep. Oct. Nov Dec. 0 1M 2M 3M 4M 5M 6M 2020 2021 2022 2023
SMART Monthly Ridership
SMART -47% -48% Decrease from Nov. 2019
from Nov. 2019
November 2023 DDOT
Decrease
EXPORTS
Remain Down 1.6% Over Pre-Pandemic Levels in the Detroit Region
Detroit Region’s export value is ranked 10th among all U.S. metropolitan areas, decreasing over the past decade.
Transportation equipment exports from the Detroit Region lead the nation at $23.4 billion, nearly matching pre-pandemic levels. However, it steadily decreased from $36.6 billion, or 36%, a decade earlier in 2012.
Detroit Metropolitan Wayne County Airport passenger amount grew 12% in 2023 compared to 2022, despite being down 15% of pre-pandemic levels. #1
Detroit
Wayne County Airport is ranked the #1 mega airport in J.D. Power 2023 North American
29
ANNUAL EXPORT VALUE
Source: International Trade Administration
Detroit MSA
DETROIT REGION’S EXPORT VALUE AND RANKING YEAR EXPORT VALUE RANKING 2022 $40.4B #10 2018 $44.1B #6 2012 $55.4B #4 2018 2019 2020 2021 2022 All Exports Transportation Equipment Exports $10 B $20 B $30 B $40 B $50 B $24.7 B $23.9 B $23.4 B $16.7 B $19.6 B $44.1 B $41.1 B $30.7 B $35.4 B $40.4 B DETROIT METRO AIRPORT PASSENGERS Airport Travel Remains Down 15% Over 2019 Levels MONTHLY AIRPORT PASSENGERS Detroit Metropolitan Wayne County Airport Source: Wayne County Airport Authority 36.7 M 2019 28.2 M 2022 31.4 M 2023 Total Passengers Detroit Metropolitan Wayne County Airport
2019 Feb. Jan. March April May June July Aug. Sep. Oct. Nov Dec. 0 1 M 2 M 3 M 4 M 2020 2021 2022 2023
Metropolitan
Airport Satisfaction StudySM
ELECTRIC VEHICLE (EV) LANDSCAPE
Despite Public Perception, EV Sales Continue to Grow
The U.S. market had 60+ battery electric vehicle (BEV) models in 2023, up from 12+ in 2020. EV sales grew over 50% in 2023 - the fastest growing segment in the U.S. market.
Michigan’s 4% EV market share is still significantly lower compared to leaders like California (26%), Washington DC (19%), Washington (18%), and Oregon (15%).
TOP
1 Georgia 18.9% $22.0B
2 Michigan 18.8% $21.9B
3 North Carolina 15.4% $17.9B
4 Indiana 9.5% $11.1B
5 Tennessee 9.5% $11.0B
CHARGING INFRASTRUCTURE
Jolting 89% Increase in Michigan’s Charging Infrastructure
24th in public EV charging stations per capita in Michigan in 2022, up from 32nd in 2021.
2,900+ publicly accessible charging ports with stations up 89% since 2018.
EVs Have Become a Political Issue, Not a Business or Economic Issue
Opinions on the EV shift continue to differ sharply along party lines. Among the 46% that are supportive of the shift to EVs, 69% identify as Democrat and 20% as Republican.
Further, only 18% believe the shift to EVs is due to consumer demand and market forces, while 71% believe it is due to government actions or pressure from environmental activists.
Source: Detroit Regional Chamber and the Glengariff Group Inc., March 2023
30 detroitchamber.com/sor
2.3% 4.4% 7.0% 9.3% 1.3% 3.4% 2020 2021 2022 2023 YTD
Alliance
Automotive Innovation,
U.S. EV MARKET SHARE BEV, PHEV, FCEV
Source:
for
Get Connected EV Report Q3 2023
Source: Center for Automotive Research, Book of Deals 2023, Investments 2018-2023, year-to-date
Michigan Voter Poll
RANK
% SHARE
STATES FOR SHARE OF AUTOMAKER EV AND BATTERY-RELATED ANNOUNCED INVESTMENTS
STATE
VALUE
2023 UAW CONTRACT NEGOTIATION IMPACT
Beyond ongoing economic impacts, the strike inflicted damage on Michigan’s global competitiveness and business attractiveness.
$10.4B IN DIRECT COSTS OF THE UAW STRIKE
in lost earning on lost production. on lost wages and earnings to supplier companies and workers.
Source:
in losses to dealers, customers, and ancillar y auto industr y workers.
CHALLENGES AHEAD
Long-term cost consequences
Uncertainty regarding consumer demand in EV adoption and overall sales
Economic health of Tier 2 and 3 suppliers
Increasing R&D investments in EV and AV products
STRIKE IMPACT
Days of U.S. Production Affected
Workers
Different Facilities
SUPPORT FOR UNIONS REACHED HIGHEST POINT SINCE 1965
I truly believe that what is at stake here is the future of the domestic auto industry, the future of the industrial Midwest, and the future of good-paying manufacturing jobs.
JIM FARLEY President and Chief Executive Officer, Ford Motor Company
31
Anderson
Economic Group Source: Gallup

To learn more about additional Detroit Regional Chamber research and data resources, visit detroitchamber.com/research.
