


The Fall season is synonymous with a new version release of Mountains® software. With many new and improved features, Mountains® 9.3 will be on show at the Materials Research Society Fall Meeting & Exhibit in Boston, USA from November 29. The updated version will also be available for download from www.digitalsurf.com from mid-November. So what’s included in the latest edit and what are the benefits of updating? Let’s take a closer look.
Above. Mountains® 9.3 automation features continue to improve efficiency of batch processing in an Industry 4.0 environment.
No instrument group is forgotten in the new ver sion of Mountains® 9.3 which sees the power of core features of the software further strength ened. Never has it been easier to customize and automate data analysis processes, in particular in an Industry 4.0 environment.
▶ Personalization of how data is displayed on loading can now be managed with new prefer ence options.
▶
Automation features have been boosted: users can operate Result pickers in Tolerance limits and Particle Analysis studies, access new options in Template mode and in multiple studiable substitution.
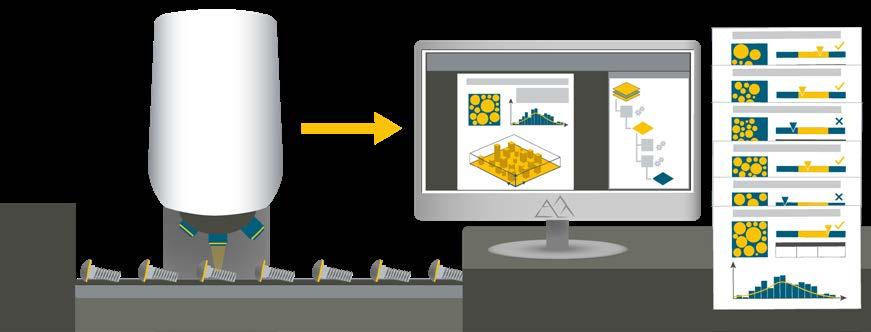
▶ It is now possible to visualize individual values of series in statistical documents and use them all for calculations; users can also choose to display all individual values in aggregated se ries in control charts, histograms etc.
▶
FFT-based analysis has been considerably improved with new filtering and thresholding tools for Surfaces and Profiles.
▶ Positioning methods for those using Colocalization for correlative analysis have
been simplified and made more intuitive.
▶ A new Analysis Workflow hack allows users to further customize the display of this feature.
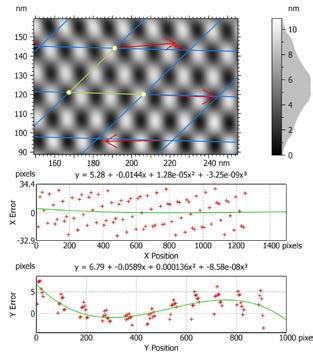
For users working with SPM images featuring repeating patterns, the previously mentioned improvements to FFT-based analysis now allow accurate fine-tuning of unit cell size and geometry with the “Adjust unit cell” tool.
Stiffness Analysis is just one of the latest tools available to users working with force curve data. Mountains® is now also capable of converting force volume datasets into series of force curves to allow data comparison.
IV curve analysis has been improved with the ad dition of multi-signal view, useful for comparing curves simultaneously. What’s more, signals can now be displayed with a common Z-scale.
Tools for Fiber analysis make their debut in Mountains® 9.3 (feature available January 2023).
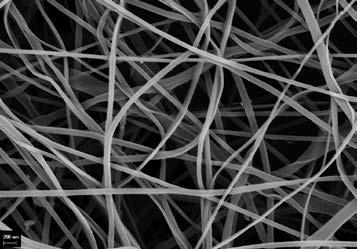
The scanning electron microscope (SEM) is the instrument used by most scientists to image fi bers whether they be man-made or natural.
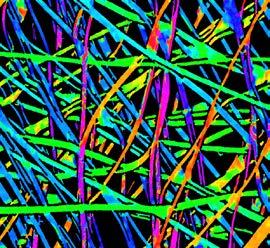
Mountains® users can now automatically analyze fiber morphology in SEM and optical microscopy images, including fiber diameter and fiber direc tion. Many display options are available.
READ MORE ON FIBER ANALYSIS => PAGE 6.

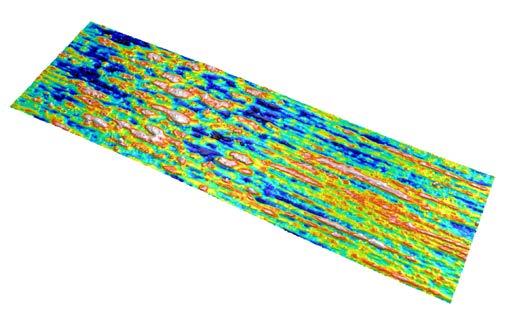
Other new features for SEM users include the ex tension of 4-image reconstruction to images containing objects on a flat background (useful in semiconductors, MEMS analysis etc.) and faster loading times of FIB image series as cubes.
Hyperspectral image visualization has been enhanced: users can now select any point in the
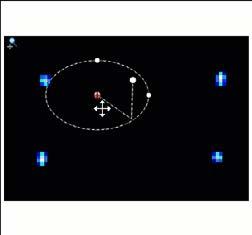
image and visualize the corresponding curve. Spectral analysis also sees the arrival of new op erators allowing the normalization of spectra in order to equalize the importance of different curves. Hyperspectral images can now be converted into series of spectra.
New features have been added for spectral maps creation including the ability to quantify compo sition of samples based on reference spectra (components previously extracted from data).
Mountains® users requested it, version 9.3 de livers: the Slices analysis feature has been aug mented with metric units and a new developed area parameter.
Those working with series of profiles can now display all or several profiles in grid view
Regarding features for Shells (freeform surfaces), Mountains® 9.3 continues to build on the existing toolset.
Cylinders can now be unfolded into flat shells to allow sur face characterization (see image left).
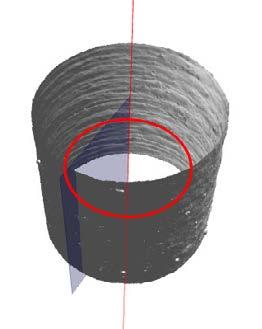
Further options have also been added for Shells containing color data.
Check www.digitalsurf.com for full details of the 9.3 release (available mid-Nov 2022). Access to the new version is free for users with an active Mountains® Software Maintenance Plan. To find out more about your Maintenance options, please contact sales@digitalsurf.com
During the past few decades, additive manufacturing, specifically 3D printing, has grown drastically. This technology has been used not only as a prototyping equip ment but also a technology that can provide final product quality. A team at Widener University (Chester, Pennsylvania, USA) recently studied the calcification process of polylactic acid polymer (PLA), a plastic filament material widely used in 3D printing.

Biomedical, robotics, automotive, and architec tural are few industries that are already using 3D printing as one of their main fabrication tools.
As an example, polylactic acid polymer (PLA) is being studied by many researchers for a potential use in artificial heart valves. The main challenge in this approach is the calcification and stiffening phenomena on the plastic valves. Therefore, in our recent research efforts, we have been studying the calcification process of PLA polymer thin films.
The PLA polymer was dissolved in alcohol while sodium chloride was added to the solution with different weight concentrations of 10%, 15%, and 20% which are labeled as Sample 1, 2, and 3 respectively. The solution is then spin coated on a silicon wafer at 3500 revolutions per minute for 1 minute.
Using an Asylum Research MFP-3D Origin atomic force microscope (AFM), each of the samples is imaged by bimodal AFM technique.
In bimodal AFM technique, the microcantilever is excited by the first eigenmode frequency in addition to a higher eigenmode frequency (i.e. mostly 2nd). The first eigenmode is reserved for topographical information while the second eigenmode is reserved for compositional mapping. In a single pass measurement, both compositional mapping and topography of the samples can be captured. Additionally, a contact mode force spectroscopy technique is used to capture force versus distance curves. The data is fitted to material models to extract material properties.
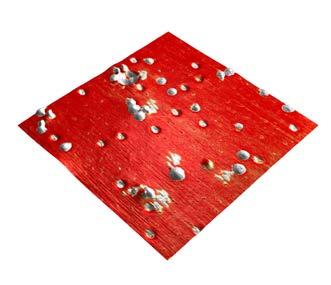
The bimodal AFM study is shown in Figure 1(a) where the phase is superimposed on the topography. As shown, the surface roughness in addition to stiffness of the surface increases (higher topography and lower phase values) as the salt concentration is increased.
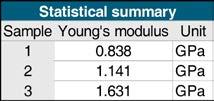
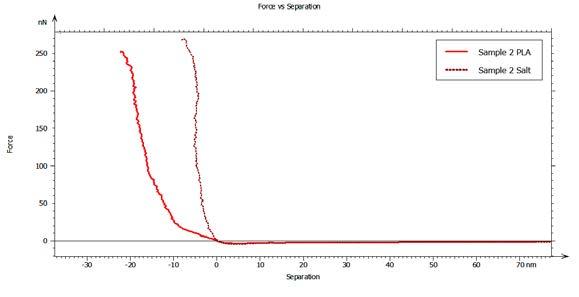
This phenomenon is also verified by performing force spectroscopy (shown in Figure 1(b)) on the surfaces and fitting the data to the Derjagin, Muller, Topov (DMT) model which provides the average Young’s modulus of surfaces under the study as shown in Figure 1(c) and (d).
Additionally, Figure 2 represents the salt regions which were revealed using the Particle Analysis tool (threshold detection method) in MountainsSPIP® software. It shows the surface area percentage that has salt contamination.
With modern micro- and nano-scale technology, performing characterization techniques is no longer a challenge. However, analyzing large datasets and providing visualization to better understand trends is more challenging. Important information can be analyzed and represented by analysis tools like MountainsSPIP® software.
Our study concluded that AFM is capable of quantifying stiffening phenomenon taking place due to calcification on PLA surfaces. This can help industries interested in enhancing stiffness of PLA surfaces such as 3D printed heart valves or robotic arms under extreme environmental conditions.
Phase
(a) (a)
(b) (b)
Sample 1 Sample 1
Sample 2 Sample 2
(c) (d)

Sample 3 Sample 3
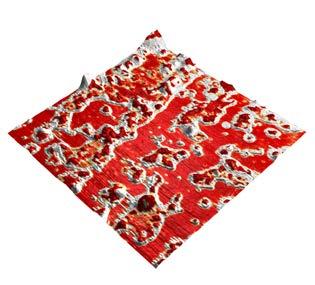
Figure 1. Summary of AFM Results: (a) Bimodal AFM (phase overlaid on topography), (b) Force spectroscopy curves, (c) Summary of material properties, (d) DMT model schematic.

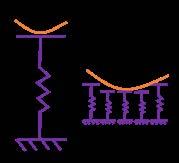
Figure 2. Particle Analysis of samples based on AFM phase images: (a) highlighted regions are calcified regions, (b) surface area percentage for each sample.


Jessica Schlosser and Dr. Babak Eslami are respectively Grad uate Student and Assistant Professor at Dept of Mechanical Engineering, Widener University, Chester, Pennsylvania, USA. INSTRUMENTS & SOFTWARE USED
Asylum Research MFP3D Origin atomic force microscope (AFM) + MountainsSPIP® software. CONTACT beslami@widener.edu
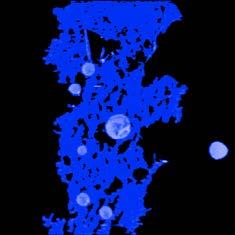

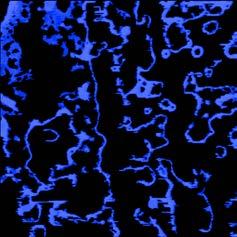
Image page 4. PLA Filament for 3D printers by Marco Verch. Attribution 2.0 Generic (CC BY 2.0): live.staticflickr.com/4809/46151683872_5cf0552355_o_d.jpg

Many fields of research today rely on the measurement and analysis of fibers in order to further the understanding of materials or guarantee quality during manufacturing. The Scanning Electron Microscope (SEM) has become the tool of choice for performing this task. The Mountains® software Fiber Analysis module (coming January 2023) is a fresh new addition to the extensive toolkit already available to those studying SEM images and other data. As Christophe Mignot, Digital Surf CEO, explains, in a single click, users can now access a wide set of parameters for fiber quantification and benefit from all the standard core features that have made Mountains® software so popular over the years.
The new Mountains® Fiber Analysis module lets users quantify individual fibers whether they are separated, touching or even overlapping.
All kinds of microscopy images can be analyzed, in particular SEM images (SE & BSE modes) and optical microscopy images. Dedicated detection tools are available for each image type.
Example applications of fiber analysis include the investigation of:
▶ Electrospun nano-fibers
▶ Cellulose and other organic fibers (gelatin, muscle)
▶ Synthetic fibers (such as Kevlar, polyethylene, glass) and composite materials
▶ Fibers from crime scenes (in forensics)
▶
Non-woven fibers (in filters for example)
▶ Mineral fibers, like asbestos.
The fiber analysis process starts with the binariza tion of the image. Several detection methods are available depending on the nature of the image:
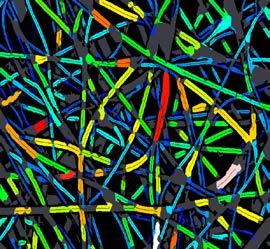
▶ light fibers on a dark background
▶ dark fibers on a light background
▶ SEM-SE fibers with a dark center and light edges
▶ SEM-BSE fibers (gray on gray).
The binary image is then automatically segment ed into fiber segments and interstices (spaces between fibers).

Fibers in SEM images are difficult to detect and specific, original algorithms dedicated to both SE and BSE modes have been developed by Digital Surf in Mountains® 9.3.
Although binarization is performed automatically by the software, each of the above methods can be manually controlled and adjusted by the user.
With just one click of a button, Mountains® soft ware automatically carries out a thorough analysis sequence of fiber morphology and displays: ▶ a histogram of fiber diameters
▶ a table of parameters for individual fibers and interstices including:
• fiber diameter (mean, min, max, standard deviation)
• average fiber direction (or fiber orientation)
Above. Fiber Analysis of electrospun fiber image in Mountains® 9.3: distance map (top left), segmentation image showing ridges (top right), histogram of fiber diameters (bottom left) & interactive parameters table (bottom right).
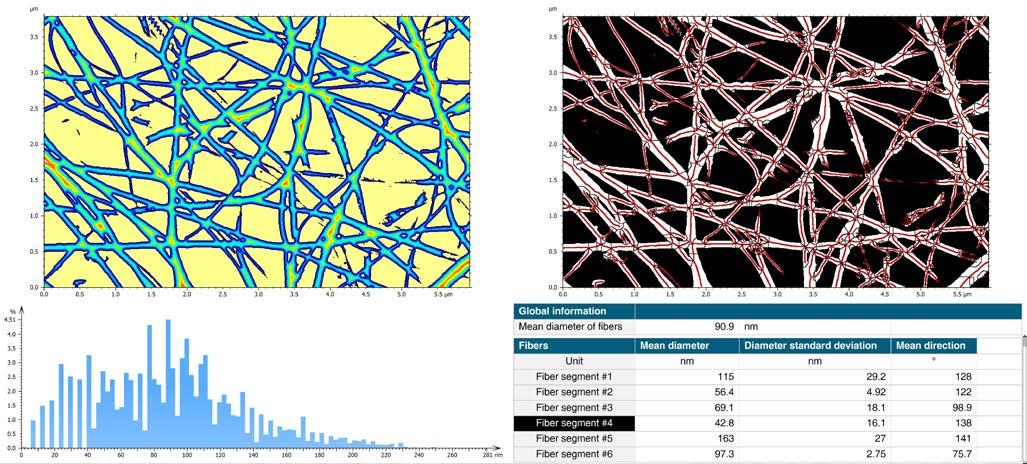
• interstice diameter (for filtering applications, this allows users to calculate the maximum size of a particle that can pass through the mesh).
A really nice touch to the new tool is that the table of parameters is interactive so, by clicking on a fiber segment or interstice in the image, users can actually jump to the corresponding row in the table, and vice versa.
Various display options are available for your data depending on final presentation requirements. If necessary, the various calculation steps can be displayed:
▶ raw image
▶ binarized image
▶ distance map (simulated fiber topography used to calculate fiber diameter)
▶ segmented image showing fiber segments and ridges of the distance map
As far as analysis results are concerned, the fol lowing display options are available:
▶ a diameter image
▶ a directional image of fibers
In these two cases, fiber diameter/direction is represented using color. The color scale used for displaying fiber direction is a circular scale opti mized for viewing orientation.
Once you’ve performed fiber analysis with Moun tains® software, you don’t have to stop there!
As usual, industry’s favorite analysis software provides users with an array of tools for export ing, presenting and automating. Fiber analysis images can be exported in several formats for publications and reports. Numerical results can be exported to Excel at the click of a button. As ever, the Mountains® document layout can be fully customized and converted to PDF format for further sharing. Automation features are accessi ble for users batch processing images of fibers. Finally, Mountains® 9.3 also includes full help files explaining new Fiber Analysis tools in detail.
The Fiber Analysis module will be available from January 2023 as an option with MountainsSEM® Color and MountainsSEM® Expert. It is included in MountainsSEM® Premium and MountainsLab® Premium packages. The Fiber Analysis module is only compatible with version 9.3 onwards. This version is freely available to users with an active Software Maintenance Plan (SMP). If you don’t have an active SMP, please get in touch to arrange an update by emailing sales@digitalsurf.com. If your Mountains®-based product is supplied by an instrument manufacturer, please contact them to check if the module is listed in their catalogue.
*Attribution 2.0 Generic (CC BY 2.0): msaustero, www.flickr.com/photos/29197937@N08/5039329442
One of the most common questions we receive from Mountains® users is: what cut-off value should I select to filter my data? The bad news is that there is no single answer. The good news is that our senior surface metrology expert, François Blateyron, has a few tips to help you make the right choice.

There are several strategies to consider when choosing the right cut-off and it usually depends on your application. When referring to cut-offs, users usually mean the main cut-off that is used to sepa rate roughness and waviness, but it’s important to be aware of other cut-offs that define the bandwidth of the profile or surface under investigation.
In recent standards, these are referred to as: Nis (microroughness nesting index), Nic (main nest ing index) or Nif (form removal nesting index). The term nesting index is an extension of the concept of cut-off, but for most standard filters (Gaussian, Spline, Robust) it is perfectly correct to use the term “cut-off”.
See also: ▶ guide.digitalsurf.com/en/guide-filtrationtechniques.html
This is the simplest case, all you need to do is follow the specification.
If the cut-off is clearly written on the drawing, then just use it. Drawing indications followed ISO 1302 until recently, although this standard has now been replaced by ISO 21920-1:2021. On sur faces, refer to ISO 25178-2:2021.
Read more: ▶ guide.digitalsurf.com/en/guide-indicationsiso-1302.html
If the specification does not include the cutoff value and only provides the parameter and its tolerance, you need to refer to the default cut-off. ISO 25178-3:2012 does not specify a default cutoff and only recommends that its value should be taken from a series of common values: 0.25 mm; 0.5 mm; 0.8 mm; 1.0 mm etc. However, it is fre quent practice to set the default cut-off Nic to 0.8 mm and the default cut-off Nis to 0.0025 mm.

Top. A profile specification with two non-default cut-off values, Nis = 8 µm and Nic = 2.5 mm.
Bottom. An areal specification with one non-default cut-off, Nis = 8 µm, and one default cut-off, Nic = 0.8 mm (omitted).
For profiles, ISO 21920-3:2021 introduces the concept of setting class as a shortcut to a set of default values. The aim is to replace the former procedure described in ISO 4288:1996 which had two drawbacks. Firstly, different procedures were applicable to periodic and non-periodic profiles, leaving the user with a difficult choice when the profile was partially periodic. Secondly, the pro cedure was made for Verification while it should only refer to Specification. The new concept should correct these two problems. However it is a complex machine and in 80% of practical cases on mechanical components, it leads to the value of Nic = 0.8 mm. The biggest problem is that using a vertical tolerance to define a lateral cut-off value makes very little sense!
See also:
▶ guide.digitalsurf.com/en/guide-lambdasfilter.html
▶ guide.digitalsurf.com/en/guide-defaultspecifications.html
Many users do not have drawings at their disposal since they work in non-mechanical fields (materi als research, archeology, etc.). They just want to
investigate surface texture and put some numbers on it in order to compare it with other samples.
The main goal of filtration is to align asperities on a reference line (or plane) in order to average heights that are consistent with each other (most parameters are based on integration, i.e. on averaging heights). This is why, for roughness parameters, waviness is filtered out (R=P–W).
As a result, peaks and valleys are correctly distributed above and below a reference.
Waviness is formed by the longest wave lengths which are visible in the center of a spectral analysis image (for surfaces) or at the left of the Frequency spectrum graph.
On a flat sample without any visible waviness, the filtration will have little effect if any, as fre quencies that are supposed to be attenuated already have an amplitude close to zero. So, filtration may be optional in this case. This can be checked using a Spectrum analysis study.
the filtration cut-off, but caution must be applied as SSFA works using an upper envelope while filtration is on the mean line. That’s the difference between the E-system (envelope) and the M-system (mean line); the two are not totally correlated.
Above. The SRC value calculated by SSFA is 1.3 mm. When used as the cut-off value, it shows a sound separation between waviness (top right) and roughness (bottom right).
See also: ▶ guide.digitalsurf.com/en/guide-fractalanalysis.html ▶ www.digitalsurf.com/optional-modules/ scale-sensitive-fractal-analysis
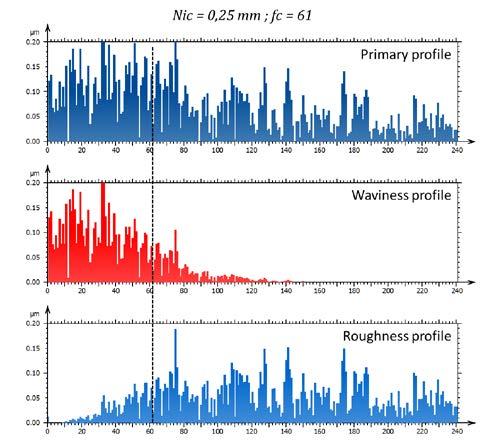
Above. A profile of 15.41 mm is filtered using a cut-off Nic = 0.25 mm. The frequency spectrum shows how frequencies are attenuated. The horizontal axis represents the frequency index: f_i=i/L with fi the frequency (in 1/mm), L the profile length in mm and i the frequency index.
Example: for i = 61 fi = 61/15.41 = 3.96 1/mm
As i=1⁄f_i , λi = 0.25 mm
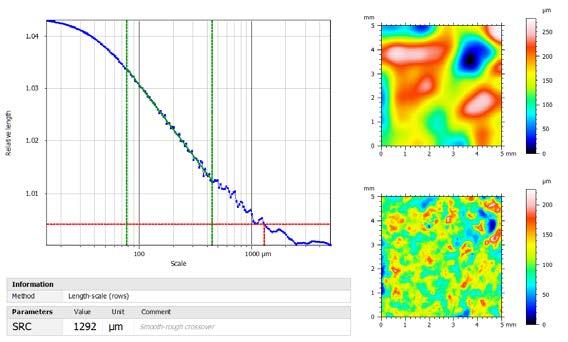
The Scale-Sensitive Fractal Analysis study generates a log-log graph of relative-area (or relative-length) in function of lateral scale. Amongst the available parameters, the SmoothRough crossover (SRC) suggests a scale value that is supposed to separate waviness (smooth content) from roughness. It may be used to define
Normally, the analysis protocol, including filtration conditions, should be established after functional correlation which proves that tracking a given parameter, in given filtration conditions, is equivalent to tracking performance on a workpiece (e.g. resistance to wear, adhesion performance, etc.) This requires applicationspecific knowledge that cannot be delivered by standards. Metrologists must analyze multiple measurements made on multiple workpieces with different performances, then carry out statistical analysis to demonstrate the significant link between the given performance and the selected parameter.
This analysis can be done by using a bandpass filter to generate a series of surfaces (or profiles) and calculate parameters on each surface, prior to statistical analysis.
See also: ▶ Functional correlation by C. Brown: link.springer.com/referenceworken try/10.1007/978-3-642-20617-7_16692 ▶ guide.digitalsurf.com/en/guide-bandpassfilters.html
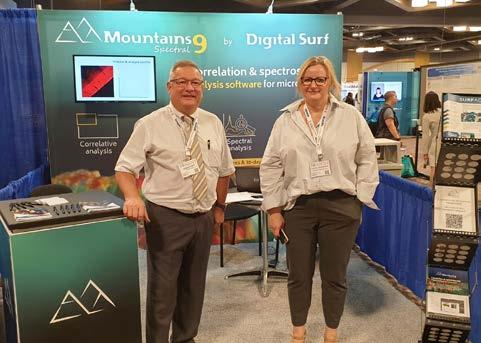
The Digital Surf team attended the Microscopy & Microanalysis meeting held this year in Portland, OR, USA, early August. Anne, Cyrille & Nicolas were on hand at the world’s largest microscopy products & services exhibit to showcase Mountains® 9 features for microscopy image analysis.

September was a busy month for Digital Surf. We again took part in the Japan Analytical & Scientific Instruments Show (JASIS) in Tokyo from September 7-9. Damien, Arnaud and our valued assistant Sato-san welcomed visitors to the Digital Surf booth to demon strate Mountains® capabilities for scanning probe and scanning electron microscopy.
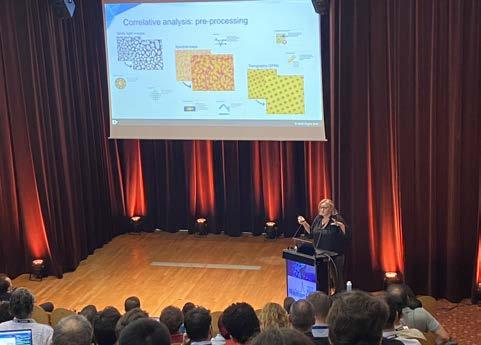

At the same time but closer to home, Anne, Mathieu & Nicolas represented Digital Surf at the DPG Meeting of the Condensed Matter Section (SKM) at Regens burg University, Germany. Initially scheduled to take
place in March, the meeting was postponed to Sep tember and gathered the European scientific physics community. This conference was the opportunity for the Digital Surf team to meet with new contacts and present the MountainsSPIP® features, including parti cle analysis, colocalization or force spectroscopy.
In September, Digital Surf also attended the International Conference on Advanced Applied Raman Spectroscopy (RamanFest). Organized by our partner Horiba, this conference brings together the world’s Raman community every year. In the Maison de la Chimie in Paris, Nicolas & Renata gave a presentation of MountainsSpectral® features and met with research ers to discuss their Raman spectroscopy applications.
Renata and Arnaud traveled to Cincinnati, KY, USA from October 1-3 to attend for the first time the SciX confer ence for analytical chemists. They were thrilled to be present to welcome visitors to our booth and provide them with live demos of MountainsSpectral® software.

Have
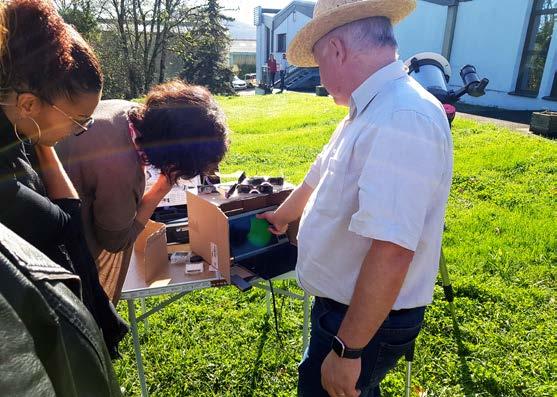
With solar glasses in hand, our team ventured out on our headquarter’s grounds for a glimpse at a rare occurrence: a partial solar eclipse. That’s what we call a cool coffee break! bit.ly/3UBpROD

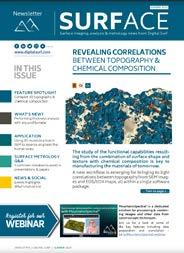
Check out our channel for tutorials on Mountains® software basic and advanced features for profilometry, electron microscopy, scanning probe microscopy and spectroscopy! bit.ly/2U2I2za
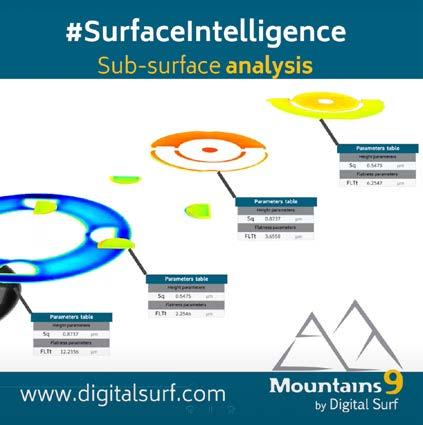
There’s a new series in town! Check out our short video series #SurfaceIntelligence to discover some of the awesome things you can do with Mountains® software: bit.ly/3E4t8iT
More features to come soon!
Know a friend or colleague who would be interested in receiving the Surface Newsletter? Let us know : contact@digitalsurf.com
The newsletter is available for download on our website www.digitalsurf.com
you visited our YouTube channel lately ?
HQ, R&D Center
16 rue Lavoisier 25000 Besançon - France Tel: +33 38150 4800 contact@digitalsurf.com
www.digitalsurf.com
Take Mountains® for a test drive Visit www.digitalsurf.com/free-trial
Contact sales@digitalsurf.com for information about updating Mountains® 8 or earlier versions to the latest Mountains® version

Get the most out of Mountains® software by watching one of our video tutorials www.digitalsurf.com/tutorials
Dive into our free online surface metrology guide and learn about characterizing surface texture in 2D and 3D www.digitalsurf.com/guide
Materials Research Society Meeting & Exhibit November 29 - December 1, 2022 | Boston, MA, USA
DPG-Tagung March 20-24, 2023 | Dresden, Germany
Forum des Microscopies à Sonde Locale April 3-7, 2023 | Obernai, France
Surface Newsletter, November 2022
Editor : Christophe Mignot
Content editor : Clare Jamet
Contributors : Laure Aubry, François Blateyron, Eugenia Capitaine, Mathieu Cognard, Babak Eslami, Christophe Mignot, Jessica Schlosser.
Copyright © 1996-2022 Digital Surf, all rights reserved