2 minute read
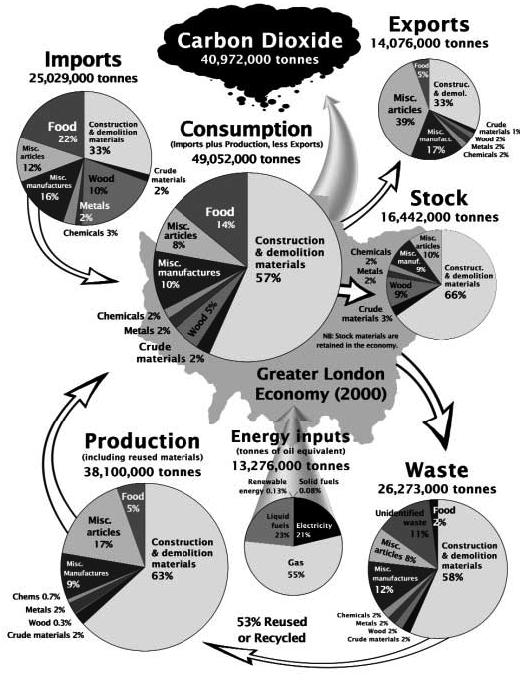
Gujarat, India Figure 1.28 Summary of Resource Flows through London, 2000


“ For too long now ministries of fi nance and planning have paid scant attention to the exploitation of the natural resource base or the damaging effects of environmental pollution, while countries have been developing National Environmental Action Plans that read as if they were written by the environment ministry for the environment ministry, with no links to the economic ministries.”
Source: World Bank (1997: 7).
Advertisement
have appreciated the usefulness of a single rating of this type and have calculated ecological footprints as an indicator of the overall impact on natural capital. For example, London has calculated that people in the city require, on average, 6.6 green hectares of land per person to support their lifestyles, which is more than three times the amount available per person on a planetary scale (fi gure 1.28). London discovered that its combined ecological footprint is 293 times the land area of the city, mostly as a consequence of the high rates of food and material consumption.
All techniques for adding up or aggregating ecological impacts into a simple metric suff er from a number of signifi cant problems (Mcmanus and Haughton 2006). For example, the ecological footprint fails to address well the important issue of water fl ows, which vary so much in value depending on location. A city that annexes agricultural land, thereby increasing its administrative boundary, suddenly appears much less of a burden on the planet, though the reverse may be true. Multifunctional land use—encouraged by Eco2—is ignored if all land is divided into discrete categories for ecological footprint analysis. By using a single unit, such as hectare of ecological land, the footprint ignores the major diff erences in ecological system values, including factors such as biodiversity, species scarcity, and habitat uniqueness. In fact, all indicators that aggregate impacts tend to ignore the many local factors that relate to the quality of ecosystems, the sensitivity of local environments to emissions and wastes, and the diff erences from place to place in the value of natural capital.
Despite these types of methodological problems, one should seek a method that allows a quick summary of the range of impacts arising from any development scenario. The method should rely on standardized measurement protocols for comparability, as well as simple graphical tools, so that one may rapidly communicate the basics to interdisciplinary teams of designers and decision makers. European Cooperation in Science and Technology, a European intergovernmental framework pro-
Figure 1.28 Summary of Resource Flows through London, 2000
Source: Best Foot Forward Ltd. (2002). Note: This summary for greater London reveals all inputs and outputs and helps explain why the city’s ecological footprint is approximately 300 times the size of the city’s land.


