1 minute read
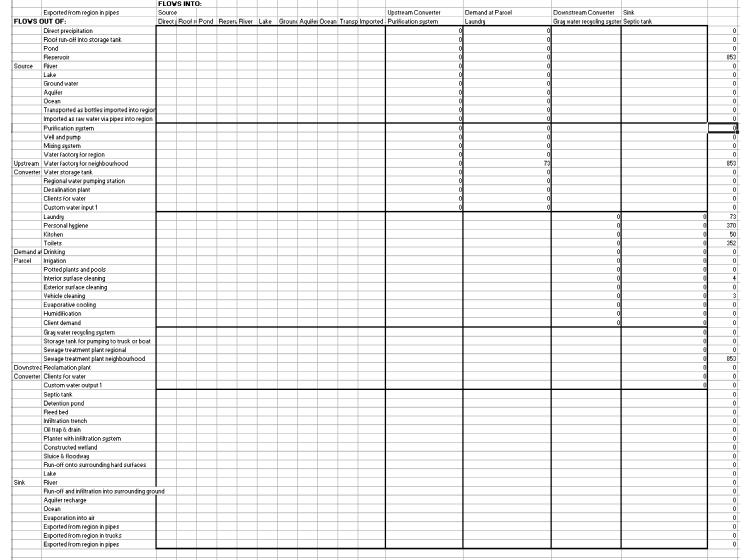
Figure 2.20 Sample Universal Flow Matrix for Water
Figure 2.20 Sample Universal Flow Matrix for Water
Source: Author elaboration (Sebastian Moffatt). Note: The fi gure shows an example of a universal matrix that identifi es all water fl ows at the parcel level by quantity and direction from source to sink.
Advertisement
may be combined with air photos (for example, Google Earth) to produce three-dimensional imagery. Such techniques provide planners and others with the ability to fl y through a digital landscape that has acquired the look and feel of a proposed development. With additional training, specifi c objects in the GIS database may be given attributes related to resource consumption, and GIS may evolve into a scenario development tool (for example, CommunityViz; see elsewhere below).
Getting real value from mapping
One of the challenges in overlay mapping is avoiding the common problem of GIS for the sake of GIS. Traditionally, GIS work has been far removed from decision making and has been surrounded by a mystique that obscures the simple nature of the tool and its role in planning. Without lots of advance notice and direction, GIS departments produce maps that are complex and colorful, but provide little added value. To realize the great potential of overlay mapping, one may fi nd it helprul to consider the following suggestions.
Provide clarity on the key questions decision makers are asking For example: Where are the ecological assets? Where are the threats to urban systems? Integrated design workshops depend on the use of maps to inform interdisciplinary groups about many factors that infl uence the performance of infrastructure systems. For instance, maps may help create an integrated understanding of the potential for taking advantage of existing eco-


