1 minute read
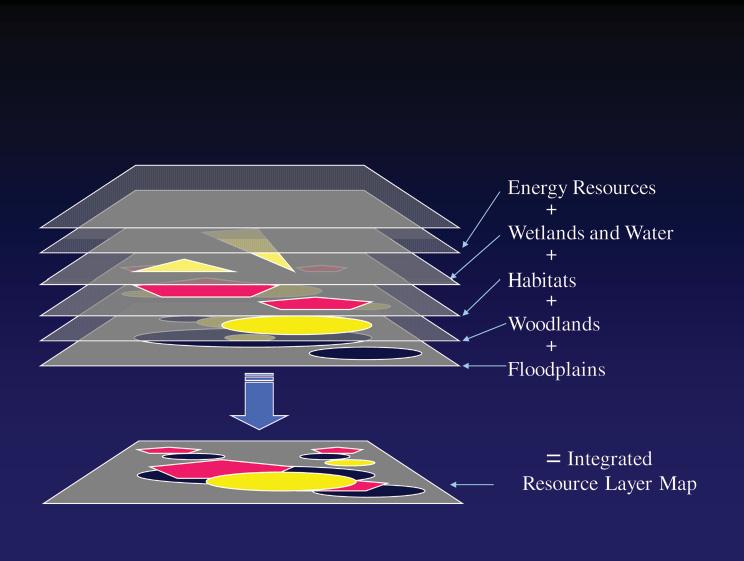
Figure 2.21 Layering Data
Figure 2.21 Layering Data
Source: Author elaboration (Sebastian Moffatt), with assistance from Lex Ivy, Terra Cognitio GIS Services. Note: This example illustrates how a number of layers of information on the natural capital of a region have been visually integrated on a single map. This information may be useful for strategic land use decisions and in identifi cation of infrastructure system design options.
Advertisement
logical assets inside or near a city. A map might show the locations with potential for generating renewable energy from wind, microhydro, biomass, geothermal, tide, industrial process, and other sources. Overlay mapping also provides a useful way of evaluating existing infrastructure systems and comparing their capacity in specifi c locations relative to the projected demand arising from growth in populations and economic activities. With such information consolidated on a single map, groups may integrate local energy assets relatively easily as they plan new energy infrastructure systems and urban settlements (fi gure 2.22). The same overlay process works in all sectors.
An example of hazard mapping at a larger scale is the work recently completed by Gujarat State Disaster Management Authority in India on a composite risk atlas aimed at assisting the various departments involved in disaster mitigation planning in areas that are the most vulnerable to natural or constructed hazards. The GIS consulting team has compiled one of the largest and most detailed digital GIS databases ever prepared in India and then generated an atlas that reveals the relative risks to life and capital from earthquakes, cyclones, storm surges, fl oods, chemical accidents, and droughts.
An example of overlay mapping on risk is shown in fi gure 2.23. In this example, regional growth planning for energy and transportation in the City of Squamish is informed by the distribution and intensity of risks on the landscape, including risks associated with landslides, earthquakes, fl oods, and unstable soils. All risks have been consolidated as layers on a single multihazard risk assessment map. This community is located in a fl ood-prone and geologically active area, and the map reveals few locations for the safe development of land for residential and commercial uses. Moreover, the existing


