
2 minute read
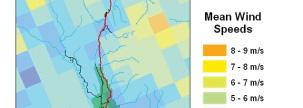
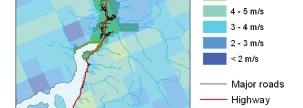
Figure 2.24 An Example of an Overlay Map of Renewable Energy Sources
Advertisement


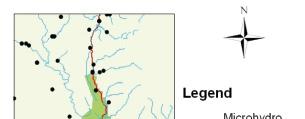
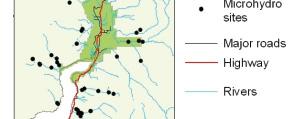


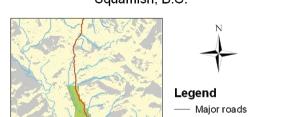
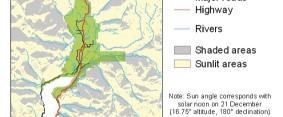


Figure 2.24 An Example of an Overlay Map of Renewable Energy Sources
Source: Overlay maps completed by Pathways Group at Natural Resources Canada and presented as a contribution to the Canadian team in the “Bridging to the Future Project” (Sheltair Group 2007). Note: Individual energy asset maps may be viewed together or overlaid to produce a picture of all areas in a region that have easy access to renewable energy resources. With appropriate growth management and the aid of the maps, a city may become well positioned to achieve energy independence and carbon neutrality. KM=kilometer.
spaces. The information collection and storage plan are the most important elements of the method and need to be addressed as part of an Eco2 pathway. A good example of how a broad information strategy leads to more eff ective mapping tools is found in the World Bank’s primer for cities on climate change, which includes a step-by-step approach to identifying hot spots that are especially vulnerable and then exploring mitigation options (see Prasad and others 2009).
Integrate local knowledge Another key part of an information strategy is engagement with knowledgeable local residents in the mapping work. Workshops may be organized for tapping into this information and creating maps that are far more informative through a process that is more inclusive. Recently, this sort of community mapping has been successfully applied in many locations. Communities often have a truly surprising amount of information to contribute, much of which cannot be obtained in any other fashion.
Take advantage of technologies for sharing results The use of Web-based GIS applications is an emerging technology that leverages the benefi ts of mapping. Colorful maps and images on the


