7 minute read
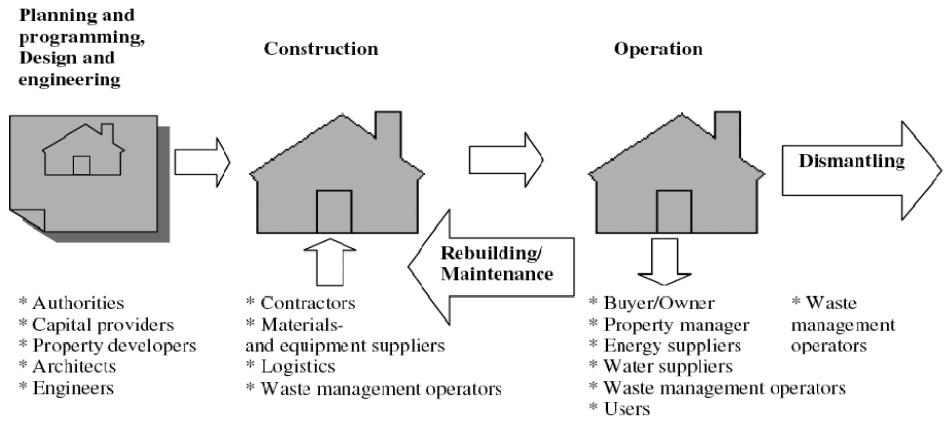
Figure 2.26 The Life Cycle of a Building
Figure 2.26 The Life Cycle of a Building
Source: Brick (2008). Note: The life cycle of a building is long and complex and infl uenced by many different professionals.
Advertisement
This method may be applied in demonstration projects because it helps reveal the whole picture; life-cycle environmental accounting helps identify areas in which the problems are the greatest. For example, ecological priorities among rapidly industrializing countries include cutting back on the excessive amounts of heavy masonry used in construction, converting the ineffi cient and polluting energy systems used to produce materials, and enhancing the durability of concrete and other key materials that aff ect the lifetimes of buildings and infrastructure. The challenges involved in undertaking environmental accounting on projects are centered on the time and eff ort needed to consider all the inputs and outputs, including those that are embodied in the materials and services procured for the project.
A third method is risk assessment, which is especially important during times of rapid change and, yet, is largely ignored by urban professionals. A full assessment of risk requires that cities consider a variety of future possibilities and research the likely impact of trends in many areas, from climate change to technology. Scenario planning and adaptation are diffi cult, but they are also rewarding exercises and are a key part of investing in resilience and sustainability.
A fourth method is the overall valuation of a city’s performance on an Eco2 pathway and on a long-term and project-by-project basis; this involves using a holistic set of indicators to assess costs and benefi ts. It is important for cities to review ways to select performance indicators that are useful to decision makers at varying levels and that cover the full range of assets within a city: manufactured capital, natural capital, human capital, and social capital. It is important that these indicators include qualitative attributes such as historic, traditional, or cultural dimensions that cannot be represented monetarily. The challenge is to fi nd ways to measure these assets that are balanced, aff ordable, dependable, and comparable and to present the results in a format that may be easily understood by decision makers.
Life-Cycle Costing
One of the most signifi cant factors infl uencing decision making on urban area development is the long-term impact on city fi nances and the costs for residents and businesses.
Unfortunately, in complex integrated designs that include new land uses and new infrastructure, costs and revenues are often diffi cult to estimate. Good commonsense arguments might exist for alternative Eco2 designs, but, without accompanying fi nancial analysis, decision makers may be understandably reluctant. This is especially true because of the prevailing misconceptions and widespread misinformation. Moreover, it is not always easy to recognize the win-win potential, and the assumption may be that change is costly, at least until a fi nancial analysis is complete. The debate over costs has two dimensions: What are the true costs over the long term? And how equitably are costs and benefi ts distributed? An LCC method is the only way to address both these questions.
LCC for urban infrastructure applies to all components, from buildings to roads; pathways; rights-of-way; parking lots; wires; pipes; ditches; bridges; and the associated treatment plants, substations, open spaces, and facilities. Most of these infrastructure elements have exceptionally long lifetimes and may account for large quantities of life-cycle material and energy fl ows. By adopting LCC, one may adjust the design and purchasing choices to optimize the system over its entire life. The composition of sewerage pipes, for example, may be changed from concrete to welded steel if due consideration is given to durability, cleaning, maintenance, and other recurring costs over the full life of the system and to the potential for adaptability and recycling. Road surfaces may be changed from asphalt to concrete if due consideration is given to the improved effi ciency and fuel savings achieved by truck tires on concrete. Linear in-ground infrastructure grids may refl ect the adoption of combined trenching and easily accessed utilidors if these are shown to off er greater adaptability and lower operating costs over the long life cycle of such systems. LCC can produce even greater changes in practice in terms of spatial planning, as described in part 1.
LCC applications in integrated land use and community infrastructure planning
LCC may assist with the evaluation of alternative spatial planning activities by providing credible estimates of the full long-term costs for infrastructure and the impacts on taxes, fi scal health, aff ordable housing, and commercial space. The benefi ts are most eff ectively understood through a specifi c example of the application of LCC. The example presented here is based on a tool developed by the Canada Mortgage and Housing Corporation, a Canadian public agency, for use in integrated design exercises. The tool, the life-cycle costing tool for community infrastructure planning, allows users to compare alternative development scenarios and to estimate the major costs of community development, particularly the costs that change depending on the form of urban development (for example, linear infrastructure). The tool is geared toward estimating planning costs and the revenues associated with the residential component of a development. The fi nancial impacts of commercial development and other types of development may be incorporated, provided infrastructure requirements have been specifi ed correctly. The tool is suited to assessing development projects ranging in size from a collection of houses to a block-by-block infi ll development to an entire subdivision or neighborhood. A good measure of the applicability of the tool to a given project is whether or not alternatives may be conceived that would result in signifi cantly diff erent densities or infrastructure requirements or make use of diff erent green infrastructure alternatives.
The tool is a spreadsheet-based application (Microsoft Excel) that makes the estimation of life-cycle costs quick and easy for almost any type of land use and infrastructure alternative. It includes costing variables with default values that may be adjusted to match local or national costs according to a city’s location. Outputs in-

Life-cycle costing software is available from Canada Mortgage and Housing
Corporation. www.cmhc-schl.gc.ca.
clude integrated fi nancial assessments with monetary values for the following major categories:
• Hard Infrastructure, including roads, sewerage, storm water facilities, schools, and recreation centers • Municipal services, including transit services, school transit, fi re services, police services, and waste management services • Private user costs, including driving costs and home heating costs • External costs, including air pollution, climate change, and motor vehicle collision • Green infrastructure alternatives
Two scenarios for Fort St. John
In 2008, Fort St. John, Canada, conducted a design charrette to create a sustainable neighborhood concept plan for a 37-hectare greenfi eld site on the edge of the urban area. The city had three goals:
1. Adopt a more proactive and engaging planning process for managing growth. 2. Create a new demonstration neighborhood that embodies the community’s long-term goals and objectives. 3. Field-test new approaches for guiding future mixed use development throughout the region.
As part of the design charrette, the development costs and value of the sustainable neighborhood concept plan were compared against a baseline scenario that was grounded on the typical low-density neighborhoods currently existing in Fort St. John. The sustainable neighborhood scenario is an alternative incorporating the principles and recommendations that arose from the charrette process. The analysis using the LCC tool for community infrastructure planning allowed the scenarios to be run for an entire neighborhood. The calculations are comprehensive, including typical capital and operating costs for utilities and services such as roads, water, sewerage, garbage, schools, recreation facilities, public transit, private vehicle use, fi re protection, and police. Interest rates for lending, tax rates, and service revenues are also calculated. Lifecycle costs are annualized (converted into an annual cost) over a 75-year period and allow for the operation, maintenance, and replacement of all utilities. All costs may be allocated on a per household basis.
All cost and service demand assumptions were the same for the two calculations. The only diff erences were that the sustainable neighborhood scenario has a smaller neighborhood street width, green storm water infrastructure, green roofs on public buildings (reducing the size of the storm water infrastructure), and higher energy effi ciency building standards. The sustainable neighborhood scenario also has a higher density and greater mix of housing types and land uses. Table 2.3 compares the two scenarios.
Baseline scenario: low-density, primarily single-family residential and apartment A simple mask method was used to assess the road and lot layout and the number of units that would typically be developed on this site. A scaled mask was created and placed over an existing neighborhood near the site (fi gure 2.27). The neighborhood has parks, mostly single-family homes, and so on. The approximate number of lots and the length and type of streets captured inside the mask were counted; allowance was made for the inclusion of a school and community center. Three elements were then added: a small strip of commercial use buildings, some duplex lots, and several small three-story apartment buildings. Public open space was limited to parks, school grounds, and street rights-of-way.
Sustainable neighborhood scenario: mediumdensity, varied housing forms, and mixed use The sustainable neighborhood plan developed in the 2008 charrette was the basis of the second scenario. A three-dimensional model was


