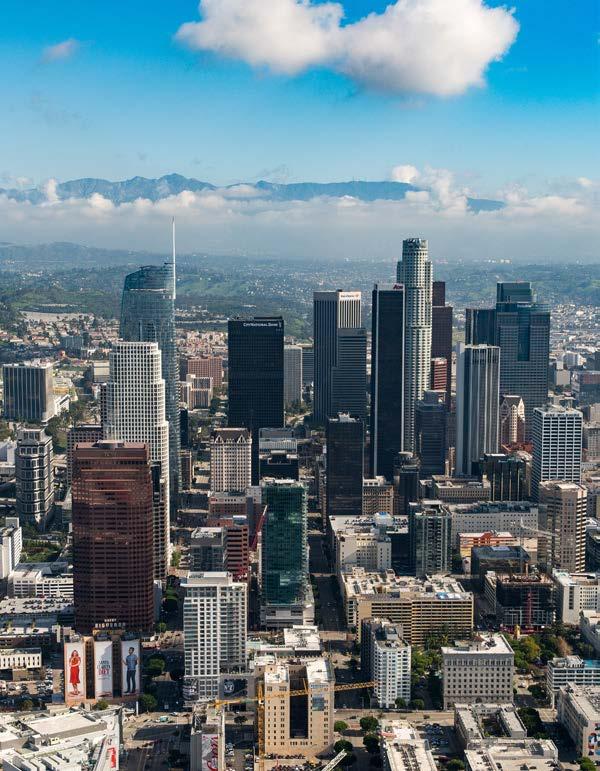
DOWNTOWN LA MARKET REPORT
SECOND QUARTER, 2O23
Photo by Vistity
ABOUT THE DCBID
Founded in 1998, the Downtown Center Business Improvement District (DCBID) has been a catalyst in Downtown Los Angeles’ transformation into a vibrant 24/7 destination. A coalition of more than 2,000 property owners in the Downtown Center, the DCBID members are united in their commitment to enhance the quality of life in Downtown LA.
The mission of the Economic Development team is to improve and revitalize the District and bring investment and new businesses to the area. We provide services to current and prospective residents, workers, and businesses, including:
• Development Consulting
• Research and Information Requests
• Events and Marketing
• Housing and Office Tours
• Customized Tours and Reports
Whether you need information on development, opening a business location, or you just want to learn more about Downtown’s market sectors and dynamics, we are the portal for information about the District and DTLA.
To learn more about Downtown’s Renaissance and how to join us, visit www.DowntownLA.com
DEFINITION OF DOWNTOWN LA
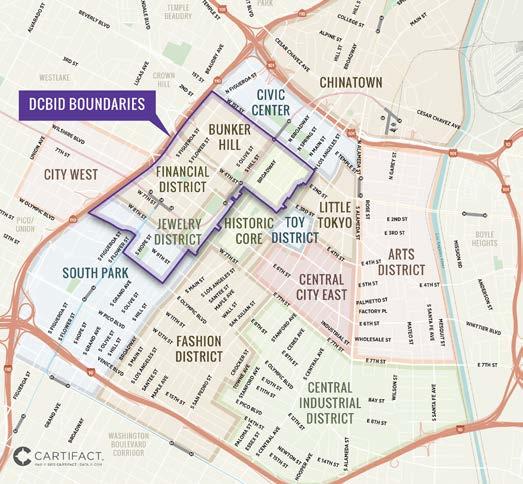
The DCBID defines Downtown Los Angeles as the area bounded by the 110, 101 and 10 freeways and the LA River, plus Chinatown, City West, and Exposition Park. The projects contained in this report are within a portion of Downtown Los Angeles, shown on the map to the left.
2 Downtown Center Business Improvement District Q2 2023 MARKET REPORT
3 Downtown Center Business Improvement District EXECUTIVE SUMMARY ........................................ 4 MARKET OVERVIEW Visitation Insights .............................................. 5 Residential ........................................................ 6 Office ................................................................. 6 Retail ................................................................. 6 Hotel ................................................................. 6 Project Openings 7 CRE Sales 7 Office Leases 7 Retail Openings ................................................. 7 Quarterly Tracking Stats ................................... 8 DEVELOPMENT MAPS Commercial .................................................... 10 Residential ..................................................... 12 DEVELOPMENT UPDATE Under Construction ....................................... 14 Proposed ........................................................ 16 FEATURED PROJECTS Now Open 20 Under Construction 22 Proposed 26 TABLE
CONTENTS 7 20 24
OF
EXECUTIVE SUMMARY
Although segments of the Downtown market are still in recovery mode, there was good news to be found across all sectors in Q2 2023. As in the last several quarters, the strength of the residential and hospitality sectors continued to demonstrate the appeal of DTLA as a neighborhood and a destination.
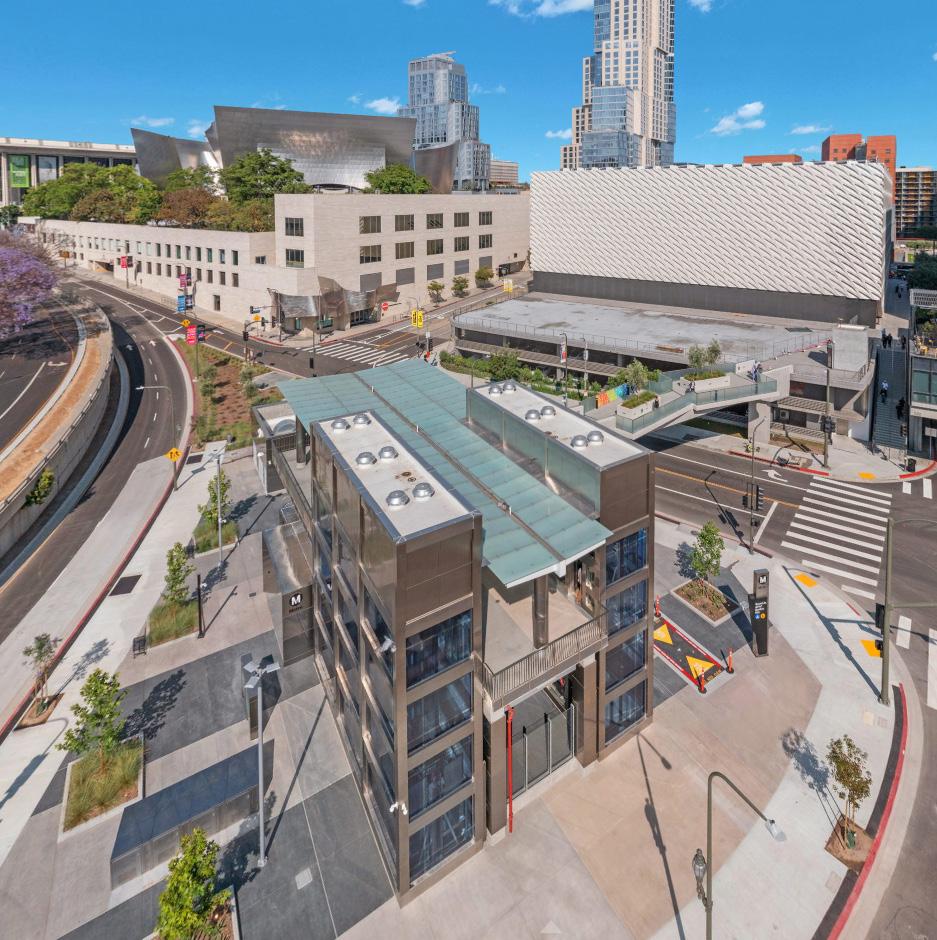
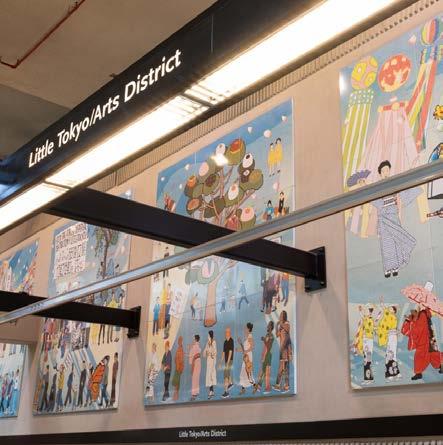
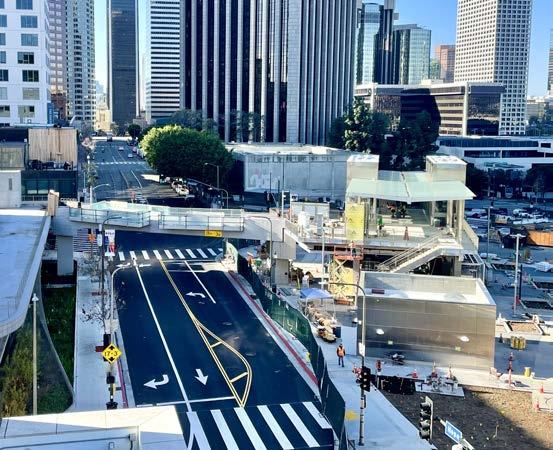
Without question, the most impactful news of the quarter was the opening of the Regional Connector and its three new stations in DTLA. With the project’s completion, Angelenos have easier access to Downtown and its range of amenities and attractions, as well as more convenient options for travel across the region, further solidifying DTLA’s position as the heart of the city.
In the office sector, amidst ongoing concern about return of workers and demand for space, the City of Los Angeles gave reason for optimism with its 295K SF lease at the Gas Company Tower. While certainly the largest, this was not the only office lease this quarter, with several deals signed at DTLA’s trophy towers, including Sidley Austin’s new 57K SF lease at City National 2CAL and Morgan Stanley’s 48K SF renewal at FourFortyFour South Flower. Another source of optimism was the purchase by UCLA of The Trust Building, a sign of the appeal of office space for non-traditional uses.
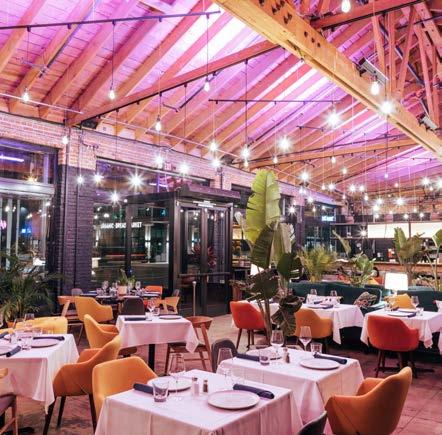
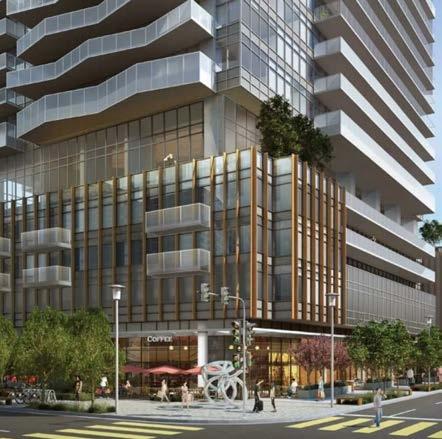
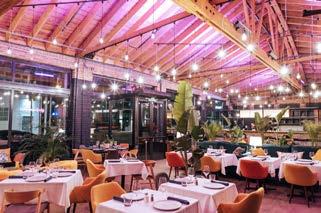
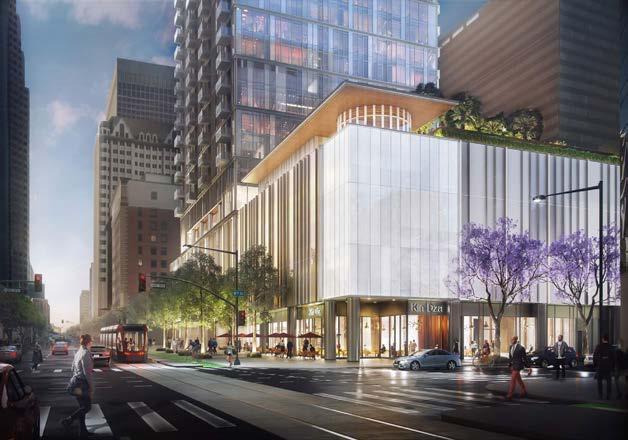
As the city prepares to host the world at the 2028 Olympic Summer Games, adding new hotel capacity in DTLA is critical. That effort got a big boost with the opening of the AC & Moxy Hotel in South Park, including 727 rooms and an array of new food, beverage, and nightlife offerings. This brings the total number of hotel rooms in Downtown LA to over 10,000, nearly double the number before the Downtown Renaissance began in 1999. Meanwhile, after a relative lull in new residential deliveries, Brookfield Properties opened Beaudry with 785 units, making it the largest single-tower residential community not just in DTLA, but the whole West Coast. Joined by 154 units at Jade Enterprise’s Emerald DTLA in South Park, the new inventory pulled occupancy rates slightly below 90%, though that will inevitably increase as these properties lease up. Finally, one of Downtown’s indisputable bright spots of late – the food and beverage sector – continued to thrive, with a bevy of new openings. The most intriguing of these is House of Cocotte, a mix of restaurant, co-working, and event space, which bills itself as “an innovative new breed of urban sanctuary, business incubator and creative hub.”
Q2 KEY STATS
$3.79
Average Class A Office Rent Per Square Foot
23.6% Office Vacancy Rate
$3.36 Apartment Asking Rent Per Square Foot
89.7% Residential Occupancy Rate
$152.26 YTD Hotel RevPAR
4 , 655 RESIDENTIAL UNITS UNDER CONSTRUCTION
29,170 PROPOSED
10 , 267
HOTEL ROOMS IN DTLA
1, 088 UNDER CONSTRUCTION
6 , 695 PROPOSED
Q2 KEY HIGHLIGHTS
The Regional Connector was completed, and three new stations opened in DTLA.
Beaudry opened with 785 new luxury apartments next to FIGat7th.
The AC & Moxy Hotel opened in South Park with 727 rooms.
4 Downtown Center Business Improvement District Q2 2023 MARKET REPORT
MARKET OVERVIEW Visitation Insights
DTLA MONTHLY TOTAL VISITS
Although COVID affected communities across the region, DTLA was uniquely impacted by stay-at-home orders. As people remained in their residential communities, trips to DTLA dropped dramatically. 2021 saw significant gains overall but was slowed by the Delta and Omicron variants. After significant growth through 2022, visits to DTLA are now near pre-pandemic levels.
MONTHLY WORKPLACE VISITATION
Workplace visitation continued its steady growth in Q2, with monthly visits increasing by 13.1% compared to the same time last year. At the same time, visits per worker has remained mostly flat for seven consecutive quarters.
5 Downtown Center Business Improvement District
0 2,000,000 4,000,000 6,000,000 8,000,000 10,000,000 12,000,000 1/1/19 3/1/19 5/1/19 7/1/19 9/1/19 11/1/19 1/1/20 3/1/20 5/1/20 7/1/20 9/1/20 11/1/20 1/1/21 3/1/21 5/1/21 7/1/21 9/1/21 11/1/21 1/1/22 3/1/22 5/1/22 7/1/22 9/1/22 11/1/22 1/1/23 3/1/23 5/1/23
0 2 4 6 8 10 12 14 16 18 0 50,000 100,000 150,000 200,000 250,000 300,000 350,000 400,000 Q4 2019 Q1 2020 Q2 2020 Q3 2020 Q4 2020 Q1 2021 Q2 2021 Q3 2021 Q4 2021 Q1 2022 Q2 2022 Q3 2022 Q4 2022 Q1 2023 Q2 2023 Monthly Visits Per Worker Total Workers Per Month Total Workers Per Month Monthly Visits Per Worker
2019 2020 2020 2020 2020 2021 2021 2021 2021 2022 2022 2022 2022 2023 2023 2020 2021 2022 2023 2019
Source: Placer.ai
MARKET OVERVIEW
INVENTORY
6 Downtown Center Business Improvement District Q2 2023 MARKET REPORT Residential Units Current Inventory Under Construction Total When Complete Proposed Market Rate Rental 34,950 3,312 38,262 22,060 Condos 7,210 504 7,714 2,747 Affordable 12,891 839 13,555 3,363 Total 55,051 4,655 59,531 29,170 Projected Population* 94,137 7,960 102,097 Office Space 40m SF 2.2m SF 42.2m SF 5.3m SF Retail Space 4.3m SF 0.9m SF 5.2m SF 2.0m SF Hotel Rooms 10,267 1,088 11,355 6,695 *1.8 residents per unit X 95% occupancy Office Space Source: CBRE / Retail & Hotel Space Source: CoStar
OFFICE Q2 2023 Q2 2022 Vacancy Rate 23.6% 20.2% Class A Rent PSF $3.79 $3.80 Overall Rent PSF $3.70 $3.71 YTD Net Absorption -579,888 -587,053 YTD Leasing Activity 891,808 1,555,467 Source: CBRE, CoStar RESIDENTIAL Q2 2023 Q2 2022 Apartment Occupancy Rate 89.7% 93.8% Apartment Asking Rent PSF $3.36 $3.46 Average Effective Rent Per Unit $2,790 $2,906 Condo Sales 114 192 Condo Price PSF $685 $700 Source: DTLA Life, CoStar
RETAIL Q2 2023 Q2 2022 Vacancy Rate 8.6% 5.9% Average Rent PSF $3.16 $3.12 YTD Net Absorption -430,603 -114,648 Source: CoStar HOTEL Q2 2023 Q2 2022 YTD Occupancy Rate 67.9% 66.9% YTD Average Daily Rate $224.36 $222.35 YTD RevPAR $152.26 $148.67 Source: CoStar
MARKET OVERVIEW
PROJECTS OPENED
COMMERCIAL REAL ESTATE SALES
OFFICE LEASES
RETAIL OPENINGS

7 Downtown Center Business Improvement District
Property Name Address Buyer Seller Price Cathay Manor Apartments 600 N. Broadway Capital Realty Group Chinese Committee on Aging $97,000,000 The Trust 433 S. Spring St. UCLA Rising Realty Group $40,000,000 1915 Violet St 1915 Violet St. Haskell & Goodman Daniel Kim $4,950,000 2338-2344 E 8th St 2338-2344 E. 8th St. Lavende LLC ATeamStudios LLC $4,190,000 933 E 11th St 933 E. 11th St. CMCW Management Phyllis Greene-Siegel $3,900,000
Tenant Property Name Address Type Sq ft City of Los Angeles Gas Company Tower 555 W. 5th St. New 297,500 Lumen Technologies 818 W. 7th 818 W. 7th St. Renewal 67,632 Sidley Austin City National 2Cal 350 S. Grand Ave. New 57,148 Morgan Stanley FourFortyFour South Flower 444 S. Flower St. Renewal 48,894 JAMS Inc. City National Plaza 515 S. Flower St. New 27,230 Green Dot Public Schools USC Tower 1149 S. Hill St. Renewal 20,554 Brown & Riding Insurance US Bank Tower 633 W. 5th St. New 13,342 House of Cocotte Baar Baar Ghost Sando Shop Pane Bianco DTLA the art room Vees Café Rakkan Miso/Izakaya
House of Cocotte
Name Neighborhood Description Beaudry Bunker Hill 785 luxury residential units developed and managed by Brookfield Prop. AC & Moxy Hotel South Park 727 rooms across from the LA Convention Center Regional Connector Bunker Hill/Historic/Little Tokyo 1.9-mile light rail connection with three new stops in DTLA Emerald DTLA South Park The latest from local developer JADE Enterprises has 154 residential units
Baar Baar
QUARTERLY TRACKING STATS
RESIDENTIAL
The residential market has rebounded strongly after a substantial decline during the pandemic, with current rents and occupancy levels maintaining pre-pandemic record highs even as over 4,000 new units have been added since 2020, representing around 8% of the total inventory in DTLA.
Vacancy continued to rise as uncertainty about return-to-work continued to dampen leasing activity across Southern California. Nevertheless, rents have stayed fairly consistent, remaining within 5% of their pre-pandemic level.
8 Downtown Center Business Improvement District Q2 2023 MARKET REPORT 70% 75% 80% 85% 90% 95% 100% $2,000 $2,100 $2,200 $2,300 $2,400 $2,500 $2,600 $2,700 $2,800 $2,900 $3,000 Q4 Q1 Q2 Q3 Q4 Q1 Q2 Q3 Q4 Q1 Q2 Q3 Q4 Q1 Q2 Occupancy Rent Residential Asking Rent Per Unit Occupancy 0% 5% 10% 15% 20% 25% 30% $3.50 $3.55 $3.60 $3.65 $3.70 $3.75 $3.80 Q4 Q1 Q2 Q3 Q4 Q1 Q2 Q3 Q4 Q1 Q2 Q3 Q4 Q1 Q2 Vacancy Rent Office Asking Rent Per Square Foot Vacancy 70% 75% 80% 85% 90% 95% 100% $2,000 $2,100 $2,200 $2,300 $2,400 $2,500 $2,600 $2,700 $2,800 $2,900 $3,000 Q4 19 Q1 20 Q2 20 Q3 20 Q4 20 Q1 21 Q2 21 Q3 21 Q4 21 Q1 22 Q2 22 Q3 22 Q4 22 Q1 23 Q2 23 Occupancy Rent Residential Asking Rent Per Unit Occupancy Source: CoStar
Asking Rent Per Unit Occupancy
Overall Rent Per Square Foot Vacancy
OFFICE
2019 2020 2020 2020 2020 2021 2021 2021 2021 2022 2022 2022 2022 2023 2023 0% 5% 10% 15% 20% 25% 30% $3.50 $3.55 $3.60 $3.65 $3.70 $3.75 $3.80 Q4 19 Q1 20 Q2 20 Q3 20 Q4 20 Q1 21 Q2 21 Q3 21 Q4 21 Q1 22 Q2 22 Q3 22 Q4 22 Q1 23 Q2 23 Vacancy Rent Office Asking Rent Per Square Foot Vacancy 2019 2020 2020 2020 2020 2021 2021 2021 2021 2022 2022 2022 2022 2023 2023 Source: CBRE 2020 2021 2022 2023 2019 2020 2021 2022 2023 2019
QUARTERLY TRACKING STATS
Retail rents have remained remarkably stable, indicating that interest in urban locations like Downtown LA has been strong. Although vacancy rates have ticked up slightly, the long-term trend is uncertain as it is at least partly due to new inventory coming online, including at new developments such as The Grand LA.
Although occupancy and RevPAR remain below pre-pandemic levels, both made significant gains in 2022 and are now holding steady only 10-15% below where they were in 2019.
9 Downtown Center Business Improvement District 0% 10% 20% 30% 40% 50% 60% 70% 80% 90% $0 $20 $40 $60 $80 $100 $120 $140 $160 $180 Q4 19 Q1 20 Q2 20 Q3 20 Q4 20 Q1 21 Q2 21 Q3 21 Q4 21 Q1 22 Q2 22 Q3 22 Q4 22 Q1 23 Q2 23 Occupancy YTD RevPar Hotel YTD RevPar Occupancy 0% 10% 20% 30% 40% 50% 60% 70% 80% 90% $0 $20 $40 $60 $80 $100 $120 $140 $160 $180 Q4 Q1 Q2 Q3 Q4 Q1 Q2 Q3 Q4 Q1 Q2 Q3 Q4 Q1 Q2 Occupancy YTD RevPar Hotel YTD RevPar Occupancy 1% 2% 3% 4% 5% 6% 7% 8% 9% 10% $2.50 $2.75 $3.00 $3.25 $3.50 Q4 Q1 Q2 Q3 Q4 Q1 Q2 Q3 Q4 Q1 Q2 Q3 Q4 Q1 Q2 Vacancy Rent Retail Average Rent Per Square Foot Vacancy Source: CoStar
Average Rent Per Square Foot Vacancy Source: CoStar
RETAIL
HOTEL YTD RevPar Occupancy
1% 2% 3% 4% 5% 6% 7% 8% 9% 10% $2.50 $2.75 $3.00 $3.25 $3.50 Q4 19 Q1 20 Q2 20 Q3 20 Q4 20 Q1 21 Q2 21 Q3 21 Q4 21 Q1 22 Q2 22 Q3 22 Q4 22 Q1 23 Q2 23 Vacancy Rent Retail Average Rent Per Square Foot Vacancy 2019 2020 2020 2020 2020 2021 2021 2021 2021 2022 2022 2022 2022 2023 2023 2019 2020 2020 2020 2020 2021 2021 2021 2021 2022 2022 2022 2022 2023 2023 2020 2021 2022 2023 2019 2020 2021 2022 2023
Commercial Development
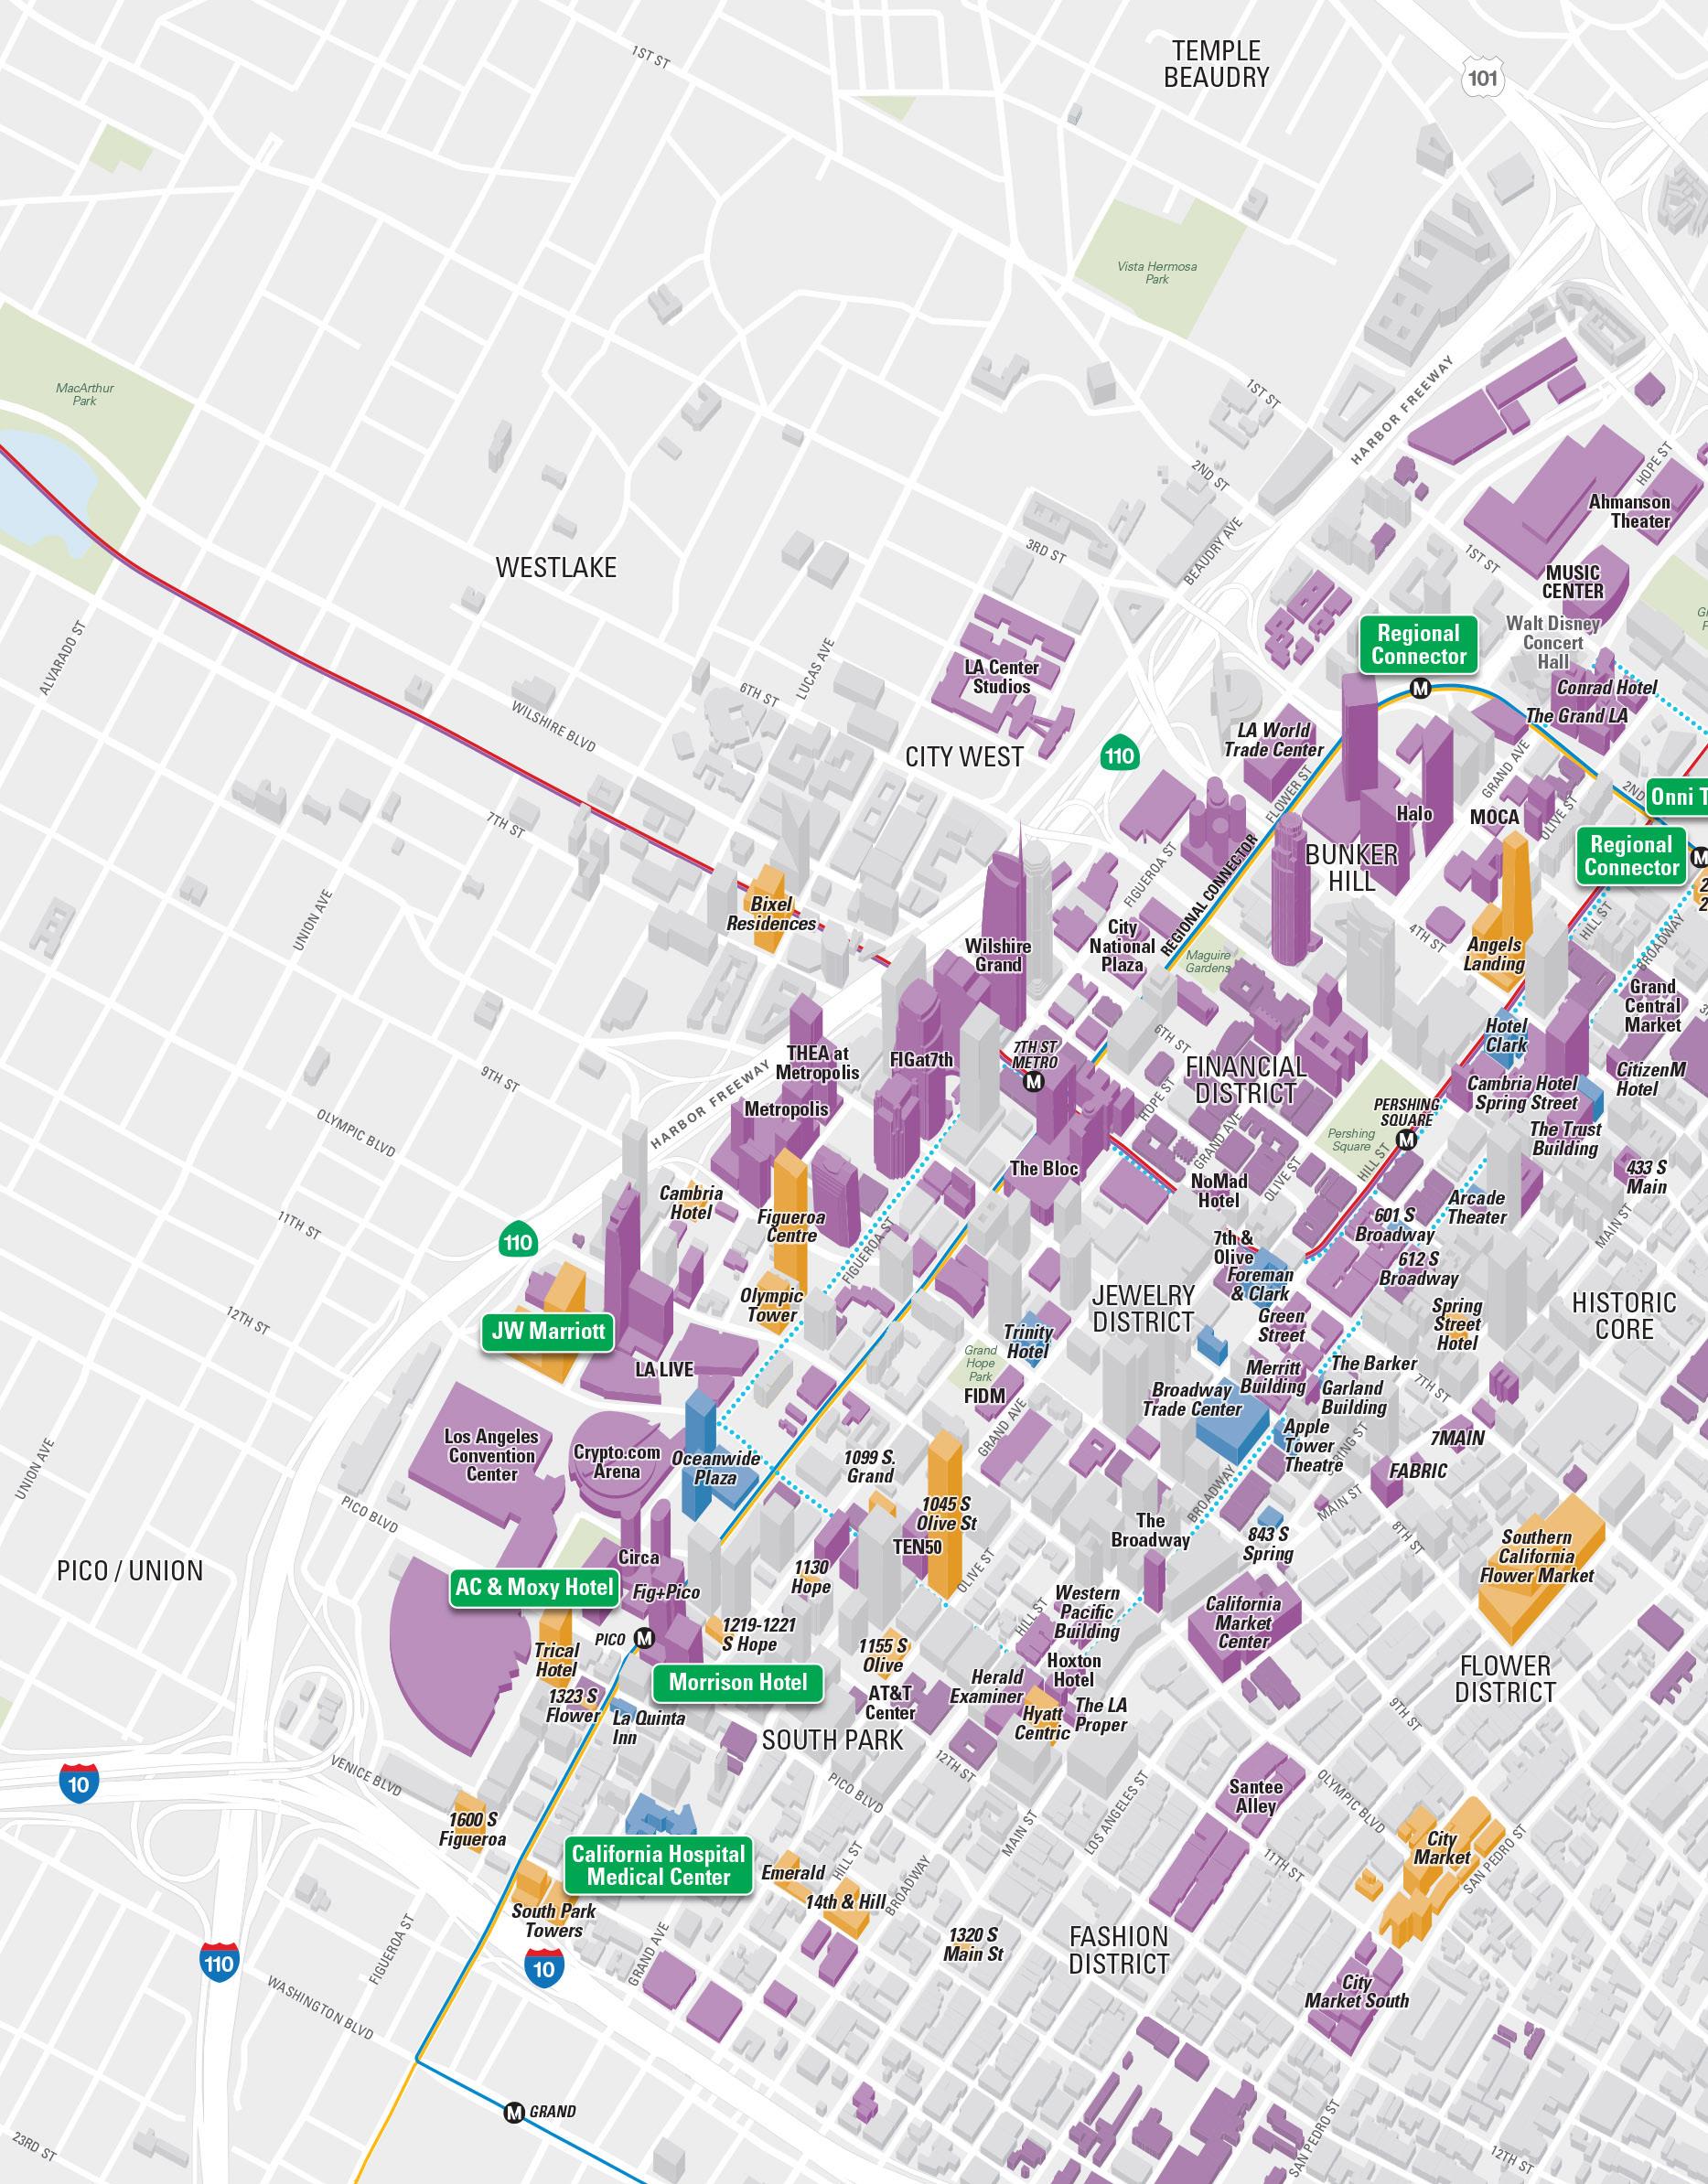
Existing n Under Construction/Renovation n Proposed 2 As of 6/30/2023 Featured Project
n
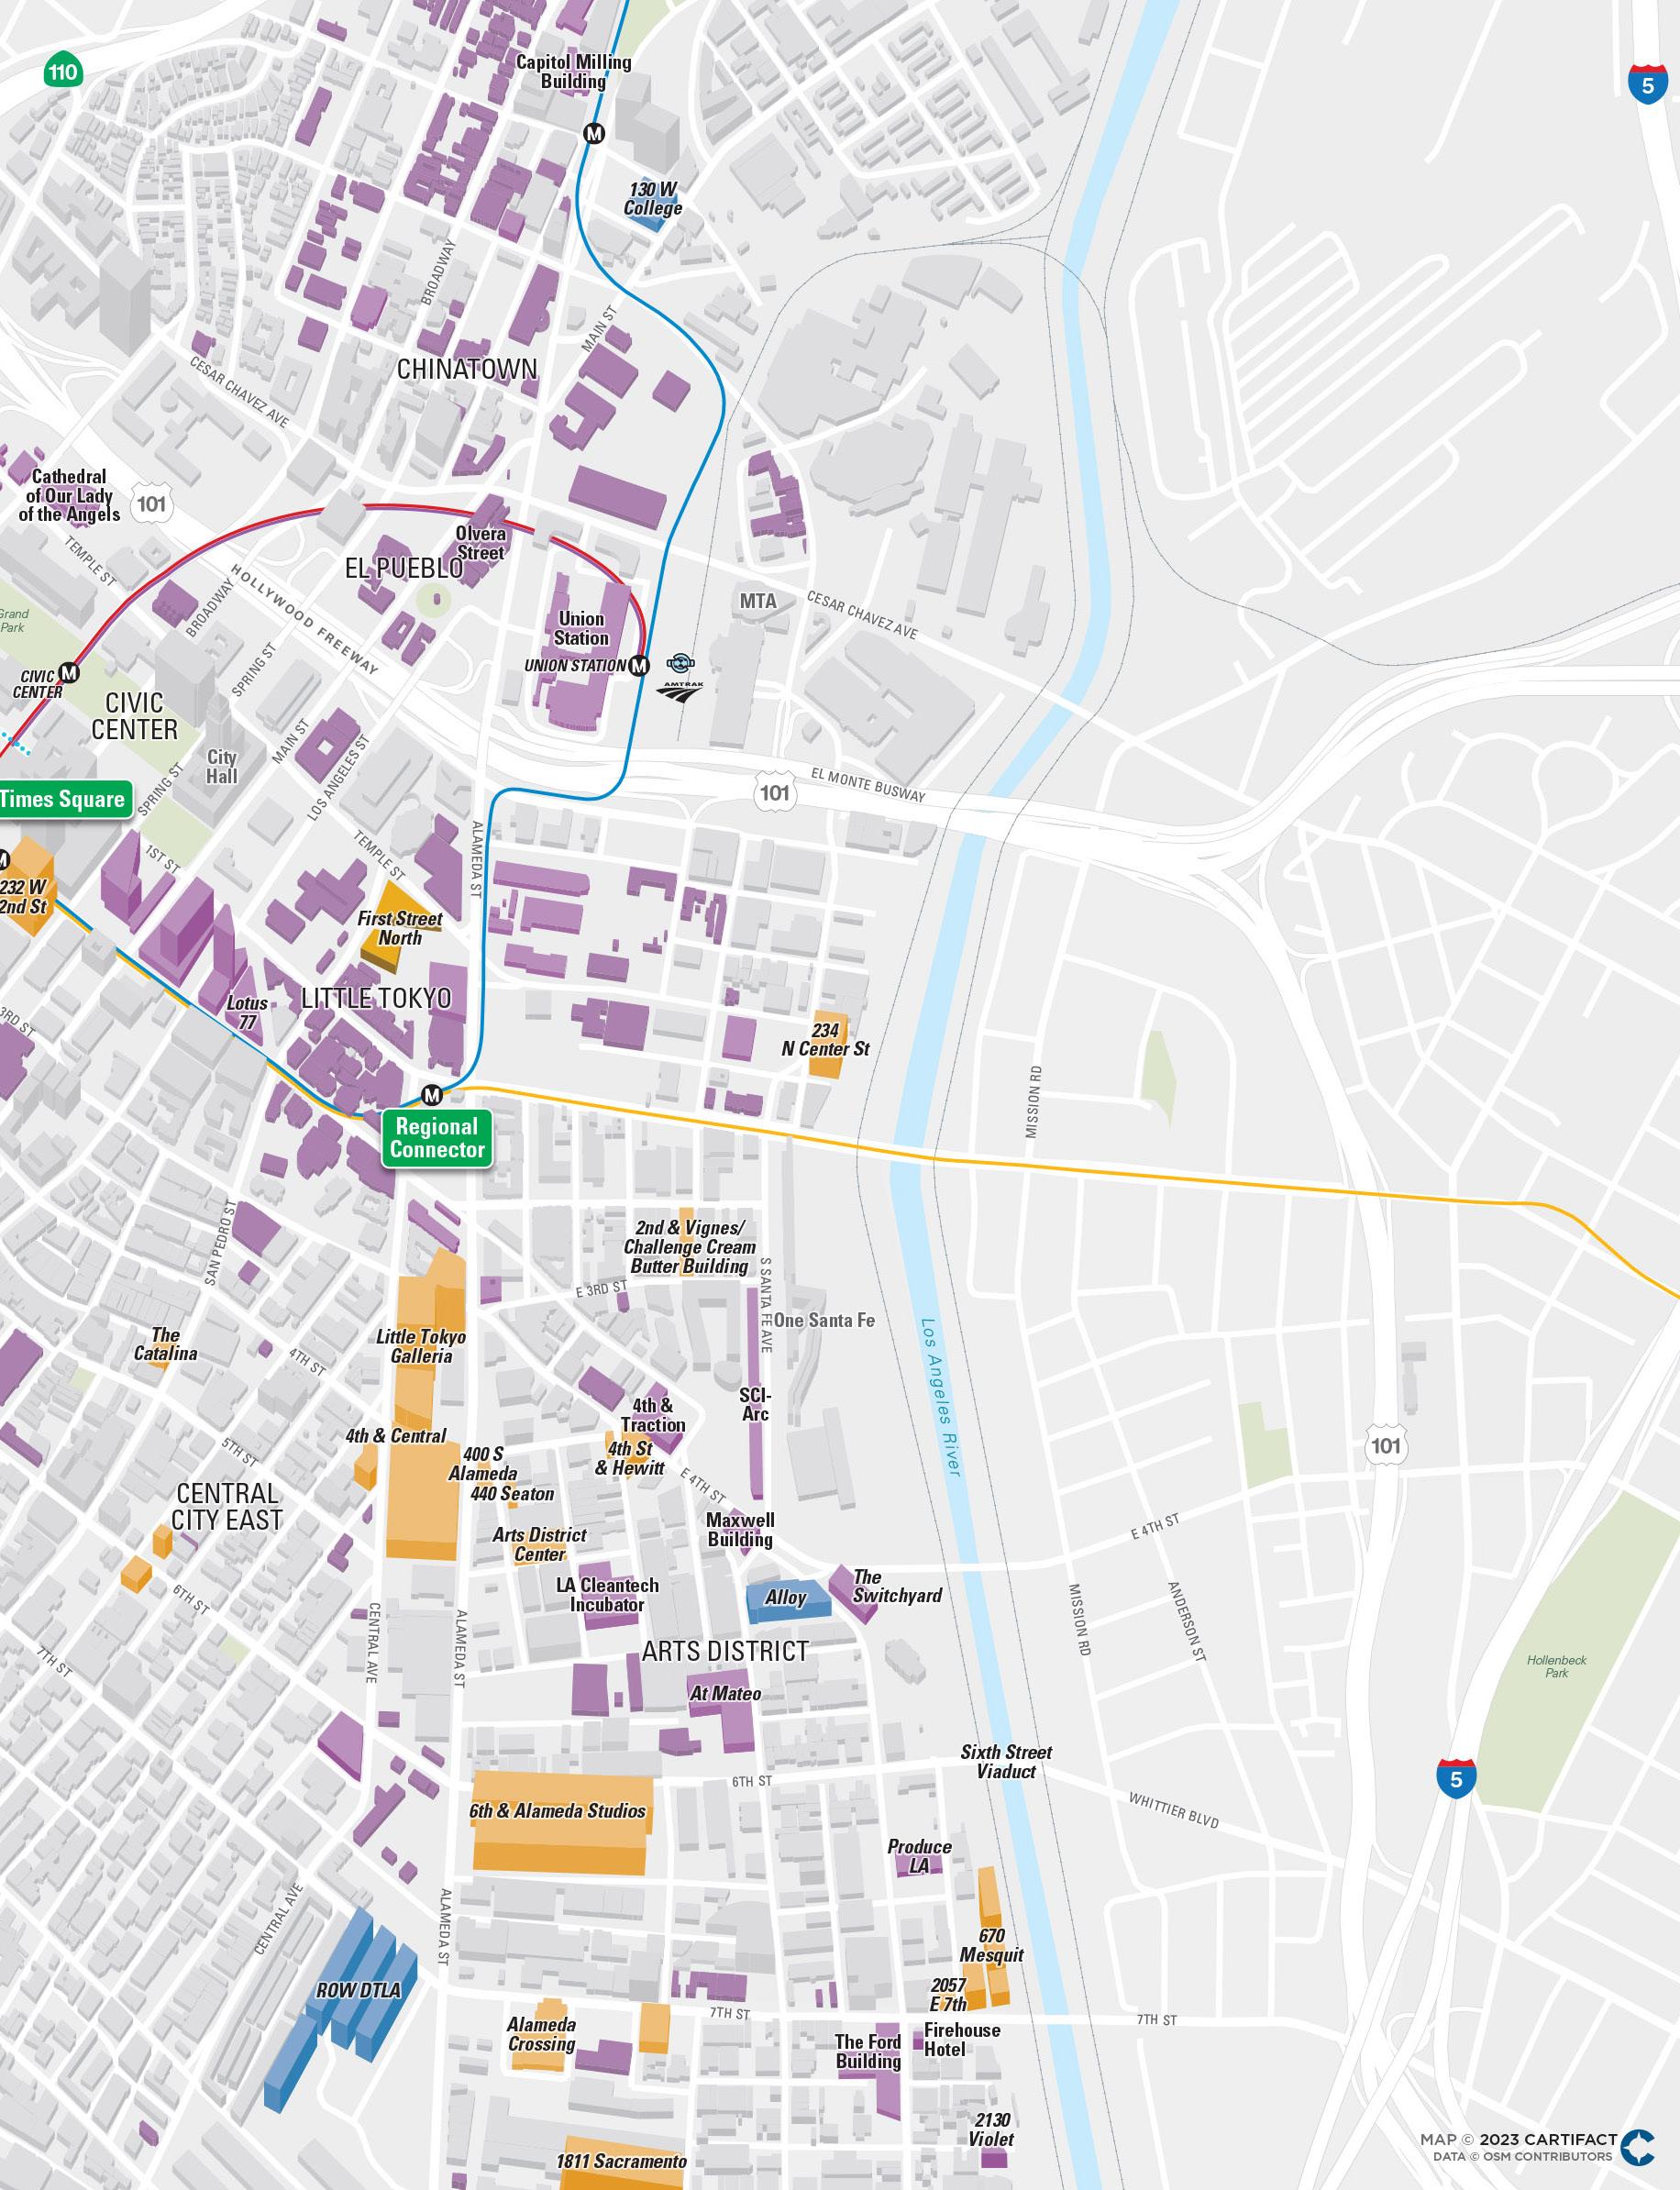
Residential Development
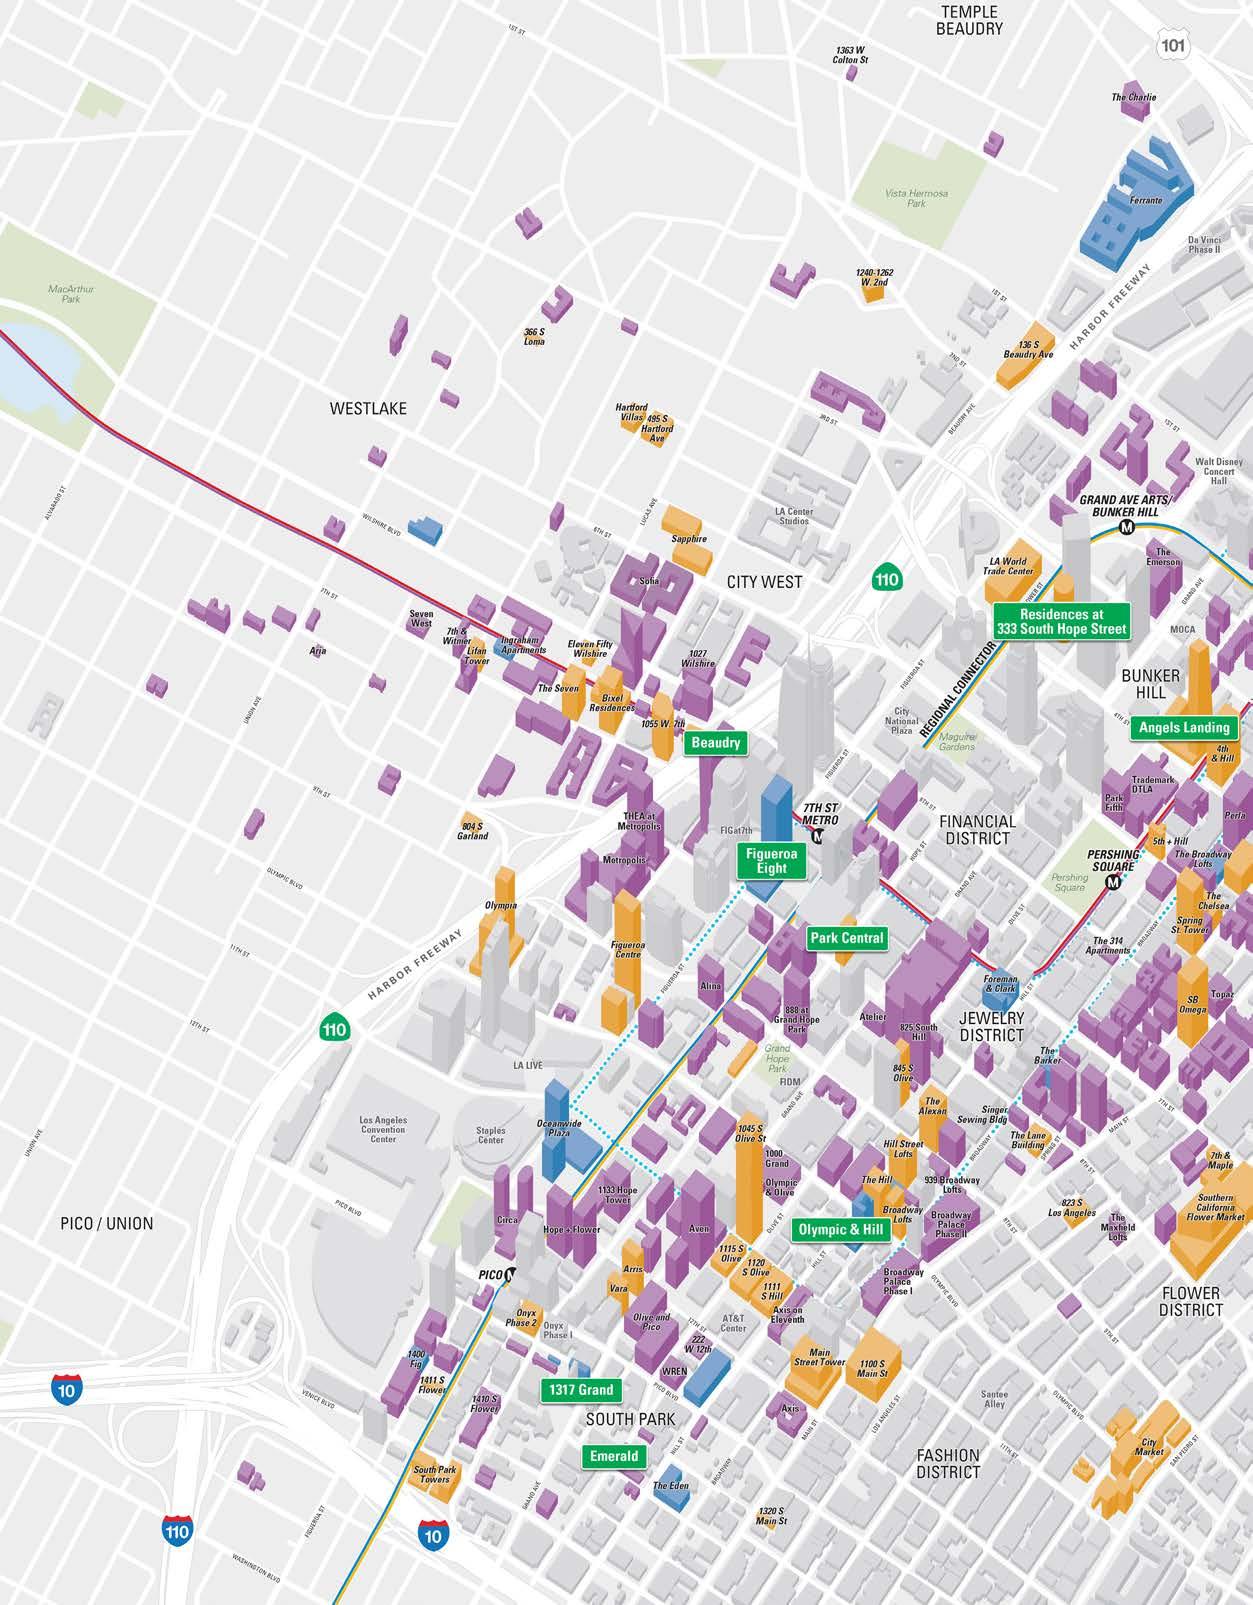
n Existing n Under Construction/Renovation n Proposed 2 As of 6/30/2023 Featured Project
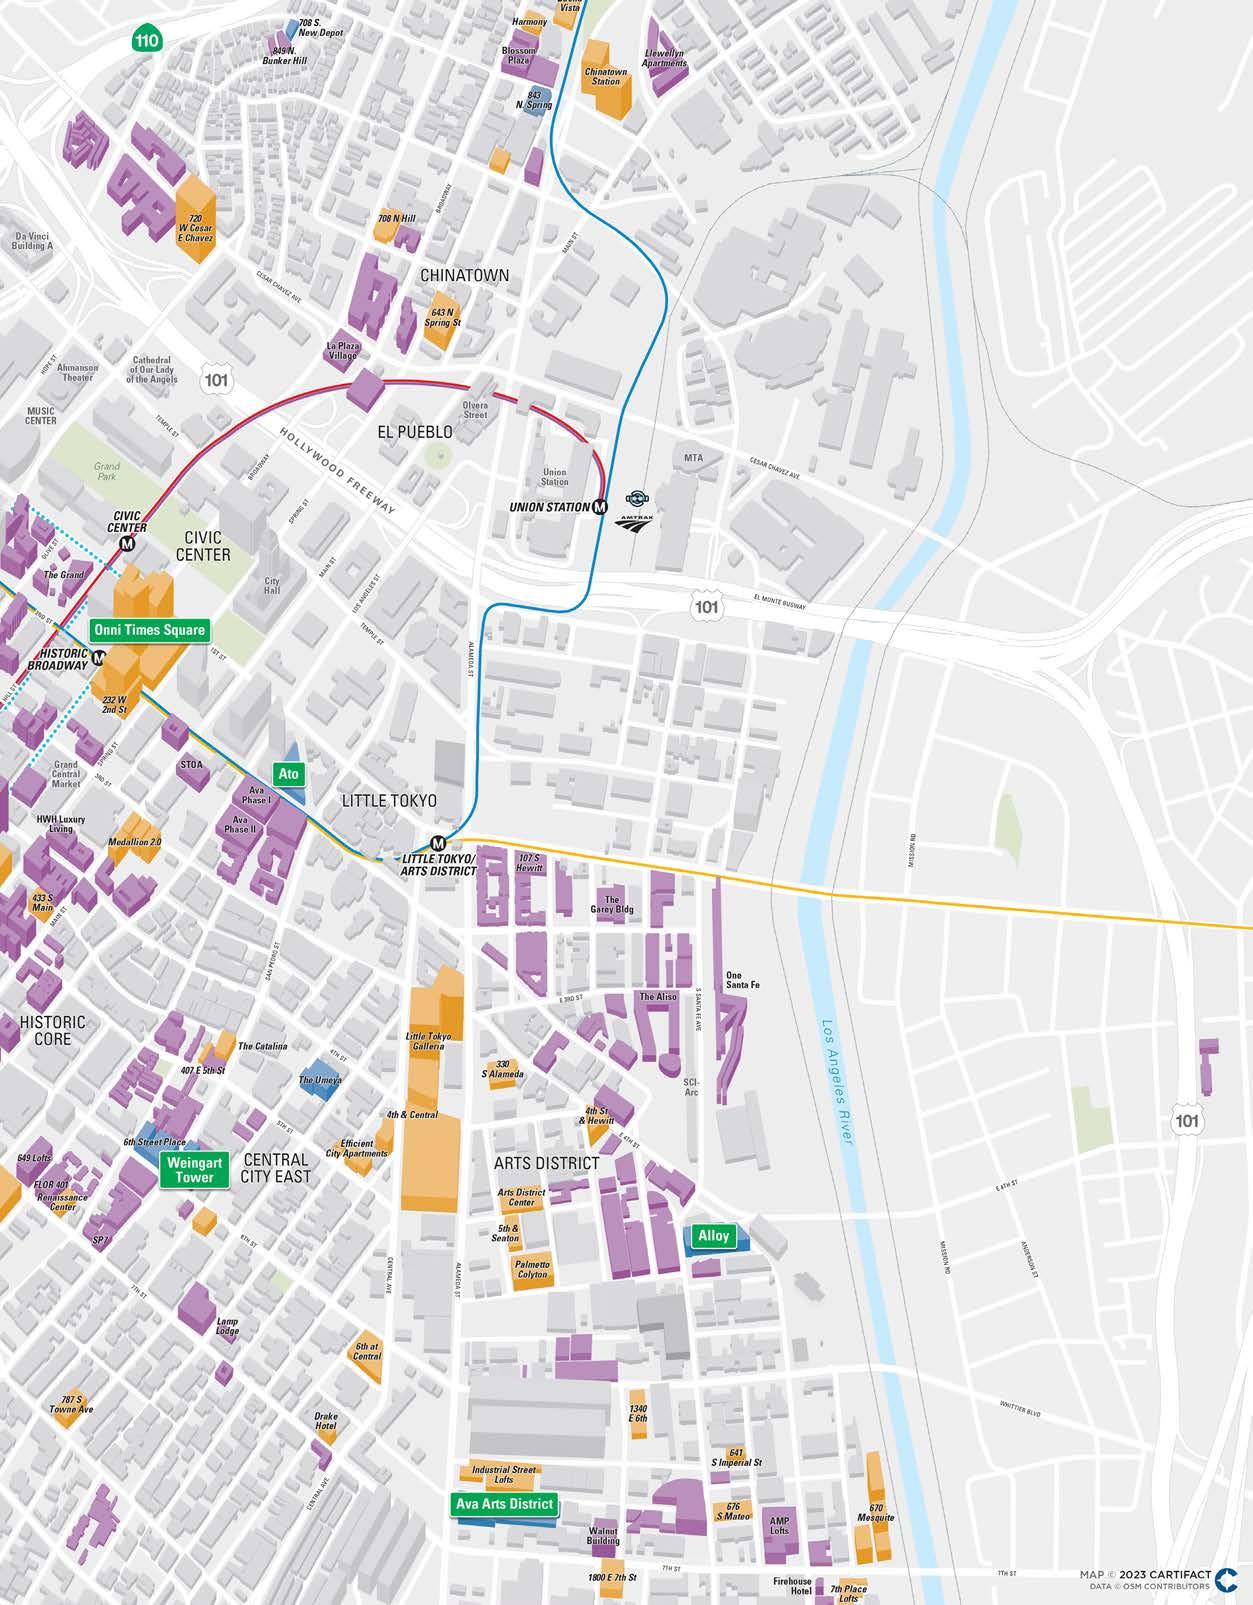
14 Downtown Center Business Improvement District Q2 2023 MARKET REPORT
Project Name Address Residential Units Hotel Rooms Office Sq. Ft. Retail Sq. Ft. Estimated Completion Developer MAJOR MIXED-USE ARTS DISTRICT Alloy 520 S. Mateo St. 475 105,000 20,000 2023 Carmel Partners HISTORIC CORE Broadway Trade Center 801 S. Broadway 150 624,564 345,000 TBD Waterbridge Capital SOUTH PARK Oceanwide Plaza 11th & Figueroa 504 C 184 150,000 TBD Oceanwide Holdings RESIDENTIAL ARTS DISTRICT AVA Arts District 668 S. Alameda St. 475 61,000 2023 AvalonBay Communities CHINATOWN 708 S. New Depot 708 S. New Depot St. 33 2023 ETO Doors Corp. 200 Mesnager 200 Mesnager St. 280 20,000 2024 NBP Capital CITY WEST Ingraham Apartments 1218-1232 W. Ingraham St. 121 2023 SRO Housing Corporation FASHION DISTRICT The Lane Building 206 W. 8th St. 109 1,000 8,119 2023 The Delijani Family FINANCIAL DISTRICT Figueroa Eight 744 S. Figueroa St. 438 7,493 2023 Mitsui Fudosan HISTORIC CORE Brooks Building 644 S. Broadway 30 2,500 TBD 640 S Broadway LLC INDUSTRIAL DISTRICT Weingart Tower 1A 554 S. San Pedro St. 278 2023 Weingart Center 6th Street Place 401 E. 6th St. 94 1,800 2023 Mercy Housing of California JEWELRY DISTRICT Foreman & Clark 701 S. Hill St. 125 8,500 2023 Bonnis Properties LITTLE TOKYO Ato 118 Astronaut E. S. Onizuka St. 77 2,500 2023 Etco Homes The Umeya 414 S. Crocker St. 175 8,691 2024 Little Tokyo Service Center
UNDER CONSTRUCTION
15 Downtown Center Business Improvement District
Project Name Address Residential Units Hotel Rooms Office Sq. Ft. Retail Sq. Ft. Estimated Completion Developer SOUTH PARK 1400 Fig 1400 S. Figueroa St. 106 1,400 2023 DHG Family Trust 1317 S. Hope St. 1317 S. Hope St. 38 4,000 2023 FMB Development 1317 Grand 1317 S. Grand Ave. 151 2023 Housing Diversity Corporation 1411 S. Flower St. 1411 S. Flower St. 227 2023 Housing Diversity Corporation Olympic and Hill 1000-1034 S. Hill St. 700 15,000 2025 Onni Group The Eden 1340 S. Hill St. 235 9,000 2023 Bridger Land Group HOTEL FINANCIAL DISTRICT Hotel Clark 426 S. Hill St. 348 TBD Chetrit Group Trinity Hotel 851 S. Grand Ave. 183 TBD Chetrit Group HISTORIC CORE Cambria Hotel Spring St. 419 S. Spring St. 180 TBD PNK Group SOUTH PARK La Quinta Inn & Suites 1320 S. Flower St. 43 2023 1318 Flower, LLC OFFICE & RETAIL ARTS DISTRICT ROW DTLA 7th & Alameda 1,200,000 200,000 TBD Atlas Capital AtTraction 800-810 Traction Ave. -16 63,100 TBD 2023 LIVWRK and Kotzer CHINATOWN 843 N. Spring St. 843 N. Spring St. 122,000 7,000 2023 Redcar Properties HISTORIC CORE The Barker 722 S. Broadway 46,000 11,000 2023 Satila Studios CIVIC ARTS DISTRICT/LITTLE TOKYO Calif. Hospital Med. Cnt. expansion 1401 S. Grand Ave. 8,000 2023 Dignity Health TOTAL UNDER CONSTRUCTION 4,655 Residential Units 1,088 Hotel Rooms 2,161,664 Office Sq. Ft. 891,003 Retail Sq. Ft. TOTAL # OF PROJECTS = 30
UNDER CONSTRUCTION
16 Downtown Center Business Improvement District Q2 2023 MARKET REPORT
Project Name Address Residential Units Hotel Rooms Office Sq. Ft. Retail Sq. Ft. Developer MAJOR MIXED-USE ARTS DISTRICT 2110 Bay St. 2110 Bay St. 110 113,000 51,000 Bay Capital Fund 670 S. Mesquit St. 670 S. Mesquit St. 308 236 944,000 136,000 Vella Group Arts District Center 1101 E. 5th St. 129 C 113 72,469 Arts District Development, LLC 2117 E. Violet St. 2117-2143 E. Violet St. 347 187,000 22,000 Onni Group 655 S. Mesquit St. 655 S. Mesquit St. 185,000 4,325 Continuum Partners Fourth & Central 400 S. Central Ave. 949/572 C 68 411,000 101,000 Continuum Partners 2045 E. Violet St. 2045 E. Violet St. 435,000 15,500 Hines and Access Industries BUNKER HILL Angels Landing 361 S. Hill St. 252/180 C 515 72,000 Peebles Corp., Macfarlane Ptrs., Claridge Props. CIVIC CENTER Onni Times Square 100 S. Broadway 1,127 307,300 68,817 Onni Group 222 W. 2nd St. 222 W. 2nd St. 680 10,000 Tribune Real Estate Holdings FASHION DISTRICT City Market 9th & San Pedro 948 210 TBD 225,000 Peter Fleming LITTLE TOKYO Little Tokyo Galleria 333 S. Alameda St. 994 100,000 TBD SOUTH PARK Olympic Tower 813 W. Olympic Blvd. 374 C 373 33,500 65,000 Neman Real Estate Development South Park Towers 1600 S. Flower St. 250 300 13,000 Venice Hope Group, LLC RESIDENTIAL ARTS DISTRICT Industrial Street Lofts 1525 Industrial St. 344 25,000 4,000 Camden Palmetto Colyton 527 S. Colyton St. 310 27,400 Bolour Associates 330 S. Alameda St. 330 S. Alameda St. 186 22,000 Greystar 5th & Seaton 5th & Seaton 220 44,530 WW-5th & Seaton 676 S. Mateo St. 676 S. Mateo St. 186 23,000 Maxxam Enterprises 1000 S. Mateo St. 1000 S. Mateo St. 106 120,000 Mateo Arts, LLC 1340 E. 6th St. 1340 E. 6th St. 193 Suncoast Ventures BUNKER HILL LA World Trade Center 350 S. Figueroa St. 570 Jamison Residences at 333 South Hope 333 S. Hope St. 366 425 Brookfield Properties
PROPOSED
17 Downtown Center Business Improvement District
C = Condo CHINATOWN Chinatown Station 924 N. Spring St. 725 51,000 Atlas Capital 720 W. Cesar E Chavez 720 W. Cesar E Chavez 299 8,000 Zion Enterprises/TA Partners 211 W. Alpine St. 211 W. Alpine St. 153 2,500 Izek Shomoff 643 N. Spring St. 643 N. Spring St. 300 149 21,000 Compagnie de Phalsbourg/Creative Space Buena Vista 1251 N. Spring St. 986 38,800 S&R Partners 1435-1465 N. Main St. 1435-1465 N. Main St. 243 1457 Main Property LLC 717 Hill 717 N. Hill St. 411 17,000 TRJLA Homeboy Industries Housing 901-903 S. Main St. 157 Homeboy Industries CITY WEST Eleven Fifty Wilshire 1150 Wilshire Blvd. 140 C 9,000 PacTen Partners The Seven 1135 W. 7th St. 225 7,000 SEVEN Street Properties Bixel Residences 675 S. Bixel St. 422 126 5,600 Career Lofts LA Lifan Tower 1247 W. 7th St. 306 5,700 Lifan Group 1055 W. 7th St. 1055 W. 7th St. 691 Jamison Services FASHION DISTRICT Fashion District Residences 222 E. 7th St. 452 13,655 Realm Group/Urban Offerings 1100 S. Main St. 1100 S. Main St. 379 26,000 Jade Enterprises Broadway Lofts 955 S. Broadway 163 C 6,400 Barry Shy Main Street Tower 1123-1161 S. Main St. 363 12,500 Jade Enterprises 600 S. San Pedro 600 S. San Pedro 302 50,000 3,200 Weingart Center Southern California Flower Market 755 S. Wall St. 323 59,000 81,000 Southern California Flower Growers, Inc The Alvidrez 609-623 E. 5th St. 150 Skid Row Housing Trust FINANCIAL DISTRICT 949 S. Hope St. 949 S. Hope St. 236 6,700 Brookfield Properties 845 S. Olive St. 845 S. Olive St. 334 4,800 Relevant Group Park Central 754 S. Hope St. 580 7,499 Mitsui Fudosan The Bloc Tower 700 S. Flower St. 466 National Real Estate A HISTORIC CORE Hill Street Lofts 920 S. Hill St. 239 C 5,671 Barry Shy SB Omega 601 S. Main St. 452 C 21,514 Barry Shy 4th & Hill - Beacon Tower 340 S. Hill St. 428 5,500 Equity Residential Spring St. Tower 525 S. Spring St. 360 25,000 Downtown Management 433 S. Main St. 433 S. Main St. 196 6,344 Main Street Tower, LLC Project Name Address Residential Units Hotel Rooms Office Sq. Ft. Retail Sq. Ft. Developer
PROPOSED
18 Downtown Center Business Improvement District Q2 2023 MARKET REPORT
Project Name Address Residential Units Hotel Rooms Office Sq. Ft. Retail Sq. Ft. Developer HISTORIC CORE (cont.) The Hill 940 S. Hill St. 232 14,000 940 Hill LLC The Alexan 850 S. Hill St. 305 6,200 Trammell Crow Residential 216 S. Spring St. 216 S. Spring St. 120 2,500 David Lawrence Gray Architects 121 W. 3rd St. 121 W. 3rd St. 331 6,350 Relevant Group INDUSTRIAL DISTRICT Weingart Tower 1B 554 S. San Pedro St. 104 Weingart Center 803 E. 5th St. 803-821 E. 5th St. 94 16,071 Coalition for Responsible Community Development 407 E. 5th St. 407 E. 5th St. 150 Relevant Group Drake Hotel 675 Kohler St. 33 David Duel 6th at Central 601 S. Central Ave. 236 12,000 Triangle Plaza LLC The Catalina 443 S. San Pedro St. 78 7,000 Statewide Acquisitions Corp 787 S. Towne Ave. 787 S. Towne Ave. 60 Towne Plaza, LLC Renaissance Center 423 E. 7th St. 216 AIDS Healthcare Foundation SOUTH PARK Alveare 1405 S. Broadway 335 Related/Weingart Center Arris 1201 S. Grand Ave. 312 7,100 City Century Vara 1233 S. Grand Ave. 148 C 5,000 City Century 1410 S. Flower St. 1370-1418 S. Flower St. 147 6,741 Oxley Place, LLC Olympia Olympic Blvd. & Harbor Fwy. 1,367 40,000 City Century 1045 S. Olive St. 1045 S. Olive St. 794 12,504 Crescent Heights Onyx Phase 2 1301 S. Hope St. 248 30,000 Jade Enterprises 1334 S. Flower St. 1334-1348 S. Flower St. 177 2,500 The Condor 1111 S. Hill St. 1111 S. Hill St. 319 C 160 Crown South Hill, LLC 1115 S. Olive St. 1115 S. Olive St. 536 6,153 Mack Urban / AECOM 1120 S. Olive St. 1120 S. Olive St. 713 11,277 Mack Urban / AECOM 222 W. 12th 222 W. 12th St. 401 8,700 Relevant Group HOTEL ARTS DISTRICT 400 S. Alameda St. 400 S. Alameda St. 66 Habita Arts District, LLC 2057 E. 7th St. 2057 E. 7th St. 50 1711 Lincoln, LLC Radisson RED Hotel 440 S. Hewitt St. 140 Radisson Hotel Group Rendon Hotel 2059 E. 7th St. 103 15,907 Ziman/Greenshields-Ziman FASHION DISTRICT Mama Shelter 124 E. Olympic Blvd. 149 Jamison
PROPOSED
19 Downtown Center Business Improvement District Project Name Address Residential Units Hotel Rooms Office Sq. Ft. Retail Sq. Ft. Developer HOTEL (cont.) HISTORIC CORE Spring Street Hotel 631-633 S. Spring St. 170 Lizard Capital 5th and Hill 319-323 W. 5th St. 31 C 190 JMF Development Continental Building 408 S. Spring St. -56 140 Rebel Hospitality SOUTH PARK Morrison Hotel 1246 S. Hope St. 136 444 15,500 Relevant Group Trical Hotel 1300 S. Figueroa St. 1,024 TBD Trical Construction Inc. 1155 S. Olive St. 1155 S. Olive St. 243 Mack Urban / AECOM Hyatt Centric 1138 S. Broadway 139 United Broadway, LLC JW Marriott LA LIVE expansion 900 W. Olympic Blvd. 861 AEG 1323-1331 S. Flower St. 1323-1331 S. Flower St. 48 132 Elliot Tishbi Cambria Hotel 920-928 James M. Wood Blvd. 247 Sun Capital & Pacific Property Partners 1219-1221 S. Hope St. 1219-1221 S. Hope St. 75 1221 S Hope St, LLC 1099 Grand 1099 S. Grand Ave. 160 AEG 1130 S. Hope 1130 S. Hope St. 112 528 Bryan Domyan OFFICE & RETAIL ARTS DISTRICT 2nd & Vignes 929 E. 2nd St. 70,000 Est4te Four Capital 405 S. Hewitt St. 405 S. Hewitt St. 255,000 15,000 Legendary Development 2159 E. Bay St. 2159 E. Bay St. 217,000 5,000 Tishman Speyer 440 Seaton St. 440 Seaton St. 50,000 Urbanlime Real Estate ADLA Campus 6th & Alameda 292,000 East End Capital 8th & Alameda Studios 2000 E. 8th St. 212,300 Atlas Capital Group 1811 Sacramento 1811 E. Sacramento St. 290,000 Skanska Alameda Crossing 1716 E. 7th St. 290,000 Prologis CHINATOWN 130 College St. 130 W. College St. 225,000 8,200 Riboli Family FINANCIAL DISTRICT 727 Grand Data Center 727 S. Grand Ave. 486,000 Digital Realty May Company Garage 900 S. Hill St. 128,000 10,000 Markwood Enterprises TOTAL PROPOSED* 29,170 Residential Units 6,695 Hotel Rooms 5,304,600 Office Sq. Ft. 1,953,317 Retail Sq. Ft. TOTAL # OF PROJECTS = 119
* all projects included in totals; not all projects displayed in table
PROPOSED
FEATURED PROJECTS
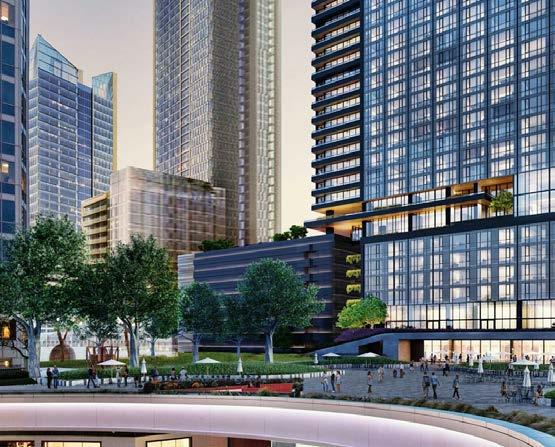
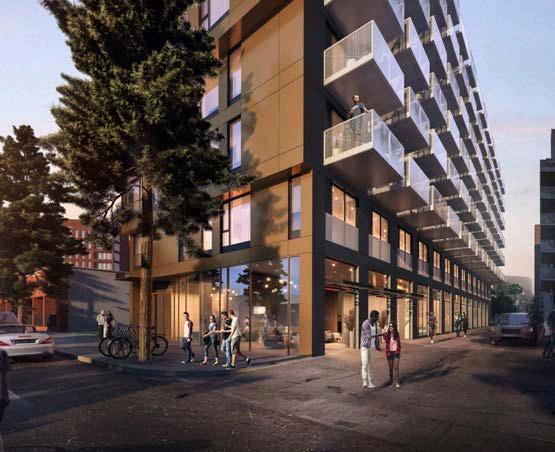
RESIDENTIAL BEAUDRY

Developer: Brookfield
Now Open
CIVIC & CULTURAL REGIONAL CONNECTOR
Developer: Metro
20 Downtown Center Business Improvement District Q2 2023 MARKET REPORT
Situated behind FIGat7th, this 64-story residential tower with 785 units. It is the first residential project from Brookfield Properties, the largest property owner in DTLA.
This 1.9-mile, $1.58 billion underground light rail line opened in June, providing a one-seat ride for north/south and east/west travel across Los Angeles County through the heart of Downtown.
FEATURED PROJECTS Now Open
HOTEL
AC & MOXY HOTEL
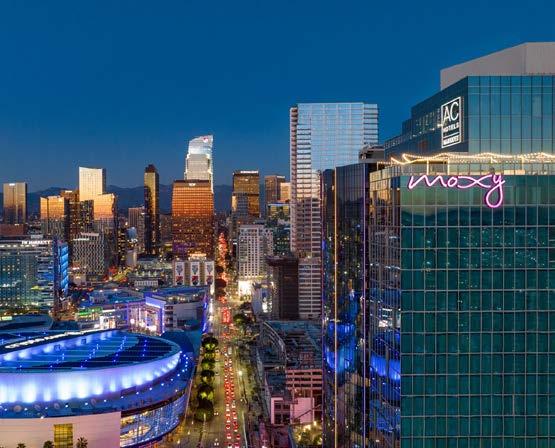
Developer: Lightstone
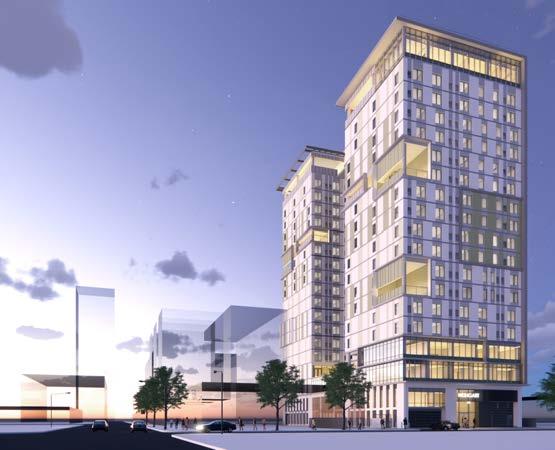
RESIDENTIAL EMERALD
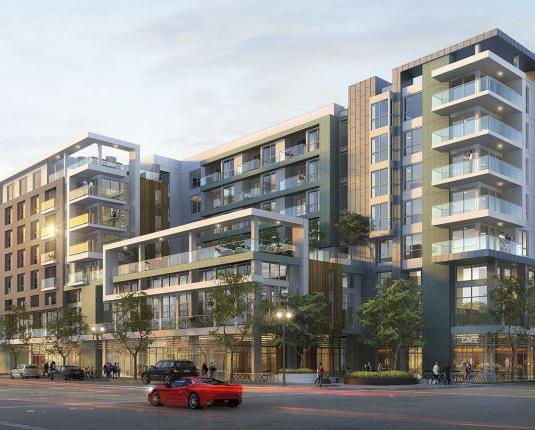
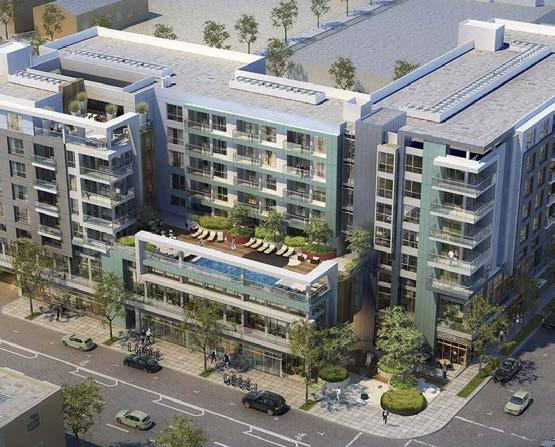
Developer: Jade Enterprises
21 Downtown Center Business Improvement District
727-room hotel featuring Marriott brands Moxy and AC Hotels is the first of several major hotel projects projected to arrive near the LA Convention Center.
The new community is the third residential project in DTLA from local developer Jade Enterprises. Located in South Park, it has 154 residential units and over 10K SF of street-level retail space.
FEATURED PROJECTS Under Construction
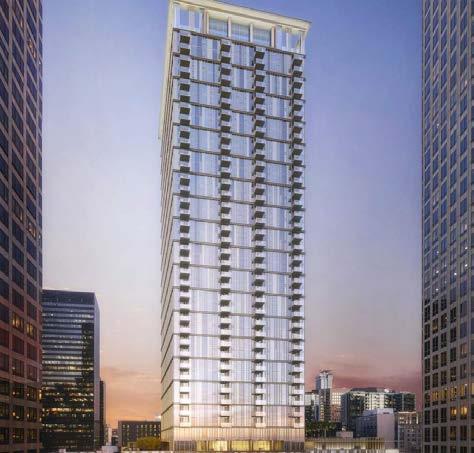
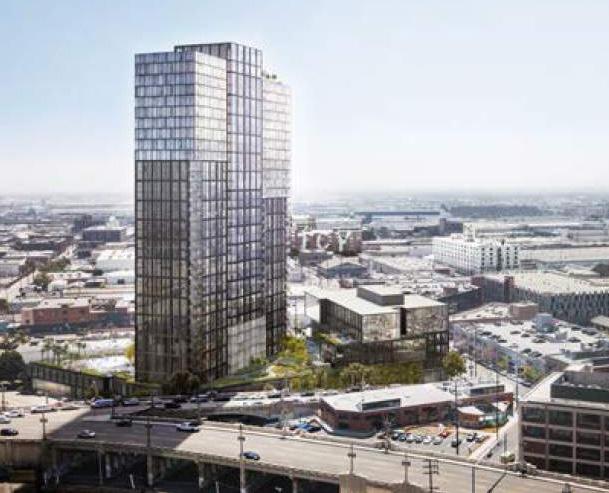
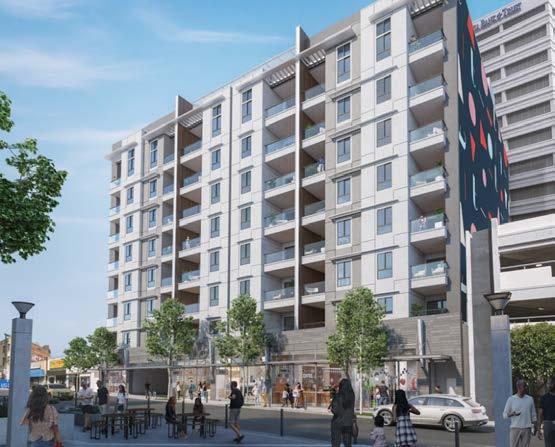
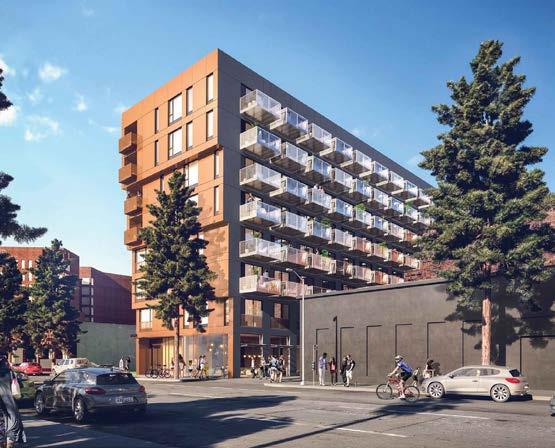
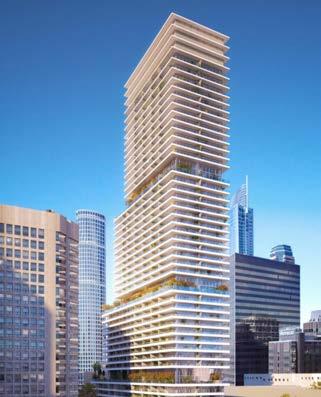
RESIDENTIAL FIGUEROA EIGHT
Developer: Mitsui Fudosan
41-story residential tower with 438 units expected to open this year.
Project developed by Japanese ownership who have held the property since the 1980s.
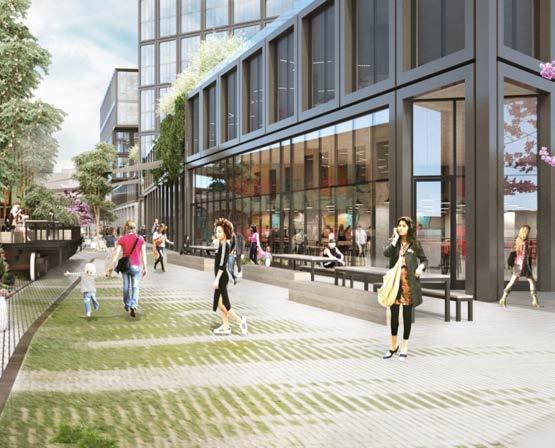
MAJOR MIXED-USE ALLOY
Developer: Carmel Partners
The first high-rise development in the Arts District will feature 475 apartments and over 100K SF of office space.
22 Downtown Center Business Improvement District Q2 2023 MARKET REPORT
FEATURED PROJECTS Under Construction
RESIDENTIAL ĀTO
Developer: ETCO Homes
Sales are expected to begin soon at this 77-unit condo project in Little Tokyo that is nearing completion.
AFFORDABLE HOUSING WEINGART TOWER 1A
Developer: Weingart Center Foundation
One of the largest permanent supportive housing projects in DTLA, this 19-story development includes 278 units.
23 Downtown Center Business Improvement District
FEATURED PROJECTS Under Construction
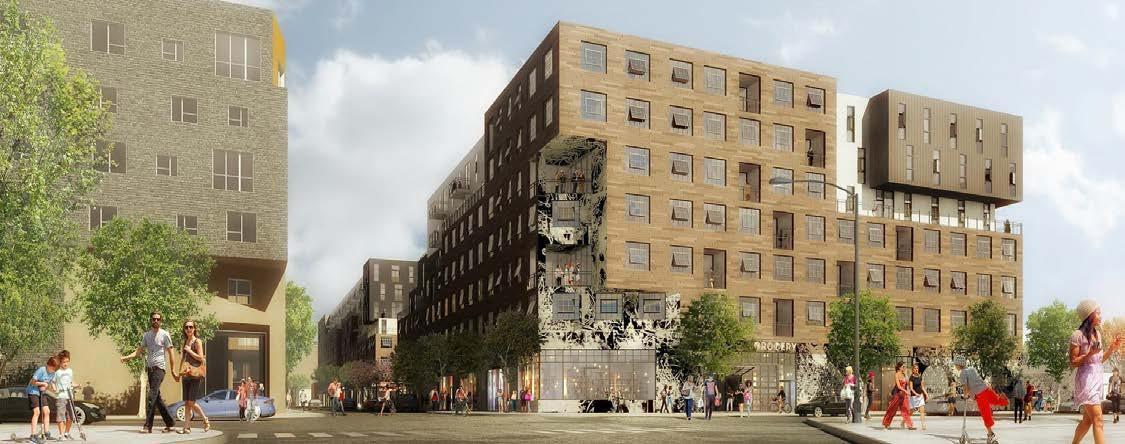
RESIDENTIAL AVA ARTS DISTRICT
Developer: AvalonBay
475 apartments over 61,000 SF of retail space across from ROW DTLA in the Arts District.

RESIDENTIAL OLYMPIC & HILL
Developer: Onni Group
At over 760 feet and 60 stories, this will be the city’s 4th tallest building and tallest residential high-rise.
24 Downtown Center Business Improvement District Q2 2023 MARKET REPORT
FEATURED PROJECTS Under Construction
RESIDENTIAL 1317 GRAND
Developer: Housing Diversity Corporation
This project will feature 147 studio “micro-unit” apartments averaging around 325 SF with no on-site parking.
CIVIC & CULTURAL
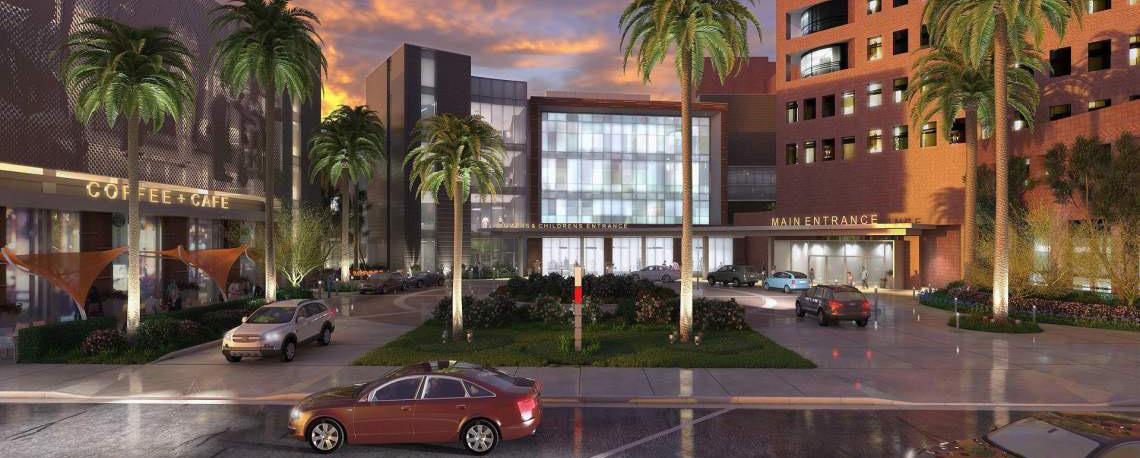
CALIFORNIA HOSPITAL MEDICAL CENTER
Developer: Dignity Health California
The hospital campus is adding a four-story, 150 K SF patient tower to expand its ER, trauma, and maternity departments.
25 Downtown Center Business Improvement District
FEATURED PROJECTS Proposed
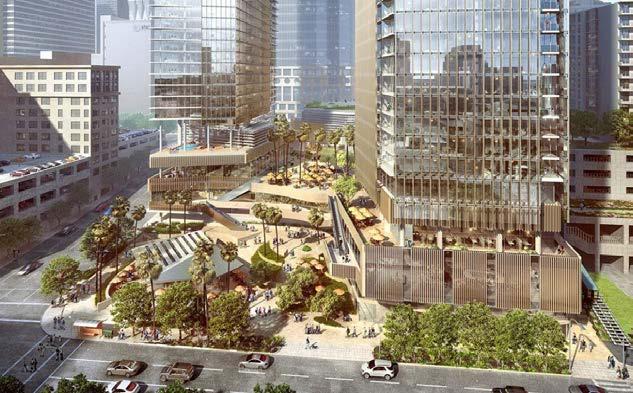
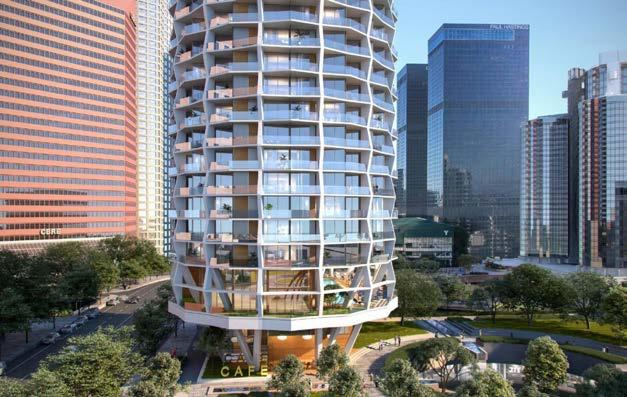
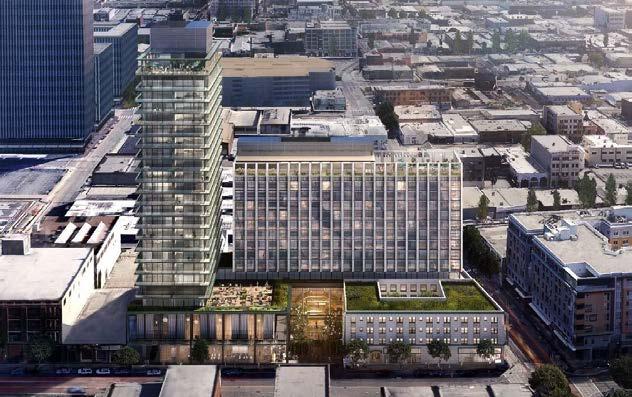
MAJOR MIXED-USE ANGELS LANDING
361 S. Hill St.
Developer: Peebles Corporation, Macfarlane Partners, Claridge Properties Design: Handel Architects
Planned two-tower development to feature luxury hotel venues, spacious condos & apartments featuring panoramic views, and a terraced, ground-level, open-air public plaza.
HOTEL
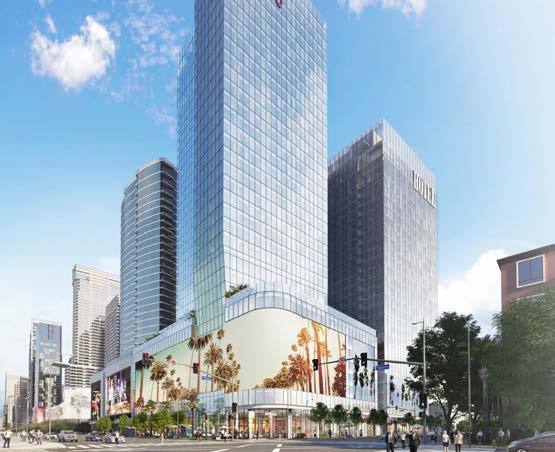
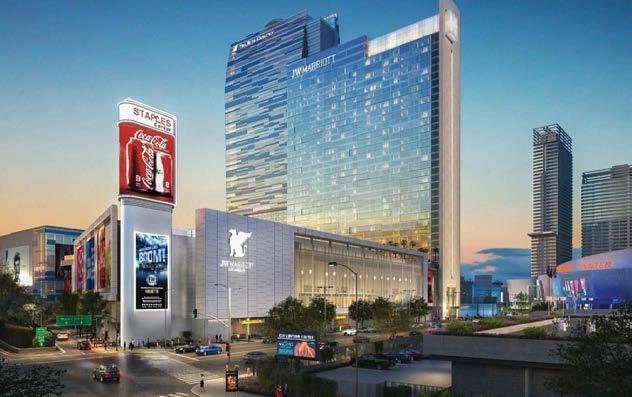
JW MARRIOTT LA CONVENTION CENTER EXPANSION
900 W. Olympic Blvd.
Developer: AEG and Plenary Group
Design: Gensler, Populous, Olin
700K SF expansion of the existing hotel will add 861 new hotel rooms at LA Live.
MAJOR MIXED-USE
ONNI TIMES SQUARE
100 S. Broadway
Developer: Onni Group
Design: Solomon Cordwell Buenz (SCB) and CallisonRTKL (CRTKL)
Proposed high-rise towers to replace 1973 addition will include over 1,000 apartments, 70K SF of retail, and revitalization of the original 1935 building.
26 Downtown Center Business Improvement District Q2 2023 MARKET REPORT
FEATURED PROJECTS Proposed
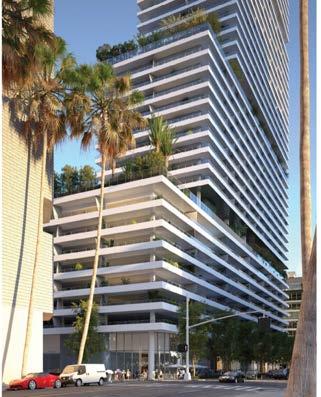
RESIDENTIAL PARK CENTRAL
754 S. Hope St.
Developer: Mitsui Fudosan
Design: Gensler
580 market-rate residential units, 7,500 SF of retail, 37K SF for a charter school.
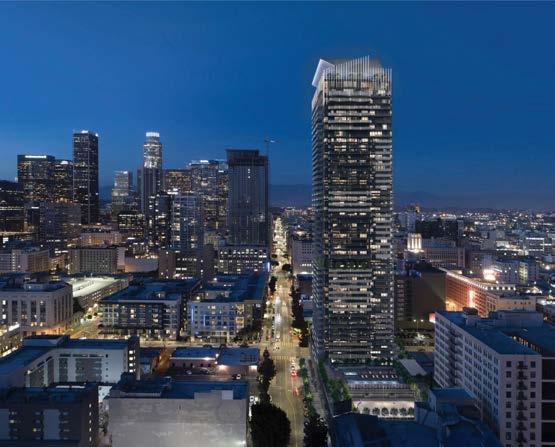
RESIDENTIAL RESIDENCES
AT
333 SOUTH HOPE STREET
333 S. Hope St.
Developer: Brookfield Properties
Design: ARGE Architecture
Residential tower at Bank of America Plaza will include over 350 residential units in the heart of Bunker Hill.
MIXED-USE HOTEL MORRISON HOTEL
1220-1246 South Hope Street
Developer: Relevant Group Design: SHoP Architects
Proposed development would both renovate the original 1914 property and build a new 15-story tower with 444 guest rooms.
27 Downtown Center Business Improvement District
Nick Griffin, Executive Director (213) 416-7522 I ngriffin@downtownla.com
Elan Shore, Director of Economic Development
(213) 416-7518 I eshore@downtownla.com

CONTACT US
SEE DOWNTOWN LA IN A NEW PERSPECTIVE For a more interactive experience, take the DTLA Virtual Tour. DOWNTOWNLA.COM / VIRTUAL SCAN
