2022 –2023

2
Institutional Profile 3 Student Profile………………………………………………………............................................................... 19 Alumni Profile………………………………………………………................................................................. 31 Faculty Profile 33 Facilities 38 Research………………………………………………………........................................................................ 45 Community Engagement……………………………………………………………………………….............. 55 Effat College of Humanities 59 Effat College of Business 68 Effat College of Engineering 78 Effat College of Architecture and Design……………………………………………………………………… 87
Table of Content
INSTITUTIONAL PROFILE

History
Effat University is a leading private non-profit institution of higher education for women in Saudi Arabia, operating under the umbrella of King Faisal’s Charitable Foundation Effat University is strengthened by the legacy of its founder, Queen Effat Al- Thunayyan Al-Saud, wife of the late King Faisal Bin Abdulaziz (May God rest their souls)
In 1419 H, (corresponding to 1999 G), it started offering academic programs under the name of Effat College. In order to be a center of academic excellence, Effat College launched different academic programs taught in English to expand the horizons of women in Saudi Arabia and raise their educational level. The first two departments established by the college were Computer Science and Kindergarten These programs aimed to prepare women for the job market and increase their chances of finding work opportunities
Today, Effat University has further developed to offer 4 graduate degrees and 12 undergraduate degrees under four colleges and 12 departments Some of these programs and their tracks are the first to be offered in the Kingdom to women including undergraduate programs in Cinematic Arts, Entrepreneurship, and Supply Chain Management. A new postgraduate program was also introduced to women in 2017-2018, the Master of Science in Energy Engineering (MSEE). In 2019-2020, Effat University opened its doors to male students in master degree programs, and in 2021-2022, the university started admitting male students in the undergraduate programs By the end of 2021-2022, Effat University developed its fifth strategic plan (2022-2027) to be implemented starting 2022-2023
3
Vision
Effat University strives to be recognized as one of the world's leading institutions in scientific discovery and innovation presenting solutions to societal challenges, and to serve as agent of change that advances inspired leaders and scholars in fulfilling Queen Effat Al-Thunayan Al-Saud's vision (God rest her soul).
Mission
Effat University prepares aspirational and effective leaders of international quality who contribute to national and global progress by interweaving Effat University Core Values into an innovative education which creates a culture of broad inquiry, intellectual engagement, and valuable societal impact

4
1.
Goals
Monitor the achievement of Effat University's mission and vision in line with the Saudi Vision 2030
Enhance the governance well as national Develop and maintain University an icon
Enhance the university students' quality of life to prepare experts and leaders that uphold the legacy of Queen Effat (God rest her soul).
Maintain and enhance order to make
Foster a culture choice for the
Build a knowledge community that generates creative ideas and innovations to meet future challenges and contribute to the achievement of Saudi Vision 2030.
Strengthen the University’s visibility by building relations and exchanging knowledge with communities nationally and internationally. Offering consultancy services.

5
5.
7. 8.
2. 3. 4.
6.


6
Organizational Structure
Academic Offices
Entrepreneurship, Marketing & Strategies Department Chair Dr. Zainah Qasem
Finance Department
Supply Chain Management Department
Chair Dr. Edib Smolo
Chair Dr. AbdulAziz AlMaktoum
Office Unit Head Name Provost Office Provost Dr. Mervat Chouman Effat College of Architecture and Design Dean Dr. Asmaa Ibrahim Architecture Department Chair Dr. Nihal AbdelGawwad Design Department Chair Dr. Sajid
Chair Dr. Mohamed
Dean Dr. Linda
Khalifa Cinematic Arts School
Ghazala Effat College of Humanities
Maloul
Chair Dr.
Chair Dr. Tabassum
Education
Chair Dr. Khadija
Effat English
Coordinator Dr. Pakenam Shiha Effat College of
Dean Dr. Akila Sarirete Computer Science Department Chair Dr. Zain
and
Chair Dr. Enfel
Acting Dean Dr. Uzma
English and Translation Department
Linda Maloul Psychology Department
Rashid General
Program
Itani
Academy
Engineering
Balfagih Electrical
Computer Engineering Department
Barakat Effat College of Business
Javed
7
Deanship
Administrative Offices
Management of Facilities & Equipment, Building and Grounds Director Mr. Rushdy Al Azzah
Management of Facilities & Equipment, Maintenance and Operations
Office of Institutional Research & Quality Assessment
Effat Library and Cultural Museum
Director
Director
Director
Eng. Ernie Geslani
Dr. Mohamed Mahees
Dr. Ayman Eddakrouri Testing Center
Manager
Ms. Yara Khoja
Office Head Person in-Charge President Office President Dr. Haifa JamalAl-Lail Vice-Presidency of Planning and Development Acting Vice President Dr. Haifa Jamal Al-Lail Deanship of Admissions and Registration Dean Dr. Reem Al Madani
for
Acting Dean Dr. Mervat
Deanship
Student Affairs
Chouman
Dean Dr.
Deanship of Quality Assurance
EmanMohamed
Vice-Dean Prof. Mady Mohamed Management of Human
Director-General Ms. Abeer Islam Management of Finance Director-General Ms. Shatha Edrees Management of Communications & Public Relations Director Ms. Maha Al-Madi Management
Director-General Ms. Moodi Al Saib
for Graduate Studies & Research
Resources
of Information and Educational TechnologyServices, Facilities andEquipmentand General Services
8
Institutional Accreditation (National)

Effat University received institutional accreditation among the first six public and private universities receiving the first ever accreditation conferred by NCAAA After acquiring national accreditation/reaccreditation for all its bachelor degrees that are eligible for accreditation, Effat University was one of the very few universities that acquired national accreditation for its master degrees - Master of Science in Translation Studies (Now known as Master of Science in Translation and Interpreting), Master of Science in Finance, and Master of Science in Urban Design

9
Institutional Accreditation (International)
New England Commission of Higher Education
The New England Commission of Higher Education has determined that Effat University is eligible to proceed with an application for candidacy for accreditation within two years. A determination of eligibility is not candidacy or accreditation, nor does it indicate a likelihood of eventual accreditation. Questions about eligibility and the accreditation process should be directed to the President of the Commission.
New England Commission of Higher Education
301 Edgewater Place, Suite 210 Wakefield, MA 01880
Programs Accreditation (International)

In 2016-2017, the Effat College of Engineering obtained international accreditation from the Accreditation Board for Engineering and Technology (ABET). The ABET accreditation for the three programs; Electrical and Computer Engineering, Computer Science, and Information Systems extends from 2015 to 2023.

Effat University, Department of Architecture has received the International Certification designation from the National Architectural Accrediting Board (NAAB) for the Bachelor of Science in Architecture ICert was granted in 2019 for a term of six years.

In 2021, the Effat College of Business obtained international accreditation from for its 5 bachelor and one master degree from the Association to Advance Collegiate Schools of Business (AACSB) for five years
11
Programs Accreditation (National)
Effat College of Engineering


Programs Accreditation (National)
Effat College of Business

13
Programs Accreditation (National)
Effat College of Humanities


14
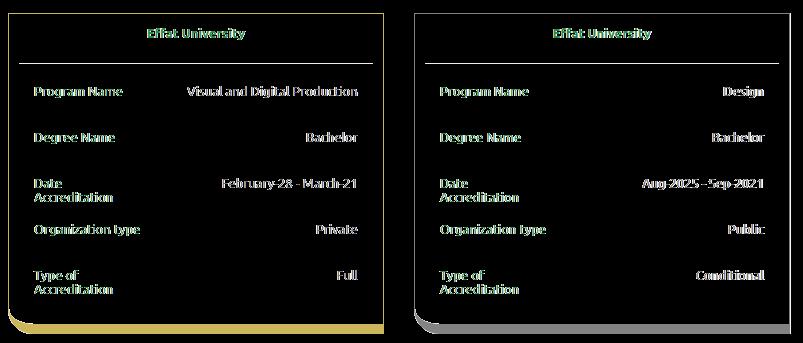
Programs Accreditation (National)
Effat College of Architecture and Design


15
Ranking

Arab Region Rankings
The QS ranking comprises world and subject rankings (which name the world's top universities for the study of 46 different subjects and five composite faculty areas), alongside five independent regional rankings (i.e., Asia, Latin America, Emerging Europe and CentralAsia, BRICS and the Arab Region)
In 2017-2018, Effat University was ranked among the top 100 best Universities in the Arab Region. For the year 2023, Effat University was ranked #61 – 70. This is an indication that Effat University is making a mark on the regional community

The Times Higher Education(THE) Arab University Rankings, introduced in 2021, demonstrates the strength of higher education across the region for the first time based on a unique methodology including new regional measures on reputation and collaboration, as well as the inclusion of metrics related to social impact, reflecting the focuses of Arab universities. For the year 2022, Effat University was ranked #91 – 100.
2018 2019 2020 2021 2022
#81 - 90 #101 - 110 #81 - 90 #81 - 90 #61 - 70
2023
2022
#61 - 70 2023 TOP 100
Rating

Awards

King
Quality reference according compete large institutions
Following review academic King
STUDENT PROFILE


New Student Enrolment
Students Admissions Data Fall 2020 Spring 2021 20202021 Fall 2021 Spring 2022 2021 – 2022 Fall 2022 Spring 2023 2022 – 2023 Total Number in Recruitment Database 26,021 13,774 39,795 21,845 11,901 33,746 20,864 12,960 33,824 Total Number of Interested Applicants 1,414 772 2,186 1,459 840 2,299 1,124 881 2,005 Total Number of Completed Applications 713 109 822 453 152 605 418 114 532 Total Number of Admitted Students 449 68 517 332 125 457 330 68 398 Total Number of Newly Enrolled Students 345 53 398 252 110 362 264 51 315 Total Number of Transfer Students 10 2 12 7 2 9 8 3 11 Acceptance Rate (#admitted/#applied) 63 62 125 73 82 156 79 60 139 Enrolment Yield (#enrolled/#admitted) 77 78 155 76 88 164 80 75 155
Undergraduate
Admissions Data Fall 2020 Spring 2021 20202021 Fall 2021 Spring 2022 2021 – 2022 Fall 2022 Spring 2023 2022 –2023 Total Number in Recruitment Database 3,216 1,702 4,918 2,161 1,177 3,338 1,570 976 2,546 Total Number of Interested Applicants 175 95 270 144 83 277 85 66 151 Total Number of Completed Applications 90 1 91 47 1 48 33 0 33 Total Number of Admitted Students 55 1 56 29 1 30 21 0 21 Total Number of Newly Enrolled Students 48 0 48 23 0 23 20 0 20 Total Number of Transfer Students 0 0 0 0 0 0 0 0 0 Acceptance Rate (#admitted / #applied) 61 100 161 62 100 162 64 0 64 Enrolment Yield (#enrolled / #admitted) 87 0 87 79 0 79 95 0 95 *Main intake is during the Fall semester, in correspondence to the end of the high schools’ and colleges’ calendar 20
Postgraduate Students
Academic Year 2022-2023 Compared to 2020-2021 & 2021-2022

21 Historical Student Enrolment
*Including Number of Students in Foundation Level, Leave of Absence and Pending Graduation Students.

Historical Student Enrolment 22

23 Historical Student Enrolment
Student Enrolment by Level
Headcount Enrolment Fall 2020 Spring 2021 Fall 2021 Spring 2022 Fall 2022 Spring 2023 Foundation 192 148 126 135 144 103 Freshmen 309 179 410 385 435 340 Sophomore 175 202 213 256 269 302 Junior 113 176 176 159 201 229 Senior 292 278 186 184 217 213 Master 97 87 79 74 57 42 Overall 1178 1070 1190 1193 1323 1229 24
Headcount Enrolment Fall 2020 Spring 2021 Fall 2021 Spring 2022 Fall 2022 Spring 2023 Undergraduate* 1081 983 1111 1119 1266 1187 Postgraduate 97 87 79 74 57 42 Overall 1178 1070 1190 1193 1323 1229
Academic Year 2022-2023 Compared to 2020-2021 & 2021-2022
*Including Number of Students in Foundation Level, Leave of Absence and Pending Graduation Students. 1 non-matriculating student is not added to this count in Fall 2022.
Enrolment Headcount Undergraduate Enrolments by Colleges Fall 2020 Spring 2021 Fall 2021 Spring 2022 Fall 2022 Spring 2023 Effat College of Humanities 151 133 143 142 147 128 EffatCollege of Architectureand Design 442 395 435 426 461 446 Effat College of Business 270 246 290 295 352 329 Effat College of Engineering 218 209 243 256 306 284 Overall 1081 983 1111 1119 1266 1187 Enrolment Headcount Graduate Enrolments by Colleges Fall 2020 Spring 2021 Fall 2021 Spring 2022 Fall 2022 Spring 2023 Effat College of Humanities 16 15 13 13 11 6 Effat College of Architecture and Design 34 29 30 26 21 16 Effat College of Business 29 25 24 24 18 15 Effat College of Engineering 18 18 12 11 7 5 Overall 97 87 79 74 57 42 25
Colleges Academic Year 2022-2023 Compared to 2020-2021 & 2021-2022 Enrolment Headcount Overall (Undergraduate & Graduate) Enrolments by Colleges Fall 2020 Spring 2021 Fall 2021 Spring 2022 Fall 2022 Spring 2023 EffatCollege of Humanities 167 148 156 155 158 134 Effat College of Architecture and Design 476 424 465 452 482 462 Effat College of Business 299 271 314 319 370 344 Effat College of Engineering 236 227 255 267 313 289 Overall 1178 1070 1190 1193 1323 1229
Student Enrolment by
Number of Students in Foundation Level, Leave of Absence and Pending Graduation Students. 1 non-matriculating student is not
this count in Fall 2022.
*Including
added to
Absence
Students. 1 non-matriculating
*Including Number of Students in Foundation Level, Leave of
and Pending Graduation
student is not added to this count in Fall 2022.
Level,
Absence
Pending Graduation Students. 1 non-matriculating
*Including Number of Students in Foundation
Leave of
and
student is not added to this count in Fall 2022.
*Including Number of Students in Foundation Level, Leave of Absence and Pending Graduation Students.

Historical Student Enrolment by Colleges
26
New Student Enrolment by Nationality
Overall Student Enrolment by Nationality per College
* Count is based on Spring 2022 numbers
Undergraduate Admissions Data Fall 2020 Spring 2021 2020 -2021 Fall 2021 Spring 2022 2021 -2022 Fall 2022 Spring 2023 2022 -2023 Total Number of Saudi (Newly Enrolled) 214 27 241 155 45 200 148 21 169 Total Number of NonSaudi (Newly Enrolled) 131 26 157 99 65 164 116 30 146 Graduate Admissions Data Fall 2020 Spring 2021 2020 – 2021 Fall 2021 Spring 2022 2021 -2022 Fall 2022 Sprin g 2023 2022 -2023 TotalNumber of Saudi (Newly Enrolled) 37 0 37 20 0 20 14 0 14 Total Number of Non - Saudi (Newly Enrolled) 11 0 11 3 0 3 6 0 6 27
Academic Year 2022-2023 Compared to 2020-2021 & 2021-2022 2019 - 2020 2020 - 2021 2021 - 2022 2022-2023 Internationalization Saudi NonSaudi Saudi NonSaudi Saudi NonSaudi Saudi NonSaudi Effat College of Humanities 90 59 97 51 91 64 75 59 Effat College of Architecture and Design 381 95 286 138 275 177 266 196 Effat College of Business 185 69 188 83 213 106 211 133 Effat College of Engineering 134 54 134 93 152 115 149 140 Overall 790 277 705 365 731 462 701 528
*Including Number of Students in Foundation Level, Leave of Absence and Pending Graduation Students.
Academic Year 2022-2023 Compared to 2020-2021 & 2021-2022
Historical Overall Student Internationalization
28
89% 88% 87% 87% 86.97% 86.78% 85.52% 84% 78% 74% 67% 66% 64% 61% 60% 57% 11% 12% 13% 13% 13.03% 13.22% 14.48% 16% 22% 26% 33% 34% 36% 39% 40% 43% FALL 2015 SPRING 2016 FALL 2016 SPRING 2017 FALL 2017 SPRING 2018 FALL 2018 SPRING 2019 FALL 2019 SPRING 2020 FALL 2020 SPRING 2021 FALL 2021 SPRING 2022 FALL 2022 SPRING 2023 Saudi Non-Saudi
New Student Enrolment by Gender
Admissions Data Fall 2020 Spring 2021 2020 -2021 Fall 2021 Spring 2022 2021 -2022 Fall 2022 Spring 2023 2022 -2023 Total Number of Male (Newly Enrolled) 0 0 0 0 30 30 74 22 96 Percentage of Newly Enrolled Male 0% 0% 0% 0% 27% 8% 28% 43% 30% Total Number of Female (Newly Enrolled) 345 53 398 254 80 334 190 29 219 Percentage of Newly Enrolled Female 100% 100% 100% 100% 73% 92% 72% 57% 70% Graduate Admissions Data Fall 2020 Spring 2021 2020 -2021 Fall 2021 Spring 2022 2021 -2022 Fall 2022 Spring 2023 2022 -2023 Total Number of Male (Newly Enrolled) 5 0 5 0 0 0 3 0 3 Percentage of Newly Enrolled Male 10% 0% 10% 0% 0% 0% 15% 0% 15% Total Number of Female (Newly Enrolled) 43 0 43 23 0 23 17 0 17 Percentage of Newly Enrolled Female 90% 0% 90% 0% 0% 0% 85% 0% 85% 29
Undergraduate
2022-2023
Academic Year
Compared to 2020-2021 & 2021-2022
30
72 45 103 121 162 151 274 419 578 782 512 241 155 197 20092010 20102011 20112012 20122013 20132014 20142015 20152016 20162017 20172018 20182019 20192020 20202021 20212022 20222023
Historical Number of Graduates
ALUMNI PROFILE
Alumni Status


31
STUDENT SUCCESS
Selected Measures of Student Success
32
Selected Measures of Students’ Success 2020-2021 2021-2022 2022-2023 First Year Retention Rate 82% 87% 84% Graduation/ Completion rate 60% 66% 54% Employment Rate 67% 68% 70% Enrolment of Effat Alumni in Graduate Studies 6% 6% 5% Graduates with a Masters Degree 282 282 327 Graduates with a PhD Degree 9 9 18 Graduates currently at Senior Level Positions 5% 8% 8% Graduates who are Entrepreneurs 9% 10% 6%
FACULTY PROFILE


ACADEMIC STAFF PROFILE
Academic Degree Programs 2022-2023
Note: The faculty profile consists of teaching staff who have served at least 1 semester in 2022-2023.
Effat English Academy & HRH Princess Al Bandari Bint Abdulrahman Al Faisal Center for Civic Engagement (PACCE)
Note: The faculty profile consists of teaching staff who have served at least 1 semester in 2022-2023.
34
Ranks Faculty Full Time Part Time Saudi Non-Saudi Male Female # % # % # % # % # % # % # % Professorial Rank Professor 10 11% 10 13% 0 0% 0 0% 10 14% 6 15% 4 8% Associate Professor 13 14% 11 14% 2 13% 1 6% 12 16% 8 20% 5 10% Assistant Professor 47 51% 43 57% 4 25% 8 44% 39 53% 22 55% 25 50% NonProfessorial Rank Lecturer 10 11% 6 8% 4 25% 3 17% 7 9% 0 0% 10 20% Instructor 12 13% 6 8% 6 37% 6 33% 6 8% 4 10% 6 12% Grand-Total 92 100% 76 100% 16 100% 18 100% 74 100% 40 100% 50 100% Ranks Faculty Full Time Part Time Saudi NonSaudi Male Female # % # % # % # % # % # % # % Effat English Academy Instructor 7 100% 7 100% 0 0% 1 14% 6 86% 0 0% 7 100%
Faculty Profile
35
76% 24% Academic Staff PhD vs Non-PhD (Full-Time) PhD Non-PhD 11% 14% 51% 24% Faculty Rank Professor Associate Professor Assistant Professor Lecturer & Instructor 44% 56% Academic Staff Gender Male Female 20% 80% Academic Staff Saudi vs Non-Saudi Saudi Non-Saudi 83% 17% Academic Staff Full-Time vs Part-Time Full Time Part-Time
Faculty to Student Ratio
Academic Year 2022/2023
*Including Number of Students & Teaching Staff in the Foundation Program
Academic Year 2021/2022
*Including Number of Students & Teaching Staff in the Foundation Program
Fall 2022 Spring 2023 No of Students No of Faculty Members FacultyStudent Ratio No of Students No of Faculty Members FacultyStudent Ratio Institution* 1323 86 1:15 1229 85 1:14 College of Humanities 158 25 1:6 134 23 1:5 College of Business 369 16 1:23 344 16 1:21 College of Engineering 314 19 1:16 289 19 1:15 College of Architecture & Design 482 26 1:18 462 27 1:17 36
Fall 2021 Spring 2022 No of Students No of Faculty Members FacultyStudent Ratio No of Students No of Faculty Members FacultyStudent Ratio Institution* 1190 86 1:14 1193 84 1:14 College of Humanities 156 30 1:5 155 26 1:6 College of Business 314 14 1:22 319 18 1:18 College of Engineering 255 19 1:13 267 20 1:13 College of Architecture & Design 465 23 1:20 452 20 1:23
STAFF PROFILE
37
Full Time vs Part Time Saudi vs NonSaudi Rank Department Admin Full Time Part Time Saudi NonSaudi PhD MasterBachelor Other Office of the President 4 4 0 2 2 1 0 3 0 Office of the Vice Chair of the Board of Trustees & General Supervisor of Effat University 1 1 0 1 0 0 0 1 0 Office of the Provost 2 2 0 2 0 0 0 1 1 Center of Excellence for Teaching & Learning 2 2 0 2 0 0 2 0 0 Deanship of Quality Assurance 1 1 0 1 0 0 0 1 0 Management of Communication & Public Relation 6 6 0 5 1 0 2 4 0 Deanship of Admission & Registration 6 6 0 6 0 0 1 5 0 Deanship of Student Affairs 4 4 0 4 0 0 2 2 0 Medical Clinic 1 1 0 0 1 0 0 1 0 Deanship of Graduate Studies & Research 2 2 0 2 0 0 1 1 0 Testing Center 4 4 0 4 0 0 2 2 0 Effat Library & Cultural Museum 3 3 0 1 2 1 1 1 0 College of Humanities 1 1 0 1 0 0 0 1 0 College of Business 1 1 0 1 0 0 0 1 0 College of Architecture and Design 3 3 0 1 2 0 1 1 1 College of Engineering 2 2 0 2 0 0 1 1 0 Management of Information & Educational Technology Services 7 7 0 4 3 0 3 4 0 Management of Finance 8 8 0 7 1 0 5 3 0 Management of Purchasing & Inventory 1 1 0 1 0 0 0 0 1 Management of Human Resources 6 6 0 6 0 0 4 2 0 Total 65 65 0 53 12 2 25 35 3
Administration
FACILITIES, EQUIPMENT AND LEARNING RESOURCES

Campus Infrastructure
Academic Buildings
Support Buildings and Facilities
Effat Campus Area Campus Land Area and Capacity 80,922 sqm (871,037 sqft) Total Land and Building Area 132,527 sqm (1,426,508 sqft) Academic Building Area EffatCollege of Engineering 9,943sqm (106,971 sqft) Effat College of Business 5,377 sqm (106,971 sqft) Effat College of Architecture and Design 3,576 sqm (38,558 sqft) EffatCollege of Architectureand Design-2 5,081sqm (54,653 sqft) Admissions, Registration, Governance, and Effat College of Humanities 14,405 sqm Deanship of Graduate Studies and Research 748 sqm General Shared Facilities Area Capacity General Administration 1,695 sqm (18,235 sqft) 85 Effat Library and Cultural Museum 6,172 sqm (75,158 sqft) 900 Deanship of Student Affairs 5,860 sqm (102,538 sqft) 576 Mosque 218 sqm (2,345 sqft) 100 EffatHall 4,485sqm (48,251 sqft) 720 Restaurant 3,489 sqm (37,525 sqft) 800 University Residence (1) 9,414 sqm (101,280 sqft) 119 University Residence (2) 10,761 sqm 124 Gates (2, 3, 4, 5, 6, 9, 15, 17) 2,017 sqm Maintenance and Operations 3,478 sqm Workshops and Stores 1,710 sqm Power Stations (North, South, East) 732 sqm Connecting Skywalk (1, 2) 2,306 sqm 39
Offices
Sport Facilities
Student Study Rooms and Lounges
Lecture Halls
Offices Area Number Capacity Number of Single Offices – Administrative Staff 1180 sqm ( ave: 8.2 sqm) 184 184 Number of Single Office – Faculty 1140 sqm ( ave:9.5 sqm) 177 177 Number of Shared Offices – Administrative Staff 312 sqm (ave:16.4 sqm) 19 57 Number of Shared Offices – Faculty 206.8 sqm (ave:18.8 sqm) 11 26 Sports Facilities Area Capacity Indoor swimming pool 500 cubic meter / 25m x 12.5m Indoor gymnasium size and capacity 150 sq meters 25 Indoor basketball court size and capacity 970 sq meters 200 Indoor Jogging/running track size 70 meters per lap Lecture Halls Area Number Capacity Number of Classrooms 5,148 sqm ( ave: 52 sqm) 99 3,497 Number of Studios 2730 sqm (ave: 70 sqm) 30 450 Number of Computer Labs 2,520 sqm ( ave:60 sqm) 42 590 Number of Science Labs 225 sqm (ave: 75 sqm) 3 60 Multipurpose Halls 102,538 sqm 5 1280 Research Centers and Labs 497 sqm (5,347 sqft) 16 391 40
Lecture Halls Area Number Capacity Study Rooms 23 56 Student Lounges 6 105
Labs
41
Technology Equipped Labs Number Capacity # of Projectors Number of Specialized Teaching and Research Labs / Centers 53 478 53 Number of General Access Lab 11 151 5 Enhancement Centers Number of General Access Lab DSA – ILC 1 1 Number of General Access Lab DSA – CEWS 1 1 Number of General Access Lab DSA – Math 1 1 Number of General Access Lab DSA – CCR 1 1 Effat English Academy (EEA) CALL Lab 2 43 2 Effat Library and Cultural Museum Number of General Access Computers - Training Room 1 21 1 Number of General Access Computers 1 10 Number of General Access Digital Library - iPads 1 69 Number of General Access Digital Library - Kindles 5 5 Number of General Access Digital Library - Laptops 1 50 Number of General Access Digital Library - iMacs PCs 1 6 Teaching and Research Labs / Centers ComputingResearchandTeachingLabs 6 94 6 Electrical Engineering Research and Teaching Labs 9 91 9 Renewable Energy and Petroleum Engineering Research Labs 11 19 11 Business Innovation & Entrepreneurship Research Center 3 53 3 E-Arabization Research labs 2 18 1 Positive PSY and Wellbeing Research Lab 1 1 1 Art, Architecture, and Design Research Center 16 97 16 Printers Number Ratio Number of Printers for Students 20 78:1 Number of Printers for Student in Library 3 521:1 Number of Printers for Employees 160
Ratio of Computer to Students in Computer Related Majors
Ratio of Computer to Students in Non-Computer Related Majors
Ratio of Computer to Students in Computer Related Majors (1:4) Effat College of Engineering B.Sc. Computer Science 2:1 B.Sc. Electrical and Computer Engineering 1:2 M.Sc. Energy Engineering 1:1 Effat College of Architecture and Design B.Sc. Architecture 1:6 B.Sc. Cinematic Arts 1:1 B.Sc. Design 1:4 M.Sc. Urban Design 1:1 Ratio of Computer to Students in Non-Computer Related Majors (1:24) Effat College of Business B.Sc. Marketing 1:1 B.Sc. Entrepreneurship 1:1 B.Sc. Human Resource Management 1:1 B.Sc. Supply Chain Management 2:1 B.Sc. Finance 4:1 M.Sc. Finance 3:1 Effat College of Science & Humanities B.Sc. Psychology 1:5 B.Sc. English and Translation 1:5 M.Sc. Translation and Interpreting 1:1 42
Library Collection
Database Subscriptions
Semester No. of Students No. of Print Books No. of E-books Total Print + E-books Ratio Book / Student Fall 2021 1190 30,938 445,246 476,184 400 Spring 2022 1193 31,584 395,622 427,206 358 Fall 2022 1324 31,584 395,622 427,206 323 Spring 2023 1229 33,428 362,194 395,622 322 Special Collections Islamic Finance 334 Islamic Architecture 319 Fiction 1501 Easy Reader 464 Children 445 Multidisciplinary Databases 1 Academic Search Ultimate (Ebsco) 2 Career & Technical Education Database (ProQuest) 3 Credo Reference 4 eBook Arabic Collection (Ebsco) 5 Education Research Complete (Ebsco) 6 Humanities Full Text( Ebsco) 7 Springer 8 ScienceDirect 9 Taylor & Francis 10 Wiley 43
Database Subscriptions by Program
Art & Architecture Complete
Environment Complete (Ebsco)
Green File
Art & Architecture Complete
DESN
Environment Complete (Ebsco)
Green File CA
Art & Architecture Complete
Communication & Mass Media
Complete
The Arts ( Proquest )
O’reilly Safari MSUD
Art & Architecture Complete
Environment Complete ( Ebsco)
Green File COE ECE CS
MSEE
IEEE
ProQuest Computing
O’reilly Safari
ScienceDirect
Environment Complete ( Ebsco)
IEEE ScienceDirect
SciTech Premium Collection (ProQuest) CoB ENTP SCM HRM FIN MKT MSF
ABI INFORM
Business Source Ultimate
Emerald
OECD iLibrary
ScienceDirect
Encyclopedia Britannica
COH ET
PSY
MTI
Encyclopedia of Arabic Language and Linguistics
Handbook of Translation Studies
ProQuest Psychology
Ebrary Ebook Central ScienceDirect
Encyclopedia Britannica
Encyclopedia of Arabic Language and Linguistics
Handbook of Translation Studies
44
College Department Databases COAD ARCH

45
RESEARCH
Effat University Research Profile –
Previous 5 years 2018 to 2023
46 Total Number of Publications 1669 Total Number of Scopus Publications 930 Number of Scopus Citations (Total) 15.52 Average Scopus Citation per Faculty 22988 Total Number of Patents 4 Total Number of Intellectual Properties (IPs) 6 Conferences during the academic year 2022 - 2023 Yearly International Conferences 3 Yearly Students Forum 1
Research Collaborations during the academic year 2022 - 2023
47 13 19 12 104 14 4 2 College Collaboration Department Collaboration Department Collaboration||External Collaboration Department Collaboration||University Collaboration||External Collaboration External Collaboration No Collaboration University Collaboration (blank)
Effat University Research Output
2014 - 2023
Total Publications 2014 - 2023
48
Research Production of Effat University From 2014 to 2022 & as of 29th Aug 2022 ❖ The total number of scientific production: 2251 ❖ Total number of scientific output in Scopus: 1056 ❖ Total number of scientific productions in WoS-ISI: 666 99 139 227 214 254 400 404 390 235 162 32 14 42 74 100 107 192 249 137 183 138 18 13 41 68 91 106 91 103 82 62 30 0 50 100 150 200 250 300 350 400 450 لبق 2014 2014 2015 2016 2017 2018 2019 2020 2021 2022 2023 Until July 23 Total Research Publications SCOPUS WoS Linear (Total Research Publications) 99 238 465 679 933 1333 1737 2127 2362 2524 39 53 95 169 269 376 568 817 954 1137 1275 18 31 72 140 231 337 428 531 613 675 705 0 500 1000 1500 2000 2500 3000 لبق 2014 2014 2015 2016 2017 2018 2019 2020 2021 2022 2023 Until July 23
Scientific
Total Cumulative Research Output Total Comulative SCOPUS output Total Comulative WoS output
Conferences Held at Effat University in 2022-2023
TheEdtechandTheRiseofMetaverse(January26,2023)
Attendance:1215participants
ConferencePresentations:36researchpapers
Publication:IEEEXplore
ManandPlace:CreativeTransformations(February9-10,2023)
Attendance:1155participants
ConferencePresentations:48researchpapers
Publication:SpringerNatureConferenceproceeding
BeyondSynergy:RoleofIslamicFinanceinTransformingM&A Strategy(March12,2023)
Attendance:212participants
ConferencePresentations:18researchpapers
ElevatingSocietiesThroughTransformations(May11,2023)
Attendance:450
TotalStudentsProjects:119
49
Research Output by Type
Fall 2014 – Spring 2023


50
Fall Spring Fall Spring Fall Spring Fall Spring Fall Spring Fall Spring Fall Spring Fall Spring Fall Spring 2013/2014 2014/2015 2015/2016 2016/2017 2017/2018 2018/2019 2019/2020 2020/2021 2021/2022 2022/2023 36 34 30 65 63 61 51 60 82 118 61 119 213 238 49 69 81 73 14 38 30 48 47 49 37 68 32 101 50 28 27 54 12 31 14 45 1 0 7 0 4 7 9 8 4 33 37 13 4 18 19 24 16 44 99 51 72 67 113 114 117 97 136 118 252 148 160 244 310 80 124 111 162 99 123 180 231 233 370 308 554 204 273 36 34 30 65 63 61 51 60 82 118 61 119 213 238 49 69 81 73 14 38 30 48 47 49 37 68 32 101 50 28 27 54 12 31 14 45 1 0 7 0 4 7 9 8 4 33 37 13 4 18 19 24 16 44 99 51 72 67 113 114 117 97 136 118 252 148 160 244 310 80 124 111 162 0 100 200 300 400 500 600
Publications and Citations-SCOPUS Profile 2016 - 2021
* Scopus records depends on the Gregorian Years
51 55 34 136 340 750 1,512 1,972 2,833 2,495 55 89 225 565 1,315 2,827 4,799 7,632 10,1272,000 4,000 6,000 8,000 10,000 12,000 2014 2015 2016 2017 2018 2019 2020 2021 Effat University Scopus Citations Profile (2014-Aug2022) SCOPUS Yearly Citations Cumulative SCOPUS Citations over the years ❖ Total Documents over the Years: 1056 as of August 2022 ❖ Scopus Profile for Five Years 2017-2021: 785 as of Dec 2021* ❖ Citations: 18685 as of Aug 2022. ❖ Citations rate per faculty members: 15 19 ❖ Scopus Profile for 2021: 102 as of August 2022
Publications and Citations-ISI Profile
2016 - 2021
❖ Total Documents over the years: as 666 in August 22 ❖ ISI Profile for five years 2017-2021: 473 as in August 22 ❖ Citations:5,109 as in August 2022. ❖ ISI Profile for 2022: as 53 in August. 52 6 23 88 250 569 1,004 1,326 1,843 6 29 117 367 936 1,940 3,266 5,1091,000 2,000 3,000 4,000 5,000 6,000 2014 2015 2016 2017 2018 2019 2020 2021 WoS Yearly Citations Cumulative WoS Citations over the years
Research Mapped to the Saudi Vision 2030 Goals

❖ During 2022-2023 Effat university’s research output was aligned with the Kingdom's research priorities by (94 4%)
❖ Health, computer science, energy and smart cities accounted for the highest percentages at 63%, 32%, 19% and 14% respectively.
53
Effat University Research Centers and Research Labs
54 Effat College of Engineering Effat Energy and Technology Research Center Energy Lab Virtual Reality Lab Electronics Lab Biometrics and Sensory Systems Lab Artificial Intelligence & Cyber Security Lab Effat College of Architecture and Design Effat Smart Building Research Center Environmental Design of Buildings Lab Urben Design Lab Materials Testing Lab Effat College of Business Business Innovation & Entrepreneurship Research Center Environmental Students and Entrepreneurship Sustainability Studies Unit Digital Marketing Unit Islamic Finance Studies Unit Effat College of Humanities Effat Socio-Cultural Studies Research Center E-Arabaization Unit Positive Psychology & Wellbeing Lab Queen Effat Women Studies
Effat University Top 2% Researchers 2023

55
Author name # papers 1960-2022 on composite score c total cites 1996-2022 h-index as of end 2022 Lytras, Miltiadis D. 282 106,059 4,357 35 Subasi, Abdulhamit 186 16,376 7,868 40 El-Amin, Mohamed F. 107 252,516 960 18 Visvizi, Anna 126 283,244 1,579 20 Qaisar, Saeed Mian 143 199,780 146 6 Majid, M. A. 55 573,697 189 5 ranked based


Training Educational Projects Volunteering Consultancies Awards Partnership Reputation Community Relations Sports Activities Sponsorship Workshops 5 Training Course 10 Projects in Collaborations with industry 2 for Effat College of Humanities 8 for Effat College of Architecture and Design 4392 hours : Faculty and Staff 15518 hours : Students 3 Consulting Contracts 13 Awards 6 National 7 International 6 New Agreements 3 National 3 International 152 Positive Mentions 164 Activities 12 Rental Sites 43 Workshops 515 Attendees 43 Workshops for Faculty 65 Events
COMMUNITY ENGAGEMENT
Academic Partnerships

Uzbekistan State World Languages University, is one of the leading Universities in Uzbekistan. It trains highly qualified specialists on more than 20 foreign languages.The collaboration with Effat University will provides unique opportunity to promote Arabic language in Uzbekistan and prepare qualified translators and interpreters.

Arts University Bournemouth in UK is dedicated to championing the creative arts throughout every stage of the education journey. It recognizes the vital role teachers and advisors play in nurturing students’ creative aspirations, and they are committed to supporting this through dedicated continuing professional development opportunities.

The USC School of Cinematic Arts (SCA) is one of the nation’s preeminent centers for the creation, study, research and development of film, television and interactive media. Since its founding in 1929 as the first course of study in film at any college or university in the United States, USC’s cinema program has consistently set academic and professional standards for excellence.

many Saudis have gone abroad to complete their graduate studies. In order to maximize their success in these demanding programs, Effat University has collaborated with Syracuse University to develop a preparatory program to enhance not only their academic English skills but also their analytical and critical thinking skills as well as boosting their academic foundations in their chosen disciplines.

SDA Bocconi is one of the few Business Schools that hold the so-called "triple crown", three of the most prestigious international accreditations: AACSB, EQUIS and AMBA. It is also the only Italian Business School to feature in all the major international rankings, including Financial Times, Forbes, Bloomberg Businessweek and The Economist.

the land of technical innovation, Japan. Tokai collaborates with Effat in ensuring that the curriculum remains up-to-date in this rapidly changing field. Professors from Tokai visit on an annual basis, giving not only lectures and courses relevant to the field, but also insights into the fascinating Japanese culture. Students have also taken research internship courses in Tokai.
57
Academic Partnerships

The School of Architecture at Miami University has partnered Effat University since 2009 Miami collaborated with Effat to create the new 5-year curriculum in line with ABET standards. Every summer, Effat students have the opportunity to take courses in Italy at the University of Miami’s facilities in Rome. They are currently also working with Effat to develop a Master’s Program in Urban Design, which will open in the near future.

The Pratt School of Engineering and Effat University have been partners since 2004, when they collaborated to develop the Electrical and Computer Engineering (ECE) curriculum and establish the program, the first of its kind for women in Saudi Arabia. Every year, faculty from Duke visit the department to monitor its development and interact with students and faculty. ECE graduates each receive a personal letter of congratulations from the Dean of the Pratt School, Dean Tom Katsouleas.

womens college that has a robust reputation for empowering women and developing leadership skills to produce the leaders of the future. Their mission mirrors that of Effat, which is “to qualify tomorrow’s competitive leaders” Since 2010 the sister institutions have been collaborating to develop new initiatives to strengthen and add value to the co-curricular program at Effat.

Stanford University is one of the world's leading research and teaching institutions Catalyzing discovery, accelerating solutions, sustaining life on Earth, and preparing students to make meaningful contributions to society as engaged citizens and leaders in a complex world

In 2005, Effat collaborated with the McDonough School of Business at Georgetown University, Washington DC to establish a department of Business Administration. From this solid foundation, the College of Business was formed in 2009 In 2013, the partnership was renewed, which will further strengthen all the departments, and increase the research capacity of for both students and faculty.

Effat has partnered with the Department of Psychology at Carnegie Mellon University since 2011 for advice and assistance with the Psychology department curriculum development, training and teaching methodologies.
58
Academic Partnerships

Virginia Tech takes a hands on, engaging approach to education, preparing scholars to be leaders in their fields and communities. As the commonwealth’s most comprehensive university and its leading research institution, Virginia Tech offers 275 undergraduate and graduate degree programs to more than 33,000 students and manages a research portfolio of more than $502 million. The Effat English Academy collaborates with the Virginia Tech Language and Culture Institute, whose mission is to promote intercultural competence and understanding by connecting people across borders and disciplines. They aim to inspire globally minded students, scholars, and professionals through transformative learning, innovative collaborations, and cross-cultural engagement.

KENT State University, USA collaborates with Effat University in Students Summer School, studying abroad, joint conferences, and Albalad project

The mission of University of the People is to offer affordable, quality, fully online, degreegranting educational programs to any qualified student. UoPeople believes that education plays a fundamental role in strengthening respect for human rights and fundamental freedoms, and in promoting understanding and tolerance. Our partnership offers students from both institutions the chance to pursue a variety of fields at the undergraduate level, as well as at the graduate level. Students will be able to transfer between the two universities in compatible programs.

An international centre for research and advanced technology under the auspices of UNESCO
59


Vision
To become the best provider of interdisciplinary education in the fields of humanities one which is worthy of the 21st century and applicable to society through international perspective, broad expertise, awareness of history and institutional values, pride in traditions, sense of community, and rational optimism for the future
Mission Departments
To provide high quality interdisciplinary education that adheres to Effat University’s core values of being committed to the ethical use of science and knowledge and striving to offer sound community leadership. Our graduates will excel in their respective fields through their talents to analyze and think thoroughly, solve problems creatively, and communicate effectively
English and Translation Department
• Bachelor of Science in English and Translation.
• Master of Science in Translation and Interpreting Psychology Department
• Bachelor of Science in Psychology


Degree Fall 2020 Spring 2021 Fall 2021 Spring 2022 Fall 2022 Spring 2023 Undergraduate 151 133 143 142 147 128 Postgraduate 16 15 13 13 11 6 Student Enrolment 62
by Program
Academic Year 2022-2023 Compared to 2020-2021 & 2021-2022 Program Semester Continuing Registered Students New Registered Students Total Registered Students Leave of Absence Pending Graduation due to IC/IP Total Enrolled Students F M T F M T F M T F M T F M T F M T English &Translation (E&T) Fall 2020 48 0 48 7 0 7 55 0 55 2 0 2 0 0 0 57 0 57 Spring 2021 41 0 41 1 0 1 42 0 42 1 0 1 1 0 1 44 0 44 Fall 2021 30 0 30 7 0 7 37 0 37 2 0 2 0 0 0 39 0 39 Spring 2022 34 0 34 3 0 3 37 0 37 2 0 2 2 0 2 41 0 41 Fall 2022 29 0 29 3 1 4 32 1 33 1 0 1 2 0 2 35 1 36 Spring 2023 24 1 25 0 0 0 24 1 25 1 0 1 2 0 2 27 1 28 Psychology (PSY) Fall 2020 68 0 68 25 0 25 93 0 93 1 0 1 0 0 0 94 0 94 Spring 2021 81 0 81 4 0 4 85 0 85 4 0 4 0 0 0 89 0 89 Fall 2021 78 0 78 25 0 25 103 0 103 1 0 1 0 0 0 104 0 104 Spring 2022 86 0 86 7 2 9 93 2 95 6 0 6 0 0 0 99 2 101 Fall 2022 83 2 85 22 0 22 105 2 107 2 0 2 2 0 2 109 2 111 Spring 2023 88 2 90 3 1 4 91 3 94 4 0 4 2 0 2 97 3 100 Master of Science in Translation and Interpreting (MTI) Fall 2020 8 0 8 7 0 7 15 0 15 0 0 0 1 0 1 16 0 16 Spring 2021 15 0 15 0 0 0 15 0 15 0 0 0 0 0 0 15 0 15 Fall 2021 8 0 8 5 0 5 13 0 13 0 0 0 0 0 0 13 0 13 Spring 2022 13 0 13 0 0 0 13 0 13 0 0 0 0 0 0 13 0 13 Fall 2022 10 0 10 0 0 0 10 0 10 0 0 0 1 0 1 11 0 11 Spring 2023 5 0 5 0 0 0 5 0 5 0 0 0 1 0 1 6 0 6
Student Profile Enrolment
*Including Number of Students in Foundation Level, Leave of Absence, and Pending Graduation Students.

63
Historical Student Enrolment by Program
Enrolment by Internationalization

2020 - 2021 2021 - 2022 2022 - 2023 Saudi Non-Saudi Saudi Non-Saudi Saudi Non-Saudi 97 51 91 64 75 59 64
Australia
Academic Year 2022-2023 Compared to 2020-2021 & 2021-2022 Nationality Afghanistan
Bangladesh Egypt Eritrea India Jordan Lebanon Niger Nigeria Pakistan Palestine Saudi Somali Sudan Syria Yemen Displaced tribes

65 Historical Number
of Graduates
Alumni Profile
Alumni Status
Overall Effat College of Humanities Alumni Status up to Spring 2023 Alumni Participation Rates In Survey 85% Alumni Profile Working 68% Studying 7% Seeking Job 25% Company Status National 75% International 25% Alumni who started their own business or are in senior executive positions Entrepreneur 7% Senior Executive Positions 10% 66
61% 12% 28% PSY Alumnae Status 2004-Spring 2023 Working Studying Seeking Job 67% 5% 28% E&T Alumnae Status 2003-Spring 2023 Working Studying Seeking Job 90% 3%6% MTI Alumnae Status 2017-Spring 2023 Working Studying Seeking Job
Faculty Profile
Faculty Rank
Saudi vs Non-Saudi
Full-time vs Part-time
Note: The faculty profile consists of teaching staff who have served at least 1 semester in 2022-2023.
Department Full Time Part Time # % # % English & Translation Department 8 89% 1 11% Psychology Department 5 71% 2 29% General Education Program 9 90% 1 10% Department Saudi Non-Saudi # % # % English & Translation Department 1 12% 8 88% Psychology Department 4 57% 3 43% General Education Program 1 10% 9 90% Department Professor Associate Professor Assistant Professor Lecturer Instructor # % # % # % # % # % English & Translation Department 0 0% 1 11% 7 78% 1 11% 0 0% Psychology Department 0 0% 1 14% 3 43% 3 43% 0 0% General Education Program 0 0% 2 20% 6 60% 0 0% 2 20% 67
Facilities Profile
Labs
Library
Database Subscription
Technology Equipped Labs Number Capacity # of Projectors Specialized Computer Labs-PSY 2 16 2 Specialized Computer Labs-E&T 1 18 1 Specialized Computer Labs-MTI 1 3 1 Total Number of Specialized Computer Labs 4 37 4 Number of General Access Lab 1 26 Printers Number Ratio Number of Printers for Students 2 99:1 Fall 2022 Spring 2023 Program No. of Students Total Books (Print + Ebooks) Ratio Book/Student No. of Students Total Books (Print + Ebooks) Ratio Book/Student E&T 36 37930 1054 28 37956 1356 PSY 111 12080 109 100 12080 121 MTI 11 3825 348 6 3857 643 Program Databases E&T Encyclopedia Britannica Encyclopedia of Arabic Language and Linguistics Handbook of Translation Studies PSY ProQuest Psychology ScienceDirect Ebrary Ebook Central MTI Encyclopedia Britannica Encyclopedia of Arabic Language and Linguistics Handbook of Translation Studies 68


To be recognized nationally and internationally as a school of reference in business education and to actively support the socio economic growth of the Kingdom through innovation, excellence, professionalism and the promotion of the entrepreneurial spirit.
To maintain academic excellence, offer a comprehensive learning experience, create and disseminate impactful knowledge and intellectual contributions in order to qualify innovative business leaders, creative entrepreneurs and distinguished scholars who will effectively contribute to the socio-economic growth of the Kingdom
Vision Mission Departments
Finance Department
• Bachelor of Science in Finance.
• Master of Science in Finance.
Entrepreneurship Department
• Bachelor of Science in Entrepreneurship.
Human Resources Management Department
• Bachelor of Science in Human Resources Management
Marketing Department
• Bachelor of Science in Marketing
Supply Chain Management Department
• Bachelor of Science in Supply Chain Management

70
Student Profile
Degree Fall 2020 Spring 2021 Fall 2021 Spring 2022 Fall 2022 Spring 2023 Undergraduate 270 246 290 295 351 329 Postgraduate 29 25 24 24 18 15
Student Enrolment
71 *Including Number of Students in Foundation Level, Leave of Absence, and Pending Graduation Students. Program Semester Continuing Registered Students New Registered Students Total Registered Students Leave of Absence Pending Graduation due to IC/IP Total Enrolled Students F M T F M T F M T F M T F M T F M T Entrepreneurs hip (ENTP) Fall 2020 31 0 31 16 0 16 47 0 47 2 0 2 0 0 0 49 0 49 Spring 2021 37 0 37 1 0 1 38 0 38 0 0 0 0 0 0 38 0 38 Fall 2021 27 0 27 13 0 13 40 0 40 2 0 2 0 0 0 42 0 42 Spring 2022 25 0 25 7 0 7 32 0 32 3 0 3 0 0 0 35 0 35 Fall 2022 25 2 27 6 5 11 31 7 38 1 0 1 1 0 1 33 7 40 Spring 2023 16 5 21 1 0 1 17 5 22 1 0 1 0 0 0 18 5 23 Finance (FIN) Fall 2020 43 0 43 20 0 20 63 0 63 3 0 3 2 0 2 69 0 69 Spring 2021 59 0 59 4 0 4 63 0 63 0 0 0 0 0 0 63 0 63 Fall 2021 53 0 53 17 0 17 70 0 70 2 0 2 5 0 5 77 0 77 Spring 2022 71 0 71 4 0 4 75 0 75 1 0 1 1 0 1 77 0 77 Fall 2022 60 2 62 14 16 30 74 18 92 3 0 3 1 0 1 78 18 96 Spring 2023 67 17 84 5 1 6 72 18 90 8 1 9 0 0 0 80 19 99 Human Resource Management (HRM) Fall 2020 16 0 16 14 0 14 30 0 30 2 0 2 0 0 0 32 0 32 Spring 2021 31 0 31 0 0 0 31 0 31 0 0 0 0 0 0 31 0 31 Fall 2021 23 0 23 0 0 0 23 0 23 1 0 1 1 0 1 25 0 25 Spring 2022 19 0 19 0 0 0 19 0 19 1 0 1 1 0 1 21 0 21 Fall 2022 15 0 15 0 0 0 15 0 15 0 0 0 1 0 1 16 0 16 Spring 2023 10 0 10 0 0 0 10 0 10 0 0 0 0 0 0 10 0 10 Marketing (MKT) Fall 2020 47 0 47 23 0 23 70 0 70 3 0 3 0 0 0 73 0 73 Spring 2021 70 0 70 1 0 1 71 0 71 2 0 2 0 0 0 73 0 73 Fall 2021 63 0 63 25 0 25 88 0 88 3 0 3 3 0 3 94 0 94 Spring 2022 92 0 92 11 0 11 103 0 103 1 0 1 0 0 0 104 0 104 Fall 2022 84 3 87 9 6 15 93 9 102 3 0 3 2 0 2 98 9 107 Spring 2023 71 10 81 4 5 9 75 15 90 6 0 6 1 0 1 82 15 97 Supply Chain Management (SCM) Fall 2020 30 0 30 14 0 14 44 0 44 0 0 0 2 0 2 47 0 47 Spring 2021 38 0 38 2 0 2 40 0 40 0 0 0 1 0 1 41 0 41 Fall 2021 35 0 35 16 0 16 51 0 51 1 0 1 0 0 0 52 0 52 Spring 2022 48 0 48 9 0 9 57 0 57 1 0 1 0 0 0 58 0 58 Fall 2022 57 5 62 22 8 30 79 13 92 0 0 0 0 0 0 79 13 92 Spring 2023 83 14 97 1 2 3 84 16 100 0 0 0 0 0 0 84 16 100 Masters of Science in Finance (MSF) Fall 2020 13 0 13 14 0 14 27 0 27 1 0 1 1 0 1 29 0 29 Spring 2021 24 0 24 0 0 0 24 0 24 1 0 1 0 0 0 25 0 25 Fall 2021 16 0 16 8 0 8 24 0 24 0 0 0 0 0 0 24 0 24 Spring 2022 21 3 24 0 0 0 21 3 24 0 0 0 0 0 0 21 3 24 Fall 2022 10 0 10 7 1 8 17 1 18 0 0 0 0 0 0 17 1 18 Spring 2023 14 0 14 0 0 0 14 0 14 1 0 1 0 0 0 15 0 15
Enrolment by Program

72
Historical Student Enrolment by
Program
Enrolment by Internationalization

2020 - 2021 2021 - 2022 2022 - 2023 Saudi Non-Saudi Saudi Non-Saudi Saudi Non-Saudi 188 83 213 106 211 133 73
Nationality Algeria Bangladesh Cameroon Canada Egypt Eritrea Ghana India Jordan Lebanon Morocco Nigeria Pakistan Palestine Saudi Arabia Sudan Syria Thailand Tunisia United Yemen

74 Historical
Number of Graduates
Alumni Profile
Alumni Status
75
73% 8% 19% MKT Alumnae Status 2009-Spring 2023 Working Studying Seeking Job 68% 3% 30% FIN Alumnae Status 2010- Spring 2023 Working Studying Seeking Job Overall Effat College of Business Alumni Status up to Spring 2023 Alumni Participation Rates In Survey 81% Alumni Profile Working 70% Studying 4% Seeking Job 26% Company Status National 67% International 33% Alumni who started their own business or are in senior executive positions Entrepreneur 4% Senior Executive Positions 6%
Alumni Status
64% 6% 30% SCM Alumnae Status 2011- Spring 2023 Working Studying Seeking Job 67% 5% 28% ENTP Alumnae Status 2010- Spring 2023 Working Studying Seeking Job 70% 4% 26% HRM Alumnae Status 2009- Spring 2023 Working Studying Seeking Job 80% 1% 18% MSF Alumnae Status 2012-Spring 2023 Working Studying Seeking Job 76
Faculty Profile
Faculty Rank
Saudi vs Non-Saudi
Full-time vs Part-time
Note: The faculty profile consists of teaching staff who have served at least 1 semester in 2022-2023.
Department Full Time Part Time # % # % Supply Chain Management Department 4 100% 0 0% HumanResourcesManagementDepartment 2 100% 0 0% Marketing Department 2 67% 1 33% Entrepreneurship Department 1 100% 0 0% Finance Department 6 100% 0 0% Department Saudi Non-Saudi # % # % Supply Chain Management Department 2 50% 2 50% Human Resources Management Department 1 50% 1 50% Marketing Department 0 0% 3 100% Entrepreneurship Department 0 0% 1 100% Finance Department 1 17% 5 83% Department Professor Associate Professor Assistant Professor Lecturer Instructor # % # % # % # % # % Supply Chain ManagementDepartment 0 0% 1 25% 3 75% 0 0% 0 0% Human Resources Management Department 0 0% 0 0% 2 100% 0 0% 0 0% Marketing Department 0 0% 1 33% 2 67% 0 0% 0 0% Entrepreneurship Department 0 0% 1 100% 0 0% 0 0% 0 0% Finance Department 1 17% 1 17% 3 49% 1 17% 0 0% 77
Facilities Profile
Labs
Database Subscription Library
Technology Equipped Labs Number Capacity # of Projectors Specialized Computer Labs-MHR 0 0 Specialized Computer Labs-MKT 0 0 Specialized Computer Labs-ENTP 0 0 Specialized Computer Labs-SCM 1 26 1 Specialized Computer Labs-FIN 1 26 1 Specialized Computer Labs-MSF Total Number of Specialized Computer Labs 2 52 2 Number of General Access Lab 1 26 Printers Number Ratio Number of Printer for Student 3 91:1 Fall 2022 Spring 2023 Program No. of Students Total Books (Print + Ebooks) Ratio Book/Student No. of Students Total Books (Print + Ebooks) Ratio Book/Student ENTP 40 5291 132 23 5295 230 FIN 96 8467 88 99 8475 86 HRM 16 13730 585 10 13733 1373 MKT 107 8506 79 97 8514 88 SCM 92 1790 19 100 1790 18 MSF 18 8115 451 15 8115 541 Program Databases ENTP - SCM - HRM - FIN - MKT - MSF ABI INFORM Business Source Ultimate Emerald 78


Vision
To be recognized as a national leader in providing quality engineering education centered on innovative research and transfer of knowledge and technology for the benefit of society.
Mission Departments
Effat College of Engineering will continue to lead the education of women in engineering in a multidisciplinary and research driven environment, and equip them with comprehensive technical and analytical skills necessary for effectively contributing to national and international development and technological advancement
Electrical and Computer Engineering Department
• Bachelor of Science in Electrical and Computer Engineering
• Master of Science in Energy Engineering
Computer Science Department
• Bachelor of Science in Computer Science


Student Profile
Degree Fall 2020 Spring 2021 Fall 2021 Spring 2022 Fall 2022 Spring 2023 Undergraduate 218 209 243 256 307 284 Postgraduate 18 18 12 11 7 5 81 Student Enrolment
Enrolment by Program
Program Semester Continuing Registered Students New Registered Students Total Registered Students Leave of Absence Pending Graduation due to IC/IP Total Enrolled Students F M T F M T F M T F M T F M T F M T Computer Science (CS) Fall 2020 48 0 48 69 0 69 117 0 117 2 0 2 0 0 0 119 0 119 Spring 2021 102 0 102 12 0 12 114 0 114 3 0 3 0 0 0 117 0 117 Fall 2021 112 0 112 39 0 39 151 0 151 2 0 2 1 0 1 154 0 154 Spring 2022 147 0 147 10 7 17 157 7 164 4 0 4 0 0 0 161 7 168 Fall 2022 137 4 141 30 18 48 167 22 189 4 1 5 10 0 10 181 23 204 Spring 2023 156 16 172 3 6 9 159 22 181 10 1 11 1 0 1 170 23 193 Electrical and Computer Engineering (ECE) Fall 2020 60 0 60 24 0 24 84 0 84 2 0 2 3 0 3 89 0 89 Spring 2021 80 0 80 4 0 4 84 0 84 2 0 2 0 0 0 86 0 86 Fall 2021 66 0 66 16 0 16 82 0 82 1 0 1 4 0 4 87 0 87 Spring 2022 77 0 77 6 3 9 83 3 86 2 0 2 0 0 0 85 3 88 Fall 2022 66 4 70 14 8 22 80 12 92 4 0 4 7 0 7 91 12 103 Spring 2023 68 12 80 5 3 8 73 15 88 3 0 3 0 0 0 76 15 91 Information Systems (IS) Fall 2020 10 0 10 0 0 0 10 0 10 0 0 0 0 0 0 10 0 10 Spring 2021 5 0 5 0 0 0 5 0 5 0 0 0 1 0 1 6 0 6 Fall 2021 1 0 1 0 0 0 1 0 1 0 0 0 1 0 1 2 0 2 Spring 2022 - - - - - - - - - - - - - - - - -Masters of Science in Energy Engineering (MSEE) Fall 2020 9 0 9 9 0 9 18 0 18 0 0 0 0 0 0 18 0 18 Spring 2021 17 0 17 0 0 0 17 0 17 1 0 1 0 0 0 18 0 18 Fall 2021 10 0 10 0 0 0 10 0 10 1 0 1 1 0 1 12 0 12 Spring 2022 9 2 11 0 0 0 9 2 11 0 0 0 0 0 0 9 2 11 Fall 2022 2 0 2 4 1 5 6 1 7 0 0 0 0 0 0 6 1 7 Spring 2023 3 1 4 0 0 0 3 1 4 1 0 1 0 0 0 4 1 5
*Including Number of Students in Foundation Level, Leave of Absence, and Pending Graduation Students.

82 Historical Student Enrolment
by Program
Enrolment by Internationalization

2020 - 2021 2021 - 2022 2022 - 2023 Saudi Non-Saudi Saudi Non-Saudi Saudi Non-Saudi 134 93 152 115 149 140 83
Nationality Bangladesh Canada Chad Egypt India Jordan Lebanon Mauritania Niger Nigeria Oman Pakistan Palestine Saudi Arabia Somali Sudan Syria Turkey Yemen

84 Historical Number of Graduates
Alumni Profile
Alumni Status
85
78% 7% 15% ECE Alumnae Status 2011-Spring 2023 Working Studying Seeking Job 73% 7% 20% CS Alumnae Status 2003-Spring 2023 Working Studying Seeking Job 88% 4%8% MSEE Alumnae Status Spring 2023 Working Studying Seeking Job Overall Effat College of Engineering Alumni Status up to Spring 2023 Alumni Participation Rates In Survey 89% Alumni Profile Working 73% Studying 5% Seeking Job 22% Company Status National 58% International 42% Alumni who started their own business or are in senior executive positions Entrepreneur 2% Senior Executive Positions 8%
Faculty Profile
Faculty Rank
Saudi vs Non-Saudi
Full-time vs Part-time
Note: The faculty profile consists of teaching staff who have served at least 1 semester in 2022-2023.
Department Professor Associate Professor Assistant Professor Lecturer Instructor # % # % # % # % # % Electrical and Computer Engineering Department 1 17% 2 33% 3 50% 0 0% 0 0% Computer Sciences / Information Systems Department 1 14% 1 14% 4 57% 1 14% 0 0% Natural Sciences, Mathematics, and Technology Unit 1 13% 2 25% 3 37% 0 0% 2 25% Department Full Time Part Time # % # % Electrical and ComputerEngineering Department 6 100% 0 0% Computer Sciences / Information Systems Department 6 86% 1 14% Natural Sciences, Mathematics, and Technology Unit 4 50% 4 50% Department Saudi Non-Saudi # % # % Electrical and Computer Engineering Department 0 0% 6 100% Computer Sciences / Information Systems Department 0 0% 7 100% Natural Sciences, Mathematics, and Technology Unit 2 25% 6 75% 86
Facilities Profile
Labs
Library
Database Subscription
Technology Equipped Labs Number Capacity # of Projectors Specialized Computer Labs - CS 3 78 3 Specialized Computer Labs - IS 3 78 3 Specialized Computer Labs - ECE 7 86 7 Specialized Computer Labs - MSEE 11 14 11 Total Number of Specialized Computer Labs 24 256 24 Number of General Access Lab 1 26 Printers Number Ratio Number of Printer for Student 3 88:1 Fall 2022 Spring 2023 Program No. of Students Total Books (Print + Ebooks) Ratio Book/Student No. of Students Total Books (Print + Ebooks) Ratio Book/Student ECE 103 23099 224 91 23107 254 CS 204 14835 73 193 14835 77 MSEE 7 1457 208 5 1457 291 Program Databases ECE IEEE ProQuest Computing O’reilly Safari CS IEEE ProQuestComputing O’reilly Safari MSEE Environment Complete ( Ebsco) IEEE One Petro ScienceDirect SciTech Premium Collection (ProQuest) 87


Vision
Effat College of Architecture and Design aspires to be a hub for creative and innovative scholars of faculty and students who contribute through artistic, innovative, and sustainable solutions to the local and global community
Mission
Effat College of Architecture and Design graduates creative and effective leaders who can compete nationally and internationally by integrating core values into the education of architecture, design, and visual media and combining academic study and practicum experience
Departments
Architecture Department
• Bachelor of Science in Architecture
• Master of Science in Urban Design
Design Department
• Bachelor of Science in Design
Cinematic Art Department
• Bachelor of Science in CinematicArts


89
Student Profile
Degree Fall 2020 Spring 2021 Fall 2021 Spring 2022 Fall 2022 Spring 2023 Undergraduate 442 395 435 426 461 446 Postgraduate 34 29 30 26 193 177 90
Student Enrolment
Enrolment by Program
Program Semester Continuing Registered Students New Registered Students Total Registered Students Leave of Absence Pending Graduation due to IC/IP Total Enrolled Students F M T F M T F M T F M T F M T F M T Architecture (ARCH) Fall 2020 191 0 191 62 0 62 253 0 253 7 0 7 3 0 3 263 0 263 Spring 2021 209 0 209 10 0 10 219 0 219 6 0 6 0 0 0 225 0 225 Fall 2021 174 0 174 39 0 39 213 0 213 9 0 9 2 0 2 224 0 224 Spring 2022 176 0 176 8 4 12 184 4 188 11 0 11 3 0 3 198 4 202 Fall 2022 162 5 167 27 3 30 189 8 197 2 0 2 1 0 1 192 8 200 Spring 2023 178 8 186 4 2 6 182 10 192 6 0 6 1 0 1 189 10 199 Design (DESN) Fall 2020 55 0 55 49 0 49 104 0 104 1 0 1 2 0 2 107 0 107 Spring 2021 92 0 92 11 0 11 103 0 103 3 0 3 1 0 1 107 0 107 Fall 2021 97 0 97 35 0 35 132 0 132 2 0 2 0 0 0 134 0 134 Spring 2022 124 0 124 19 1 20 143 1 144 2 0 2 0 0 0 145 1 146 Fall 2022 137 0 137 30 3 33 167 3 170 2 0 2 0 0 0 169 3 172 Spring 2023 156 1 157 1 1 2 157 2 159 2 0 2 0 0 0 159 2 161 Cinematic Arts (CA) Fall 2020 38 0 38 22 0 22 60 0 60 2 0 2 10 0 10 72 0 72 Spring 2021 60 0 60 3 0 3 63 0 63 0 0 0 0 0 0 63 0 63 Fall 2021 52 0 52 22 0 22 74 0 74 3 0 3 0 0 0 77 0 77 Spring 2022 66 0 66 8 2 10 74 2 76 2 0 2 0 0 0 76 2 78 Fall 2022 68 2 70 12 6 18 80 8 88 0 0 0 1 0 1 81 8 89 Spring 2023 74 7 81 2 1 3 76 8 84 2 0 2 0 0 0 78 8 86 Masters of Science in Urban Design (MSUD) Fall 2020 16 0 16 18 0 18 34 0 34 0 0 0 0 0 0 34 0 34 Spring 2021 28 0 28 0 0 0 28 0 28 1 0 1 0 0 0 29 0 29 Fall 2021 14 0 14 10 0 10 24 0 24 3 0 3 3 0 3 30 0 30 Spring 2022 24 0 24 0 0 0 24 0 24 1 0 1 0 1 1 25 1 26 Fall 2022 14 0 14 5 1 6 19 1 20 1 0 1 0 0 0 20 1 21 Spring 2023 13 1 14 0 0 0 13 1 14 2 0 2 0 0 0 15 1 16
*Including Number of Students in Foundation Level, Leave of Absence, and Pending Graduation Students.

Historical Student Enrolment by Program 91
Enrolment by Internationalization

2020 - 2021 2021 - 2022 2022 - 2023 Saudi Non-Saudi Saudi Non-Saudi Saudi Non-Saudi 286 138 275 177 266 196 92
Nationality Australia Bangladesh Egypt Eritrea Finland India Ireland Jordan Lebanon Morocco Nigeria Pakistan Palestine Saudi Arabia Slovakia Somali Sri Lanka Sudan Syria USA Yemen

93 Historical Number of Graduates
Alumni Profile
Alumni Status
94
66% 4% 30% ARCH Alumnae Status 2009-Spring 2023 Working Studying Seeking Job 77% 2% 21% DESN Alumnae Status-Spring 2023 Working Studying Seeking Job 75% 4% 21% CA Alumnae Status 2017-Spring 2023 Working Studying Seeking Job 90% 0% 10% MSUD Alumnae Status 2016- Spring 2023 Working Studying Seeking Job Overall Effat College of Architecture & Design Alumni Status up to Spring 2023 Alumni Participation Rates In Survey 79% Alumni Profile Working 70% Studying 3% Seeking Job 27% Company Status National 84% International 16% Alumni who started their own business or are in senior executive positions Entrepreneur 9% Senior Executive Positions 9%
Faculty Profile
Faculty Rank
Saudi vs Non-Saudi
Full-time vs Part-time
Note: The faculty profile consists of teaching staff who have served at least 1 semester in 2022-2023.
Department Professor Associate Professor Assistant Professor Lecturer Instructor # % # % # % # % # % Design Department 0 0% 0 0% 4 40% 0 0% 6 60% Cinematic Arts 0 0% 0 0% 2 33% 2 33% 2 33% Architecture Department 6 46% 0 0% 5 38% 2 16% 0 0% Department Full Time Part Time # % # % Design Department 7 70% 3 30% Cinematic Arts 5 83% 1 17% Architecture Department 11 85% 2 15% Department Saudi Non-Saudi # % # % Design Department 6 60% 4 40% Cinematic Arts 1 17% 5 83% Architecture Department 12 92% 1 8% 95
Labs
Facilities Profile Database Subscription Library
Technology Equipped Labs Number Capacity # of Projectors Specialized Computer Labs-ARCH 5 80 Specialized Computer Labs-DESN 4 47 Specialized Computer Labs-CA 8 83 Specialized Computer Labs-MSUD(Environment Lab COAD2015) 1 1 Total Number of Specialized Computer Labs 18 211 18 Number of General Access Lab 2 38 Printers Number Ratio Number of Printer for Student 8 89:1 Fall 2022 Spring 2023 Program No. of Students Total Books (Print + Ebooks) Ratio Book/Student No. of Student s Total Books (Print + Ebooks) Ratio Book/Student ARCH 200 9440 47 199 9440 47 DESN 172 5340 31 161 5357 33 CA 89 6228 70 86 6228 72 MSUD 21 2196 105 16 2206 138 Program Databases ARCH Art & Architecture Complete Environment Complete ( Ebsco) Green File DESN Art & Architecture Complete Environment Complete( Ebsco) Green File CA Art & Architecture Complete Communication & Mass Media Complete The Arts ( Proquest ) O’reilly Safari MSUD Art & Architecture Complete Environment Complete ( Ebsco) Green File 96


Effat University
PO Box 34689
Jeddah 21478
Saudi Arabia
Telephone: +966 92 000 3331
Fax: +966 12 637 7447
Email: effatuniversity@effatuniversity.edu.sa
www.effatuniversity.edu.sa


