ALIGNING EV DRIVER COMFORT WITH THE NEEDS OF THE POWER SYSTEM IN A NEW ENERGY VALUE CHAIN Accelerating to net-zero: redefining energy and mobility
xx2 1e-mobility Contents Key messages 2 Foreword 4 1• Accelerating to net-zero: redefining energy and mobility 6 Consumers driving the decarbonisation of transport 8 Potential for promising synergies 10 Removing barriers and unlocking value 12 Three enablers for accelerating EV uptake 14 A new energy value chain aligning EV driver comfort with the needs of the power system 16 2• Making it happen 20 What could the future of e-mobility contribute to society? 22 Co-creating to set things in motion 28 Implementing the right measures 32 3• Deep dive 40 Accelerating the shift to a decarbonised society 42 Moving from commodity to energy services 56 A system perspective on additional value streams of EVs 58 4• Appendix 60
Empowering consumers to exploit EV flexibility on electricity markets
E-mobility is essential for making rapid progress towards decarbonisation E-mobility provides the fastest and cheapest lever for abating climate change in the coming decade. And if we do so intelligently and jointly across mobility and power sectors, then electric vehicles (EVs) can support the integration of more renewable energy in the power system which is an essential element on the road to decarbonisation. Smart charging can create social welfare and can reduce CO2 emissions.
Charging needs to be smart so consumers can fully exploit the opportunities their EVs provide for the power system, while at the same time enjoying a smooth charging experience. Therefore, system operators will send signals (mainly price signals, but others too) that incentivise smart charging behaviour, maximising the consumer experience (comfort, convenience, cost, etc.), while also taking into account the needs of the power system (renewable availability, grid constraints, etc.).
A digital passport, reconciling the right for privacy and openness of data flows To enable new EV services, efficient data exchange and communication between all players involved and consumers is required. The development of digital identities for consumers (citizens) by a trusted government agency is the necessary basis so data can be easily shared by consumers with respect to their privacy, and in an open way for everyone who provides services designed to enhance the EV driver experience.
Just a decade can make all the difference By 2030, EVs will no longer solely be a means of transport; they will be integrated with other assets and services enhancing the lives of consumers. Efforts by many players will be needed to ensure EVs become more than just a car to their owners. Just like the smartphone has become more than just a communication tool. Now is the time to jointly test, learn, adjust and scale so that the system and new EV services are available once EV growth goes exponential.
2 Key messages 3e-mobility
Key messages
Full speed ahead with smart home and work charging infrastructure supplemented with fast chargers More than 80% of charging will happen at home or work. We need to put maximum effort on providing smart charging infrastructure in these market segments via economic incentives. This needs to be supplemented with a number of fast charging facilities along major transport routes in order to overcome range anxiety and allay any hesitation about switching to EVs.
E-mobility, the fastest and cheapest lever for abating climate change in the coming decade
Making the EU the world’s first climate-neutral economy will require more than just an energy transition. To cut CO2 emissions by 2050, many sectors will need to make far-reaching changes. Two sectors that play a key role in society have the leverage needed to do this: power and mobility. Over the last 10 years, the power sector has made important progress in making the switch to a renewables-based power system. With transport currently accounting for a quarter of Europe’s CO2 emissions and electric vehicle technology close to maturity, also this sector can make a major difference in a short time. Moreover, ambitious climate plans and environmentally conscious consumers are creating a growing sense of urgency. “ With transport currently accounting for a quarter of Europe’s CO2 emissions and electric vehicle technology close to maturity, also this sector can make a major difference in a short time.
“ Without the acceleration from early market acceptance to EV mass adoption, we will not benefit from the full potential of decarbonised mobility anytime soon.
54 e-mobilityForeword
For system operators, electric vehicles are more than just a means of getting from A to B. In a renewable world, EVs can contribute to the transition from the current power system, where generation is geared to consumption, to a system where consumption is geared to renewable energy generation. They are flexible tools capable of actively participating in electricity markets since their charging times can be aligned with the needs of the power system. In a renewables-based power system that relies heavily on wind and solar generation, access to flexibility is essential since that is what makes it possible to maintain the balance between supply and demand at any given point in time.
Chris Peeters, CEO Elia Group & Stefan Kapferer, CEO 50Hertz examines how we can ensure that the power and mobility sectors are better aligned to make this happen. Integrating these two sectors would not only help decarbonise mobility, but would also further enhance the incorporation of renewable energy sources, especially when smart charging is broadly introduced. It is up to us to fully exploit this potential! However, successful convergence between the power and mobility sectors can only be achieved if we remove current barriers for consumers and allow additional EV value streams to be unlocked, making EVs the car of first choice for the majority of car buyers. Drawing on our discussions with stakeholders and our experiences with test projects, we have come up with a series of recommendations. One thing is certain, the consumer experience must be as good as possible. We have also examined the future impact of EVs on the power system and especially how smart charging (electricity price optimisation) can lead to benefits for both EV drivers and the system.
As grid operators in Belgium (Elia Transmission Belgium) and the North and East of Germany (50Hertz), we are at home in two different markets and benefit from multiple perspectives. Elia Transmission Belgium is highly interconnected with neighbouring countries and has access to lower voltage levels within Belgium. Meanwhile, 50Hertz is a European leader in renewable energy integration and operates in a country with one of the world’s largest automotive industries. The energy transition is a highly complex endeavour involving many key players. Elia Group has a solid track record when it comes to sector convergence to speed-up decarbonisation. The Internet of Energy (IO.Energy) initiative launched two years ago led to setting up ecosystems for data exchange with a number of actors from other sectors, including the construction industry. Here too, we wanted to respond to the changing needs of consumers, enabling them to make better use of their solar panels and heat pumps by means of digital technologies.
To achieve the fastest transformation with the greatest CO2 impact, fast adoption of electric vehicles as soon and as widely as possible, is one of the top levers. Compared to other levers (such as construction and industry) the relatively short lifecycle of a car enables a rapid impact. To that end, this vision paper
Convergence between power and mobility benefits the mobility sector too. Being connected to the grid offers opportunities to enhance the consumer experience by providing additional services (besides charging) that are enabled by open data exchange between system operators, market parties and consumers, with their consent of course. Such services could involve integrating the EV battery into a smart house or smart community in order to optimise a broader set of devices, such as solar panels and electrical appliances. However, there are many other unexplored options and we are keen to work with all relevant stakeholders to develop, enhance and exploit those opportunities.
Three enablers driving comfort and value for consumers
Mutual benefits in the interest of society
Elia Group’s vision: a successful energy transition for a sustainable world
Although EV drivers and service providers in the e-mobility value chain still face many challenges, there are positive signs. In addition to steadily falling battery costs and the growing number of available models, we have identified three enablers for overcoming existing barriers to EV uptake and unlocking additional value streams: (1) physical and digital infrastructure, (2) open data access and (3) market rules enabling new consumer Havingservices.these three enablers in place would eliminate many of the obstacles currently facing consumers and would push EVs towards the sweet spot of value and convenience and lead to widespread adoption. Removing barriers and unlocking value streams would give all consumers a superior driving experience while making the power and mobility sectors more sustainable. That is why bringing EV adoption to exponential growth is so important to society. Without the acceleration from early market acceptance to EV mass adoption, we will not benefit from the full potential of decarbonised mobility anytime soon. In other words, the enablers we present in this vision paper are critical to society. All relevant stakeholders will have to play their part: system operators, carmakers, public authorities and commercial parties. If we manage to get everything right, new value chains will emerge that align the comfort and convenience of EV drivers with the needs of the power system. Not only will this have a major impact on the successful decarbonisation of our society, but it will be an immense opportunity.
www.ioenergy.eu


With this vision paper, Elia Group seeks to facilitate the smooth, large-scale adoption of EVs, where EV drivers can charge their cars when needed and in line with the physical constraints of the system. As Elia Group works in the interest of society, its societal task is to better understand and prepare for the new technological revolution of e-mobility. Although still marginal today, the uptake of EVs will have an important impact on the power system in the future. This impact will be even more significant as it is happening in parallel with increased electricity consumption at household level due to for example heat Eliapumps.Group is committed to contributing to the implementation of three enablers: physical and digital infrastructure, open data access and market rules enabling new consumer services. We will optimise and digitalise our power system in order to ensure the successful integration of EVs, delivering value for both consumers and the system. If this succeeds, the power system will be ready to cope with any new type of technology or service.
76 e-mobility1• Accelerating to net-zero: redefining energy and mobility 1• Accelerating to net-zero: redefining energy and mobility

1. Based on NewMotion EV Driver Survey Report 2020 https://newmotion.com/en/ev-driver-survey-report-2020/Every breakthrough technology enjoys a period of exponential growth before being disruptive. The technology adoption life cycle of a product typically follows an S-curve, due to the fact that customers respond to new products in three phases: uptake, growth and mass market. Today, consumers in the uptake phase mainly buy an EV to experience a new technology, contribute to decarbonisation, or have access to secondary benefits such as free parking or the use of bus lanes and lower taxation. Consumers in the mass market will buy an EV because it has become the new standard in the car market. Reaching the tipping point on the S-curve, where growth accelerates, is the first step towards mass market adoption.
Consumers driving the decarbonisation of transport
Time
Consumers are sufficiently well educated about electric vehicles to enable them to make a conscious choice about their next car. However, they will only make the switch to the new EV technology if they are convinced about the additional advantages and comfort this potential investment will deliver compared to a traditional car.
1• Accelerating to net-zero: redefining energy and mobility 9e-mobility
8
Uptake
Tipping point
The rising speed of technological adoption Growth Mass market Development
We have reached an important turning point when it comes to redefining the future of energy and mobility. With the European Green Deal aiming to make the EU the world’s first climate-neutral economy by 2050, the transition to a CO2-neutral society must be made all the faster. A technology breakthrough in electric vehicles has been gathering momentum over the past few years and can accelerate the decarbonisation of our society.
Just a decade can make all the difference Nowadays, technological revolutions are happening faster than ever before. While it took almost 35 years for the colour TV to be adopted worldwide, it took only 15 years for the internet and less than 10 years for smartphones. This fast uptake of new technologies is also expected for EV technology, but only if it goes hand in hand with a superior customer experience. By 2030, EVs will no longer solely be a means of transport; they will be integrated with other assets and services enhancing the lives of consumers. Just like the smartphone is no longer merely a communication tool, but a means to organise your agenda or to find your way in a city. Efforts by many players will be needed to ensure EVs, just like smartphones, become more than just a car to their Nowowners.isthe time to jointly test, learn and scale so that the system and new EV services for consumers are available once EV growth goes exponential.
It is clear that the rise of EVs will facilitate the fast and effective decarbonisation of the transport sector. But sustainable electrification of transport can only work in conjunction with a reliable and sustainable power grid. In this win-win situation, it seems less obvious that EVs also have the potential to become an essential part of the power system. EV batteries could enable demand to follow RES infeed, making it possible to increase the share of renewables in the power mix. The large-scale adoption of electric vehicles is thus a great opportunity to accelerate the reduction of CO2 emissions in Europe by making the power and mobility sectors more sustainable. But this will only happen if consumers are engaged.
Consumers have the power Consumers – whether individual EV drivers or large fleet owners and organisations wishing to reduce their ecological footprint – have the power to create technology revolutions, sometimes without even being aware of it. Supported by appropriate policies, they can set the pace of the transition to e-mobility and define how high the final penetration of EVs will be.

2. Excluding reductions from importing cheap (low-CO emitting) electricity, there is an overall system reduction of 600,000 tonnes of CO when optimising EV charging in Belgium and Germany.
Developments impacting the energy sector Elia Group sees two major trends influencing the energy sector in the years ahead: accelerated decarbonisation and the growing active participation of consumers in the power system.
Post-pandemic opportunity In addition, accelerating the decarbonisation of society via the power and mobility sectors presents real opportunities for the post-pandemic recovery plan. Both sectors have the know-how and mature technologies to deliver value-generating projects, such as the construction of sustainable power projects and electric vehicle charging infrastructure. Compared to sectors which are hard to decarbonise, such as concrete and chemicals, the power and mobility sectors deliver great leverage as we continue down the path towards climate neutrality.
“ Transitioning to a decarbonised society is our goal and e-mobility is an important contributor to this. It supports the reduction of local pollution where electric vehicles are in use. E-mobility can also provide a fair share of flexibility through load management and smart charging solutions to contribute to grid balancing and support the integration of more renewables in the system by adjusting charging times.”
Julia Poliscanova, Senior Director, Vehicles and E-mobility of Transport & Environment
Value of mass EV market for consumers 1.4-1.7 TWh 600,000 tonnes ADDITIONAL RES INTEGRATION BY 2030 REDUCED CO EMISSIONS BY 2030 sources allowing this energy not to be lost. In this way, EVs can help to accelerate the energy transition. In turn, by making their EV flexibility available, EV drivers can benefit from cheaper charging and sustainable charging thanks to an increasingly decarbonised power mix and a reduction in CO2 emissions of around 600,000 tonnes2 In other words, both the mobility transition and the energy transition are contributing to the accelerated decarbonisation of our society.
“ Electric vehicles are a key asset for managing grids with a high share of wind and solar. We need to unlock their enormous flexibility potential. To deliver this, both the hardware and software of our electricity grids need to be adapted to make the most of these ‘batteries on wheels’, enabling smart charging and vehicle-to-grid solutions.”
E-mobility is essential for making rapid progress towards decarbonisation
400800700600500300 1990 1995 2000 2015 2019 20191990betweenofDecrease47,51%andCOg 2 /kWh Year
Transport accounts for a quarter of Europe’s CO2 emissions. Battery costs are falling and the number of competitive EV models is growing rapidly. Technological progress can deliver a completely new experience and value-added services to EV drivers. Compared to other levers (such as construction and industry) the relatively short lifecycle of a car enables a rapid impact. It is now up to us to fully exploit this potential! And if we do so intelligently, then EVs cannot only charge with increasingly green electricity, but also actively support the integration of more renewable energy in the power system.
Firstly, the European Commission’s recent proposal to increase the 2030 greenhouse gas (GHG) emissions reduction target from 40% to at least 55% further accelerates the need for fast decarbonisation. Over the last 10 years, the power sector has made progress in its transition to a renewables-based power system. In fact, Elia Group is one of the European leaders in integrating renewables to decarbonise the power system. In the 50Hertz control zone (North and East of Germany), more than 60% of the electricity consumed is already being generated from variable renewable sources and the ambition is to reach 100% WHAT DOES THE SECTOR SAY? by 2032. In a fully decarbonised world, managing the power system will become increasingly complex. Not only will electricity generation become ever more weather-dependent, it will also be produced by millions of assets connected everywhere in the European grid. To handle this we need to evolve to a system where consumption follows RES generation. EVs can contribute to this and support the energy transition efficiently. Secondly, by generating their own renewable energy and investing in new technologies (heat pumps, solar boilers and electric vehicles), end customers are moving away from being merely electricity consumers to being users and providers of services, while exploiting their flexibility to the full. Thus, they are becoming active players in the power system. Today, they are already used to interacting with mobile applications in other sectors, such as banking and retail, that instantly meet their needs. With the emergent breakthrough of energy-as-a-service and technologies such as EVs, this could become soon the new reality for the power sector as well.
Evolution of the CO2 emissions of the German electricity mix
The swift decarbonisation of the power sector is one of the means of achieving ambitious climate objectives. The German power sector has made great progress in transforming to a renewablesbased system in the past decades, decreasing the CO2 emissions of the electricity mix by 47.5% between 1990 and 2019. Further increasing the share of renewables in the power system will contribute to decreasing the CO2 emissions of EVs as they will be charged with increasingly green electricity.
In a renewable world with more active consumers, Elia Group sees the potential for promising synergies in the energy and mobility transitions that will have a profound impact on the successful decarbonisation of our society and the user experience of all EV drivers.
Potential for promising synergies
EVs provide an opportunity to increase flexibility in a system that is more and more impacted by the variable nature of renewable energy sources. Via market mechanisms, system operators can gain access to EV battery flexibility to ensure a balance between supply and demand at any given point in time. Adapting the charging times of EVs in this way can help system operators cope with the variable nature of RES and therefore support the integration of a growing share of RES in the power system (1.4 to 1.7 TWh of RES energy additionally integrated via smart charging by 2030). In addition, EV batteries can also store (for subsequent use) surplus electricity produced by the same renewable energy
1• Accelerating to net-zero: redefining energy and mobility
Christopher Burghardt, EU Managing Director, ChargePoint
1110 e-mobility


WHAT DOES THE SECTOR SAY?
Denis Gorteman, CEO D’Ieteren Auto, Importer of Volkswagen Group brands in Belgium
Removing barriers and unlocking value phone calls, but is also a means to order food, pay bills, book flights and more. EV drivers will not only be able to charge their EVs cost-efficiently, but will also use it as part of a smart home to optimise their local electricity consumption and interact with other intelligent devices. Unlocking these new value streams will speed-up mass EV adoption.
But Elia Group believes there are many more value creation options to be explored. EV flexibility should be harnessed when and where it delivers the most value. Sometimes it will be more useful for solving local congestion, sometimes for ensuring RES integration in the system, and sometimes for doing both at the same time. In addition to value creation based on charging behaviour, additional value streams will be made available to EV drivers due to digitalisation. The creation of digital identities, gradual implementation of third-party access to metering data and the emergence of open data frameworks are laying the foundation enabling market players to offer their customers additional services, which could range from simple benchmarking of EV consumption among peers to advanced home energy cooptimisation involving the various flexible assets in a household. In the future, we expect that EVs will benefit simultaneously from multiple value streams. This is typically referred to as ‘value stacking’. Stacking the different value streams will result in faster positive business cases for service providers so they can create offers that are more attractive to EV drivers.
“ E-mobility is in line with our vision of promoting fluid, accessible and sustainable mobility for all. However, the acceleration of e-mobility will only be possible if the electric charging infrastructure develops in turn. This implies the establishment of an ambitious and harmonised fiscal policy in the long term and the deployment of a large network of public and private recharging stations among other things. In the future, charging an EV should be as easy as charging a smartphone.”
Uptake Growth Mass market How to reach mass EV market?
1312 e-mobility
“ Today, we are still encountering various obstacles that slow down the mobility and energy transition. Legacy mechanisms, like pricing, no longer adequately capture today’s energy challenges, especially those related to managing flexibility. In addition, local differences in technologies and policies prevent standardisation and therefore lead to higher costs. Finally, we still see investments being made that do not sufficiently contribute to the transition, such as the installation of charging stations without smart-charging capabilities.”
One EV – limitless possibilities for value creation
To meet the national and supranational needs of the power system, balancing services and participation in electricity markets are currently the best known
Time additionalUnlocking value Breaking barriers Compared to internal combustion engine (ICE) vehicles, EVs are technically simpler, easier to drive, quieter, less polluting and, quite soon, cheaper. However, if we want to benefit from the full potential of decarbonised mobility anytime soon, we will have to accelerate the transition from early market acceptance to mass adoption. Removing the existing barriers to EV uptake will be the first important step. But only if we unlock the additional value of the EV will we enable a superior driving experience and mass EV adoption. value creation options capable of exploiting the flexibility of EVs.
“ The world in 2030: millions of EV cars serve not only as a sustainable means of transportation, but also as a distributed battery system guaranteeing maximum usage of green power. When parked, cars are always connected to the grid, thus fulfilling their dual role. Charging has evolved into a much more efficient, fully automated and mature process: relying on data about user preferences and predicted driving behaviour.”
In terms of barriers, EV drivers list not having enough access to reliable charging points as the third most serious barrier to an EV purchase, behind price and driving range. Therefore, with EV prices falling and vehicle range rising, charging will soon become one of the most important barriers. Next to the lack of sufficient infrastructure, Elia Group has learned that complexity of data exchange among e-mobility players and missing market rules to enable new EV services are still obstacles for service providers aiming to create the best consumer experience. If these barriers are not removed soon, the fast adoption of EVs and its benefits could be jeopardised due to consumers being frustrated by bad user experiences. However, removing barriers will not be sufficient for exploiting the full potential of EVs. We will also have to unlock additional EV value streams in order to reach full mass market penetration. Elia Group believes that future EVs will no longer only be a means of getting from A to B, but will contribute greater value and become a crucial part of consumers’ daily lives, integrating with other assets and services. Just like the smartphone is no longer merely a tool for making Although the previously mentioned developments sound very promising, we are only at the beginning of the shift to e-mobility. Today, EV drivers still face many challenges.
Development
1• Accelerating to net-zero: redefining energy and mobility
Arjan Keizer, Chief Strategy Officer at NewMotion
From a system perspective, an EV can generate value at household level by aligning its charging session with the output from a rooftop solar system, at local level by alleviating potential grid congestion, and at national level by contributing to energy balancing, and even at European level by absorbing abundant and cheap offshore wind power.
Jürgen Werneke, Head of Research and Development at Hubject


EV DRIVER 2. OPENACCESSDATA 3.
Empowering consumers to exploit EV flexibility
By using smart charging algorithms, consumers can receive market signals so EVs can adapt both to user preferences and the conditions of the power system: increasing consumption when there is excess renewable energy and reducing consumption when the grid is overloaded. Advanced smart charging strategies, taking into account both the match between RES supply and demand, and the avoidance of local congestion, are a prerequisite for large-scale EV deployment in order to keep the power grid stable and to ensure a charging experience that is not hampered by congestion.
“ To convince more customers to make the switch to electric vehicles, we must remove the stress associated with recharging. This means that everyone must have the option to recharge their vehicle easily, no matter where they live or where they want to travel to.” Jonnaert, ACEA Secretary General
1. PHYSICAL & DIGITAL INFRASTRUCTURE WHAT DOES THE SECTOR SAY? 1• Accelerating to net-zero: redefining energy and mobility
Based on interviews with various types of stakeholders in the mobility and power sectors, and the experience from our first e-mobility use cases (see page 28), Elia Group has identified ways to turn barriers into enablers that will also unlock additional value streams of the EV. MARKET
Improving charging comfort
ENABLINGRULESNEWCONSUMERSERVICES
According to the European Alternative Fuels Observatory, more than 200,000 normal and fast public charging points are already installed in the EU today, but many more will be needed to serve the growing EV fleet. More effort is also needed to improve EV driver convenience by ensuring reliable charging within and across European countries. Industry voices preparing for a review of the European Alternative Fuels Infrastructure Directive are also going in that Nevertheless,direction. public charging infrastructure is only one piece of the puzzle: more than 80% of charging will happen at home or at work, which means we need to put maximum effort into providing smart charging infrastructure in these market segments via economic incentives. In the short term, charging infrastructure needs to be supplemented with a (limited) number of fast charging facilities along major transport routes in order to overcome range anxiety and allay any hesitation about switching to EVs. Complement this with the gradual development of charging options for people in urban areas and big cities, and charging infrastructure as a barrier to EV uptake will soon. Additionally, charging needs to be smart. For this, not only charging points, but digital infrastructure enabling metering, settlement, and data exchange also plays a role. Enabling smart charging requires speeding up the rollout of digital meters and affordable charging points that can communicate with other devices.
For decades, consumers took their electricity supply for granted and had no influence or control over it, but the development of EVs will lead to a change in the relationship between consumers and electricity. However, the regulatory framework as well as the processes and tools available in the power sector are still based on consumer passivity. Therefore, new approaches to market organisation need to be designed where consumers, either alone or via an intermediate service provider, can optimise their electricity consumption by following certain signals and benefit from it. This can be enabled by, among other things, simplifying access to electricity markets and evolving current communication and metering requirements as well as settlement methods.
Three enablers for accelerating EV uptake
Opening up unlimited possibilities for mobility and energy services for consumers To fully enable new EV services, the grid needs to understand EVs and vice versa. This requires efficient data exchange and communication between all players in the e-mobility value chain and Firstly,consumers.consumers must be empowered to make their data accessible in order to enjoy new services, but always in line with their rights to privacy. The development of digital identities through which consumers (citizens) can disclose data to parties of their preference and easily sign agreements with these parties by a government agency is the necessary basis for this. Data can then be used in a secure but open way for everyone who provides services designed to enhance the EV driver experience. Providing data and agreeing with a service should become as easy as paying with your mobile banking app. Additionally, we see that players in the power and mobility sectors are currently holding on to their own data access approaches. Next to digital identities, it will be necessary to converge such data approaches across sectors and roles in order to reach a lean end-toend data flow leading to value-added services for the EV driver. An open data architecture, coordinated between players in the mobility and power sectors, should be created allowing market parties to access data from multiple sources to develop EV services. Within this architecture, system operators would make their data available and have access to the data required to perform their societal tasks and to optimise the operation of the system.
Once value stacking across different value streams (including wholesale markets, balancing markets, congestion management and/or digital services) becomes easily accessible, an environment offering new tailor-made services will emerge for EV drivers. This will enable EV drivers to enjoy cheaper and greener energy and a smooth charging experience in line with its current comfort levels. In contrast to a vertically integrated approach, we want to enable value stacking in an open manner, where opportunities are created independently of the supplier or device.
1514 e-mobility
Erik

electricity
5. The numbers in this paragraph are
See also page 22. 1• Accelerating to net-zero: redefining energy and mobility
Elia Group, together with many other stakeholders, sees that e-mobility is a technological revolution that clearly demonstrates the need to create a new consumer-centric energy value chain in the very near Consumerfuture.
17e-mobility16
interaction with electricity is currently limited to paying complex bills and choosing between different electricity suppliers with similar offerings. In contrast with the current commodity value chain, in a consumer-centric energy value chain the interest of consumers, commercial players and system operators can be aligned. It is a value chain where data exchange and processing are the most critical functions and which can only be enabled by the digitalisation among all players. The alignment between the various parties can be conceptualised around a series of layers as shown in the figure on the Forright.e-mobility, this kind of layered approach will allow the mobility and power sectors to better interact with each other. On the one hand, service providers will be capable of taking power system constraints4 into account in their optimisation algorithms when defining ideal charging profiles or developing customised services for their customers. In this way, the EV driver experience will not be restricted due to the physical limitations of the system. On the other hand, system operators, by exchanging data across layers, will have better visibility of the evolving system. This will lead to improved system operation and the planning of investments that are most effective socioeconomically.
Two years ago, Elia Group shared its vision3 on how to put the consumer at the centre of the power system in order to unlock the latent demand for better energy services. With this vision paper, we are focussing on consumers with an electric vehicle.
Overall, EV drivers will benefit as they will have better charging experiences without possible interruptions. Society will benefit due to the optimised use of the system creating additional welfare. For e-mobility alone, this could already be worth about €500 million5 Service providers will also benefit from new opportunities to create value propositions for EV drivers and deploy them at scale. Elia Group is committed to transforming its activities in order to lay the necessary foundation enabling this value chain to support the transition towards e-mobility. However, all parties will have to contribute to the materialisation of this value chain, which, in addition to e-mobility, will also deliver value for many other new types of technologies interacting with the power system, such as heat pumps and smart home devices. S-curve of EV uptake
A new energy value chain aligning EV driver comfort with the needs of the power system
Enabling the S-curve to mass EV adoption in a decarbonised society requires that we take a different look at how electricity is generated, transmitted and supplied. The current energy value chain will need a serious upgrade.
experienceUserEnergyservices (B2C) applicationsBusiness (B2B)
applicationsSystemPhysicalinfrastructure
Materialising the three enablers is contributing to the emergence of a new energy value chain aligning EV driver comfort with the needs of power system example, cannot be stored over long periods of time and the electricity network can only handle power flows within its limits based on Elia Group studies focusing on the impact of EVs on the Belgian and German system in 2030.
3. Elia Group Vision paper Towards a consumer-centric tions/181122_consum_centric_web.pdfhttps://www.eliagroup.eu/-/media/project/elia/shared/documents/elia-group/publicasystem, 4. For
System applications
Service providers directly offering their customers mobility and energy services (e.g. charging passes, apps to find charging points, track charging payments or optimise charging as part of the home energy management system, etc.) are operating via the energy services layer.
It is the starting point for open and secure data exchange (enabler 2) with all players who need access to system-related data, as well as for the development of new market products to manage the system and to, say, price signals (enabler 3).
The first enabler, physical and digital infrastructure, is found in the layer of the similar name, where various companies install and operate charging points and digital infrastructure, and which are linked to the physical power system.
Example of mapping a potential energy service on to the new energy value chain: all-inclusive leasing contract for the EV driver
“ This next decade will define the future of the automotive industry. Advanced decarbonisation and connectivity are key to reaching our common goals of clean, smart and safe mobility. For this, a whole new integrated ecosystem is needed in order to fully leverage the potential of smart charging electric vehicles and an increasingly complex electricity grid. Cooperation between industries is necessary and inevitable.”
Energy services
The system applications layer is a combination of system and energy market applications and system status information to be shown to market parties in order to create services within the business applications and energy services layers.
Actually, developing and deploying the three enablers for EV uptake is also about contributing to the emergence of this new value chain.
User experience
Access to power markets and exposition of price information and system state data, via the regulated data exchange platform.
Business applications A charging point operator optimises the charging behaviour via smart charging. He finds the optimum between user preferences and the status of the power system to define the charging profile. Physical infrastructure Metering data from the smart meter with gateway at the home charging point or from the public charging point.
Andreas Cremer, CEO FEBIAC
1918 e-mobility
WHAT DOES THE SECTOR SAY? 1• Accelerating to net-zero: redefining energy and mobility
Other companies, with energy, IT or banking expertise, offer their services to these customerfacing companies through the business applications layer. They provide business-to-business interactions, such as online payment service tools and electricity consumption monitoring applications.
The EV driver pays a monthly leasing fee for the “unlimited” use of its car at a price based on its past behaviour and preferences. In an effortless way, he can charge where he wants without caring about the costs.
The system applications layer is a necessary foundation for allowing service providers to take into account the conditions of the physical power grid when building new applications for their clients and enables them to scale without any restrictions.
A leasing company has a mobile insuranceoftakesfeecalculatingapplicationthesubscription(leasing)fortheEV.Thisintoaccountthecostthecar,maintenance,andcostof electricity including benefits from smart charging, as well as historical charging behaviour.
Three enablers contributing to the emergence of a new value chain
To enable the development of these digital services while ensuring the overall functioning of the power system, a link to the power system (through the system applications layer) is key.


Feedback from multiple stakeholders in the mobility and power sectors shows that the critical needs of today’s EV driver are related to infrastructure. At the same time, Elia Group believes it is also necessary to already work towards open data exchange and the creation of new market rules making it possible to develop services related to future customer needs. That is why in this vision paper we are sharing the initiatives we, together with our partners, have taken so far and suggesting actions for all players to take in the near future.
In addition to analyses and studies, Elia Group is convinced that cycles consisting of rapid testing, failing and improving are the best approach for learning quickly and achieving scalable new solutions. That is why several test projects have been set up with partners from various sectors to work on the three enablers.
Finally, decisions on current mobility and energy policy and associated regulations could be taken with a view to ensuring the smooth and mass adoption of electric vehicles. We come up with a series of recommendations on this.
2120 e-mobility2• Making it happen 2• Making it happen
Elia Group has conducted an analysis to assess the impact of EV charging on the power system in Belgium and Germany by 2030.

In addition, such behaviour does not consider the amount of RES available in the system during charging. Figure 1.A (Belgium) and 1.B (Germany) on the next page show an average increase of up to 10% of the evening peak load (1.2 GW in Belgium and 6.5 GW in Germany on average) when uncoordinated charging takes place.
Charging electric vehicles based on the electricity prices will have an impact on the type of congestions in the distribution grid. There will be a decrease in feed-in related congestions (higher local solar production than demand), but load driven congestions (additional demand spikes) can increase with high levels of wind production. These congestions can be solved by including a local component in the smart charging algorithm.”
“
Damien Ernst, Professor University of Liège and energy expert EVs are the future of personal mobility and will lead to an overall increase in electricity demand. To assess the future impact of EVs, we imagined ourselves in the year 2030 and assumed 1.5 million EVs in Belgium and 10 million EVs in Germany. We also assumed that 70% of them are battery electric vehicles (BEV) and 30% are plug-in hybrids (PHEV).
“ This is the best study to date showing the importance of rapidly developing all the infrastructure necessary for the smart charging of electric vehicles to minimise electricity costs for consumers and accelerate the energy transition.”
Kathrin Goldammer, CEO Reiner Lemoine Institute
Elia Group has performed an in-depth analysis to quantify the impact of electric passenger vehicles on the power system. The impact of EV charging in Belgium and Germany on total electricity load, electricity prices and CO2 emissions was calculated on the basis of a European market model using the ENTSO-E TYNDP 2018 distributed generation scenario for 2030. The transportation behaviour of these vehicles was based on historic mobility data gathered by the Belgian (2016) and the German (2017) governments in cooperation with respectively the Vias Institute and BMVI. The results presented in this section are for the Base 1 scenario, where the charging speed at home is mainly 3.7 kW. Two sensitivities on the Base 1 scenario are the Base 2 (mainly 11 kW charging at home) and Work scenario (increased amount of charging points at work). More details on input scenarios, parameters, assumptions and methodology can be found in Appendix 3.
The results focus on two main scenarios, where all EVs will be either charged without any form of smart algorithm (uncoordinated charging) or by minimising the electricity cost for the EV driver (smart charging). In uncoordinated charging, EVs automatically start charging when connected to a charging point. This contrasts with smart charging, which is defined in this vision paper as intelligent algorithms that optimise the charging process, taking into account both electricity prices (or renewable generation) and local congestion. However, the smart charging simulations performed in this vision paper only focus on electricity price optimisation. Smart charging therefore allows the EV driver to benefit from an optimised charging behaviour, provided that he is billed on the basis of dynamic electricity prices. For smart charging, we looked at two different cases where all EVs either perform Vehicle-1-Grid charging (V1G or unidirectional charging) or V2G charging (bidirectional charging).
WHAT DOES THE SECTOR SAY?
2322 e-mobility2• Making it happen
What could the future of e-mobility contribute to society?
Key assumptions
While there is a moderate increase in national electricity consumption, the more relevant matter is the time when electric vehicles charge. During uncoordinated charging, their electricity consumption will largely overlap with the evening consumption peak when people come home from work, start cooking and use their electric appliances. This typically leads to high evening consumption peaks, often characterised by higher electricity prices, higher CO2 emissions and higher loading in the distribution grid (potentially leading to congestions).
For V1G simulations, this means that the smart charging algorithm will steer consumption to times when electricity prices are lowest, not taking into account the effects of grid tariffs and taxes. For V2G, additionally, the EV can inject electricity into the grid when market prices are high.
The electrification of around 20% of passenger vehicles in Belgium and Germany, i.e. 1.5 and 10 million EVs respectively, will increase national annual consumption by 4 to 5%. Typically, an EV consumes 2.5 to 3 MWh of electricity per year, which is slightly less than the annual consumption of an average household. Nevertheless, the emergence of electric boilers and heat pumps will increase household consumption going forward.


2• Making it Figurehappen1.A: Average annual total electricity load BE - base 1 - uncoordinated charging 100001300012000110009000800070006000[MW]Power Average RES production Average system load uncoordinated Average system load without EVs 0h00 1h00 2h00 3h00 4h00 5h00 6h00 7h00 8h00 9h00 10h00 11h00 12h00 13h00 14h00 15h00 16h00 17h00 18h00 19h00 20h00 21h00 22h00 23h00 High load and low solar generation + 10% Figure 1.D: Average annual total electricity load DE - base 1 - smart charging 40000800007000060000500003000020000[MW]Power Average RES production Average system load smart Average system load without EVs 0h00 1h00 2h00 3h00 4h00 5h00 6h00 7h00 8h00 9h00 10h00 11h00 12h00 13h00 14h00 15h00 16h00 17h00 18h00 19h00 20h00 21h00 22h00 23h00 + 8% High solar generation Low non-EV consumption + 7% Figure 1.C: Average annual total electricity load BE - base 1 - smart charging 100001300012000110009000800070006000[MW]Power Average RES production Average system load smart Average system load without EVs 0h00 1h00 2h00 3h00 4h00 5h00 6h00 7h00 8h00 9h00 10h00 11h00 12h00 13h00 14h00 15h00 16h00 17h00 18h00 19h00 20h00 21h00 22h00 23h00 High solar generation Low non-EV consumption + 10% + 8% Figure 1.B: Average annual total electricity load DE - base 1 - uncoordinated charging 40000800007000060000500003000020000[MW]Power Average RES production Average system load uncoordinated Average system load without EVs 0h00 1h00 2h00 3h00 4h00 5h00 6h00 7h00 8h00 9h00 10h00 11h00 12h00 13h00 14h00 15h00 16h00 17h00 18h00 19h00 20h00 21h00 22h00 23h00 + 10% High load and low solar generation Figure 1: The total electricity load for both Belgium (top) and Germany (bottom) in 2030. The left side shows the effect of not taking action (uncoordinated charging) while the right side shows the effect of smart charging (V1G). 25e-mobility24
for
Benefits for the system
Smart charging6 (in this case V1G, optimising every vehicle) shifts the bulk of EV loading to times when electricity prices are lower, overcoming the effects of uncoordinated charging on the evening peak. As shown on Figure 1.C and 1.D, these times occur (on average) during the night with low electricity demand (load increase of 7-10%) or during the day when there is a high share of renewables (solar generation) in the system (load increase of 8%). During smart charging, almost no extra EV load is added (on average) to the normal evening electricity peak. Figure 1.C and 1.D show that smart charging aligns better with solar and wind infeed in the system, thereby reducing the stress in the power system as the maximum amount of electricity demand that must be covered with other sources (e.g. conventional power plants) decreases. V2G further improves this effect by injecting electricity charged during the day at the evening peak, therefore not only lowering the peak demand but also supporting supply during periods with low solar and wind infeed (grey curve) Figure 2. More information on the average annual charging curves for uncoordinated and smart charging (V1G and V2G) can be found on page 47. Smart charging can deliver these benefits to EV drivers because of the range of opportunities that can be used for charging.
Making it happen Smart charging benefits
A vehicle is stationary for more than 90% of the day, while its battery typically needs to charge two hours only (on average, assuming a 3.7 kW charger). The average daily electricity usage of an EV is 7 kWh, only a fraction of the total battery capacity (e.g. 17.5% of a 40 kWh battery). This creates a window of opportunity to optimise the charging process. It makes it possible to delay the charging until later or even the next day if remaining battery capacity is sufficient to perform the trips planned for the next day. All these elements combined give EV drivers many opportunities to optimise their charging behaviour and thus reduce their electricity bill.
compared
Benefits for EV drivers Smart charging delivers multiple benefits for EV drivers. Our studies show that the annual cost of electricity for charging (excluding taxes, tariffs and levies) is lower and that the electricity used for charging is generated by technologies emitting less CO2 compared to uncoordinated charging. For an individual EV driver, the annual electricity cost reduction is between €30 and €55 (optimisation against day-ahead electricity prices). This is 15-30% reduction on the annual cost of electricity for charging a typical EV. Combining this with other value streams stemming from the EV will even increase the savings for the EV driver.
Smart charging therefore reduces the volume of renewable energy that would otherwise be lost (i.e. not allowed to run).
With regard to CO2 emissions, the electrification of mobility has two effects. The first effect is that EVs emit less CO2 compared to their ICE equivalents based on their entire life cycle, as shown by Transport and Environment (T&E)7. They calculated that a Belgian (German) EV emits on average 59 (61) gr CO2/km in the year 2030, whilst a diesel or petrol vehicle emits between 219-239 gr CO2/km. This is a reduction of more than 70%. electricity price optimisation.
6. Smart charging in this study only focuses on
Our smart charging simulations show a volume of 1.4 to 1.7 TWh of RES energy, or, put differently, the annual consumption of 600,000 electric vehicles (out of a total of 11.5 million EVs in Belgium and Germany) that would otherwise be lost. This effect can be almost uniquely attributed to Germany. Smart charging has also an important effect on when peak load occurs in the system. With uncoordinated charging, EVs typically start to charge during the evening hours (18:00-20:00), when total electricity load is already high. Smart charging moves this overall system peak to times with the high renewable infeed (and hence lower electricity prices), typically around 12:00-13:00. As a direct result, the total electricity load better follows the generation of renewable energy in the system. Hence, the maximum amount of power in Belgium and Germany that has to be delivered by sources other than renewables (such as thermal plants, storage, etc.) decreases compared to an uncoordinated charging scenarios. This helps security of supply.
2726 e-mobility2•
Finally, our simulation for 2030 shows that smart charging reduces the overall CO2 emissions of the power system by 600,000 tonnes per year compared to uncoordinated charging (equivalent to the annual emissions from 300,000 ICE vehicles) and generates around €500 million of additional welfare per year The latter is explained by the reduction in operational costs of the system, as EV charging will better follow the infeed of (near) zero marginal cost renewable energy generation, reducing the volume of electricity to be delivered by more expensive peak plants. The cost of implementing smart charging on the system and consumer sides are not taken into account. smart charging EV to uncoordinated charging smart charging system to uncoordinated
drivers compared
charging 5%-10% 300 000 VEHICLESICE Reduction in annual CO2 emissions Avoided annual CO2 (equivalent)emissions €30-€55 470 M€520 M€ 600 000 EVS (1.4 - 1.7 TWH)Annual consumer gain Non-spilledpowercostOperationalofthesystemRES,(equivalentconsumption)€ €€0€10,00€20,00€30,00€40,00€50,00€60,00€70,00€80,00 Figure 2: Change in charging behaviour on the annual average EV electricity demand curve for V1G and V2G in Belgium in comparison with uncoordinated charging (2030) -4001400120010008006004002000-200[MW]demandelectricityEV [€/MWh] Hour of the day 0h00 1h00 2h00 3h00 4h00 5h00 6h00 7h00 8h00 9h00 10h00 11h00 12h00 13h00 14h00 15h00 16h00 17h00 18h00 19h00 20h00 21h00 22h00 23h00 Average load uncoordinated Average load smart V1G Average load smart V2G Average electricity price [€/MWh]
1. Lower total electricity cost for consumers 2. Less CO2 emitted to provide EVs with electricity 3. More opportunities to provide flexibility Three benefits of
for the
Finally, smart charging will give EV drivers additional possibilities for making the flexibility of their EV batteries available to system operators, which in turn will also lead to more opportunities to generate value. With smart charging EVs can delay their charging, which is not the case for uncoordinated charged EVs. This creates an additional state (connected, but not charging yet although a battery level below 100%) that can be used by system operators.
In addition to the above-mentioned benefits for individual EV consumers, shifting the electricity demand of EVs in a pricedriven way creates benefits for the power system as well. A first and very important effect is the decrease in times with RES oversupply, when renewable energy would be lost (reduced in the market) due to insufficient demand (leading to zero or negative electricity prices). By shifting charging to times when there is a lot of solar and/or wind generation (corresponding to low electricity prices), EVs will actively balance out the intermittent nature of RES generation.
Secondly, our study shows that the switch from uncoordinated to smart charging leads to an additional reduction in CO2 (driving) emissions of around 5%-10% per EV (based on simulation results on absolute reduction of CO2 in the power system). The latter is the result of better aligning EV charging with the infeed of renewables into the system, leading to a decreased need for starting up CO2-emitting peak units and a lower occurrence of RES oversupply on the market. Of course, EV drivers can also opt to charge their EVs with green energy only.
Three benefits of
7. https://www.transportenvironment.org/what-we-do/electric-cars/how-clean-are-electric-cars
Ecosystem: Ecosystem:
Blockchain based Digital Identities to integrate EVs into the power Rationale:system
• Unlocking value: EVs have a significant flexibility potential which can be exploited across a wide set of different value streams as charging sessions can be planned and optimised for: - day/night tariffs today, and potentially dynamic grid tariffs in the future; - electricity market prices, charging when they are at their lowest price, but within the comfort needs of the EV driver; - the provision of balancing services to the transmission system operator (TSO). This leads to direct savings on electricity bills for consumers and the creation of a business model for service providers. The latter can minimise their sourcing costs on electricity markets and deliver balancing services via consumers’ EVs and then potentially share their newly generated value with the end consumer. The project results have shown that up to €100 in total can be saved or earned per EV per year, under the current market conditions.
Co-creating to set things in motion
Most early adopters of EVs still fear the impact that the use of their car battery’s flexibility will have on driving range and convenience. In addition, the possibility of giving control of their charging capability to a third party remains a difficult decision for some. This leads to a lack of clear business models behind energy services relying on the exploitation of EV flexibility.
Enabling consumers to contribute to the energy transition with flexible assets
• Impact on comfort and convenience: EV flexibility can be generated and technically operated without any negative impact on the EV driver’s comfort or convenience.
Objective: Within the IO.Energy use case, Flexity, several companies wanted to investigate the drivers for consumers to participate in flexibility services and their possible interest in letting third parties operate their flexible assets. Over the course of the 10-month development and test phase, the focus was on investigating the technical capability and, economic potential for consumers and service providers to operate these assets.
In this context, a Digital Identity (DID) is a unique representation of a device – like a passport. It forms the basis for a secure, trusted and efficient interaction between two parties. In the future, an EV driver might have access to multiple services from multiple providers within but also outside of their ecosystem. We want to rethink and reinvent this interaction to develop a scalable, automated, end-to-end solution to enable flexibility from electric vehicles.
8:
Rationale:(Flexity)
Project phases: In the first phase, the project focuses on establishing an EV registry, to allow the on-boarding of devices. Afterwards, simplified verification processes for pre-qualification (by TSO) will be tested. The functionalities are tested via a simulation tool, and in parallel the physical integration of charging poles and EVs is being prepared. Step by step additional functionalities will be added to the DID such as distribution system operator (DSO) interaction (local congestion management) and balancing market interactions.
• Market rules and technical setup for the mass EV market: - Proper access to charging data for service providers and system operators, with the consent of the consumer, is key to enabling new energy services.
Objective: In this use case, the partners want to demonstrate that representing devices in form of DID facilitates the integration of EVs in the power market. Charging point operators and mobility service providers will be able to create DIDs for their EVs and charging infrastructure devices over an open and independent protocol (Open Charge Point Interface, OCPI). With the help of EWF’s toolkit, DID are created and anchored on the blockchain where they become accessible to the ecosystem, which forms the basis for interaction with system operators, and at a later stage with other market players. Since interoperability is of high relevance, interfaces with existing DID solutions from the mobility sector are explored and taken into account.
Key learnings
Co-development and innovation are critically important to making fast progress in e-mobility. To contribute to the actual development and deployment of the three enablers for EV uptake, Elia Group has reached out to stakeholders across the mobility and power sectors to set up pilot projects in the past months. Some proofs of concept have already been delivered, some are ongoing and many more have yet to be set up.
Timetable: July 2020 – December 2021
- However, the compliancy with the metering requirements for the delivery of grid services remains a challenge and has to be further investigated in a possible follow-up project Duration: 1 year 8. More outcomes looking at heat pumps can also be consulted on Flexity’s dedicated webpage: https://www.ioenergy.eu/flexity/
- EVs were operated via Jedlix technology that relies on the existing connectivity of the EV. This enabled Flexity to roll-out its service quickly, regardless of the location of the charging point. No expensive installation was needed and the onboarding by Jedlix proved to be effortless for the end-consumer.
28 2• Making it happen 29e-mobility


Ecosystem: Ecosystem: Ecosystem:
A pool of V1G and V2G charging points to balance the system
10. Agora study, Verteilnetzausbau für die Energiewende, veroeffentlichungen/studie-verteilnetzausbau-fuer-die-energiewende/https://www.agora-verkehrswende.de/
Elia Group is convinced that collaboration among sectors will be the key to make the full transition to e-mobility happen. We have started some test projects with partners and performed simulations on smart charging, but we are not done yet. Dynamic electricity prices are only one part of smart charging that delivers benefits for both EV driver and the system. To unlock even more benefits, Elia Group invites all stakeholders to work together on a solution that also takes the second component, local congestion management, into account.
With this use case, the partners assessed the possibility of combining unidirectional and bidirectional charging points9 for the delivery of frequency containment reserve (FCR) services in the Belgian power system. It was shown that a pool of unidirectional and bidirectional charging points can deliver FCR services in a commercially viable manner. The size of the fleet is the main driver making EV participation in FCR economically feasible for service providers. No additional hardware was required on the consumer side; the charging points simply had to be connected to the Internet. Other implementation options (e.g. adding additional digital infrastructure in the household or using the existing connectivity of the EV) might offer other opportunities.
Fully enabling energy-as-a-service for EV drivers would mean that any commercial third parties could become the electricity provider for an EV, regardless of the charging location and the consumer’s current electricity contract. With this project, the partners are aiming to demonstrate how new market rules would facilitate the development of all-inclusive mobility contracts, such as leasing contracts that include the provision of electricity to charge the EV.
Elia Group believes that digitalising the power system is the key to bringing both components of smart charging together. The launch of the Group’s IO.Energy ecosystem 2.0 in Belgium and IO.Energy in Germany are great vehicles to host new test initiatives focusing on smart charging, but also for other ideas contributing to the integration of EVs in the power system.
31e-mobility30 2• Making it happen
Duration 2 years, the project was one of the 11 projects selected by the Flemish government as part of its Clean Power for Transport Plan for 2018.
9. The main reason for this is the assumption that not all charging points will be bidirectional in the future due to economic considerations.
What’s next?
Timetable: July 2020 – November 2021
Based on a study of Agora10 smart charging focusing on reducing congestions in the power system can reduce load peaks and decrease the need for grid expansion. The study shows on the basis of different scenarios that investments in distribution grids can be significantly reduced.
Facilitating all-inclusive leasing contracts for electric vehicles
Charging EVs directly with green power generated by an energy community In this project, the partners want to develop an energy community featuring buildings equipped with charging points. The charging behaviour of the energy community participants will be optimised to allow them to maximise their use of local electricity generation, and to benefit from lower electricity market prices.
Timetable: September 2020 – January 2021


Implementing the right measures
What might a fruitful EV driver experience look like?
“ As range anxiety is no longer an issue, the e-driver looks for seamless energy. When there is a plug around, charging should be possible in line with the EV drivers’ needs: plugging in the vehicle at work, at a customer site or in a hotel when travelling around in Europe should be a seamless experience, with clear charging prices in a language humans can understand (€/km) and facilities around the charging point to improve the charging experience for the EV driver (food, drinks, Wi-Fi, etc.).”
Carsten is a 28-year-old salesman living in a small but cosy apartment in Berlin. Carsten is single and enjoys his flexible lifestyle where he meets up with friends, visits fashionable places, does sport and travels regularly to discover new places.
He has a single app, which is also integrated in his car, that allows him to use all types of charging points (fast, slow, national and international) and handles all payments automatically. Even when he takes his car abroad, he receives an itemised charging summary on his electricity bill at home. What is necessary for success?
• Improve current tax incentives to support the electrification of targeted fleets (cabs, company fleets, etc.).
Marie-Pierre Fauconnier, CEO Sibelga
• Give EV drivers open access to public and some private (e.g. supermarkets, apartment blocks, car dealers, offices) charging infrastructure by providing economic incentives designed to accelerate the expansion of the charging network and optimise the use of infrastructure.
• Organise the construction of national public charging infrastructure for EVs, as seen in many front running countries, by organising tender procedures for strategic, profitable and less profitable charging locations, including criteria: - to improve the customer experience (e.g. quality of service, charging price transparency, fast charging options for long-distance needs); - to enable faster development of grid connections; - to harmonise the technical requirements for the charging infrastructure to enable V1G and V2G, if relevant; - to foster transparency in public charging infrastructure, independent of the service provider, by participating in an EU-wide overview of charging points showing their accessibility; - and to be coherent with urban planning. This tendering process would be open to existing players (e.g. concession holders) as well as new •players.
To reach the tipping point for EV uptake towards growth, charging infrastructure needs to be sufficiently available in rural and urban locations and easy to use for current and future EV drivers. Therefore, we need to start with supporting the smooth installation and operation of private and semi-private charging infrastructure. Additionally, a coordinated approach is needed among sectors and at European and national level to plan and roll out public (fast) charging infrastructure at suitable locations that best match consumer needs.
Ronnie Belmans, CEO Energyville, Professor KU Leuven and energy expert
For each enabler, we have started from the envisioned frictionless EV driver experience and then listed the actions that can be taken today by various players to make these a reality.
Accelerating energy transition is Sibelga’s top priority. The Brussels government entrusted us with the mission of coordinating the massive deployment of public charging infrastructure for EVs. We will also ensure that all residents have user-friendly and affordable solutions for recharging their cars at home. Finally, we’re convinced that through smart metering and charging intelligence, EVs will be an important means of local flexibility on the distribution grid.”
“
To support the path to fast mass EV adoption, further steps forward in current mobility and energy policies are required. Elia Group calls mobility players, energy players and policymakers, among others, to work in parallel on the three enablers put forward in this vision paper.
Whystructuredoesthis matter?
WHAT DOES THE SECTOR SAY?
3332 e-mobility2• Making it happen
While initially reluctant to switch to an EV, Carsten now uses his EV every day for his job and during weekends. He no longer worries about his car’s range, as he has never had trouble finding a suitable charging point. Sufficient charging options are available in and around the city, all easily accessible. During workdays, he mostly uses fast-charging points near the highway, while during weekends, when he stays in the city, he uses the ordinary slow chargers in his apartment building or in the street when visiting friends.
Enabler 1: Physical and digital infrastructure Incentivisation and coordinated rollout of private and public charging infra
• As seen in Germany (e.g. NOW GmbH), a specific entity could be appointed to coordinate the implementation of public (fast) charging infrastructure taking the specific national situation into account and monitoring progress along the way.
Evolve European legislation to develop a sound methodology defining the needs for public charging points considering the needs of longand short-distance customers, available grid capacity (based on current grid topology and grid capacity heat maps for charging), and the technical requirements of charging infrastructure (e.g. type of charging power, capability to communicate, react to signals, and to meter).


“ In 2030, electric mobility will be the standard. In order to ensure a successful e-transition, we will see three major developments in the charging network in years ahead: 1) large-scale rollout of charging infrastructure to prepare for a world of 100% electric mobility; 2) extensive integration of charging infrastructure and the energy system; 3) digitalisation of the sector for effective utilisation.”
3534 e-mobility2• Making it happen
An inspiring example of boosting public charging infrastructure: a National Control Centre for charging infrastructure
What is necessary for success?
Accelerated implementation of digital infrastructure Why does this matter?
SECTOR
Why does this matter?
DOES
• The current digital meters do not yet have the specifications needed to ensure the proper evolution of energy services. A solution such as the one in Germany deploying a Smart Meter Gateway is promising, but still needs to be improved. Based on the needs of consumers and the grid, a solid digital metering architecture has to be developed which could lead to standardised requirements for European digital metering infrastructure. In the meantime, we can explore using the existing connectivity of EVs, looking at trade-offs between cost, commercial value and risk of supplier lock-in.
Digital meters with the right communication capabilities are needed to enable behind-the-meter optimisation, supplier or mobility contracts based on wholesale market on quarter-hour prices and the broader use of flexibility. Without metering and communication capabilities linked to flexible devices, it will not be possible to enable smart charging or create any new energy services for EV drivers that would unlock additional value.
Tim van Beek, CEO EVConsult
At the end of 2019, Germany’s Federal Minister of Transport and Digital Infrastructure announced that a new National Control Centre for charging infrastructure was being set up. The state-owned organisation, NOW GmbH, which was already responsible for coordinating and managing several federal state mobility projects, was put in charge of ensuring the swift and coordinated development of Germany’s nationwide charging options. Existing funding programmes for the development of charging infrastructure were deemed insufficient on their own to ensure that the infrastructure was established quickly, reliably, in line with demand, and in a consumer-friendly manner.
“ Embedding clean mobility in Europe’s new normal requires speeding up the launch of battery electric vehicles and the rollout of charging infrastructure, as well as upgrading the grids and developing the appropriate storage solutions.
The core tasks of the National Control Centre involve coordinating federal and state activities, supporting municipalities in the planning and implementation of charging infrastructure, and implementing the German federal governments’ charging infrastructure master plan via tendering mechanisms. The focus of the tender is on expanding a network for ultra-fast charging in Germany.
• Integrate the impact of electric trucks and the need for large-scale charging hubs for longdistance travel in or around large urban centres into the grid infrastructure planning process. To this end, system operators need to collaborate with large fleet owners, public transport operators and logistics companies in order to better understand each other’s needs.
Kristian Ruby, Secretary General of Eurelectric.
WHAT THE SAY?
Groundwork for the next wave of electrified road transport
hubs for taxis, public transport, urban logistics and potentially electrified heavy freight must be taken into account in today’s infrastructure planning (both grid and urban). What is necessary for success?
Compared to the penetration levels of passenger EVs, the electric truck market is still in its infancy. However, it is clear that this segment of the transport industry also needs to be decarbonised if we want to meet the EU’s legally binding target of net-zero emissions by 2050. To this end, the infrastructure needs for this wave of electrified road transport can already be prepared. To avoid unnecessary additional grid and infrastructure costs, the impact of big charging
• In Belgium, step up the pace of the rollout of digital meters for priority users (e.g. EV drivers) enabling them to benefit from energy services by combining the installation of digital meters at home with the installation of private charging points.


• In line with the requirements of the Clean Energy Package, provide third-party access to data, independent of the voltage level and location of the charging point.
DIGITAL IDENTITY
Chiara is not the type that would buy a car online, so she decides to go to the dealership to ask her final questions. At the dealership, she is surprised at how easy the dealer’s simulation tool makes everything. By simply giving her consent to access her electricity consumption data via her digital identity card, the dealer produced a simulation to find out which type of EV best matches her driving needs and electricity consumption behaviour. She also learned that she has the option of having a different supplier providing electricity for charging her EV at home compared to her normal supplier. Based on her electricity consumption data in the simulation tool, she immediately receives a custom offer on her phone for the 100% green charging of her EV, just as she was hoping.
3736 e-mobility2• Making it happen
EV drivers must have easy and straightforward ways to access EV services. In practise, it means they are able to identify their selves, authorise access to their data, for a vast range of services even beyond energy and mobility, and agree with contracts of service providers effortlessly. This is the necessary starting point to a process enabling data-driven services for the EV drivers, but for many other types of consumers as well. Based on this, the rest of the data exchange process can be organised. Harmonisation between the current divergent data approaches of mobility and energy players is required to come to a lean endto-end data flow.
PROVIDERSERVICE
THIRD PARTY DATA ACCESS COMPLIANCEINWITHGDPR
EV DRIVER What is necessary for success?
• Enable a digital process to make consumer data available to the parties they prefer and to digitally sign a contract with a service provider in order to get access to services the easiest way possible. For this, a governmental agency can put digital identities and signature processes in place at nation level.
What might a fruitful EV driver experience look like?
All the information Chiara needs to make a good decision is readily available on the website of her favourite dealer. She can find out about the features of EVs, charging points and charging costs. She can even check the specifications of the grid connection at her address. With just a single click she can find out which charging point would be suitable for her home.
• Develop an open data architecture, coordinated between players in the mobility and power sector, by making use of existing and new interoperable communication protocols for each part of the e-mobility value chain, whilst always being mindful of data privacy.
Enabler 2: Open data access
Finally, EV data is of great importance for system operators. To enable smooth, value-added EV services without burdening EV drivers with the task of coordinating intermediaries, system operators need access to a set of data for operating their grid and organising third-party data access through which service providers can deliver services to EV drivers. With this data, system operators will also have a better overview of their grid, enabling them to improve system operation.
After a test drive, Chiara decides to buy the EV and to take out a separate supplier contract to charge her EV with green power at home. The dealer takes care of the partial supplier switch and facilitates the installation of her charging point at home, since he has the necessary information on the home grid connection and the relevant technical expertise for the installation. This big decision was all neatly managed and handled with just a few clicks of the mouse!
For system operators that would be all EV data to optimise the operation of the system (including GPS location, available energy for flexible use, battery capacity, charging power and detailed metering data such as active power).
Chiara is a working mother living in a medium sized house in a suburban area and looking for a new family car. She is ecologically and economically conscious and is therefore considering an electric vehicle.
Lean end-to-end data flows starting from the consumers Why does this matter?
ARCHITECTUREDATA
SERVICESENERGY
COMMUNICATIONPROTOCOLS
• Evolve national legislation to make EV data (up to the access point) available to system operators in line with what they need to carry out their mission.

• Develop a dynamic access register relying on international hardware identification between the car and the charging point and communicate it to the service provider. This will enable a faster and more secure authentication of the car to provide services for the grid or other systems (see use case page 29).
• Continue to work on easy, user-friendly access to balancing services and various electricity markets by 2024 via appropriate regulations (e.g. extend the ability to participate in the balancing services market to low voltage levels and assess the appropriateness of qualification processes and access rules for the provision of balancing services from the lower voltage levels) and suitable technical abilities (e.g. battery warranties and product liability).
• Establish coordination rules between different market parties in order to allow value stacking options by 2024 (e.g. business case combining value from wholesale markets, balancing markets, congestion management and digital services).
The current market rules must evolve to allow consumers – individually or via an intermediate service provider – to monetise the flexibility of their EVs, market players to develop new business models around any type of flexible device, and system operators to source more flexibility to keep the system running at an affordable cost. From a system perspective, the most common way to exploit EV flexibility today is to deliver balancing services which will only be possible thanks to processes capable of handling an increased number of assets. However, the combination of different value streams, stemming from access to various electricity markets and digital services, will allow faster positive business cases for service providers.
• Increase the transparency of electricity bills, so the benefits of smart charging are more visible to consumers, leading to their increased active participation.
What is necessary for success?
3938 e-mobility2• Making it happen
• Educate the general public about the benefits of smart charging, not only for EV drivers but also for the power system. This vision paper serves as a starting point to bring greater clarity on both sides of the smart charging story.
Enabler 3: Market rules enabling new consumer services
What might a fruitful EV driver experience look like?
• Explore the value of dynamic grid tariffs and/ or dynamic charging conditions related to grid constraints to allow consumers to define their charging behaviour and system operators to optimise their grid in a socioeconomic way. As a first step, these concepts need to be further developed by all the stakeholders, in order to avoid any market distortion. Such an approach will help to quickly overcome the short-term need for remote control capabilities of system operators, as set out in the German Electricity and Gas Supply Act.
Steering the charging behaviour of EV drivers via smart charging must be implemented in such a way that it contributes to the entire system: matching RES supply and demand, as well as avoiding local congestion. To do this, a combination of dynamic grid tariffs and electricity market prices will send the right price signal to consumers to optimise their charging behaviour. In the meantime, short-term solutions such as giving the system operator control over charging to ensure grid security could be put in place to kick-start the deployment of charging infrastructure in congested areas.
Why does this matter?
Smart mechanisms to optimise charging behaviour Why does this matter?
What is necessary for success?
Marleen is an HR manager, proud mother and wife living in a house in the suburbs. Marleen bought her EV several years ago for ecological and economic reasons, and also because she likes the idea of being a pioneer with this new Shetechnology.likesinnovative solutions and, consequently, has invested over the years in a heat pump and solar panels for her home.
Using her smart meter, smart charging point and smart charging app, Marleen always knows about the best charging prices, which allows her to charge when energy tariffs are cheaper. She can even change the charging timetable according to the next day’s solar production forecast in order to make maximal use of her own cheap green electricity.
Additional value creation from EVs
• Enable the possibility to have multiple suppliers at a given charging point by establishing the right market design, together with regulators. This will increase competition, broaden the choice of suppliers available to the EV driver and open up the possibility of designing contracts that combine several supply needs (e.g. smart home, EVs, etc.).
Marleen has also made her charging point accessible to other EV drivers, so they can use her infrastructure if needed. It is nice to help fellow EV drivers and she can earn a bit of money back from her investment. Under her leasing contract, she is always paid correctly and in real time. So, with her app she can easily optimise all electricity consumption in her home and therefore reduce her electricity bill, and she always has access to real-time information on the savings and earnings she is making. Her husband sometimes jokes about the fact that she could also turn on the automatic optimisation algorithm, but she enjoys playing around with her assets herself.

The deep dive chapter will give you detailed information about our study results on the impact of EVs on the Belgian and German power system by 2030, the need for a new energy value chain, and the different value streams stemming from an EV and linked to the power system.
4140 e-mobility3• Deep dive 3• Deep dive
Waste SourcesIndustrialmanagement9%processes10%Agriculture25%Transport53%FuelcombustionofEUgreenhouse-gas emissions in 2018 Expected share of EVs in total car fleet in Europe by 2040 1001208060 40 200 50%60%70%80%90%100% 40% 0%10%20%30% Million 2015 2020 2025 2030 2035 2040 Battery electric Plug-in hybrid EV% of fleet 35.0% 9.5% 3.1% Expected annual passenger EV sales in Europe 101286 4 Million02 2015 2020 2025 2030 2035 2040 Europe Expected EV and ICE share of long-term passenger vehicle sales in Europe 1008060 40 200% 2015 2020 2025 2030 2035 2040 Electric Internal combustion Source: BloombergNEF – Long-Term Electric Vehicle Outlook 2020 Source: BloombergNEF – Long-Term Electric Vehicle Outlook 2020 Source: BloombergNEF – Long-Term Electric Vehicle Outlook 2020
In Germany, the new Innovation Premium as part of the Corona economic stimulus package is doubling the state’s share in the purchase of an EV via increased subsidies and thus creating a clear incentives for consumers to buy an EV.
Accelerating the shift to a decarbonised society
4342 e-mobility3• Deep dive
All other projections confirm the same trend. EVs will soon leave behind their current niche status and become the main market. European and national support mechanisms and policies are driving the availability and sales of EV models. For example, the new Belgian government recently announced its ambition that all new company cars should be zero-emission vehicles by 2026.
In recent years, the shift towards electric vehicles has become increasingly visible in the statistics. Even in a post-pandemic future, the long-term outlook for EVs remains bright, as fundamental cost and technology improvements outweigh the short-term impacts of the pandemic. Many countries are even including measures to boost e-mobility in their recovery plans.
Niche EV market to become mass market in next decade
The EU aims to be climate-neutral by 2050 – an economy with net-zero greenhouse gas emissions. This ambition is once again accelerating the need to decarbonise all parts of society and all sectors of the economy. At the same time, new technologies are emerging rapidly, leading to sweeping changes and creating opportunities for cross-sector collaboration.
Source: 3%
Additionally, climate-conscious consumers want their suppliers to take action and to contribute towards achieving climate targets. As a result, EV adoption in segments such as buses, two-wheelers, ride-hailing services and delivery vans is growing quickly.
BNEF
The arrival of COVID-19 did not cause the ambitions set out in the European Green Deal to suddenly disappear. On the contrary, the COVID-19 measures have shown that a change in behaviour can have an immediate impact. The temporary elimination of fossil fuel-based transport has had a positive impact on CO2 emissions, which means we need to maintain and even accelerate our efforts to combat the climate momentum that has built up over the years. The decarbonisation of the power sector is one of the important means of achieving these climate objectives. But the ultimate goal of reaching a carbon-neutral society will only be successful in collaboration with other sectors. The transport sector currently accounts for nearly a quarter of Europe’s greenhouse gas emissions. Additionally, it is one of the main sectors in Europe in which emissions have increased in recent decades. With European transport needs expected to grow by 2050, there is an urgent need to tackle this issue.
Uber recently announced that 50% of its rides will be provided in emission-free vehicles across seven European capitals by 2025 and aims to become a zero-emission platform by 2040. Furthermore, many companies have set EV targets to communicate their fleet electrification goals. More than 80 companies have joined the EV100 initiative, collectively promising to electrify 2.4 million vehicles over the next decade. The momentum is clearly here.
International research organisation BloombergNEF estimates that by 2030 more than 28 million cars in Europe will be EVs, accounting for almost 10% of the total car fleet. By 2040, the number of EVs will increase exponentially to 110 million, accounting for 35% of the total fleet. When we look at the sales figures for new cars, the switch to e-mobility is even clearer. It is expected that 35% of new car sales will be electric by 2030 in Europe and may even exceed 60% by 2040. With over 10 million units sold per year, this would make Europe the world’s second largest EV market after China.
The intrinsic flexibility of the batteries of EVs can contribute to those needs. Not only can this flexibility be used to charge the car when the electricity price is lowest (or at times with high infeed from renewable energy), it can also be used to deliver electricity to the grid when prices are high (or when there is little renewable energy available). In this way, EV drivers can benefit from their environmental and grid friendly behaviour.
Figure 4 : Mapping a typical day in the life of an EV owner on the average annual charging curve. This curve shows the average uncoordinated EV load of every hour throughout the year (2030) 400 6000700020005000
Figure 3 :
The simulations performed in our study give a detailed view of the impact of EVs on the power system, their ability to provide flexibility and the resulting benefits for EV owners and the power system. The focus is on the impact of both uncoordinated charging and smart charging.
4544 e-mobility3• Deep dive Mass EV market, a vital element in balancing a renewable power system
Uncoordinated charging: EV charging adds to evening consumption peak First, let us look at how uncoordinated charging works. A typical workday in the life of an EV driver is shown in Figure 3. The EV driver gets up in the morning and leaves for work at around 8am. He commutes one hour to work and plugs in his EV upon arrival at the office. Nevertheless, the amount of charging points available for employees is limited (in the Base 1 and 2 scenarios, we assumed that 1 out of 4 EVs can actually connect for charging at work). In the late afternoon, the EV driver leaves the office and quickly goes to the supermarket where there is (limited) charging infrastructure for customers (in this study we assume that 20% of EVs have access to public and semi-public charging infrastructure). After finishing his shopping, the EV driver returns home and plugs his car in, immediately charging it with all the electricity needed to replenish the EV battery. Figure 3 shows an example of the behaviour of one specific EV driver. In this study, we used historic mobility data – representing the behaviour of several thousand drivers –gathered by the Belgian (2016) and the German (2017) governments in cooperation with respectively the Vias Institute and BMVI–to estimate the EV charging load in both countries. In the uncoordinated charging scenario, most EV charging takes place during the evening. This means that peak EV charging adds to the traditional evening peak in electricity consumption, when people arrive home and start using their electric appliances. The resulting electricity peak generally requires the start-up of more expensive peak power plants, which in turn results in higher electricity prices for these times. On top of that, a higher level of CO2 intensity is to be expected (since more thermal peak plants come online) at those times. Our simulations show that, on average, around 1.2 GW for Belgium and 6.5 GW for Germany of additional electricity demand from EV charging would be added between 6 and 8pm. This can be seen in Figure 4, which shows the simulated average annual charging curves for EVs in Belgium and Germany for 2030. AM9 4:30 PM PM5 PM6 PM7 Example of a typical workday in the life of an EV owner Driving to destinationa
toPossibilityplugin
4000 3000200010000[MW]demandelectricityEV[MW]demandelectricityEV Hour of the day Hour of the day 0h00 1h00 2h00 3h00 4h00 5h00 6h00 7h00 8h00 9h00 10h00 11h00 12h00 13h00 14h00 15h00 16h00 17h00 18h00 19h00 20h00 21h00 22h00 23h00 0h00 1h00 2h00 3h00 4h00 5h00 6h00 7h00 8h00 9h00 10h00 11h00 12h00 13h00 14h00 15h00 16h00 17h00 18h00 19h00 20h00 21h00 22h00 23h00 Average load uncoordinated 1.2 GW & 6.5 GW ADDITIONAL ELECTRICITY DEMAND FROM UNCOORDINATED EV CHARGING IN BELGIUM AND RESPECTIVELYGERMANY,
Supply and demand for electricity need to be in balance at any point in time to ensure a secure and stable power system. In a system with rapidly growing shares of intermittent renewable generation, such as wind and solar energy, this means that electricity consumption needs to adapt to the actual available generation. Moreover, system operators increasingly need flexible loads and devices to cope with residual instantaneous imbalances between generation and demand (e.g. due to renewable forecast errors and outages).
AM8
10001200800600
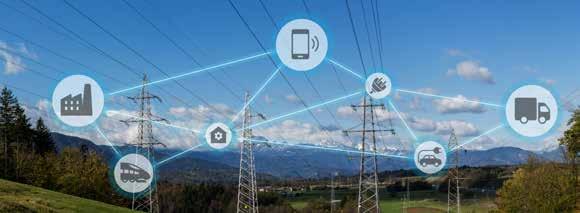
Uncoordinateddive charging: differences between Belgium and Germany
Let’s now take a look on how smart charging works. We assume the same typical transportation behaviour of an EV driver as mentioned before (Figure 3). The EV driver leaves home at around 8am, goes to work and finally does some grocery shopping before returning home at 7pm. However, instead of charging immediately upon arrival at home, at work or at the shops, the smart charging algorithm estimates the most optimal time (lowest electricity cost) to charge the EV battery while taking full account of the driver’s mobility requirements. As a result, the start of the charging session might be delayed until there is a lot of solar generation around noon. And instead of charging during the expensive and generally more CO2-intensive evening hours, the algorithm will typically delay charging until later in the night, with the advantage that it takes place during times of low electricity demand, low electricity prices and preferably high RES (wind) infeed (as shown in Figure 1.A and 1.B.).
on the annual average EV load curve for V1G (orange). The charging curve for V2G (grey) is also shown (2030) 1400 10001200800600 400 -2002000 -400 8000700060005000 4000 -2000-10003000200010000 [MW]demandelectricityEV [€/MWh] [MW]demandelectricityEV [€/MWh] Hour of the day Hour of the day Average load uncoordinated Average load smart V1G Average load smart V2G Average electricity price 0h00 1h00 2h00 3h00 4h00 5h00 6h00 7h00 8h00 9h00 10h00 11h00 12h00 13h00 14h00 15h00 16h00 17h00 18h00 19h00 20h00 21h00 22h00 23h00 0h00 1h00 2h00 3h00 4h00 5h00 6h00 7h00 8h00 9h00 10h00 11h00 12h00 13h00 14h00 15h00 16h00 17h00 18h00 19h00 20h00 21h00 22h00 23h00
Figure 5 clearly demonstrates that electric vehicles – and the way they are charged – has a significant impact on the power system in the upcoming decade and beyond. With smart charging, on average 1 to 1.2GW and 4 to 6GW of electricity demand is shifted to more optimal periods in Belgium and Germany respectively. However, the volumes of shifted energy can in some cases be more than double that amount in both countries. This shift has on average a positive effect on residual load (the demand that needs to be covered by other sources than wind and solar). This shows the importance of smart charging, which enables a much more efficient power system in which EV charging tends to follow RES generation. Moreover, in the V2G scenario, EVs even help the system by feeding in electricity during the evening peak. Mapping the change behaviour
Smart charging: EV charging shifts to afternoon and night
When comparing the uncoordinated charging scenarios for Belgium and Germany, there is a noticeable difference in the shape of the curve. For Belgium, there is a distinct peak at around 8am when a large number of vehicles arrive at work. The same is true in the evening between 6pm and 7pm, when these cars return home. For Germany on the other hand, the overall shape is more linear between 5am and 7pm. This difference comes from the EV driver behaviour. For Belgium, historic mobility data shows a higher share of workers that commute by car. The arrival times of these vehicles typically have a higher degree of coincidence in the morning and the evening. This is less the case in Germany, where the destinations are more diverse. This reduces the level of coincidence during specific timeframes and spreads the load more equally since these trips are more random.
4746 e-mobility3• Deep
In a decarbonised world with high numbers of EVs and heat pumps, a smooth charging experience requires smart algorithms that steer charging to times with high RES generation and in a way that the (local) grid is not overloaded – all while making sure that consumers’ mobility requirements are fully met.
in charging
€50,00€60,00€70,00€80,00 €40,00 €50,00€60,00€70,00€80,00€0€10,00€20,00€30,00 €40,00 €0€10,00€20,00€30,00 Figure 5
Figure 5 shows the simulated impact of smart charging (both V1G and V2G) on the annual average EV load curves for 2030. In our simulations, we assumed that all EVs will either perform uncoordinated, unidirectional (V1G) or bidirectional (V2G) smart charging.

3. Increased opportunities to provide flexibility to balance the system EVs can help balance the system (or reduce congestion), either by reducing their load (by pausing to charge or –in the case of V2G- injecting electricity into the grid) or increasing their load (by starting to charge). With uncoordinated charging, there are only two different states when connected to a charger: either the vehicle is charging, or it is fully charged. Should the EV driver wish to offer this flexibility to the system operator for balancing purposes, he can only do so when the EV battery is charging. It is important to note that offering such services to the system operator can be considered as a first step towards “smart” charging. With smart charging (V1G) a third state is introduced: the EV can be connected when its battery level is below 100%, while not (yet) charging. In this state, an EV can also offer the system flexibility by starting to charge when there is a need for more electricity
In addition to the benefits for the individual EV driver, smart charging also results in overall system improvements compared to uncoordinated charging.
1. Integration of renewable energy
V1G - Base 1 V1G - Base 1 V2G - Base 1 V2G - Base 1 200180160 140 1001208060 40 200 4000 6000003000350025002000150010005000500000 400000 3000002000001000000 180160 140 1001208060 40 200 [€]costcomponentEnergy [MW]productionRES[MW]productionRES [€]costcomponentEnergy chargingUncoordinatedchargingUncoordinatedcostcost V1G-Base 1 V1G-Base€35.00 1 V2G-Base€30.00 1 €50.00 + 30% + 37% V2G-Base 1 €55.00 Remaining energy component cost Cost reduction for the consumer Average RES production during charging (uncoordinated) Average RES production during charging (smart charging - V1G) € 470-520 m EXTRA ANNUAL WELFARE CREATED IN THE EUROPEAN POWER SYSTEM IN 2030
Figure 7 : Average RES production during EV charging - BE and DE (2030) into the grid (optimisation on the basis of day-ahead electricity prices). These savings might further increase after 2030, as rising levels of renewable energy will increase the arbitrage opportunities between low price hours with abundant renewable generation and high price hours with little renewable infeed.
Smart charging: benefits for the system
There is also a positive impact on total CO2 emissions due to a lower level of RES output reduction (in case of insufficient electricity demand) and lower use of CO2-emitting peak units. In total, the simulated annual reduction for 2030 is equal to 600,000 tonnes of CO2 in the European power system, or expressed another way, the annual CO2 emissions from around 300,000 ICE vehicles.
The majority of CO2 emission reductions in electrified mobility is due simply to the shift from ICE vehicles to EVs. This reduction is originating from the difference in fuel needed to drive the car. However, further optimisation is possible. By smart charging EVs, the electricity demand of electric vehicles follows the generation of renewable energy, resulting in a lower level of CO2 per vehicle (5%-10%). There are two reasons for this. First, smart charging will reduce the times when RES generation must reduce its output due to insufficient electricity demand (and hence would be lost).
More and better integration of renewable energy is possible, as the intelligent charging algorithm will follow the variable nature of generation, as shown in Figure 7. For Belgium, there is an average increase of 30% of RES infeed during EV charging and for Germany almost 40%. As such, the renewable energy infeed is optimally used in the system. Smart charging therefore reduces the maximum instantaneous amount of system load that needs to be supplied via non-renewable generation (see “Did you know this already about smart charging?”). This is of vital importance in the transition towards a fully decarbonised power system, and explains why, during smart charging, the maximum of the total system load (on average) shifts towards noon when there is more solar energy available in the system (see Figure 5). This is also reflected by the average CO2 intensity of the electricity when EVs are charging (which is 30%-40% lower when smart charging in comparison with the uncoordinated scenario).
2. Reduction of operational costs of the system Smart charging also reduces the operating costs of the entire power system. By shifting charging times, electric vehicles do not add load (on average) during the evening peak. As such, smart charging prevents situations where expensive peak units have to start up. Optimising the charging behaviour for Belgian and German EVs to times with plenty of renewable infeed and low prices leads to €470 - 520m extra annual welfare created in the European power system in 2030, meaning a reduction in operational costs for the power system. The cost of implementing smart charging on the system and consumer sides are not taken into account.
Forconsumption.EVdrivers, smart charging means more opportunities to provide flexibility to the system operator and, hence, more opportunities to generate value. In a V2G scenario, the number of opportunities is further increased by the option of injecting electricity back into the grid.
1. Electricity cost savings for EV driver EV drivers can lower their electricity cost by shifting their charging to times with lower electricity prices. Under the uncoordinated charging scenario, the average annual electricity cost (energy only) to charge an EV is around €150-€200. Figure 6 shows the simulated savings under smart charging for Belgium and Germany in 2030 (V1G and V2G scenarios). The overall reductions are similar for both countries: €30-€35 (or 15% on the overall electricity cost) per EV per year for a V1G charging scenario and €50-€55 (25%) per EV per year when also injecting electricity
3• Deep dive 11. Smart charging in this study only focuses on electricity price optimisation.
Figure 6 : Impact of smart charging on the energy component of the EV drivers’ electricity bill in both the V1G and V2G scenario for a BEV in Belgium and Germany (2030)
2. Additional CO2 reduction
4948 e-mobility
3. Lower CO2 emissions
Second, the charging of EVs will require less thermal peak plants to start up as there will be less charging during times with low RES generation. Of course, EV drivers can also opt to charge their EV on green energy only, by which they support additional RES integration in the system.
Smart charging: benefits for the EV driver Smart charging11 of EVs unlocks multiple benefits for the EV driver; savings on the electricity bill, positive environmental impact by lowering CO2 emissions of electricity for charging the EV and increased opportunities to participate in services for keeping the balance between generation and consumption in the electricity grid.

Figure 8 shows the impact of smart charging EVs on the total residual electricity load, i.e. total load minus the national renewable infeed of solar and wind, in Belgium and Germany. This is the load that needs to be supplied by sources other than wind and solar (including thermal generation, biomass, etc.).
Figure 9 shows the simulation results for one specific week in 2030 (week 20, mid-May) for Belgium and Germany. The red line shows the trend in the accumulated charging capacity of all vehicles connected to the grid throughout the week (regardless of the state of charge of the EV battery). Here, the assumption is that, where a charger is available, EVs will connect when they are stationary with a battery level below 90%. The total connected capacity is higher during the night, since most vehicles will be connected at home at that time. However, as shown by the dotted yellow curve, the price of electricity is lower during daytime for this week. This results in a smart charging behaviour where electric vehicles try, within the limits of charging capacity, to charge as much electricity as possible during daytime (orange curve). A significant share of charging takes place during the weekend (mostly on Sunday), following the electricity price drop that day. This contrasts with uncoordinated charging behaviour, where charging times mostly overlap with the evening peak and thus higher electricity prices. The impact of electric vehicles on residual load for both Belgium and Germany in 2030 Figure 9 : Trend in EV electricity demand, charging capacity and marginal price throughout week 20 in 2030 5000 40004500 18h00 0h00 6h00 9h00 12h00 18h00 0h00 6h00 9h00 12h00 15h00 18h00 0h00 6h00 9h00 12h00 15h00 18h00 21h00 0h00 3h00 6h00 9h00 12h00 15h00 18h00 21h00 0h00 3h00 6h00 9h00 12h00 15h00 18h00 21h00 0h00
3h00
51e-mobility3• Deep dive50 1000095009000850080007500700065006000 4600041000 3600031000260002100016000110006000[MW]Power[MW]Power Hour of the day Hour of the day Average residual load (annual) Average residual system load smart Average residual system load uncoordinated 0h00 1h00 2h00 3h00 4h00 5h00 6h00 7h00 8h00 9h00 10h00 11h00 12h00 13h00 14h00 15h00 16h00 17h00 18h00 19h00 20h00 21h00 22h00 23h00 0h00 1h00 2h00 3h00 4h00 5h00 6h00 7h00 8h00 9h00 10h00 11h00 12h00 13h00 14h00 15h00 16h00 17h00 18h00 19h00 20h00 21h00 22h00 23h00 - 10%- 10% - 13% + 13% + 14% + 7% + 28% Did you already know this about smart 1.charging?Theimpactof smart charging on the residual load
2. Seasonality in charging pattern Smart charging tends to follow RES infeed in the system. This also explains why the simulated average daily load curves for smart charging in Belgium and Germany show a seasonal pattern in 2030, in line with the seasonality seen in solar and wind generation. The first and final quarter of the year show higher levels of night-time charging during periods with high wind, as there is on average less solar energy available during the day. For quarter two and three on the other hand, charging happens more during the day, when there is a high level of solar generation. This means that less electricity needs to be charged during the night and thus demand decreases between 12am and 6am. Also, in winter more energy is charged, as EVs consume more energy at lower temperatures.
15h00
3h00
300003500030003500250020001500100050002500020000150001000050000 50607080 40 506070800102030 40 0102030 [MW]Power [€/MWh] [MW]Power [€/MWh] Electricity price Total charging capacity Uncoordinated EV load Smart EV load (V1G) 0h00 3h00 6h00 9h00 12h00 15h00 18h00 21h00 0h00 3h00 6h00 9h00 12h00 15h00 18h00 21h00 0h00 3h00 6h00 9h00 12h00 15h00 18h00 21h00 0h00 3h00 6h00 9h00 12h00 15h00 18h00 21h00 0h00 3h00 6h00 9h00 12h00 15h00 18h00 21h00 0h00 3h00 6h00 9h00 12h00 15h00 18h00 21h00 0h00 3h00 6h00 9h00 12h00 15h00 18h00 21h00 0h00 0h00 3h00 6h00 9h00 12h00 15h00 18h00 21h00 0h00 3h00 6h00 9h00 12h00 15h00
Charging behaviour throughout the week
3h00
The lower the peak of this curve, the easier it is to meet demand as the peak volume of load that has to be supplied in case of low wind and solar infeed decreases. Figure 8 compares the residual load for smart charging and uncoordinated charging. The residual load curve for smart charging is flatter and has lower peaks than the uncoordinated residual load. This shows how smart charging can make the power system more efficient.
MondayMonday TuesdayTuesday WednesdayWednesday ThursdayThursday FridayFriday SaturdaySaturday SundaySundayHour (h) Hour (h)
Figure 8 :
21h00
90% WE ASSUME STATIONARY EVS WITH A BATTERY LEVEL BELOW 90% WILL CONNECT TO AN AVAILABLE CHARGER
21h00
21h00
Figure 12 : The effect of infrastructure on average annual EV load curve for smart charging (V1G) in 2030
In addition to the nature of charging (uncoordinated versus smart), the availability and type of charging infrastructure plays an important role on the impact of EV charging on the power system. We have simulated three different infrastructure scenarios, in which we looked at the impact of different charging speeds at home and the availability of charging infrastructure at work. Figure 10 provides the main characteristics of the scenarios. More details on these scenarios can be found in Appendix 3 Calculation methods and assumptions. The simulations for 2030 show that more charging infrastructure at the workplace – e.g. allowing 50% (instead of 25%) of EVs to charge at work - will impact the EV charging curves. The impact of work charging infrastructure is different for uncoordinated and smart charging. For the uncoordinated charging scenario, more work charging infrastructure lowers (on average) in EV charging load during the evening peak in Belgium and Germany (6-8%) and causes a small additional EV charging peak in the morning. For the smart charging scenario, we see that increased charging infrastructure at work yields more opportunities for EVs to store solar generation around noon.
3h00 4h00
scenarioUncoordinatedcharging V1G V2G
7h00 8h00 9h00 10h00 11h00 12h00 13h00
53e-mobility
21h00
1400 10001200800600 400 80002000700060005000 4000 3000200010000 [MW]demandelectricityEV [MW]demandelectricityEV [MW]demandelectricityEV [MW]demandelectricityEV Hour of the day Hour of the day Base 1 average load uncoordinated Base 2 average load uncoordinated Work average load uncoordinated 0h00 1h00 2h00 3h00 4h00 5h00 6h00 7h00 8h00 9h00 10h00 11h00 12h00 13h00 14h00 15h00 16h00 17h00 18h00 19h00 20h00 21h00 22h00 23h00 0h00 1h00 2h00 3h00 4h00 5h00 6h00 7h00 8h00 9h00 10h00 11h00 12h00 13h00 14h00 15h00 16h00 17h00 18h00 19h00 20h00 21h00 22h00 23h00 Figure 10: Charging infrastructure scenarios 10001200800600 400 6000700020005000 4000 3000200010000 Hour of the day Hour of the day Average load smart base 1 Average load smart base 2 Average load smart work 0h00 1h00 2h00 3h00 4h00 5h00
Base 1
7h00
Figure 11 The effect of infrastructure on average annual EV load curve for uncoordinated charging in 2030 6h00 14h00 18h00 20h00 22h00 1h00 2h00 5h00 6h00 8h00 9h00 10h00 11h00 12h00 13h00 14h00 15h00 16h00 17h00 18h00 19h00 20h00 21h00 22h00 23h00
52 3• Deep dive
15h00 16h00 17h00
19h00
Impact of type of charging infrastructure
23h00 0h00
Figure 11 shows the simulated average EV loading curves for the uncoordinated charging scenario for three different types of infrastructure. The difference in average annual load curves for the Base 1 and Base 2 scenarios is rather limited. At first glance, you would expect a much higher electricity demand in the evening when the charging speed at many homes is more than doubled. However, there are two competing effects at play. Whilst the charging speed is indeed higher (adding to the charging power), a lower number of EVs are charging at the same time since the batteries will be charged faster (lowering charging power), hence limiting the overall impact. The Work scenario does differ more extensively. There is an additional (smaller) peak in the morning when EV drivers arrive at work and plug in their vehicle in. This results in a lower electricity requirement in the evening, effectively reducing the evening Inpeak.the smart charging scenario, we observe a similar behaviour (Figure 12). There is no major difference between the Base 1 and Base 2 scenarios, but there is a higher peak at noon for the Work scenario because of the higher availability of charging infrastructure at work. This means that even more solar energy can be absorbed in the EV batteries.
Base 2 scenario Work scenariocharging Main charging speed at home is at 3.7 kW Main charging speed at home is at 11 kW 50% (instead of 25%) of cars arriving at work can charge
The adoption of flexible electrical devices, such as electric vehicles and heat pumps, combined with digital interfaces and connectivity, and the rising capabilities of artificial intelligence can enable the consumer to actively contribute to a sustainable and green energy transition.
On the path towards decarbonising society, the power system’s focus is switching from centralised conventional generation to a more renewable, more decentralised and less controllable power mix. To deal with this, a paradigm shift is required. Going forward it will be necessary to adapt consumption to available generation, rather than adapting the generation to the consumption, as it is currently the case.
Electricity consumers expect a new reality Elia Group believes society is on the verge of a new era with the emergent breakthrough of energy-as-a-service. Today, consumers are used to interacting with mobile applications that instantly and easily meet their needs. With one click on the app, they are able to get direct access to a wide variety of products and services: ordering a taxi, scanning a QR code to pay, planning and booking the next holiday, etc. Consumers appreciate and are looking for high-quality, effortless and very often customised user Thisexperiences.customer-oriented approach does not yet exist in the current electricity value chain. Multiple hurdles can be identified: complexity and non-transparency in the offering and billing, limited means for aligning consumption with renewable generation and/or electricity prices, etc. Energy services aligning the needs of consumers, market parties, and a decarbonised power system
Moving from commodity to energy services
Other companies, on the other hand, are well placed to offer services to these consumer-oriented companies due to their energy, IT or banking expertise (business applications layer).
Energy services will be provided by a wide range of players including energy suppliers, commercial building operators, e-mobility managers, energy community managers, new suppliers and even municipalities. While these players are the direct interface for consumers to get what they need, a series of complex interactions for creating these services will be hidden from consumers. The services will be built on businessto-business interactions among commercial players and some of these interactions will also need to be facilitated by system operators. This is quite critical when it comes to satisfying consumers’ needs while simultaneously optimising the efficient use of the system. These complex interactions among many players can be represented as a set of different interaction layers: Various companies are well placed to include energy in their offerings (energy services layer) because they have a strong consumer connection. A leasing company could easily provide an ‘all-inclusive’ leasing contract for an EV, including the investment, maintenance and electricity consumed by the vehicle.
• guarantee that the power system’s needs are fulfilled at all times by gathering relevant data from the renewable energy and grid assets, processing it and making the necessary information available to the market.
The system applications layer will generate and provide the necessary information and services to:
• enable a level playing field among market players by developing digital tools alleviating the complexity of creating new services and facilitating the interaction among market players.
In order to directly meet the needs of consumers and commercial players in developing their services, while ensuring the overall functioning of the power system, integration with the power system (system applications layer) is also necessary.
Enabling the emergence of a consumer-centric energy value chain
• ensure that all consumers have access to the value created by energy services. The layers translate the increasing complexity of fulfilling system needs, while combining multiple consumers’ needs with multiple interactions between market players. They form a new energy value chain to enable services for all types of consumers.
The energy value chain is currently organised in such a way that it does not have the necessary digital and technical requirements to meet the needs of both consumers and the power system, as described above. Therefore, energy services can be created, such as simple mobile applications promoting awareness about electricity consumption or the CO2 footprint, complex home energy management system applications for optimising the consumption of green energy or for optimising the charging of an EV in an environmentally and networkfriendly manner. All these services are ultimately about collecting the necessary data (with the consent of the consumer), processing it and ultimately using it to provide custom services.
experienceUser Energy services (B2C) Business applications (B2B) System applications Physical infrastructure
A paradigm shift is taking place
Implementing the paradigm shift towards demand following generation means that consumers will require access to the electricity market so they can monetise the flexibility provided by their EVs, heat pumps, etc., and in doing so benefit from the abundant RES energy in the system. Incentivising consumers to contribute to system management will in turn help to keep the system secure and affordable. Digital technologies will help to bridge the gap between the important role played by consumers in a decarbonised world and their natural lack of interest in the intricacies of the power system. This means automation is a prerequisite for putting the consumer at the centre of the power system.
Implementing the transition is one thing, but we will always have to take into account the inherent physics of the power system as well: electricity cannot be stored over long periods of time and the electricity network can only handle power flows within its limits.
5554 e-mobility3• Deep dive

Elia Group is convinced that removing these barriers is only the first step towards fully exploiting the value of EVs. In the future, EVs will no longer only be a means of getting around, but a crucial part of consumers’ daily lives. Seamlessly integrated with other assets, they will become a gateway for consumers to gain easy access to a vast array of new power and mobility services. EVs will not become the first and only consumer choice for a car until this additional value is unlocked.
5756 e-mobility3• Deep dive
EV flexibility already generates additional value when they are charging Today, EV flexibility business cases typically rely on the delivery of so-called balancing services, which are contracted and organised by system operators to constantly maintain the balance between supply and demand in the power system. For now, fleets of EVs are mainly used to provide frequency containment reserves (FCR) and automatic frequency restoration reserves (aFRR). The size of the EV pool is important in order to effectively deliver the minimum amount of flexibility required to participate in these Anothermarkets. important value stream is the optimisation of EVs on the wholesale markets. Savings can be made when directing EV (dis)charging to times where market prices for electricity are low (high). Typically, one can optimise charging at prices on the European day-ahead electricity market. However, as conditions change throughout the day, the price of electricity can also vary throughout the day. For example, lower (higher) than expected wind or solar infeed could drive prices up (down) closer to realtime. Hence, the charging session can even be continuously re-optimised during the day to benefit from lower prices on the markets closer to real-time (including the intraday markets).
A system perspective on additional value streams from EVs
The final value stream is the optimisation of charging in such a way that it minimises distribution grid tariffs. A typical example can be seen in day/night grid tariffs that incentivise consumption during the night. However, one can expect that day/night grid tariffs will disappear over time, as they were introduced to incentivise consumption at night in order to absorb baseload (nuclear) generation. Hence, this type of tariff structure does not represent the future situation in which there will be a high level of variable renewable generation. Therefore, distribution grid tariff structures – and the associated optimisation opportunities from EV charging – are expected to change in the future. One example is the transition to distribution grid tariffs that are charged based on (peak) capacity [€/kW] instead of energy [€/ kWh]. Value streams will change over time and will be stacked In the future, the relative shares of the different existing value streams for an EV driver will change. It is expected that the improved opening of balancing service’ products to new technologies at lower voltage levels and integration within the EU electricity market will lead to more competition and therefore a significant decrease in capacity and electricity prices. Due to the further integration of RES, price volatility on wholesale markets (day-ahead and intraday markets) are expected to increase, leading to more attractive opportunities for value creation in these market segments. Finally, auto-consumption and the optimisation of the charging pattern of an EV might lead to substantial savings once a dynamic DSO capacity tariff is Inimplemented.additiontovalue creation based on charging behaviour, additional value streams will be made available to EV drivers due to digitalisation. The increased digitalisation and connectivity of EVs, combined with the progressive implementation of thirdparty access to metering data, as well as the emergence of open data frameworks lays the groundwork for market players to offer their customers additional and custom services.
The journey in which EVs transition from niche to mass market will initially require breaking down the barriers preventing consumers from buying EVs.
In the future, we expect that EVs will benefit simultaneously from several value streams, i.e. value stacking. By doing so, the value for end users is always maximised, enabling them to benefit from all the advantages of EV integration in the power system at all times while keep their comfort and convenience levels high. For service providers, the evolution in algorithms to optimise the use of flexibility or to gain insights and automate behaviours by making use of data will enable them to continuously create offers that are more attractive to their customers.

5958 e-mobility4• Appendix 4• Appendix Glossary 60 Supporting information 61 Calculation methods and assumptions 63 Contents

6160 e-mobility4• Appendix Glossary B2B: Business-to-Business B2C: Business-to-Consumer BE: Belgium BEV: Battery Electric Vehicles DE: Germany DID: Digital Identity DSO: Distribution System Operator EV: Electric Vehicle FCR: Frequency Containment Reserves FRR: Frequency Restoration Reserves aFRR: automatic FRR • mFRR: manual FRR GHG: Greenhouse Gas ICE: Internal Combustion Engine IO.Energy: Internet of Energy, a collaborative innovation initiative launched by Belgian system operators OPCI: Open Charge Point Interface PHEV: Plug-in Hybrid Electric Vehicle RES: Renewable Energy Sources SMGW: Smart Meter Gateway SO: System Operator, an entity operating, maintaining and investing in electricity networks, in compliance with regulations and standards on electricity supply quality and security. T&E: Transport and Environment TSO: Transmission System Operator V1G: Unidirectional charging V2G: Vehicle-to-Grid, bidirectional charging Read more about the electricity market and system Elia Group shares the European ambition to establish an integrated electricity market and encourage different market players to provide system services. System services allow Elia Group to operate the grid securely. Elia Group procures these services via contracts with specific providers and divides the services into five separate categories: Find out more about system services on Findhttp://bit.ly/Elia-SystemServicesoutmoreaboutkeepingthe balance on http://bit.ly/Elia-KeepingTheBalance • Outage Planning Agents provide information on the availability of production units • Scheduling Agents provide information on production schedules and flexibility available for congestion management • Balancing Service Providers offer flexibility for balancing as first, secondary or tertiary control • Voltage Service Providers respond to voltage changes automatically or at the request of Elia • Restoration Service Providers keep production units available to restore the system in case of a blackout.

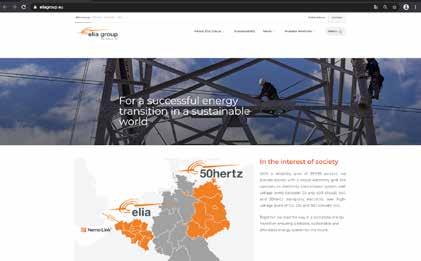
1.1 Introduction
The first step in the creation of this model is analysing and transforming the raw mobility data into concrete vehicle behaviour. The mobility data for Belgium comes from the “Monitor” [mob-dataBE] study performed in 2016 by the VIAS Institute and the German data stems from the “Mobilitaet-inDeutschland” [mob-data-DE] study by BMVI (2018). Both studies give data on the trips and covered distance from a representative set of persons per day, considering all means of transportation. Only data points reflecting trips with vehicles are retained for our simulations, with following characteristics: 1. The starting time of the trip 2. The arrival time of the trip 3 The duration of the trip 4. The distance travelled 5. The starting location 6. The location of the destination 7. Day of the week 8. Total number of trips during the day
1.3.1 Input data
The first element, the transportation model, uses historic transportation data from Belgium and Germany in order to simulate the mobility behaviour in both countries. Section 1.3 will go deeper into detail on the input data, the calculated scenarios with their assumed parameters and finally the modelling methodology itself. The output from this model will be used in both the electricity market model and the smart charging calculator.
The filtered data represents the vehicle mobility behaviour of the entire country’s population. Based on this information, the transportation model generates “mobility samples” of real individual EV behaviour with an hourly resolution. Each sample contains the complete mobility behaviour of an EV throughout the day, such as departure and arrival time of trips, distance covered,… These mobility samples are created for each EV and for every day of the year in order to represent the mobility behaviour of the entire EV fleet in Belgium and in Germany. These samples respect the probability distributions of the historic mobility data (departure and arrival times, distance covered, amount of trips) and the correlations between those distribution functions. This could be achieved by using the technique of copulas, which allows to generate samples reflecting the original input data (marginal probability distributions) while taking into account the correlation between the different inputs. As such, this study follows anapproach similar to the one described in [EV-Trans 1] [EV-Trans 2]. Further information on the implementation and use of copulas can also be found there.
This model is used to simulate the transportation behaviour of the electric vehicles. Historic data on the amount of trips and covered distance by a vehicle in a given period was used as input to construct this model. This only considers passenger cars. Freight transport is not taken into account. These elements –together with the assumptions on available charging infrastructure- are used to determine which cars are connected (or not) to the electricity grid at a certain point in time, along with their charging needs (based on electric fuel consumption). For the uncoordinated charging scenario, these elements are sufficient to calculate the EV demand curve. For smart charging, additional steps are needed as the charging behaviour is optimised in the market model and smart charging calculator.
The main advantage of this approach is that our model reflects today’s behaviour of individual drivers in Belgium and Germany, overcoming the need to make rough assumptions on when people leave for (or arrive from work), how often they go out for shopping,… The drawback of the used approach is that the modal shift (and hence change in transportation behaviour) towards 2030 is not Forconsidered.modelling reasons, each EV is assumed to be located at home in the morning and eventually returns home the same day. In between, the vehicle can perform a certain number of trips (or remain stationary). The trips can have three different destinations: 1. Work: office buildings,… 2. Other: shops, recreation,… 3. TheHomenumber of trips per day can vary from two (going from home to a different location and then back home) to four (going from home to two additional locations to finally return home). These daily travel patterns cover the majority of the mobility behaviour for personal transport.
2. European electricity market model: this model calculates the impact of EV charging on the European power system (electricity prices, changes in CO2-emissions and system total load) by adding the load of EV charging to the already existing demand of electricity. The focus is on EV impact in Belgium and Germany.
1. Transportation model: this model uses historical mobility data of Belgian and German car owners to simulate which EVs are connected to the electricity grid and which of them are on the road and how much fuel they consume during their trips. This model generates two different outputs, on the one hand it calculates the uncoordinated charging load and on the other hand the electric fuel consumption of the cars as a result from the travelled distance.
The purpose of this appendix is to provide more insights in the calculation methods and assumptions used to generate the results presented in the main text. It will start with a general explanation on which models are used in the toolchain. In the following sections, a more detailed explanation on all the inputs, assumptions, scenarios, and modelling methodology will be given for every part of the toolchain. The appendix ends with an explanation on how the different elements of the toolchain are linked and the process flow in order to obtain the results.
1.2 General approach
3. Smart charging calculator: EVs are stationary (and connected to the electricity grid) for most of the time. This tool emulates smart charging as it optimises the charging process within this huge window of opportunity to reduce the electricity costs. This optimisation only considers day-ahead electricity prices. Hence, levies, taxes and grid tariffs (transmission & distribution) are not taken into account.
The second element is the electricity market model. It uses the resulting EV charging demand (in addition to other electricity demand to calculate the impact of the EVs on the electricity system using. Section 1.4 will give an overview of the input data for this model and the scenarios and assumptions.
Calculation methods and assumptions
The third element is the smart charging calculator. This tool minimises the electricity cost for each individual electric vehicle, based on the calculated marginal electricity prices from the electricity market model and output from the transportation model (such as vehicle consumption, charger capacity and battery level). Section 1.5 provides a detailed description on the assumptions, scenarios and integration in the toolchain. This process is iterative, meaning that the newly obtained EV charging load after this optimisation is given back to the market model. The resulting electricity prices are then used again in the smart charging calculator (iterative process until a satisfactory level of convergence is reached).
The simulation model can be decomposed into three main elements:
1.3 modelTransportation
6362 e-mobility4• Appendix
Table 4: Public (commercial) charging parameters
The previous paragraph gave insights in how we calculated a dataset of trips (and covered distance) for a representative amount of vehicles, starting from historic mobility data.
Table 2: Home charging parameters
Fast charging is modelled in a different way. An EV driver will automatically go to a fast charger when its battery level drops below the ‘minimum SOC’ during a trip. In the simulations, it is assumed that a fast charger will always be available (at negligible distance) when needed. The properties of fast chargers are listed in Table 5.
Table 5: Public (fast charging) charging parameters
Driving efficiency [kWh/km] [EV-1][EV-2][EV-3] 0.16 Charging/injection efficiency [EV-2] 90% Battery size BEV [kWh] [EV-1] [EV-4] [EV-5] (Percentage) 40 (25%) 65 (50%) 90 (25%) Battery size PHEV [kWh] [EV-6] 20 Minimal SOC BEV (PHEV) [EV-7] 20% (0%) Percentage BEV – PHEV [EV-1] [EV-10] 70% - 30% Battery level criteria for connecting EV to grid SOC ≥ 90%: EV will not connect SOC < 90%: EV will connect EV charger parameters EVs can charge at three different: at home, at work and at public chargers (commercial and fast chargers). The study assumes that an EV will only connect to an available charger if its battery level is below 90%. The assumption being that, at higher levels, there might not be a perceived need for the EV owner to plug the vehicle in. For home charging, we assume that 80% of people will have access to a charger at or near their home. The assumptions on the capacity (kW) of those chargers are shown in Table 2. In the Base 1 and Work scenarios, 65% of chargers will have a power of 3.7 kW, 30% of chargers a power of 11 kW and 5% of chargers a power of 22 kW. The Base 2 scenario assumes higher capacity for home chargers as 30% of chargers are 3.7 kW and 65% are 11 kW.
EV drivers having access to home charger [%] [EV-8][EV-9][EV-10][EV-11] 80 Home charging rate [kW] [%] [EV-11] (Base 2 scenario [%]) (65)3.7 (30) (30)11 (30) (5)22 (5) The method applied for modelling work charging differs from home charging. When arriving at work, our study assumes a 25% chance that there is a charger available for the EV (Base 1 and Base 2 scenarios). In the Work scenario, this increases to 50% of the EVs. The characteristics for work chargers are described in Table 3
Table 3: Work charging parameters Chance EV can charge at work [%] [EV-10][EV-12] (Work scenario) 25 (50) Home charging rate [kW] [EV-13][EV-14] [%] (70)3.7 (30)11 (0)22
Chance EV can charge at work [%] [EV-2] 20 Public charging rate [EV-2] [%] (55)11 (35)22 (10)50
Table 1: General and vehicle parameters
2. Parameters for EV chargers (home, work, public (commercial and fast charging))
Fast charger station speed [EV-2] [%] (10)50 (90)150 1.3.3 Methodology
Based on the input data and assumptions described before, the transportation model generates two outputs: the EV electricity demand curve (for uncoordinated charging) for 2030 and the parameters needed for the smart charging calculator. The model performs following steps: Step 1: setting up the annual parameters for the EV In this step, the transportation model assigns the mobility samples, calculated as explained in the previous section, (different trip patterns) to each individual EV for an entire year. This includes the distances that need to be travelled, departure and arrival times, destinations… for every day of the year. Next to that, an EV also has parameters that remain unchanged over the course of the year. These variables include the battery size of the vehicle, the availability of a home charger and its charging speed, the charging speed at work… When these characteristics are initiated for each EV, the second step of the transportation model simulation starts. Step 2: simulating the execution of EV travel
1.3.4 Output Running the simulation for an EV for the whole year, with all its charging processes, results in the electricity demand curve that is needed for that specific vehicle in order to execute all its trips for the uncoordinated charging scenario (i.e. assuming that the EV start to charge immediately when connected to the grid). Summing the resulting curves for each sampled vehicle, we obtain the overall EV charging electricity demand for the uncoordinated charging scenario. Next to that, the transportation model defines the input needed to run the smart charging calculator. This consists of the consumption that is necessary to execute the mobility behaviour (travel pattern), the connection status of the vehicles throughout the year, the capacity of the chargers to which the EVs are connected at any point in time and the battery level of the EVs for the uncoordinated charging scenario. Chapter 1.5 explains the functioning of the smart charging calculator.
The next paragraphs give a detailed description of the parameter for each category. The values shown are valid for all scenarios. The differences between Base 1, Base 2 and Work are highlighted in the tables and text. An overview can be found in Figure 10 in the main text. A vehicle can be either charged in an uncoordinated way or in a smart way (V1G-V2G). In all scenarios, every vehicle is assumed to have the same charging pattern. This means that either 100% of the vehicles charge uncoordinated, 100% of the vehicles charge V1G or 100% V2G General and vehicle parameters Table 1 shows the values for the general and EV parameters. The driving efficiency is the energy that is required on average per kilometre. The average annual value is 0.16 kWh/km. Nevertheless, the model accounts for a temperature effect (such as defined in the 2018 TYNDP process by ENTSO-E) throughout the year as consumption is typically higher than average in winter (heating) and summer (airco) and lower in spring and autumn. The assumed efficiency of the EV charging process is 90%. The same efficiency is assumed for injecting energy from the EV back into the electricity grid (V2G).
1.pattern The possibility to charge at work 2. The possibility to charge in public and the characteristics of this charger 3. The characteristics of the fast charger All the parameters that can change during the year are defined during the simulations themselves when the choice needs to be made. This includes the possibility when arriving at work to be able to charge your vehicle, the characteristics of the public charger, etc. During this step, the transportation model simulates the execution of the predefined travel pattern of the the EVs. The battery level of the EV is reduced when travelling on the basis of the consumption parameter of the EV. During a trip there are two options for a BEV: either the vehicle will have enough energy in their battery and manages to arrive at its destination, or its battery level is insufficient (or differently said, the battery level would fall below the ‘minimum SOC’ of 20% before reaching its destination). In the latter case, the BEV will perform fast charging to bring its battery level back to 100%. As explained previously, a PHEV is assumed not to use fast chargers. When arriving at destination, there are again two options: either a charger is available (home, work, public) and -if the EV battery level is below 90%- the vehicle will start to charge, or there is no charger available. Whilst the availability (or not) of a home charger to an EV is fixed for the entire year, this is not the case for work charging or commercial (public) charging. During the second step, the availability of such infrastructure to the EV is defined case by case, on the basis of the probabilities mentioned before (by random chance). Concretely, this means that an EV can have access to a work charger on one day, but might not have access to it on the next day (e.g. arriving later in the office when all chargers are already in use).
Finally, an EV can also make use of public chargers. It is important to make the distinction between commercial charging and fast charging. Commercial charging is charging at a grocery store, recreation parks, parking lots,… and assumes (lower) charging capacities. Fast charging (high capacities) on the contrary will only occur when the battery level of a BEV falls below its ‘minimum SOC’ (20%). In such case, the EV owner uses fast charging infrastructure to bring the battery level back to 100% in a rapid way. Commercial charging is modelled in the same way as work charging. When arriving at a certain public location, our study assumes a 20% chance that a charger will be available for the EV. The properties of commercial chargers are listed in Table 4.
In order to calculate EV charging demand from those mobility patters, we need to define the characteristics of the EVs (battery size, consumption,…) and charging infrastructure (capacity, availability,…). We defined three sensitivities for charging infrastructure: Base 1, Base 2 and Work. The parameters used in this study for EVs and infrastructure can be split into two categories: 1. General and vehicle parameters
6564 e-mobility4• Appendix 1.3.2 Scenarios & assumptions
There are two types of vehicles taken into account, BEVs and PHEVs (resp. 70% and 30% of the EV fleet). Both vehicles differ in terms of battery size: a BEV has a battery size between 40 kWh and 90 kWh and a PHEV battery is 20 kWh. For BEVs, the study assumes a ‘minimum State of Charge (SOC)’, which is the battery level at which the BEV immediately visits a fast charger to bring its battery level back to 100%. PHEVs don’t have a ‘minimum SOC’ as they will not visit a fast charger when their battery drops below a certain level given their internal combustion engine.
The main outputs on total system level are: absolute CO2 emissions (tonnes CO2), welfare (system or operational cost) and impact on RES integration for the ENTSO-E region. CO2 emissions and system welfare are derived from the dispatch calculated by the market model for the entire ENTSO-E region. Every generation source has an associated CO2 emission per MWh and a marginal cost per MWh, which are multiplied with the produced electricity from that source. The savings in CO2 emissions on system level by the implementation of smart charging for EVs in Belgium and Germany (as opposed to uncoordinated charging) are calculated as the difference of absolute CO2 emissions (in tonnes) for the ENTSO-E region between the market simulations for both cases. Under smart charging, power demand from EVs follows better the production of renewable energy. To demonstrate this, we also show the country specific CO2 intensity of electricity generation when EVs are charging both in Belgium and Germany (average weighted value).
• Perfect foresight is considered for renewable production, consumption and unit availability. This is not the case in reality, where forecasting deviations and unexpected unit outages are happening and need to be covered by the system;
The impact of the EV electricity demand curve on the Belgian and German power system in 2030 is calculated by means of a European electricity market model with an hourly resolution. Assumptions on installed generation capacity, electricity demand and prices for fuel and CO2 stem from the ‘Distributed Generation’ scenario from the scenario report of the Ten Year Network Development Plan (TYNDP) 2018 by ENTSO-E [TYNDP-1]. For Belgium and Germany, the EV demand assumed in the TYNDP scenario is replaced by the EV electricity demand calculated in this study. We assume 10 million EVs in Germany and 1.5 million EVs in Belgium (70% are BEVs and 30% are PHEVs).
1.4 Market model
Hourly load profiles and profiles for wind and solar power infeed are generated on the basis of the climate conditions of 2012. As the study considers only one climate year, it is important to note that absolute results could somehow change for other climate years. Also, no detailed conclusion on the impact of smart charging on adequacy of the power system can be made. However, as this study focuses on relative changes and average trends on the impact of smart charging versus uncoordinated charging, this is not an issue.
The market model generates both country specific and total system outputs for the European power system. Both are used for the purpose of this study.
ANTARES calculates the optimal unit commitment and generation dispatch from an economical perspective, i.e. minimising the generation costs while respecting the technical constraints of each generation unit. The dispatchable generation (including thermal & hydro generation, storage facilities and demand side response) and the resulting cross-border market exchanges constitute the decision variables of an optimisation problem, which essentially aims to minimise the total operational costs of the system.
1 The German grid development is coordinated through a biannual process called “Netzentwicklungsplan” (NEP). Its current version “V2019” targets the trajectory towards 2030. The market simulations in this study are based on ‘Scenario B2030’, which is aligned with the TYNDP 2018. It contains further updates, which have been approved by the German regulator (Bundesnetzagentur, BNetzA) since then.
• Generation units are assumed to bid in at their short term marginal cost;
The grid model is that of the TYNDP 2018 and covers the ENTSO-E region. Some minor modifications were made to the input data for Germany in order to be more in line with the German federal grid development plan (NEP) 20191 [NEP-1]. These modifications centred around the generation capacity, price sensitive load and RES production.
• hourly electricity demand profiles (based on the 2012 climate year);
6766 e-mobility4• Appendix
The main modelling assumptions for the market model are:
• Pumped storage units, batteries and market response are dispatched/activated in order to minimise the total cost of operation of the system. In reality, this could be different as they could be used to net a certain load in a smaller zone or to react to other signals. The modelling approach also assumes that price signals are driving the economic dispatch of those technologies. The batteries of EVs in Belgium and Germany are modelled separately, according to the methodology explained in this appendix. For smart charging, the charging process of those batteries is optimised to minimise the electricity cost (energy only) for the EV driver;
• The efficiency of each thermal unit is considered fixed and independent of the loading of the unit. In reality this efficiency depends on the generated power. The EV charging demand curves for Belgium and Germany are calculated outside the market model, by the transportation model and/or the smart charging calculator
• installed demand flexibility/market response capacity; and interconnection capacity (via fixed bilateral exchange capacities between countries (NTC method)). Figure 13 (Belgium) and 14 (Germany) show the installed generation capacity in 2030 in the market model The main aspects are the phase-out of the nuclear production capacity in Belgium and Germany, an increase in generation of RES in both countries and an advanced state of the coal phase-out in Germany.
1.4.1 Input data
• installed storage facilities (batteries) with their associated efficiency and reservoir constraints;
The main input data for each country are:
The market model assumes that all energy is traded (bought and sold) on the day-ahead market. Arbitrage value between the different market periods (long-term, day-ahead, intraday and real-time) is therefore not considered in this study; An optimal solution is sought in order to minimise the total cost for operating the whole simulated system (covering the ENTSO-E region);
The electricity market simulations in this study are performed with ANTARES, a market simulator developed by RTE [RTE-1].
• installed PV, wind and hydroelectric capacity and associated production profiles based on the 2012 climate year;
649 • Biofuels 29 058 • Gas 160 • Oil 340 • Peaking units 835 • Oil 9 368 • Lignite 1 150 • Hydro-pump 11 600 • Hydro-pump 6 851 • Solar-PV 91 300 • Solar-PV 2 310 • Wind-off-shore 17 000 • Wind-off-shore 658 • Other RES 7 300 • Other RES 3 298 • Wind-on-shore 81 500 • Wind-on-shore 117 • Hydro-run 5 600 • Hydro-run 6 352 • Gas 9 800 • Hard coal 1 157 • Other non-RES 10 321 • Other non-RES Figure 13: installed generation capacity in Belgium in 2030 [MW] Figure 14: installed generation capacity in Germany in 2030 [MW] 1.4.2 Scenarios & assumptions
1.4.4 Output
The main country specific outputs of the market model used in this study are: marginal electricity prices and CO2 intensity of local electricity production (kg CO2/MWh). These outputs are derived from the dispatch determined by the market model to cover the electricity demand.
1.4.3 Methodology
•
•
• installed capacity of thermal generation facilities with their associated availability parameters or hourly production profiles for distributed generation, and with their associated marginal cost;
• A perfect market is assumed (no market power, bidding strategies,...);
The smart charging optimisation is performed for every individual vehicle. Combining all the individual electricity demand curves results in the total EV smart charging curve for Belgium and Germany. This process is iterative, since the EV smart charging demand is calculated on marginal electricity prices from the market model. However, a different smart charging demand curve, also leads to new electricity prices when incorporated in the market model. Hence, different iterations between the market model and smart charging calculator are performed until a satisfactory level of convergence is reached.
1.5.1 Input data
1.5.3 Methodology
• the charging capacity of the charger to which the EV is connected (i.e. the limit to the power at which the vehicle can charge);
This study considers two different variants of smart charging. The first variant (V1G or unidirectional charging) shifts the charging to periods with low electricity prices. The second variant (V2G or bidirectional charging) also allows the EV to inject power back into the electricity system. For both variants, the objective function is to minimise the energy component cost for the EV driver. With V2G, the battery of the EV is also used for arbitrage between periods with low (EV charging) and high electricity prices (EV injecting).
The smart charging calculator is based on a linear optimisation. The objective function is to minimise the energy component cost for charging, based on the hourly price profile resulting from the market model and the individual EV electricity demand.
• the uncoordinated battery level (i.e. the maximum amount of energy that can be in the battery at any given time).
The constraints for the linear optimisation are the following:
The outputs from the transportation model that are used are: the consumption of the EVs for their travel pattern, the individual vehicle battery level from the uncoordinated charging scenario as a reference for the maximum achievable battery level, and the time series of when the EV is connected to the grid along with the capacity of the charger it is connected to. This data, combined with the marginal electricity prices from the market model, allow the smart charging calculator to minimise the cost of the electricity component for the EV while ensuring that the EV driver can perform all of its desired trips.
The individual consumption of the vehicle is the energy that is required to perform its travel pattern (defined on the basis of the historic mobility data). It is calculated in the transportation model by multiplying the distance that the EV travels [km] with the average consumption [kWh/km] (incl. temperature effect).
• the connection status of the vehicle (i.e. vehicle can only charge when connected);
The EV charging demand curve for smart charging is calculated for each EV on the basis of the outputs of the transportation model and a annual price profile (with hourly resolution) stemming from the market model
1.5.4 Output
However, one can expect that –once EV drivers get confidence in the driving range of their EVs and available fast charging infrastructure- the relevance of such a ‘minimum SOC’ at the start of the day will decrease, and optimisation opportunities for smart charging will further increase. Next to the inputs from the transportation model the optimisation tool also uses the marginal electricity prices coming from the day-ahead market model 1.5.2 Scenarios & assumptions
• the battery size (i.e. the limit to the amount of electricity that can be stored);
Two separate calculations were performed for smart charging. In a first case, all EVs perform V1G, whilst in a second case they all perform V2G. Several constraints are imposed on the smart charging optimisation. Most importantly, the optimisation of the charging process with V1G and V2G always respects the mobility needs of the EV drivers. This means that the battery will always be charged in a sufficient way so that the EV driver can make all his foreseen trips. Fast charging is only deemed necessary when –also under uncoordinated charging- it is not possible to charge the battery sufficiently to meet the assumed travel pattern. Also, the smart charging process does not allow that the optimisation of the charging process brings the EV battery below the assumed ‘minimum SOC’ of 20% (see before). Otherwise, the EV driver might face situations where smart charging would completely empty its EV battery, leaving no driving range at all.
The optimisation model uses following outputs of the transportation model and market model 1. individual (electricity) consumption of the EV when travelling 2. connection status of the EV to the grid 3. capacity of charger to which EV is connected 4. fast charging energy for the EV 5. individual vehicle battery level of the uncoordinated charging load 6. marginal electricity prices
• the battery level should be sufficient to accommodate the EV’s travel pattern at all times (i.e. the amount of electricity in the battery combined with the electricity coming from a fast charger needs to be larger than the amount of electricity required for the trips);
6968 e-mobility4• Appendix
The output from this model is an EV load curve that is optimised for the EV driver to have the lowest possible energy component cost (both for the V1G and V2G variant).
The combination of the grid connection status of the EV and the capacity of the charger to which it is connected defines the opportunities that the EV has to charge its battery. Finally, the smart charging calculator optimises the charging process of the EV in such a way that the battery of the EV is above a certain minimum level each morning. This in order to provide the EV driver with the confidence that he is able to perform unexpected trips during the day. For modelling reasons, this minimum level is defined as 80% of the (morning) battery level of the EV under uncoordinated charging. This restricts the optimisation opportunities of the smart charging algorithm.
For the same reason, an additional constraint is implemented regarding the minimum battery level in the morning (6 AM). This needs to be at least 80% of the individual vehicle uncoordinated charging battery level (see before). Finally, the SOC of the battery level cannot exceed 100%.
For uncoordinated charging, the EV charging curve is calculated within the transportation model This model calculates the battery level of the EVs (as a result from travelling) and knows which vehicles are connected to the grid, as well as the capacity of the charger they are connected to. Since, in case of uncoordinated charging, EVs start charging immediately when connected to the grid, this is sufficient to derive the total EV charging demand for Belgium and Germany. This is more complicated for the smart charging scenario as EVs might not start to charge immediately when connected to the grid. Indeed, smart charging defines the optimal periods for charging within the window of opportunity when the EV is connected to the grid to minimise the electricity cost for the individual EV driver. For this, we developed a third model in our toolchain: the smart charging calculator
The simulations assume an efficiency of 90% for the charging and discharging process (i.e. round cycle efficiency of 81%). This means that from the originally charged 100% electricity, only 81% can be injected into the power system in case of V2G. As a result, the EV will only inject energy back into the grid if the price spread for arbitrage makes up for the resulting energy losses.
As previously mentioned, an interaction between the market model and the calculated EV electricity demand curve is required in order to take the impact of the shift of electricity demand into account. This means that when every vehicle has been optimised, the EV electricity demand curve is introduced into the market model and a new simulation is performed. This then results in new marginal electricity prices that serve as an input for a new EV electricity demand optimisation calculation. This process is repeated until a stable solution is achieved.
BEVs reaching the ‘minimum SOC’ level make use of a fast charger to bring their battery level back to 100% in the shortest possible time. The possibilities for the EV to charge (i.e. window of opportunity when EV is connected to the grid) are identical for uncoordinated and smart charging. This means that EVs having to perform fast charging in the uncoordinated scenario, also need to perform it under the smart charging scenario. Therefore, the fast charging profile for EVs under the smart charging scenario is assumed to be identical than for uncoordinated charging.
1.5 Smart charging calculator

In the case of uncoordinated charging, the transportation model transforms the historic mobility data into an uncoordinated EV electricity demand curve. This is done based on the methodology and parameters explained in Section 1.3. The electricity demand curve is afterwards introduced into the market model in order to calculate the impact of the EVs on the power system. The most important indicators that are analysed in the market model are RES integration, CO2 emissions and operational system costs.
This final section summarises the different elements in the toolchain and how they interface with each other (see Figure 15 and Figure 16). The basis of the toolchain is the EV transportation model. This model generates samples of individual EV’s travel patterns on the basis of historic mobility data. The outputs of the model (uncoordinated EV charging demand, electricity consumption of EVs for their trips, their grid connecting status and charger capacity) are used as inputs for the market model and the smart charging calculator. The next paragraphs give an overview of the calculations performed for the uncoordinated and smart charging scenarios. charging
[RTE-1]
vehicles%20in%20Europe%20Gearing%20up%20for%20a%20new%20phase.ashxInsights/Electric%20vehicles%20in%20Europe%20Gearing%20up%20for%20a%20new%20phase/Electric%20https://www.mckinsey.com/~/media/McKinsey/Locations/Europe%20and%20Middle%20East/Netherlands/Our%20 [EV-9] http://www.oecd.org/about/publishing/Corrigendum_GEVO2018.pdf [EV-10] https://www.iea.org/reports/global-ev-outlook-2020 [EV-11] code=FRAhttp://www.synergrid.be/download.cfm?fileId=Synergrid_EV_Grid_Impact_ExternalReport_v3_0.pdf&language_ [EV-12] https://www.nordicenergy.org/wp-content/uploads/2018/05/NordicEVOutlook2018.pdf [EV-13] Charger-Use-Study_FINAL.pdfhttp://www.element-energy.co.uk/wordpress/wp-content/uploads/2019/02/20180921_UKPN-Recharge-the-Future_ [EV-14] https://innovation.luskin.ucla.edu/sites/default/files/Full%20Report.pdf [EV-Trans
Uncoordinated
[EV-Trans
70 4• Appendix 1.6 Overall toolchain
71e-mobility Figure 15: Uncoordinated charging Figure 16: Smart charging
The process for the smart charging calculation entails some additional steps. The basis is again the statistical transportation model but instead of using the uncoordinated EV charging curve, the individual time series are used (see Figure XX). Based on these values and a marginal price curve coming from the market model a first smart charging optimisation is done as explained in Section 1.5. The resulting EV electricity demand is then again introduced into the market model to obtain a new marginal price curve. Based on this marginal price curve, a new linear optimisation is executed. This process is repeated until a stable solution is found. Finally, the market model will generate, on the basis of the stable solution, both country specific and total system outputs for the European power system. This is then compared to the uncoordinated charging results. [EV-1] https://www.bnef.com/insights/20667/view [EV-2] need-2030https://www.transportenvironment.org/publications/recharge-eu-how-many-charge-points-will-eu-countries[EV-3] https://ev-database.org/ [EV-4] https://www.statista.com/outlook/1000000/129/passenger-cars/belgium [EV-5] https://www.statista.com/statistics/461641/passenger-car-sales-by-segment-in-germany/ [EV-6] https://evadoption.com/ev-models/available-phevs/ [EV-7] https://batteryuniversity.com/learn/article/bu_1003a_battery_aging_in_an_electric_vehicle_ev [EV-8] 1] A. Lojowska, D. Kurowicka, G. Papaefthymiou and L. van der Sluis, "From transportation patterns to power demand: Stochastic modeling of uncontrolled domestic charging of electric vehicles," 2011 IEEE Power and Energy Society General Meeting, Detroit, MI, USA, 2011, pp. 1-7, doi: 10.1109/PES.2011.6039187 2] A. Lojowska, A. R. Ciupuliga, G. Papaefthymiou and L. van der Sluis, "The impacts of extra load from EVs in the Netherlands: A North-West Europe case study," 2012 IEEE International Electric Vehicle Conference, Greenville, SC, 2012, pp. 1-7, doi: 10.1109/IEVC.2012.6183219. [mob-data-BE] https://mobilit.belgium.be/nl/mobiliteit/mobiliteit_cijfers/enquetes_over_de_mobiliteit_van_de_belgen/monitor http://www.mobilitaet-in-deutschland.de/ [NEP-1] https://www.netzentwicklungsplan.de/de/netzentwicklungsplaene/netzentwicklungsplan-2030-2019 https://antares-simulator.org/ [TYNDP-1] https://tyndp.entsoe.eu/tyndp2018/scenario-report/
[mob-data-DE]
transportationStatisticalmodelforBEVsandPHEVsMarketmodelUncoordinatedEV electricity demand Power system impact transportationStatisticalmodelforBEVsandPHEVsSmartchargingcalculatorIndividualtimeseries for: • EV consumption • Uncoordinated battery level • Connection status • Charging capacity • Battery size Smart EV electricity demand Smart charging electricity demandMarginalcurve electricity prices Power system impact Smart charging
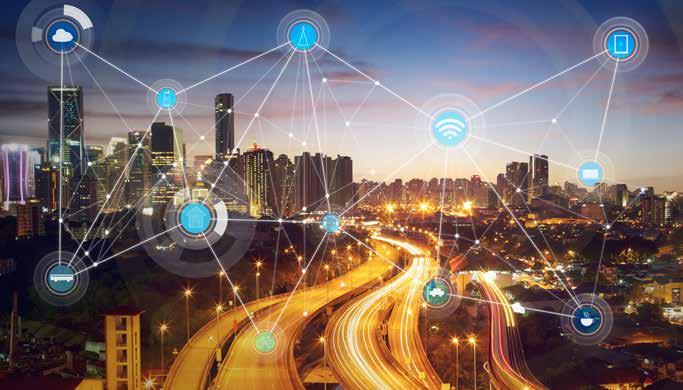
72