25 minute read
Investigation of Oral Proficiency & Course Level in Undergraduate French SLA
Sophia Minnillo This study compared human and computerized measures of oral proficiency in a second language and explored the distribution of oral proficiency levels across university course levels. Previous investigations that have used the ACTFL Oral Proficiency Interview (OPI), a human-rater assessment to measure oral proficiency in second languages have found positive but varied relations between oral proficiency and level of instruction. Given the potential for variability in the human scoring of the OPI, this study tested computerized assessments of oral proficiency, namely Computerized Language Analysis (CLAN), with the ultimate intention of rendering proficiency assessment more objective. We assessed a corpus of elicited speech samples from 16 undergraduate students learning French as a second language in university courses. We measured the oral proficiency of learners in terms of measures of complexity, accuracy, and fluency (CAF) through CLAN and native speaker evaluations. Computerized and human assessments of oral proficiency differed for the majority of measures, indicating significant differences in how computers and humans evaluate oral proficiency. Neither human nor computerized measures modeled strong oral proficiency differences between course levels. Abstract
Introduction
Advertisement
Measures of oral proficiency serve as one subset of the measures that second language educators use to quantify learners’ proficiency in a second language. Due to the increased interest in oral proficiency during the communicative language teaching movement (Brown, 2013), researchers have begun to investigate the consistency with which educators meet oral proficiency objectives for specific courses and course levels. Studies from a variety of universities have found a significant inconsistency in the overall proficiency levels of students from the same course levels (Goertler et al., 2016; Swender, 2003) as well as in the oral proficiency levels of students from the same course levels (Tschirner et al., 1998). These studies demonstrate a need for further investigation into disconnects between standards for oral proficiency, as prescribed for each course level, and the actual oral proficiencies attained by and required of students. These incongruences warrant great concern from students, educators, and employers. Students may suffer from reaching a lower level of oral proficiency than they anticipated due to being placed in a course with students of vastly different oral abilities. Students in a teaching certification program may not qualify for certification based on inadequate oral training in a university program (Goertler et al., 2016). Educators may face challenges including a need for greater differentiation in the classroom and the possibility of being deemed ineffective instructors. Employers may make hiring decisions based upon the candidate’s completion of certain courses yet find that the candidate does not have the requisite oral proficiency to succeed in the position (Brown, 2013). Standardization of oral proficiency objectives and outcomes for specific courses might alleviate these concerns. Many of the studies investigating the relation between oral proficiency and course level have measured oral proficiency using the American Council on the Teaching of Foreign Languages (ACTFL) Oral Proficiency Interview (OPI) (Thompson, 1996; Tschirner, 1992; Magnan, 1986). OPI scores are determined by two or more professional evaluators, who rate speakers’ performance according to ACTFL guidelines. The possibility for human subjectivity in OPI ratings has fueledcriticism of the evaluation from SLA researchers. Lennon (1990, p. 412) noted that basing scores on individuals’ ratings can result in great score variability. Tschirner and Heilenman (1998, p. 151) reported that the scores that ACTFL professionals assigned to test-takers differed in 40% of cases, finding that “sixty percent of perfect agreement may still fall somewhat short of the level of reliable judgment upon which important educational decisions such as certification or the satisfaction of a language requirement should be based.” In response to Lennon and Tschirner et al., the current study intends to investigate measures of oral proficiency that may eliminate the variability and subjectivity of human ratings. In addition to the OPI, measures of complexity, accuracy, and frequency (CAF) are often used to assess proficiency in a second language (L2) in SLA studies (Ahmadian, 2012; Ellis, 2009; Skehan, 1989). Researchers measure CAF by performing linguistic analysis using tools, including CLAN and Praat software (Baker-Smemoe
et. al, 2014; Boersma, 2001; Hilton, 2009; MacWhinney 2000). Researchers define CAF in terms of sub-categories, which encompass specific measures of linguistic analysis. Complexity can be divided into components of lexical and grammatical complexity (Norris & Ortega, 2009). Accuracy can be divided into grammatical, lexical, phonological, and semantic accuracy (Ellis, 2009). Fluency comprises speed, repair, and perceived fluency (Segalowitz, 2010). Researchers have used measures of CAF to describe oral proficiency in the context of learner outcomes but not specifically with regard to course level (Fukuda, 2014). Previous studies have researched relations between ACTFL-based oral proficiency and course level in instructional settings (Thompson, 1996; Tschirner, 1992; Magnan, 1986). Thompson (1996), Tschirner (1992), and Magnan (1986) found positive yet inconsistent correlations for this bivariate relationship. However, the current study appears to be the first to investigate the relation between computerized assessment of oral proficiency, as defined by CAF measures, and course level in instructional settings, specifically in French as a second language in the studied university. In order to expand upon previous language testing scholarship, this study has the following objectives: 1) to diversify and render more objective methods used to characterize oral proficiency and 2) to expand the investigation of the relation between oral proficiency and course level to a new corpus from this understudied university.
Methods
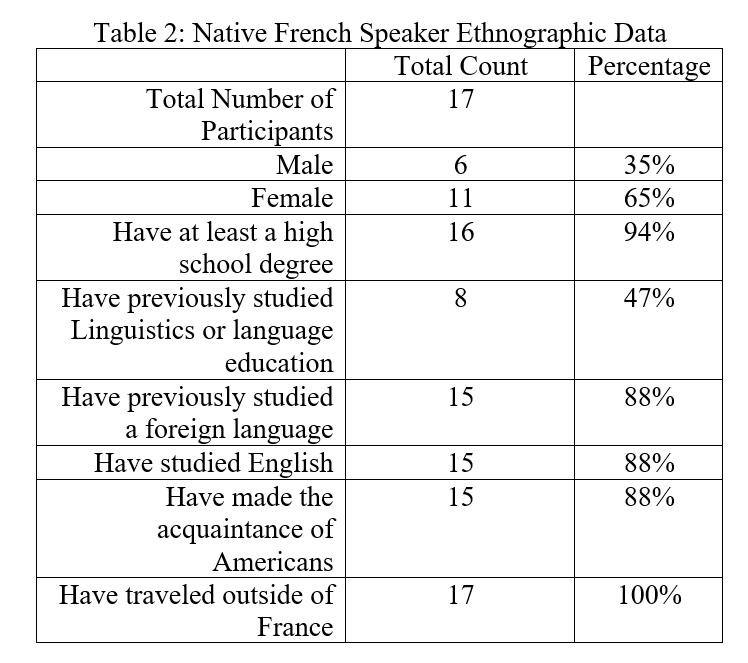
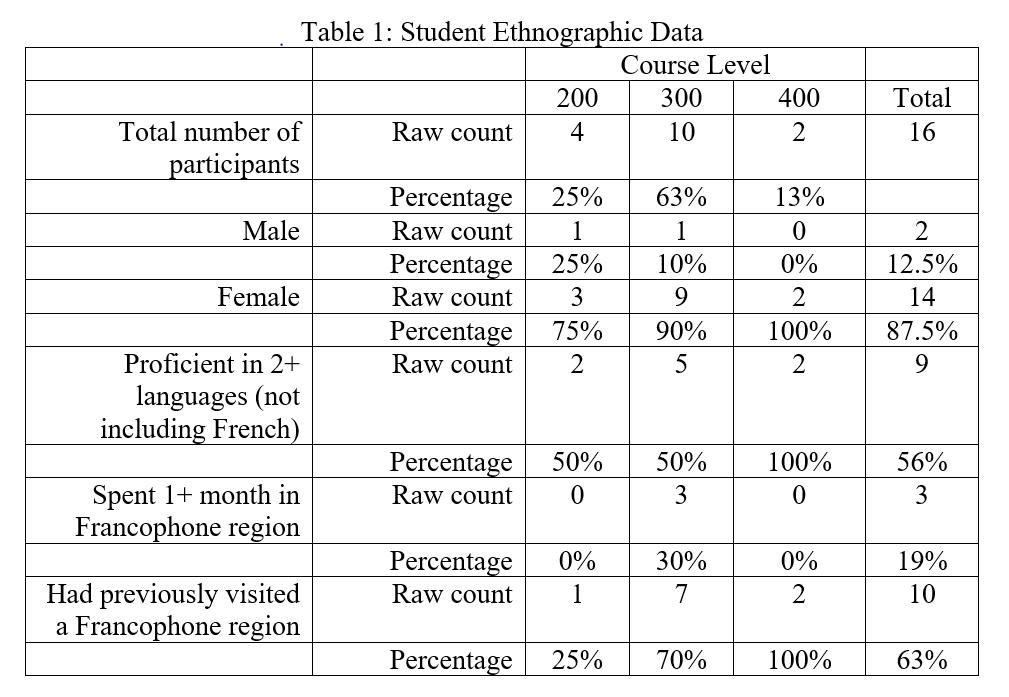
Participants Speech samples were obtained from 16 undergraduate students enrolled at a mid-sized, private university in the southeastern United States. All participants were enrolled in either 200, 300, or 400 level French courses at the time of the interview. Interviews were conducted over the course of three weeks to limit variation between students in the same course. A summary of student ethnographic data can be found in Table 1 of Appendix A. The language course levels at the studied university were defined by the type of courses offered at each level. At the 200 level, the required courses included Intermediate French (201) and Advanced French (203), and the focus of the classes was on “written and oral communication skills” (Course Descriptions, 2018). At the 300 level, the required courses included one course on writing skills (310), one course on “the reading and interpretation of a variety of literary and cultural media” (314), and three other courses on francophone literature, media and culture (students could choose between the following courses: 312, 313, 331, 341, 351, and 391). At the 400 level, the university offered three courses on advanced study of francophone literature and culture (460, 488, 490). Before commencing French studies, students took a placement test to receive course assignments. Students needed to complete all required courses at each course level to enroll in courses at the following higher course level. The course levels ranged from the 100 level, the level for beginners, to the 400 level, the most advanced level for undergraduate French study. We decided to omit 100 level students from our study because beginners often do not have the linguistic competence necessary to narrate a complex story. We recruited 17 native speakers of French to evaluate the speech samples. The interviews took place in Paris, France, in the fall of 2018. The mean age of the evaluators is 43 years. The maximum age is 81 years, and the minimum age is 20 years. A summary of French native speaker ethnographic data can be found in Table 2 of Appendix A.
Appendix A
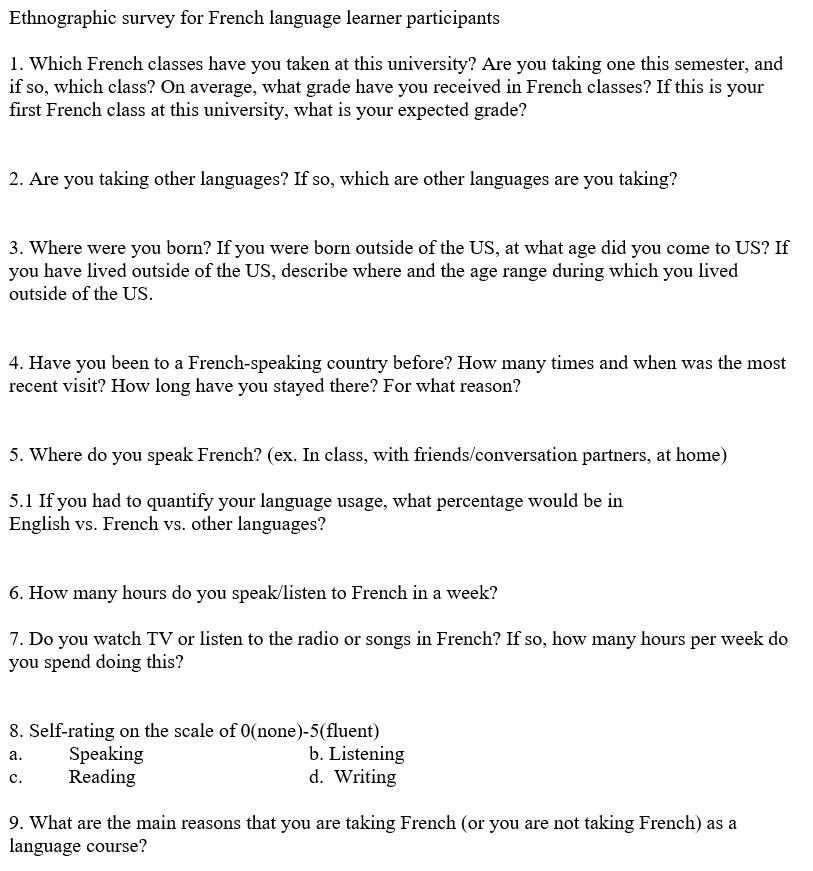
Materials and Procedure Interviews with participants lasted approximately 30 minutes and were conducted by one researcher. The speech samples were recorded using the app Voice Recorder by Tap Media Ltd. on an iPhone 7. The researcher first recorded participants answering three introductory questions in the L2 in order to activate the participant’s L2 performance. Then, the researcher explained the directions for the elicited narration task in the L2 and provided the participant with the wordless picture book Frog, Where are You? (Mayer, 1969). SLA researchers have deemed Frog, Where are You? to be an effective manner of eliciting narrative speech samples (Bennett-Kastor, 2002). Frog, Where are You? narrates the story of a boy who goes on an adventure to find his lost pet frog. The cover contains words in English, and the 30 pages that follow exclusively contain drawings. The researcher asked the participants to look quickly through the pages of Frog, Where are You? and commenced the recording when the participants indicated that they were ready to begin narrating. The participants were permitted to reference the book while narrating. The researcher did not speak during the narration to avoid impacting participants’ production. After the narration task, the participants completed an Aptitude and Motivation Test Battery (AMTB) survey and an ethnographic survey in English (Gardner, 1985). The ethnographic survey, which is included in Appendix B, recorded the following participant information: current course level, previous courses taken, languages spoken, and visits to francophone countries. In this study, we only analyzed course level data. We intend to study participants’ language backgrounds and experiences in francophone countries in relation to French proficiency in future research. The mean length of narration was 4 minutes and 5 seconds, and the narrations totaled 65 minutes and 24 seconds of speech. The researchers created a broad transcription as well as a morphological transcription of all of the speech samples following
Appendix B
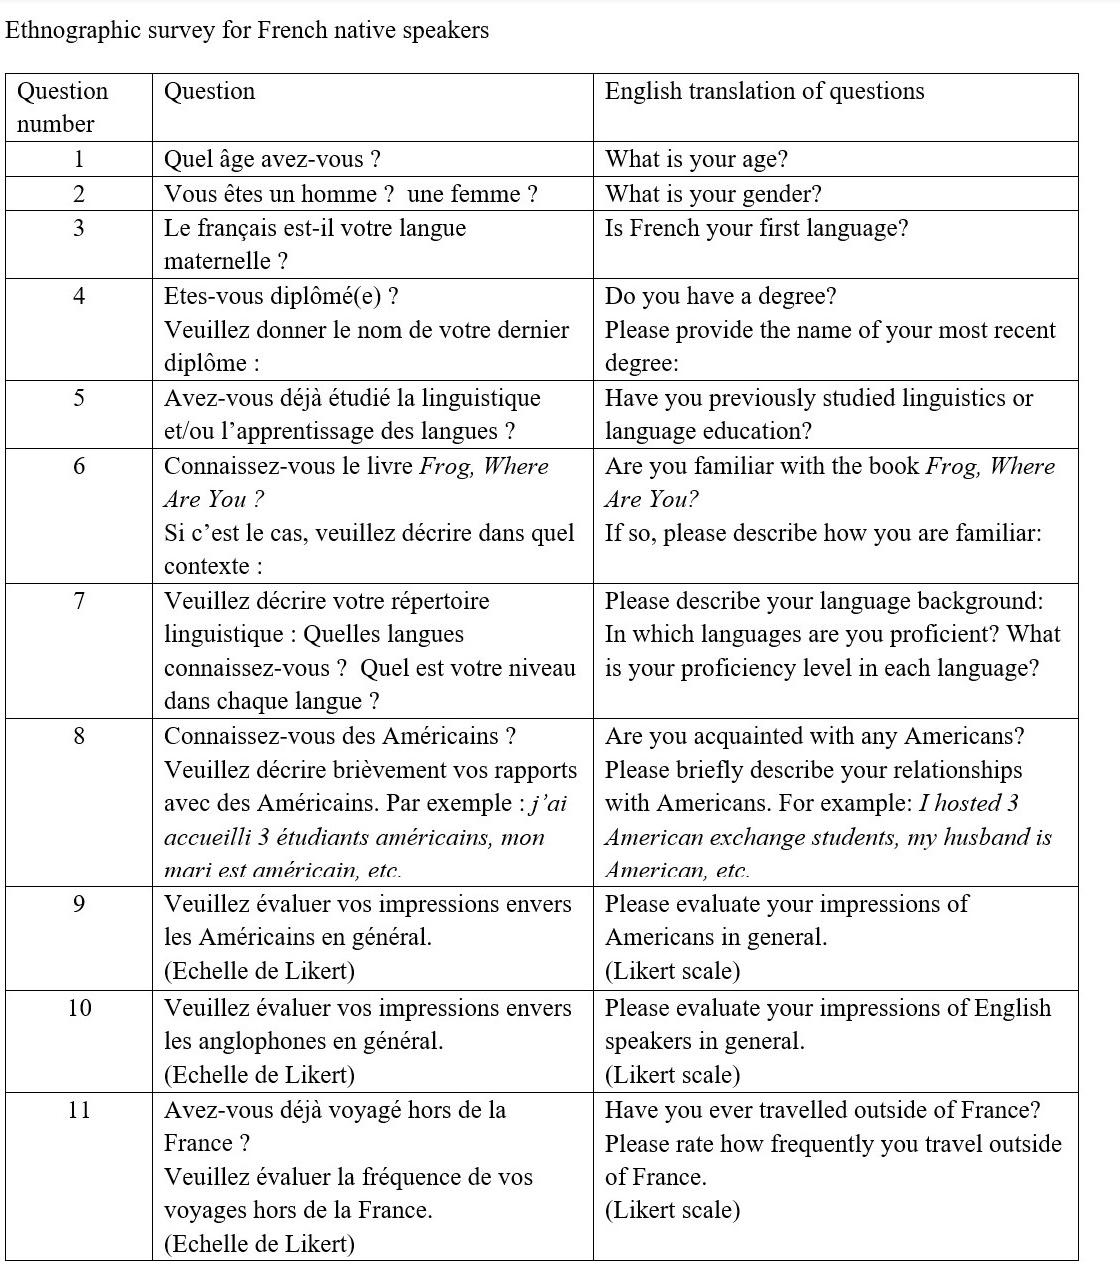
CHAT guidelines (MacWhinney, 2018). Within the broad transcription, we coded for semantic and morphosyntactic errors, repetitions, retracings, and reformulations using standard CHAT markers. Dr. Pascale Trévisiol, professor of language education at Université de Paris III Sorbonne-Nouvelle, reviewed and confirmed all error encoding. The Newcastle (Miles & Mitchell, 2008) and PAROLE (Hilton, 2009) corpora on SLABANK served as models for transcription (MacWhinney, 2007). The native speaker evaluators participated in an interview of approximately 30 minutes in length, which one of the researchers directed. Each native speaker evaluated four speech samples (a quarter of the sample); each speech sample received evaluations from four or five native speakers. The speech samples were randomly assigned to the evaluators. Each native speaker evaluated four speech samples due to time constraints in the 30-minute interview. At the beginning of the interview, the evaluators completed an ethnographic survey (see Appendix C). We then introduced the native speakers to Frog, Where are You?, the stimulus of the learners’ speech samples, which the native speakers
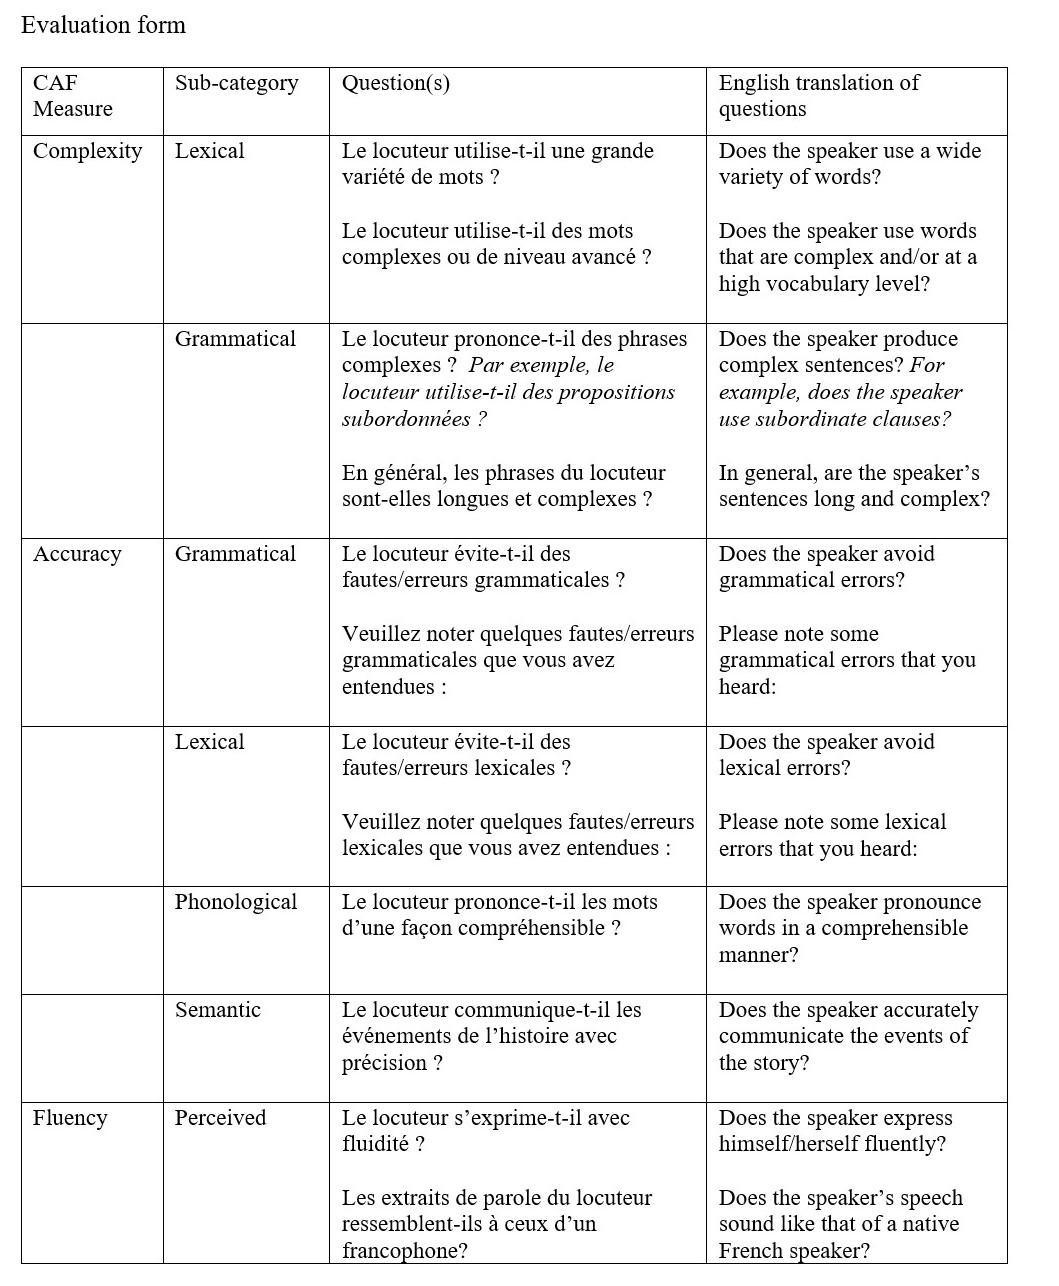
skimmed briefly to understand the sequence of events that is narrated in the story. Next, we presented the native speakers with the evaluation form and provided directions for completion. The questions presented on the evaluation (see Appendix C) directly relate to CAF measures for oral proficiency. The evaluation included 12 questions. Two of the questions were open-answer questions, in which we asked evaluators to note the lexical and grammatical errors that they heard while listening. Ten of the questions were on a Likert scale, offering answer choices on a whole number scale between 1 and 7. A response of 1 represented the weakest possible evaluation, and a response of 7 represented the strongest possible evaluation. The process of evaluation began with listening to a first speech sample. We permitted the evaluators to begin completing the evaluation form while listening to the speech sample, and we asked them to focus on answering the open-answer questions. After listening to the speech sample, the evaluators finished completing the evaluation. They then repeated the process with the next speech sample and continued until they had evaluated all four speech
Appendix C
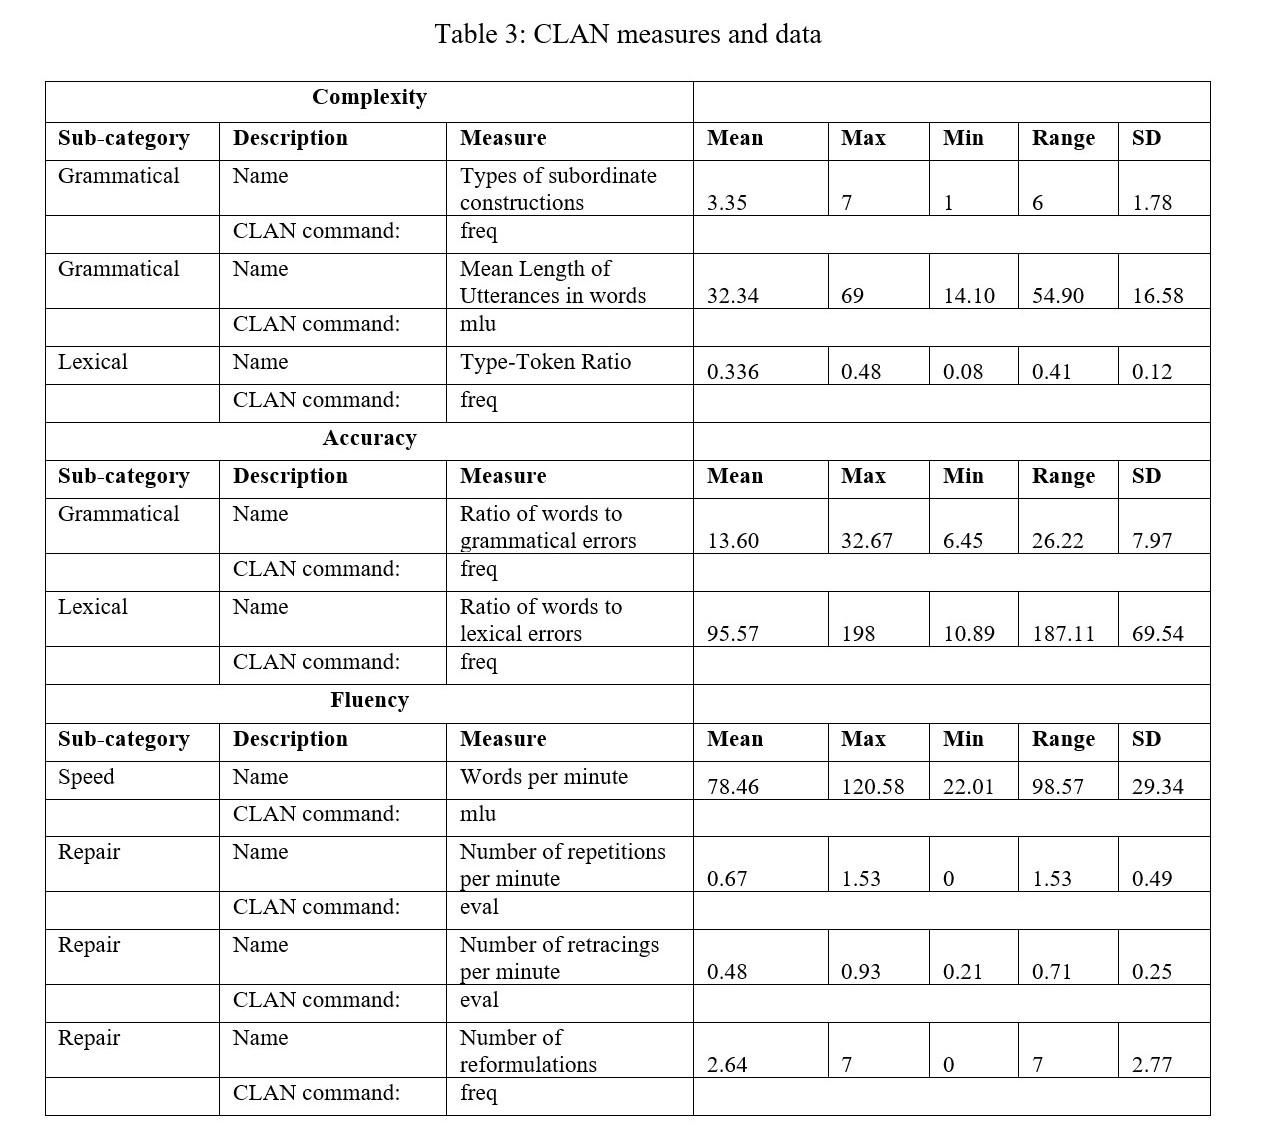
samples. The evaluators were only allowed to listen to each speech sample once. Analysis CLAN Analysis We created .cha files in CLAN that included the broad and morphological transcriptions for each speech sample. Then, we used CLAN commands to analyze the data for CAF measures of oral proficiency. The CLAN evaluation measures and the CLAN commands are listed in Table 3 of Appendix D. Lexical complexity was measured through the type-token ratio of the speech sample (Ellis, 2009). The CLAN command frequency (freq) automatically provided this ratio for any given file. We measured grammatical complexity through the number of types of subordinate constructions and the mean length of utterance (MLU), as measured by the ratio of words to utterances (Norris & Ortega, 2009). To find the number of types of subordinate constructions, we compiled a list of markers of subordination and used the frequency (freq) command to calculate the number of types of these markers in each speech sample. The markers included: qui, que, où, dont, parce que, quand, pendant que, alors que, après que, depuis que, and si. We also included pour followed by an infinitive and gerunds as markers of subordination, and we counted the types of these markers by hand to add to the total. To calculate the mean length of utterance, we used the mean length of utterance (mlu) command. Grammatical accuracy was measured through the ratio of the number of words to the number of grammatical errors (Ellis, 2009). We used the frequency (freq) command to calculate the number of grammatical/morphological error markers, [* m:a], in the CHAT transcription (MacWhinney, 2000), and measured lexical accuracy through the ratio of the number of words to the number of lexical errors (Ellis, 2009). We used the frequency (freq) command to calculate the number of lexical/semantic error markers, [*s], in the CHAT transcription (MacWhinney, 2000). Speed fluency was measured through the rate of words per minute (Baker-Smemoe et al.,
2014). The number of words calculated with mean length of utterance (mlu) command was divided by the length of the speech sample in minutes. We measured repair fluency through the number of repetitions per minute, the number of retracings per minute, and through the total number of reformulations (Ellis, 2009). We calculated the frequency of repetitions, retracings, and reformulations using the frequency command (freq); the frequency of the markers were used to note these phenomena in the CHAT transcription. Repetitions were marked with [/], retracings with [//], and reformulations with [///] (MacWhinney, 2000). To find the ratios of phenomena per minute, we divided the frequency of the phenomena by the length of the speech sample in minutes.
Native Speaker Evaluation Analysis To analyze the native speaker evaluations, we averaged the Likert-scale scores for each CAF sub-category. These categories included lexical, grammatical, and mean complexity; grammatical, lexical, phonological, and semantic accuracy; and perceived fluency (see Appendix C). We calculated the evaluation scores for each language learner as the mean of the scores from the four or five native speakers who evaluated that learner’s speech sample. We also calculated the mean scores for all participants for each CAF category and sub-category.
Appendix C
Date Analysis We recorded three sets of data: measures of CAF from the CLAN analysis, measures of CAF from native speaker evaluations, and the course levels of the university student participants from the ethnographic surveys. We calculated the correlations between the two first data sets, as well as the correlations between the first two data sets and the last data set, using Pearson’s r correlation. We then conducted a two-sample t-test at a 95% confidence level to test the correlation. If the p-value of a correlation was less than 0.05, we considered the correlation to be statistically significant. We also classified the correlations’ effects into three groups according to their Pearson’s r values. Large effects were characterized by a Pearson’s r of between ±0.30 and ±1.00, medium effects were characterized by a Pearson’s r of between ±0.10 and ±0.30, and small effects were characterized by a Pearson’s r of between ±0.00 and ±0.10 (Cohen 1992). Correlation data and effect groupings can be found in Table 5 of Appendix D.
Results
CLAN The CLAN measures used are listed in Table 3 of Appendix D. Table 3 also includes the summary statistics for each measure. It is important to note that as most of the measures have different units, there are large differences in the measures’ ranges. For instance, this difference can be
seen in comparing the measures of type-token ratio and the ratio of words to grammatical errors. The results show unexpectedly large ranges and standard deviations for the following measures: ratio of words to lexical errors and ratio of words per minute. The variance in the scores for these measures could indicate significant differences between lexical complexity and speed fluency of observations in the sample.
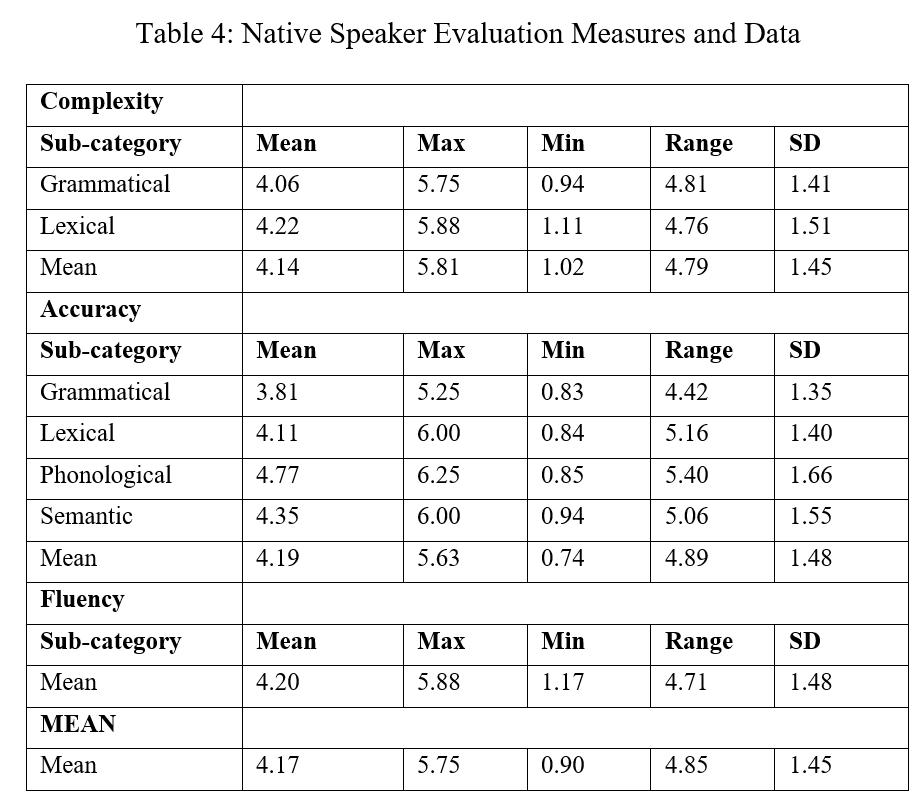
Native Speaker Evaluations Table 4 of Appendix D lists the summary statistics of the native speaker evaluation data. The relatively small size of the Likert scale (1-7) must be taken into consideration when analyzing the data. We visualized the distribution of the evaluation data in greater detail in section 3.4. The measure with the greatest mean score was phonological accuracy, and the measure with the lowest mean score was grammatical accuracy. The difference between the two means was 0.96. Among the CAF categories, fluency had the
Correlation between the two methods of evaluation We conducted a two-tailed t-test to measure the correlations between the evaluations provided by CLAN analysis and native speaker evaluations. Correlation data and effect sizes can be found in Table 5 of Appendix B. The following measures showed a statistically significant correlation between the CLAN and native speaker methods: lexical accuracy as measured on CLAN by the ratio of words to lexical errors, speed fluency as measured on CLAN by the ratio of words per minute, and repair fluency as measured on CLAN by the number of reformulations. The correlations between the two methods of evaluation showed some unexpected results. First, we predicted that all of the measures of repair fluency via CLAN would
Appendix D
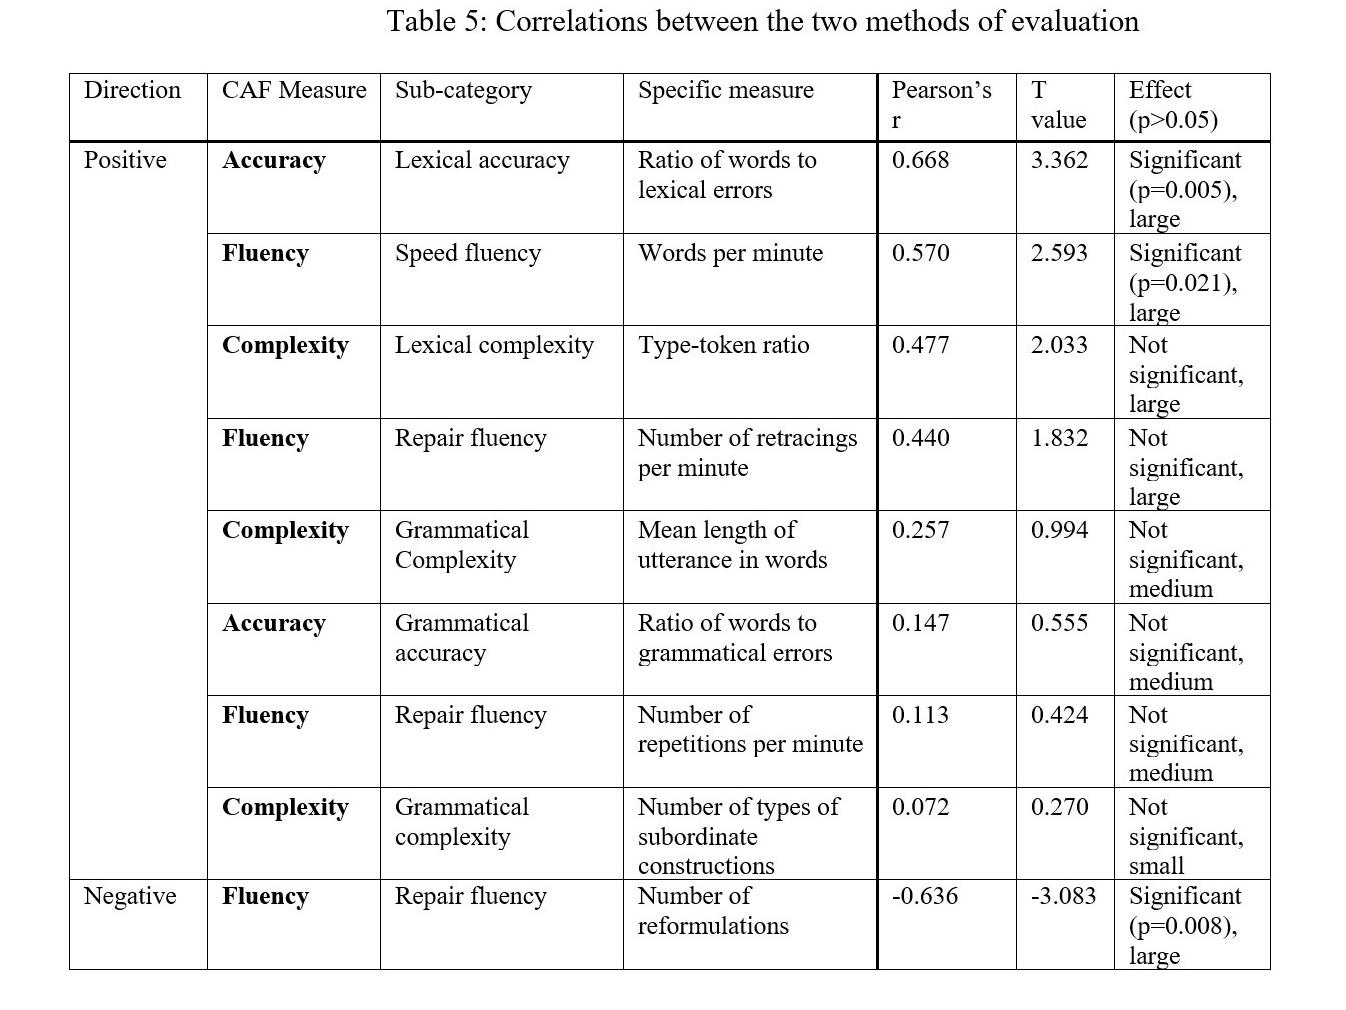
have a negative or indirect relation with the perceived fluency of the learner as measured by native speakers, as greater numbers of repetitions, retracings, and reformulations are associated with lower levels of fluency (Hilton, 2009). For this reason, we hypothesized that the CLAN measures of repair fluency would reveal a negative or indirect relation with fluency. Conversely, native speaker data should have a positive or direct relation with fluency as the native speakers provided their perception of the learner’s fluency. Among the measures of repair fluency, only the number of reformulations had a negative relationship; the number of retracings per minute and the number of repetitions per minute were positively related. The number of retracings per minute had a large, positive effect, and the number of repetitions per minute had a medium, positive effect. None of the three measures of repair fluency showed statistically significant correlations. Secondly, only three of the nine measures of oral proficiency (33%) had statistically significant correlations between the two measures of evaluation. This result signifies that although one-third of the CAF measures demonstrated a correspondence between the two methods of evaluation, the majority of the measures show too much variation between the two methods’ evaluations to have a statistically significant correlation.
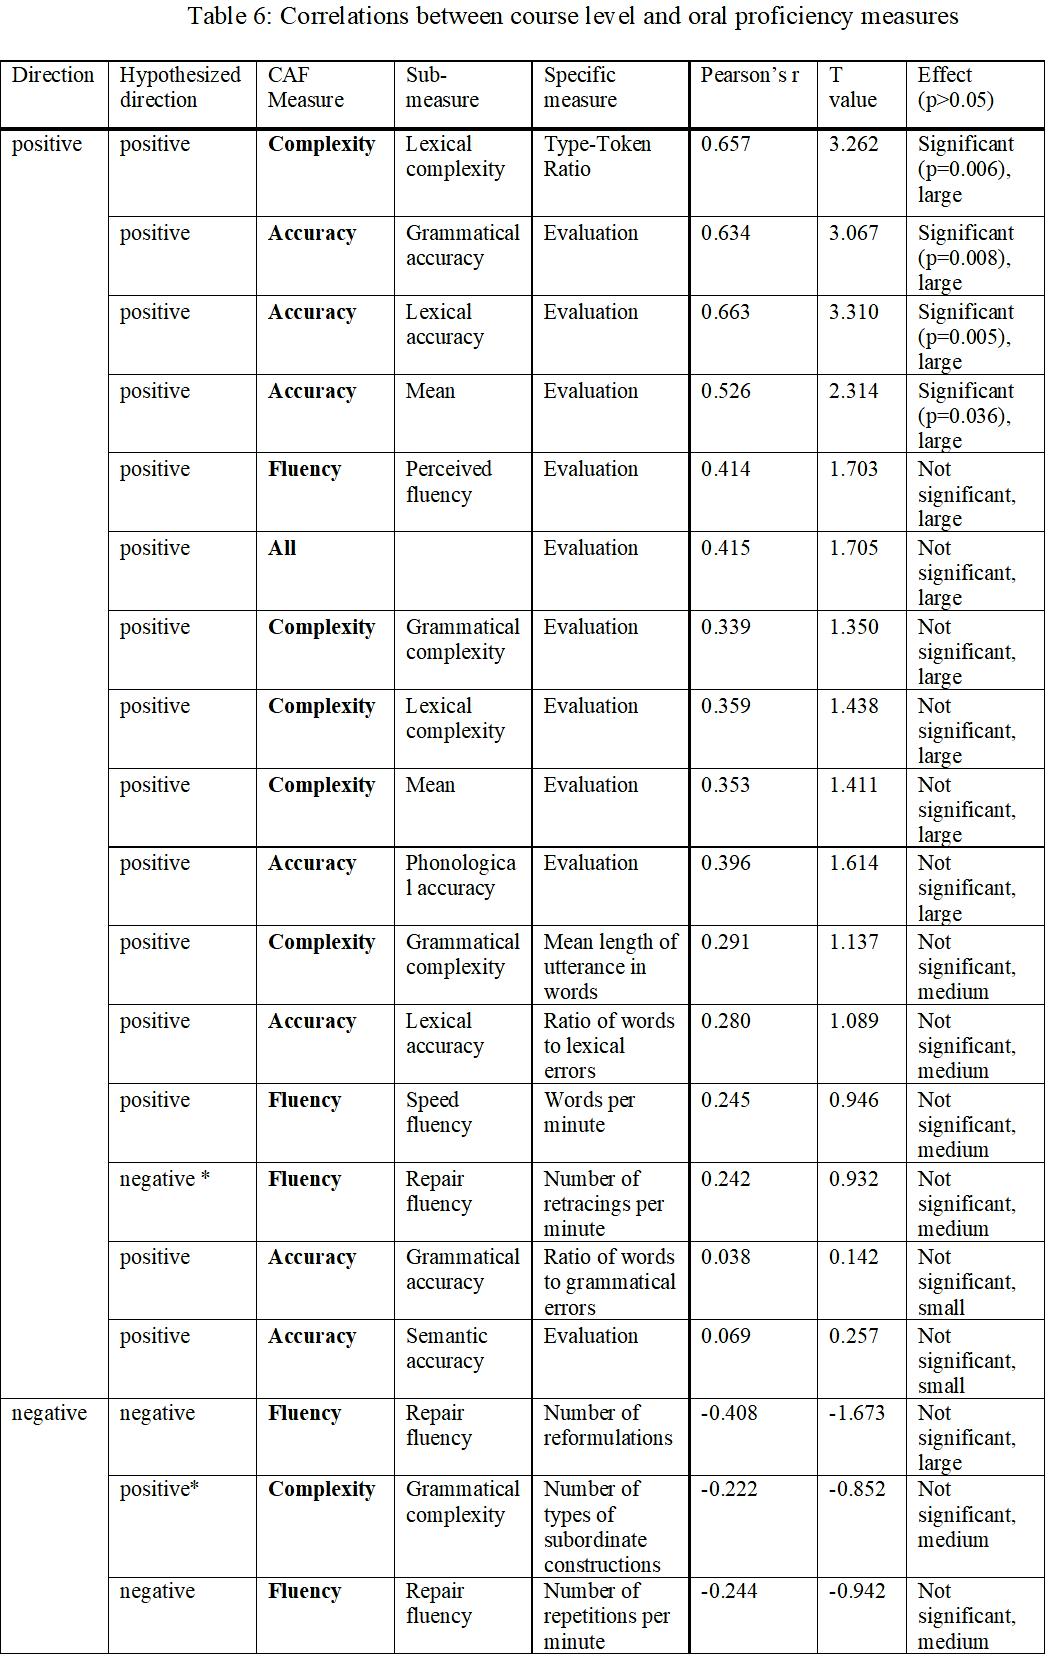
Correlation between the CAF measures and course level In order to observe the relation between course level and measures of oral proficiency, we calculated the correlations between all CAF measures from both methods of evaluation as well as the learners’ course levels. We used the procedure described in section 2.3.3 to calculate correla
Figure 1: Lexical complexity as measured by type-token ratio compared to course level
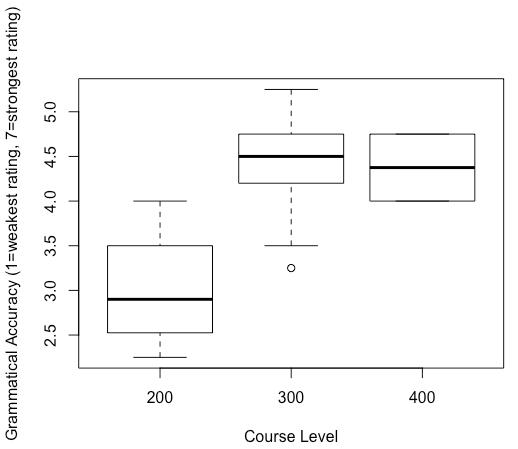
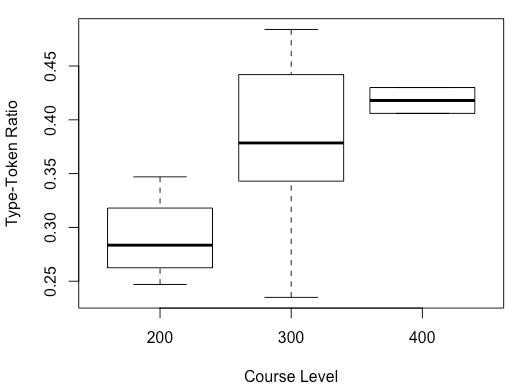
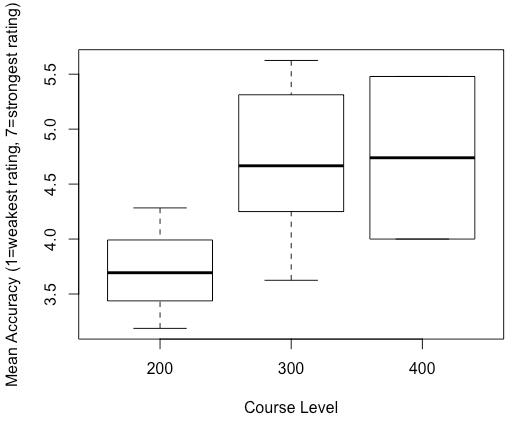
Figure 2: Mean accuracy as measured by native speaker evaluations compared to course level
Volume XVI, Spring 2020 | 17
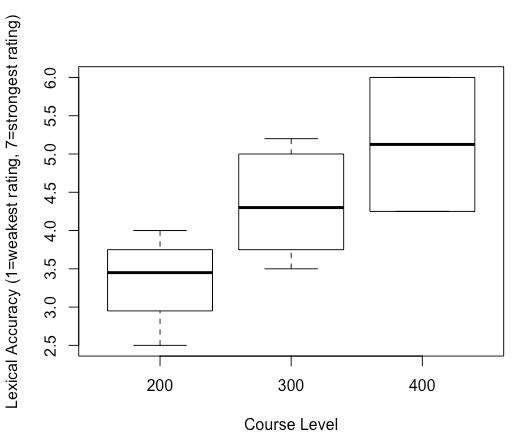
tions. The results are reported in Table 6 in Appendix D. We found four statistically significant correlations (21% of the total) between course level and CAF measures. The first CAF measure was type-token ratio as calculated by CLAN as a measure of lexical complexity (Figure 1). The other three statistically significant correlations come from native speaker evaluation CAF measures, including mean accuracy (Figure 2), grammatical accuracy (Figure 3), and lexical accuracy (Figure 4). Regarding the correlations’ effect sizes, 58% of the measures showed correlations with large effects, 32% with medium effects, and 11% with small effects. All of the measures showed correlations with the anticipated directionality, except for repair fluency measured by the number of retracings per minute and grammatical complexity measured by the number of types of subordinate constructions. Discussion A minority of correlations between CLAN evaluations and native speaker evaluations showed statistical significance, and we noticed certain unexpected effects. Among the latter, we observed that two of the three measures of repair fluency demonstrated the opposite effect of that predicted, and that none of the three measures of repair fluency had a statistically significant correlation between the measures of CLAN and those of the native speaker evaluators. This phenomenon might signify that the processes by which the two methods of evaluation assess oral proficiency are so different that they evaluate learners in opposite manners. This possibility highlights a potential area of concern for tests that base evaluations of oral proficiency on only one of these two methods of evaluation. However, we acknowledge that confounding variables may have affected this study. With regards to the measures of grammatical and lexical accuracy, it is possible that the native speaker evaluators focused their attention more on grammatical and lexical errors than other aspects of speech because they were asked to write down the grammatical and lexical mistakes they heard while listening to the speech samples. The increased attention to these aspects might have led measures of grammatical and lexical accuracy to be more refined than other CAF measures. This might also explain why the measures of lexical and grammatical accuracy as measured by native speaker evaluations formed one-half of the statistically significant correlations between CAF measures and course level. Secondly, it is possible that certain CLAN measures, including the number of types of subordinate constructions and the number of reformulations, have too small of a range of data to be used in this correlation test. In future research, we recommend using measures with greater ranges and recruiting more evaluators to increase the validity of results. This variation may also stem from the fundamental differences between human and computer programs in terms of how they evaluate proficiency. However, the differences between the methods of evaluation might serve as an asset to tests of oral proficiency, as the two methods bring complementary advantages and disadvantages. One disadvantage of native speaker evaluations might be difficulty controlling for human subjectivity in evaluations, as computer program evaluations may avoid this subjectivity. One advantage of native speaker evaluations could be that the learner’s global proficiency can be taken into consideration, which the CLAN measures used in this study cannot do. Additionally, native speaker evaluations, unlike CLAN measures, directly measure language learners’ ability to produce speech that is comprehensible to other speakers of the language. If one of a learner’s objectives is to be able to communicate effectively with other speakers in the real world, this test provides a valuable assessment of the accomplishment of that objective. We therefore conclude that evaluations of oral proficiency can benefit from the use of both methods of evaluation, CLAN analysis and native speaker evaluations. The majority of standardized proficiency exams, including the ACTFL OPI, provide more specific criteria for evaluation than those used in this study, reducing the subjectivity of native speaker evaluators. We chose to recruit native French speakers with a wide variety of ethnographic information in order to make the sample as representative as possible. It is possible that the evaluations of professional evaluators might correlate more strongly to the CLAN evaluations and/or to the course levels of the participants. In future research, investigating the relationship between the evaluations of professional and non-professional native speaker evaluators and also the relationship between evaluations of native and non-native speaker evaluators would prove valuable. Similar to the set of correlations discussed previously, the correlations between CAF measures and course level show few statistically significant relations and certain unpredicted effects. We noted that only one CLAN measure had a statistically significant correlation with course level. This may signify that CLAN measures differ considerably from measures used to evaluate course level at the studied university. The fact that the sole CLAN measure with a statistically significant correlation is type-token ratio could signify that students improve in oral lexical complexity in a progression that is more aligned with the trajectory between course levels than other CAF aspects of oral proficiency. This may suggest that vocabulary learning occurs in a more linear progression than other aspects of language competence.
The objectives of this study were, first, to diversify the methods used to characterize oral proficiency, and second, to add data from a new language learning context to SLA research. We diversified methods by evaluating oral proficiency via multiple CAF measures of proficiency through the methods of CLAN analysis and native speaker evaluations. In calculating the correlations between the evaluations of oral proficiency of these methods, we found a general lack of correspondence between the two methods. The CAF measures of lexical accuracy, speed fluency, and repair fluency, as measured by the number of reformulations, were the only measures to have a statistically significant (p < 0.05) correlation between the results of the two methods of evaluation. This lack of correspondence may be the result of the intrinsic differences between the two methods. The differences may in fact serve to provide a more complete evaluation of oral proficiency, although further research is necessary. We hope that these results will contribute to the field of research on second language oral proficiency testing. We addressed the second objective by adding novel elicited speech samples to our corpus and by analyzing oral proficiency in relation to course level. This study commenced a larger project of corpus development at this university, which the researchers intend to continue in order to evaluate a more representative sample of French language learners. A sample size of 16 students was too small to allow us to draw generalizable conclusions from these results. However, our sample shows that 79% of the relations between measures of oral proficiency used in this study and course level are either non-linear or not statistically significant. The four statistically significant correlations are between course level and the following measures: lexical complexity from CLAN analysis, lexical accuracy from native speaker evaluation, grammatical accuracy from native speaker evaluation, and mean accuracy from native speaker evaluation. Our study demonstrates that there may be significant variance in the oral proficiencies of French language learners both within and between course levels.
References Ahmadian, M. J. (2012). The Effects of Guided Careful Online Planning on Complexity, Accuracy and Fluency in Intermediate EFL Learners' Oral Production: The Case of English Articles. Lan guage Teaching Research, 16(1), 129-149. Baker-Smemoe, W., Dewey, D., Bown, J., & Martinsen, R. (2014). Does measuring L2 utterance fluency equal measuring overall L2 proficiency? Evidence from five languages. Foreign Language Annals, 47(4), 707-728. Bartning, I., & Schlyter, S. (2004). Itinéraires acquisitionnels et stades de développement en français L2. Journal of French Language Studies, 14(3), 281-299. Boersma, P. (2001). Praat, a system for doing phonetics by computer. Glot International, 5(9/10), 341-345. Brown, A. V. (2013). Understanding the relationship between language performance and university course grades. Foreign Language Annals, 46(1), 80-87. Christoffersen, K. (2017). Comparing native speaker ratings and quanti tative measures of oral proficiency in IELTS interviews. Elia, 17, 233-250. Cohen, J. (1992). A power primer. Psychological Bulletin, 112, 155–159. Course Descriptions (2018). Department of French and Italian: Undergraduate Programs. Retrieved from http://french.emory. edu/home/undergraduate/french/course-descriptions.html Elder, C., & Iwashita, N. (2005). Planning for Test Performance: Does It Make a Difference? In R. Ellis (Ed.), Planning and Task Per formance in a Second Language (pp. 219-38). Amsterdam, Netherlands: Benjamins. Ellis, R. (2009). The Differential Effects of Three Types of Task Planning on the Fluency, Complexity, and Accuracy in L2 Oral Produc tion. Applied Linguistics, 30(4), 474-509. Fukuda, M. (2014). Dynamic processes of speech development by seven adult learners of Japanese in a domestic immersion context. Foreign Language Annals, 47(4), 729-745. Gardner, R. (1985). Social psychology and second language learning: The role of attitudes and motivation. London: Edward Arnold. Goertler, S., Kraemer, A., & Schenker, T. (2016). Setting evidence-based language goals. Foreign Language Annals, 49(3), 432-454. Hilton, H. (2009). Annotation and analyses of temporal aspects of spoken fluency. CALICO Journal, 26(3), 644-661. Leclercq, P., Edmonds, A. & Hilton H. (Eds) (2014). Measuring L2 Profi ciency : Perspectives from SLA, Clevedon, UK: Multilingual Matters. Lennon, P. (1990). Investigating Fluency in EFL: A Quantitative Ap proach. Language Learning: A Journal of Applied Linguistics, 40(3), 387-417. MacWhinney, B. (2000). The CHILDES Project: Tools for analyzing talk. Third Edition. Mahwah, NJ: Lawrence Erlbaum Associates. MacWhinney, B. (2007). The TalkBank Project. In J. C. Beal, K. P. Cor rigan & H. L. Moisl (Eds.), Creating and Digitizing Language Corpora: Synchronic Databases, Vol.1. (pp. 163-180). Hound mills: Palgrave-Macmillan. Magnan, S. (1986), Assessing Speaking Proficiency in the Undergraduate Curriculum: Data from French. Foreign Language Annals, 19, 429-438. Miles, F. & Mitchell, R. (2008). The Structure of French Interlanguage: A corpus-based study. Retrieved from https://slabank.talkbank. org/access/French/Newcastle.html Norris, J., & Ortega, L. (2009). Towards an Organic Approach to Investi gating CAF in Instructed SLA: The Case of Complexity. Ap plied Linguistics, 30(4), 555-578. Skehan, P. (1998). A cognitive approach to language learning. Oxford University Press. Segalowitz, N. (2010). Cognitive bases of second language fluency. New York: Routledge.
Swender, E. (2003). Oral proficiency testing in the real world: Answers to frequently asked questions. Foreign Language Annals, 36, 520-526. Thompson, I. (1996), Assessing Foreign Language Skills: Data from Russian. The Modern Language Journal, 80, 47-65. Tschirner, E. (1992). Oral Proficiency Base Lines for First- and Sec ond-Year College German. Die Unterrichtspraxis / Teaching German, 25(1), 10-14. Tschirner, E., & Heilenman, K. (1998). Reasonable expectations: Oral proficiency goals for intermediate-level students of German. The Modern Language Journal, 82, 147-158.

Sophia Minnillo (‘20C) is graduating this spring with a double major in French Studies and Linguistics. Her article in this issue is based upon research that she completed while studying abroad in France through the EDUCO program. Sophia recently received highest honors for her thesis focused on the current state and the potential of computer-assisted language learning (CALL) in beginner, college-level French programs. She looks forward to pursuing a PhD in Linguistics at University of California, Davis next year. In her free time, Sophia enjoys hiking, reading, and learning languages.


