

HOUSING NEEDS ASSESSMENT
SAN FRANCISCO METROPOLITAN AREA
Escarleth Cucurachi Ortega
UP 458 Housing and Real Estate Development
Instructor: Dr. Noah J. Durst
MURP | MSU
Introduction
This Housing Needs Assessment for the San Francisco, California, Metropolitan Area offers an overview of essential housing tendencies and the attributes of housing users. The research reveals the interconnected nature of ethnic inequities, restrictive zoning, suburban expansion, and financial disparities in the San Francisco Metro Area’s housing landscape that triggers an affordability crisis. Exclusionary zoning and suburbanization have created a severe housing shortage, disproportionately affecting communities of color, perpetuating unaffordability, and fostering displacement. Equally, predominant single-family housing exacerbates urban segregation and economic disparities, leading to significant income inequalities. This situation further limits housing options for Hispanic and Black communities despite a clear demand for multi-family housing. The scarcity of affordable housing intensifies social inequalities, underscoring a crisis that particularly affects certain population segments. Drawing from data from the American Community Survey 2022 1-Year Estimates (ACS, 2022), the State of the Cities Data System (SOTCDS, 2022), the Social Explorer 20172021 5-Year Estimates (Social Explorer, 2021), and the academic literature on housing and land use in the United States, this study succinctly addresses the core issue.
2
Housing Needs Assessment
Racial disparities caused by significant exclusionary zoning (Danielson, 1976), and suburbanization in most of the metropolitan area of San Fransisco strongly contribute to the constant decline of the zone. The deliberate choice to curtail housing development, particularly multifamily units, has disproportionately affected communities of color, perpetuating a severe housing shortage (Fox, 2023). This scarcity disproportionately impacts Black and Hispanic populations, leading to housing unaffordability and often forcing their displacement, as evidenced by the decline in the Black population from 13.4% in 1970 to 5.7% in 2021 (Fox, 2023). Furthermore, almost 50% of all housing units are unitary detached constructions (see Graphic 1; data acquired from American Community Survey, 2022). The prevalence of single-family housing units contributes to urban segregation and economic disparities limiting opportunities for marginalized communities and exacerbating the city’s decline. Likewise, geographic racial and ethnic clusters are associated with income disparities, with areas of lower incomes often having concentrated Hispanic populations (Figure 1, data from Social Explorer, 2022). This housing shortage amplifies income disparities, where 25% of Black individuals earn less than $25,000, while nearly 35% of White and Asian individuals earn over $200,000 (Graphic 2; data from American Community Survey, 2022). The unequal distribution of affordable housing and economic opportunities due to exclusionary zoning and suburbanization plays a pivotal role in entrenching racial disparities, creating a cycle that perpetuates economic and social inequality, strongly contributing to the decay of San Francisco in recent years.
Household
by Race/Ethnicity of Head of Household

3
Figure 1. Comparison Maps of White Non-Hispanic and Hispanic Population, and Household Median Income in the San Francisco Metropolitan Area.
0 5 10 15 20 25 30 35 40 Less than $25,000 $25,000 to $49,999 $50,000 to $74,999 $75,000 to $99,999 $100,000 to $124,999 $125,000 to $149,999 $150,000 to $199,999 $200,000 or more Household Income
Graphic 2. Household Income by Race/Ethnicity of Head of Household in the San Francisco Metropolitan Area.
Income
(Non-Latino/Hispanic)
49% 9% 4% 7% 6% 5% 7% 12% 1% 0% Housing Type as a Percentage of All Housing Units 1, detached 1, attached 2 3 or 4 5 to 9 10 to 19 20 to 49 50 or more Mobile home Boat, RV, van, etc.
White
Black Latino/Hispanic Asian
Graphic 1. Housing Type as a Percentage of all Housing Units in the San Francisco Metropolitan Area.
Moreover, the current prevalence of single-family homes disproportionately advantages White and Asian residents limiting multifamily housing options, especially for Hispanic and Black groups. Analyzing the demographics, the data clearly illustrates this discrepancy. More than half of the renters are Black and Latino, while over 60% of homes are owned by White and Asian inhabitants (see Graphic 3; data acquired from American Community Survey, 2022). Evidence shows that economic disparities favor White and Asian homeownership due to their greater financial resources, while Black and Latino groups face financial barriers that impede their ability to buy homes. Additionally, the preference for multi-family housing is evident, as nearly 70% of rented housing units consist of more than five units per building, just as the prevalence of permits in this housing typology since 2007 (see Graphics 4 and 5; data acquired from American Community Survey and the State of the Cities Data System, 2022). However, this demand for multi-family housing is not adequately met due to the prevailing pervasiveness of single-family housing in the region, significantly limiting rental options, especially for Hispanic and Black populations. The zoning and housing policies contribute to this scenario. Suburban zoning ordinances have historically favored single-family homes, reducing land availability for single-family development and adding to the cost of new single-family housing (Danielson, 1976). This trend escalates housing prices, diminishing the potential of the multifamily housing market, which offers numerous benefits, including increased residential density, economic stimulus, and environmental advantages (NHMC, 2021).
Homeownership Rate by Race and Ethnicity
1, detached
1, attached
2
3 or 4
5 to 9
10 to 19
20 to 49
50 or more
Mobile home
Boat, RV, van, etc.
4
Graphic 3. Homeownership Rate by Race and Ethnicity in the San Francisco Metropolitan Area.
Graphic 4. Renters: Housing Type as a Percentage of All Housing Units in the San Francisco Metropolitan Area.
0,00 10,00 20,00 30,00 40,00 50,00 60,00 70,00 80,00
Race
Graphic 5. Renters: Housing Type as a Percentage of All Housing Units in the San Francisco Metropolitan Area.
White (Non-
Latino/Hispanic)
Black Asian Latino/Hispanic
or Ethnicity
19% 7% 6% 12% 11% 11% 12% 22% 0% 0%
Owner Renter
Renters: Housing Type as a Percentage of All Housing Units
0 2000 4000 6000 8000 10000 12000 14000 16000 18000 Number of Housing Permits Year Housing Permits by Type of Housing and Year Units in Single-Family Structures Units in 2-unit to 4-unit Structures Units in 5+ Unit Multi-Family Structures
Finally, the diminishing availability of affordable housing options is exacerbating social inequalities and solidifying the landscape of the affordability crisis in the region. This is evident when examining the stark contrast in median rents across areas: higher median rents exceeding $996 are prevalent in the San Francisco Peninsula, while affordable rents, as outlined by the National Low Income Housing Coalition (2019) (up to $913), are concentrated in the Oakland sector (see Figure 2; data from Social Explorer, 2022). This economic disparity underscores the pressing problem of stagnant incomes, severely limiting housing options for the populace within specific segments of the metropolitan area. Furthermore, the highest percentage of people who own a home have a salary greater than $150,000 (see Graphic 6; data acquired from American Community Survey, 2022). The above illustrates pronounced incomebased social inequalities. This situation can result in significant challenges for individuals who are unable to afford homeownership and struggle to find affordable rentals close to their workplace. For example, the age groups of 15-24 and 65 and over face the greatest burden of housing costs, with these expenditures exceeding 30% of their income (see Graphic 7; data from American Community Survey, 2022). This data underlines the economic vulnerability experienced by young adults embarking on their careers and older individuals, potentially retirees or those on fixed incomes, emphasizing the acute housing affordability challenge. As cited by Bratt, Stone, & Hartman (2006), people with lower incomes, especially renters, often spend over 50% of their earnings on rent and utilities, sometimes living in substandard conditions. This further emphasizes the pressing need for affordable housing in the region. Substandard housing conditions not only impact the immediate quality of life but also limit access to education, job opportunities, and community resources (Bratt, Stone, & Hartman, 2006), perpetuating the cycle of poverty.
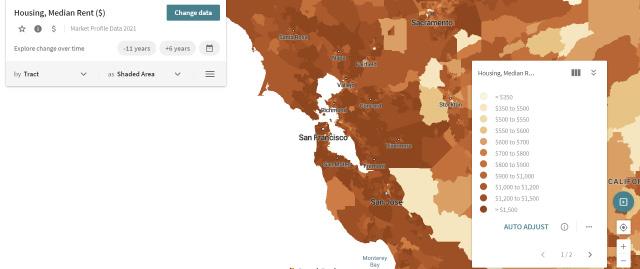
5
Figure 2. Comparison Maps of White Non-Hispanic and Hispanic Population, and Household Median Income in the San Francisco Metropolitan Area.
Graphic 6. Percentage of Households by Income: Disaggregated by Tenure in San Francisco Metropolitan Area.
0 10 20 30 40 50 60 Less than $25,000 $25,000 to 49,999 $50,000 to $74,999 $75,000 to $99,999 $100,000 to $149,999 $150,000 or more Household Income Percentage of Households by Income: Disaggregated by Tenure Owner-Occupied Renter-Occupied 0,00 5,00 10,00 15,00 20,00 25,00 30,00 35,00 40,00 45,00 50,00 Householder 15 to 24 years Householder 25 to 34 years Householder 35 to 64 years Householder 65 years and over Percentage of Households with Housing Costs Greater than 30% of Household Income: By Age of Head of Household Householder 15 to 24 years Householder 25 to 34 years Householder 35 to 64 years Householder 65 years and over
Graphic 7. Percentage of Household with Housing Costs Greater than 30% of Household. Income: By Age of Head of Household.
Conclusion
In conclusion, the research conducted on Need Assessment Housing in San Francisco County has unveiled a deeply entrenched housing crisis stemming from historical exclusionary zoning and suburbanization. These practices have deliberately curtailed housing development, disproportionately impacting communities of color and resulting in a severe housing shortage, leading to housing unaffordability and displacement, particularly among Black and Hispanic populations. The prevalence of single-family housing units further exacerbates urban segregation, income disparities, and economic inequality. While further research is needed to address these critical challenges, it is clear that San Francisco must undertake comprehensive zoning reforms to promote multifamily housing development actively. This reform would increase residential density, stimulate economic growth, and enhance environmental sustainability, ultimately diversifying housing options and opportunities (NHMC, 2021). Simultaneously, to ensure equitable distribution of affordable housing and reduce income-based disparities, the region should offer incentives for affordable housing development. Streamlined regulations and dedicated funding mechanisms can expedite construction and create a more balanced housing landscape (NHMC, 2021). These combined efforts can mitigate the housing crisis, fostering a more inclusive, equitable, and thriving community for all its residents.
6
References
American Community Survey 2022 1-Year Estimates (2022). U.S. Census Bureau. https://data.census.gov/cedsci/
Bratt, R., Stone, M., & Hartman, C. (2006). A right to housing: foundation for a new social agenda. Philadelphia: Temple University Press.
Danielson, M. (1976). Zoning for Fewer People. New York: Columbia University Press.
Fox, J. (2023, July 17). The Washington Post. Retrieved from San Francisco Isn’t Destined to Be the Next Detroit: https://www. washingtonpost.com/business/2023/07/17/san-francisco-isnt-destined-to-be-the-next-detroit/fc6d15a6-2493-11ee-9201826e5bb78fa1_story.html
National Low Income Housing Coalition. (2019). Out of Reach. National Low Income Housing Coalition.
NHMC. (2021). Multifamily Benefits. The Housing Affordability Toolkit, 36-44. Retrieved from https://housingtoolkit.nmhc.org/wpcontent/uploads/2019/04/NMHC_PDF-Sections_Full-Doc.pdf
Social Explorer 2017-2021 5-Year Estimates (2021). Social Explorer. https://accounts.socialexplorer.com/
State of the Cities Data System (2022). U.S. Census Bureau. https:// socds.huduser.gov/permits/index.html
7