Plan, Adapt, Transition, and Restore A Long-term Action Plan for Coastal Resilience for Manchester-By-The-Sea's Inner Harbor

VERSION 1.0 – JUNE 2023

Plan, Adapt, Transition, and Restore A Long-term Action Plan for Coastal Resilience for Manchester-By-The-Sea's Inner Harbor

VERSION 1.0 – JUNE 2023


Plan, Adapt, Transition, and Restore A Long-term Action Plan for Coastal Resilience for Manchester-By-The-Sea's Inner Harbor
Version 1.0 - June 2023

COASTAL STREAM TEAM
Jessica Lamothe
CONSERVATION COMMISSION
Henry Oettinger
DOWNTOWN IMPROVEMENT COMMITTEE
Jim Brown
HARBOR ADVISORY COMMITTEE

Chris Comb
HISTORIC DISTRICT COMMISSION
Rosemary Costello
PLANNING BOARD
Laura Tenny
SALEM SOUND COASTWATCH
Barbara Warren
SELECT BOARD
Ann Harrison
Sue Croft Grants/Special Projects Coordinator
Chuck Dam Public Works Director
Nathan Desrosiers Town Engineer and Facilities Manager
Gregory Federspiel Town Administrator

Patricia Bowie Coastal Resiliency Specialist
Kathryn Glenn North Shore Regional Coordinator
Julia Knisel Coastal Shoreline and Floodplain Manager
FUSS & O’NEILL
Dean Audet
Stefan Bengtson
Andy Bohne
Faith Long
Alex Maxwell
Sara Morrison
Mike Nelson
Lara Sup
Chelsea Zakas
WOODS HOLE GROUP


Joe Famely
Adam Finkle
Katie Lavallee
Annie O’Connell
About the plan
Planning approach
Community engagement

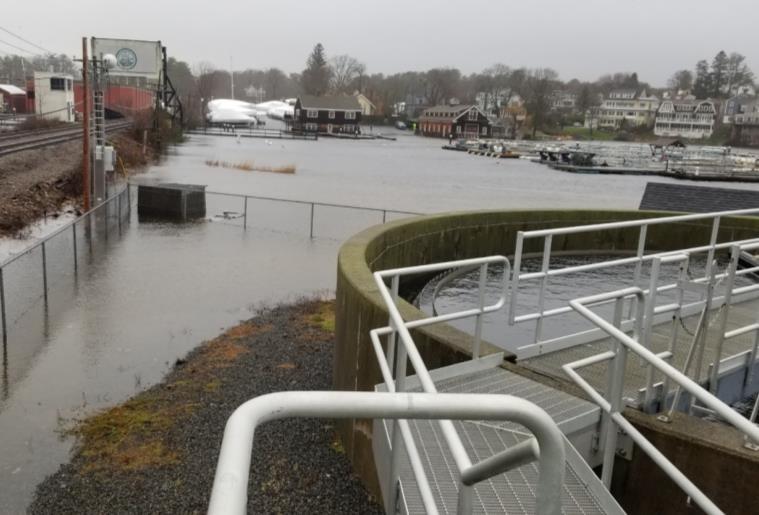
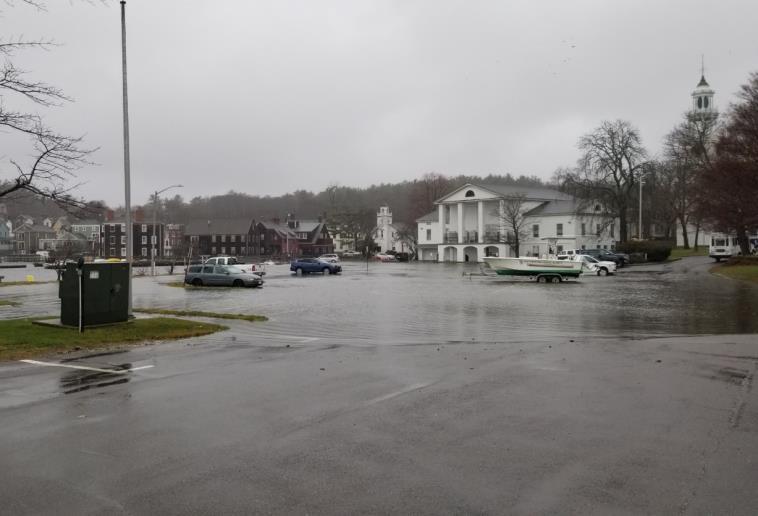
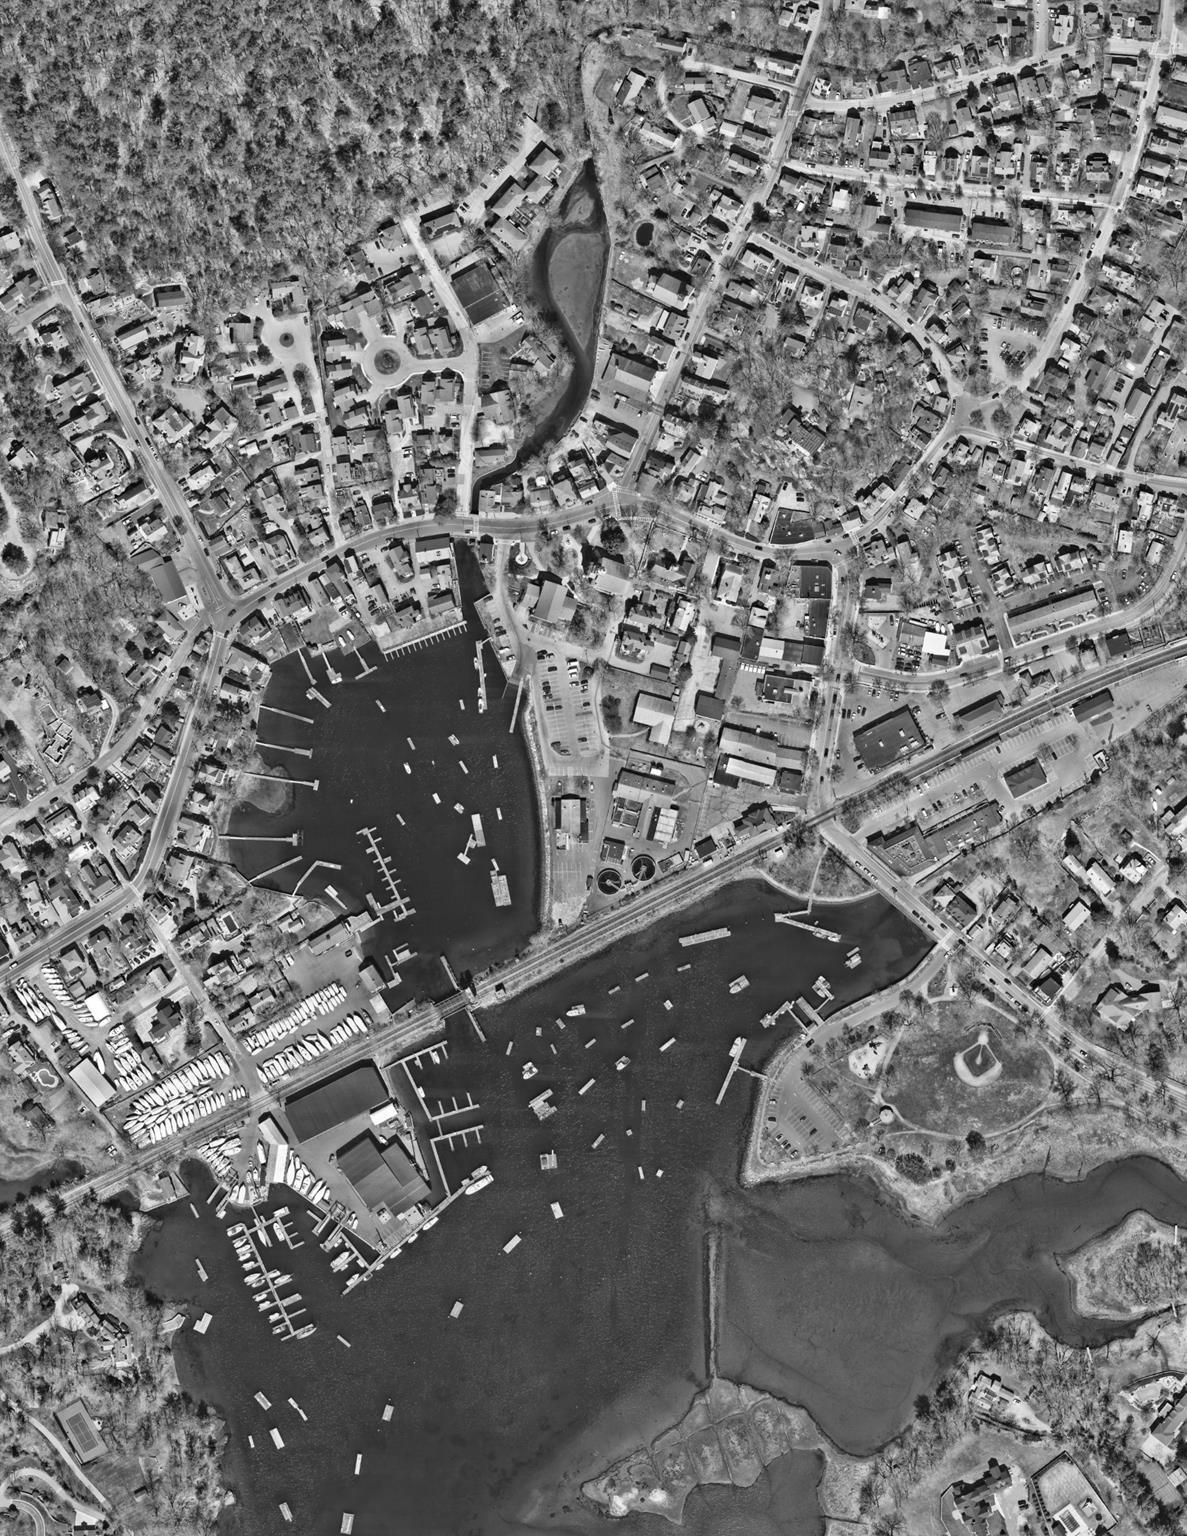
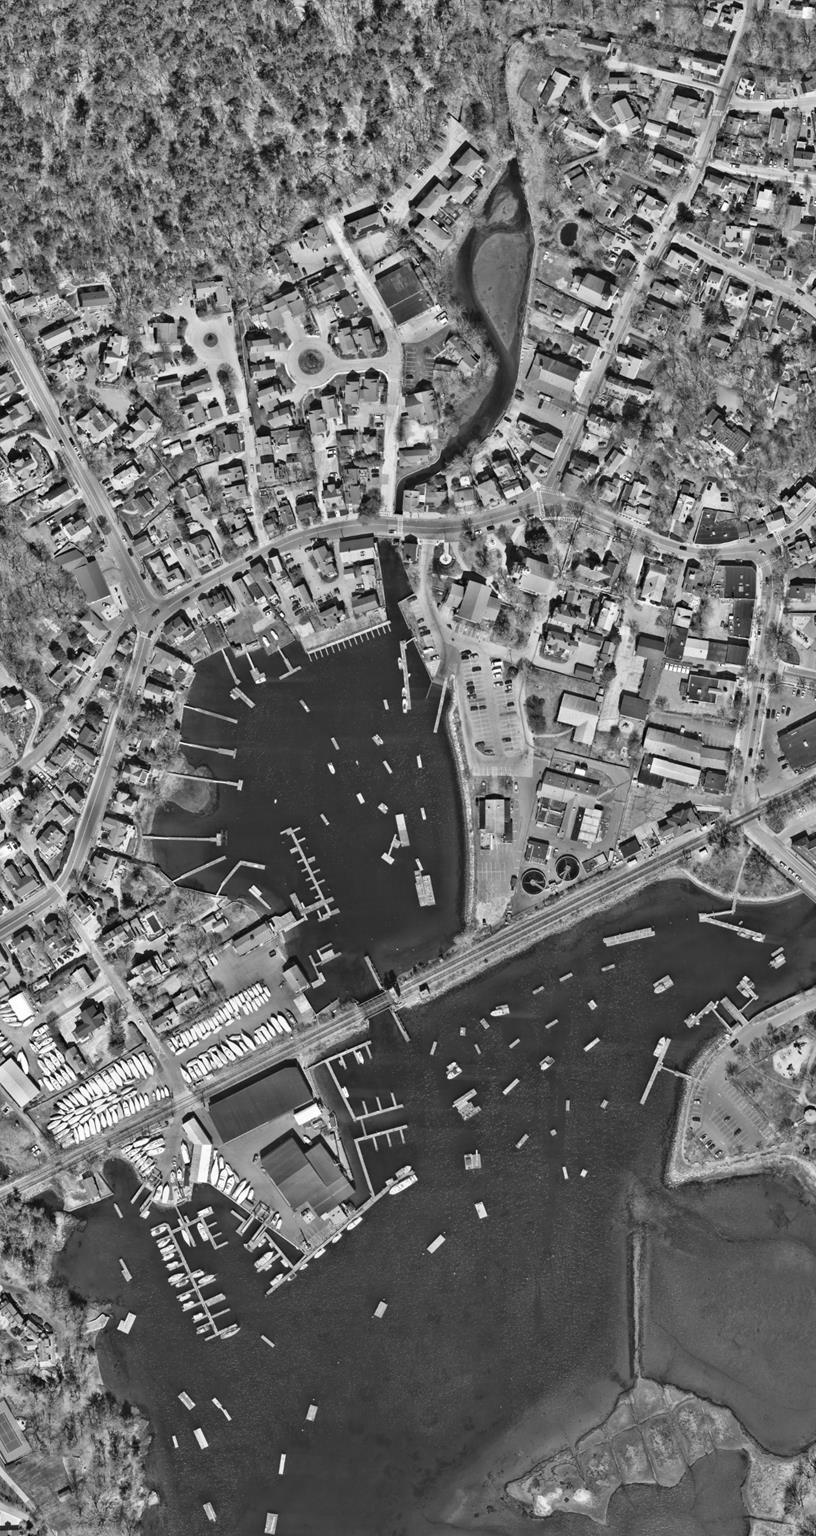
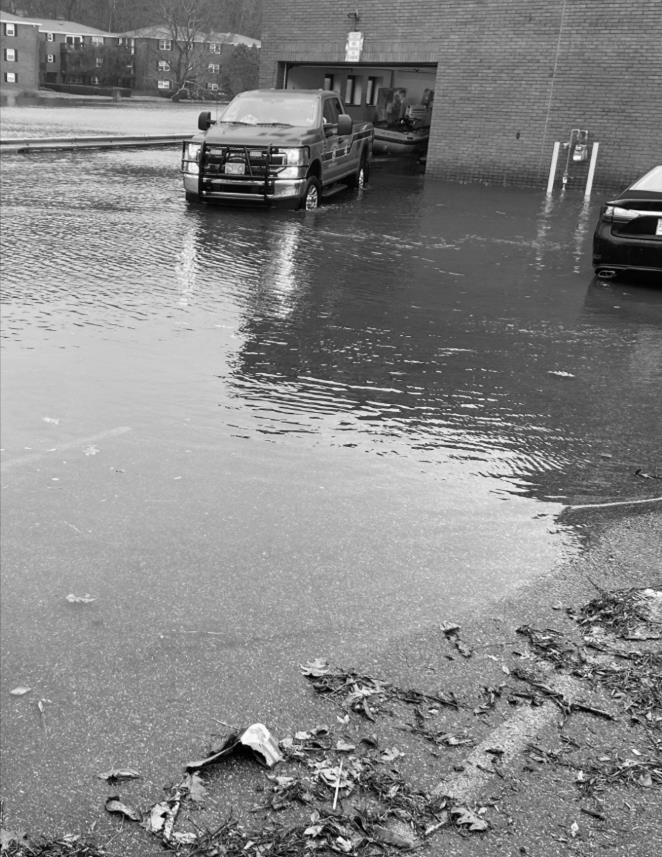
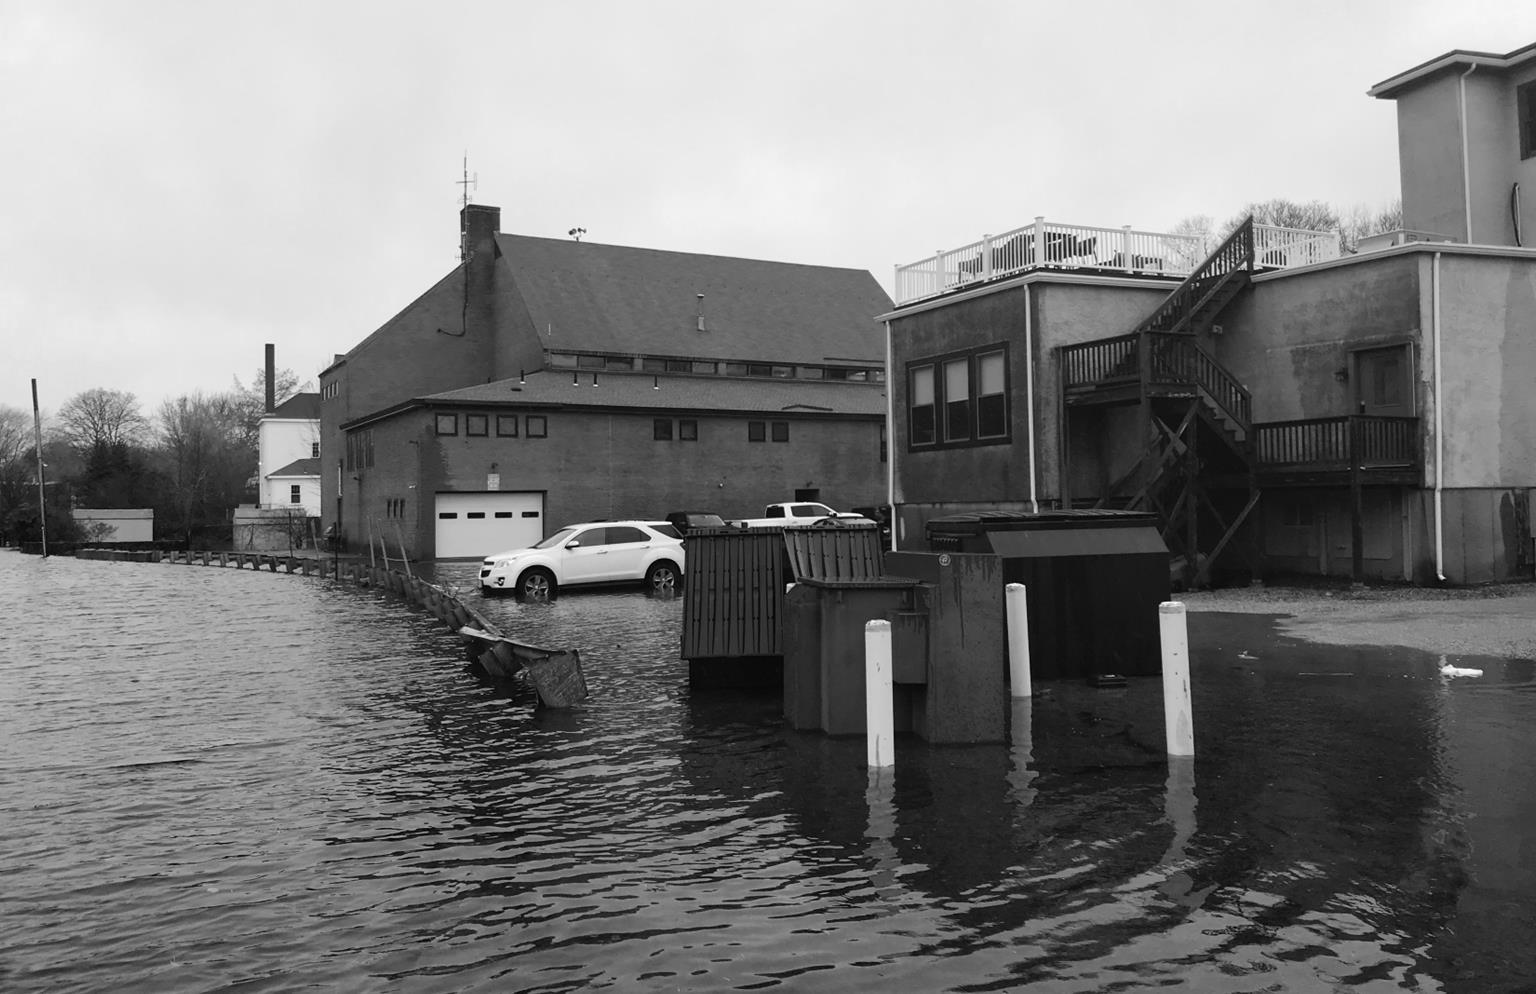
The Town of Manchester-by-the-Sea (“Manchester”) experiences frequent coastal flooding in the downtown core and inner harbor putting much of the Town’s critical infrastructure at risk. Storms, like the December 23, 2022 storm1 that occurred at the outset of this planning project, have resulted in widespread flooding in the area – especially around Town Hall, the Police and Fire Stations, and the Wastewater Treatment Plant (WWTP) (see Figure 1).
With the support of a Coastal Resilience Grant from the Office of Coastal Zone Management (CZM), the Coastal Vulnerability Action Plan was developed as a conceptual roadmap for Manchester to reduce coastal flood risks and increase coastal resilience in the downtown and inner harbor. The plan was formed using a phased approach that started with a review of existing conditions (Section 2) and was followed by completing an updated vulnerability assessment (Section 3) and establishing targeted, action-oriented mitigation measures at the site- and neighborhood-scale for short-, medium-, and long-term planning scenarios (Section 4).
Stakeholder and community engagement were central to guiding the development of the plan, as community feedback and priorities were incorporated into each stage of the planning process.
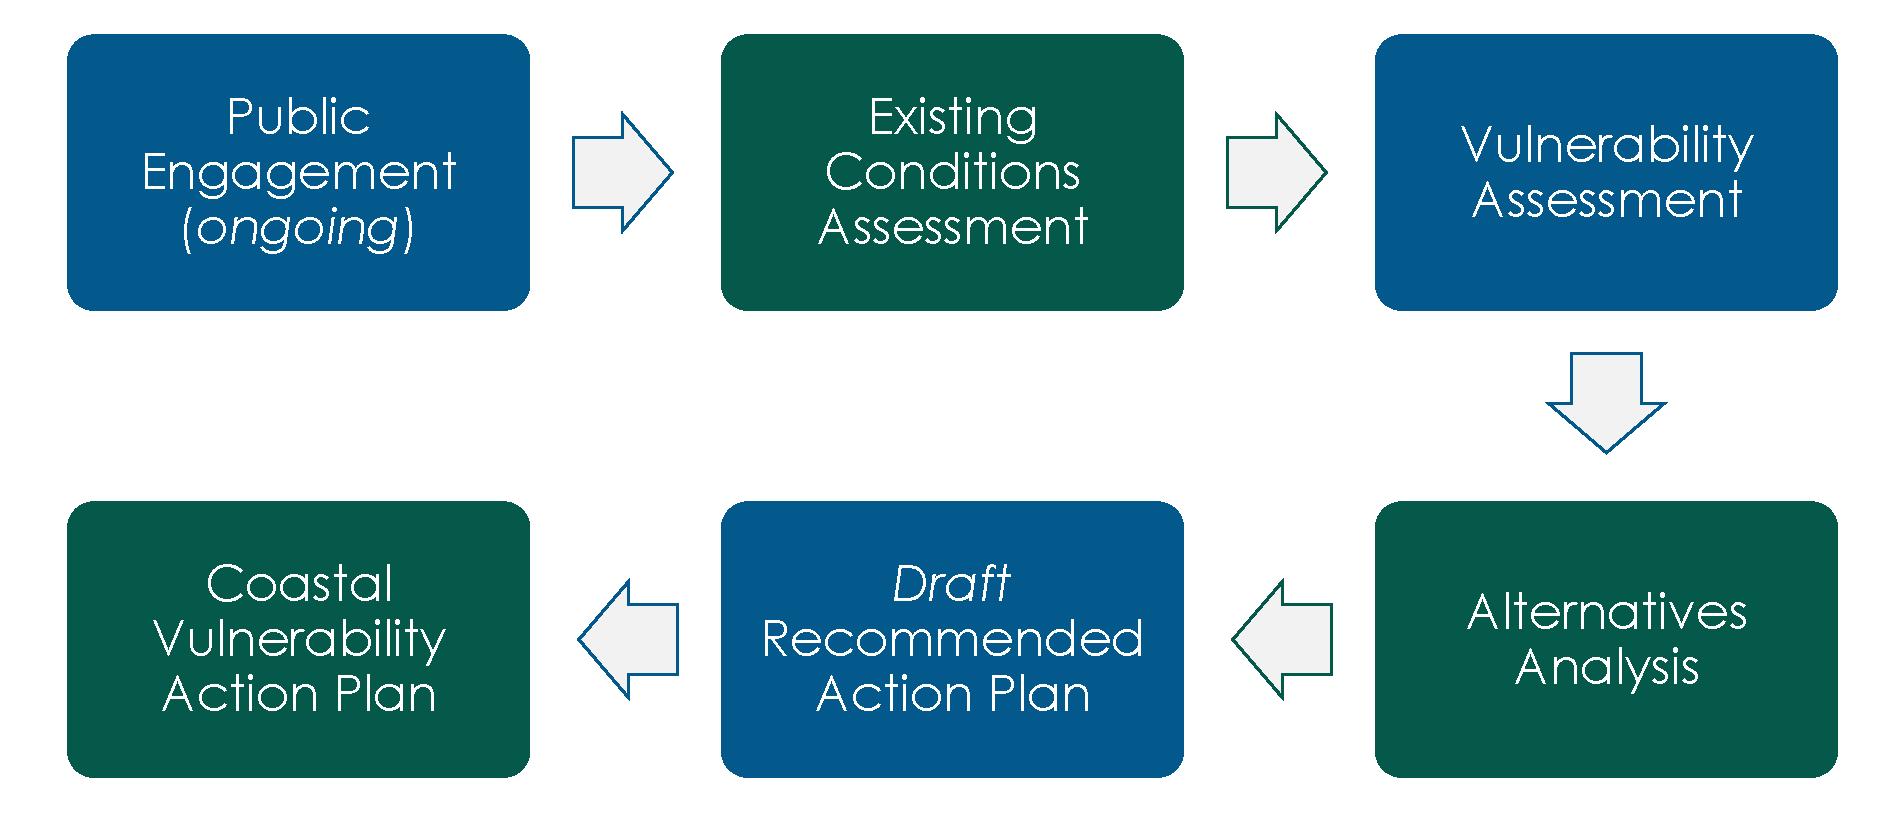
1 The December 23, 2022 storm produced the eighth highest water level on record at the nearby Boston Harbor tide gauge (Station 8443970) and a water level of 8.3 feet (ft) NAV88 in Manchester Harbor.The planning process began in December 2022 with a project kick-off meeting where members of the public were invited to learn about the project, the phased approach being implemented to develop the plan (see Figure 2), and ways to get involved in the planning process.

During the first phase of the project, the project team completed an existing conditions assessment that consisted of:
• Compiling mapping data and information from past studies on the existing conditions of the downtown and inner harbor area

• Collecting data on past flood elevations in the project area
• Confirming resource area delineations along the harbor edge
• Collecting critical elevation information at first-floor elevations, building entries, and other low points along the harbor
The second phase of the project built upon the 2017 town-wide vulnerability and risk assessment completed as part of the 2017 FEMA Hazard Mitigation Plan Enhancement (Tighe & Bond, 2017), narrowing the focus to the inner harbor and downtown. An updated vulnerability assessment was completed to assess current and future flooding and water surface elevations – along with projected habitat change as a result of sea level rise.
Additionally, GIS-based inundation maps and figures were developed for the 2030, 2050, and 2070 planning horizons, and an asset-
specific assessment was conducted for buildings within the study area. This helped the project team identify and prioritize opportunities to implement flood mitigation strategies over time.
In the next phase of the project, the team identified potential neighborhood-scale and site-scale alternatives for flood risk reduction. Alternatives were developed to maximize the potential of nature-based and hybrid design approaches. And, the phasing of improvements was proposed to match several future climate risk scenarios.
Following an analysis of alternatives, the project team developed a recommended action plan based on the results from the existing conditions assessment, vulnerability assessment, alternatives analysis, and feedback received throughout the project.
As was noted earlier, stakeholder and community engagement were central to guiding the development of the plan. During each phase of the planning process, the project team hosted public engagement meetings to keep the community apprised of progress on the plan and solicit additional feedback and input.2
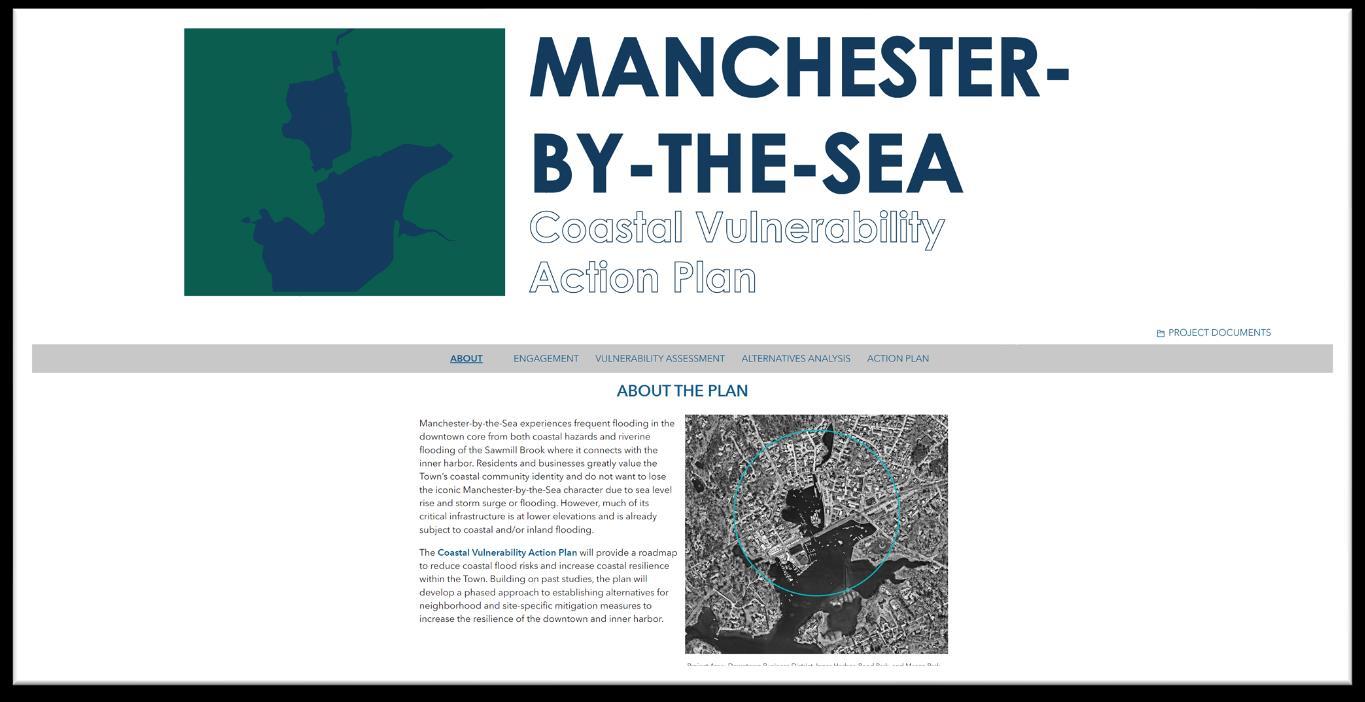
At the start of the planning process, the project team launched a project website (https://tinyurl.com/MBTS-CVAP), which was used throughout the project to provide regular updates on the development of the plan (see Figure 3).
With help from Town staff, a Steering Committee was also formed towards the start of the project to help guide the development of the plan. The committee was comprised of community members and representatives of Town boards, committees, and local organizations. Members included:
Jim Brown Downtown Improvement Committee
Chris Comb Harbor Advisory Committee
Rosemary Costello Historic District Commission
Ann Harrison Select Board
Jessica Lamothe Stream Team
Henry Oettinger Conservation Commission
Laura Tenny Planning Board
Barbara Warren Salem Sound Coastwatch
Flyers (see Figure 4) and other notices were also used throughout the project to make community members aware of the plan and related activities (e.g., critical elevations surveys, site visits, project meetings).
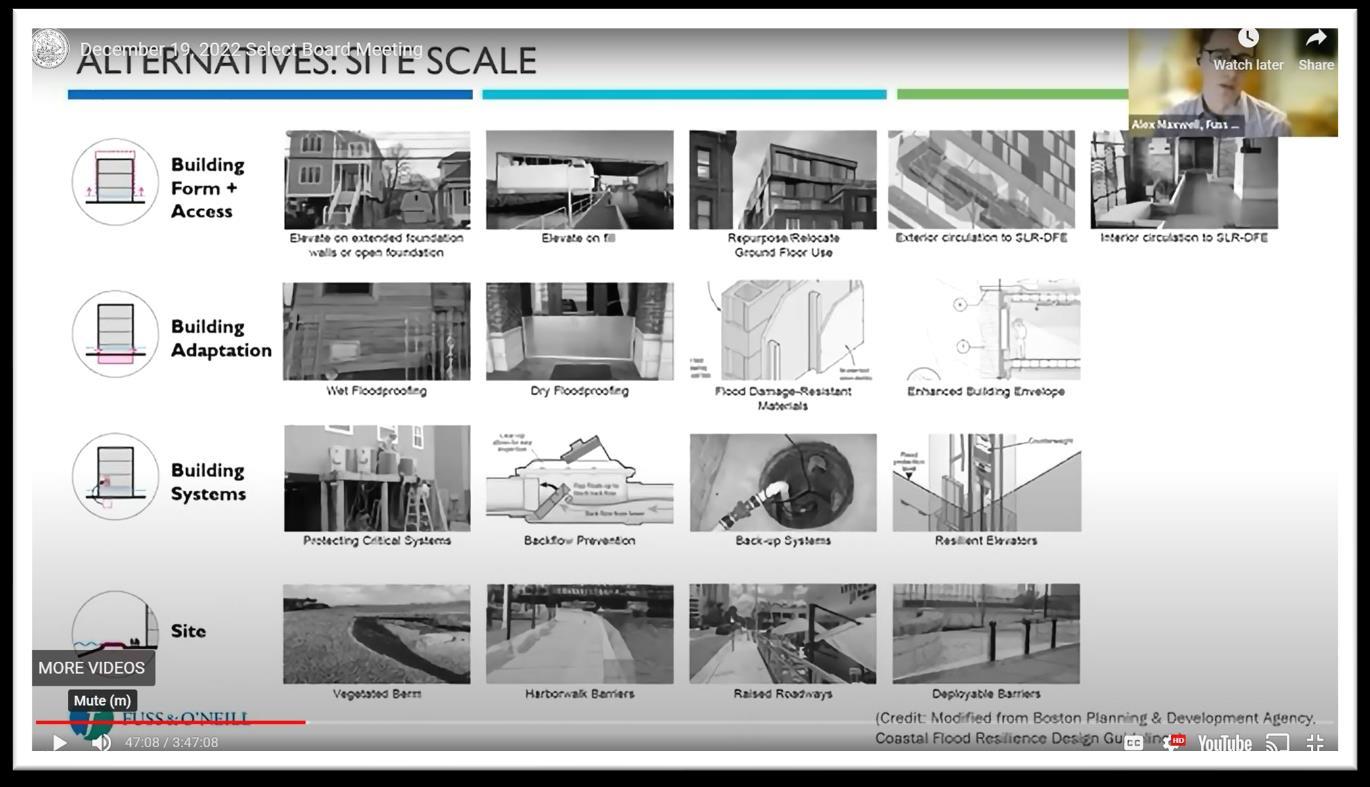
2 For more information on the stakeholder meetings, public meetings, and other community engagement activities, including links to meeting recordings (see Figure 5) and copies of project presentations, please visit the “Engagement” page of the project website.
Data collection
Resource area delineation
Critical elevation survey

The project team started the planning process by collecting mapping data and information from past studies on the existing conditions of the downtown and inner harbor area. The data that was collected and reviewed included:
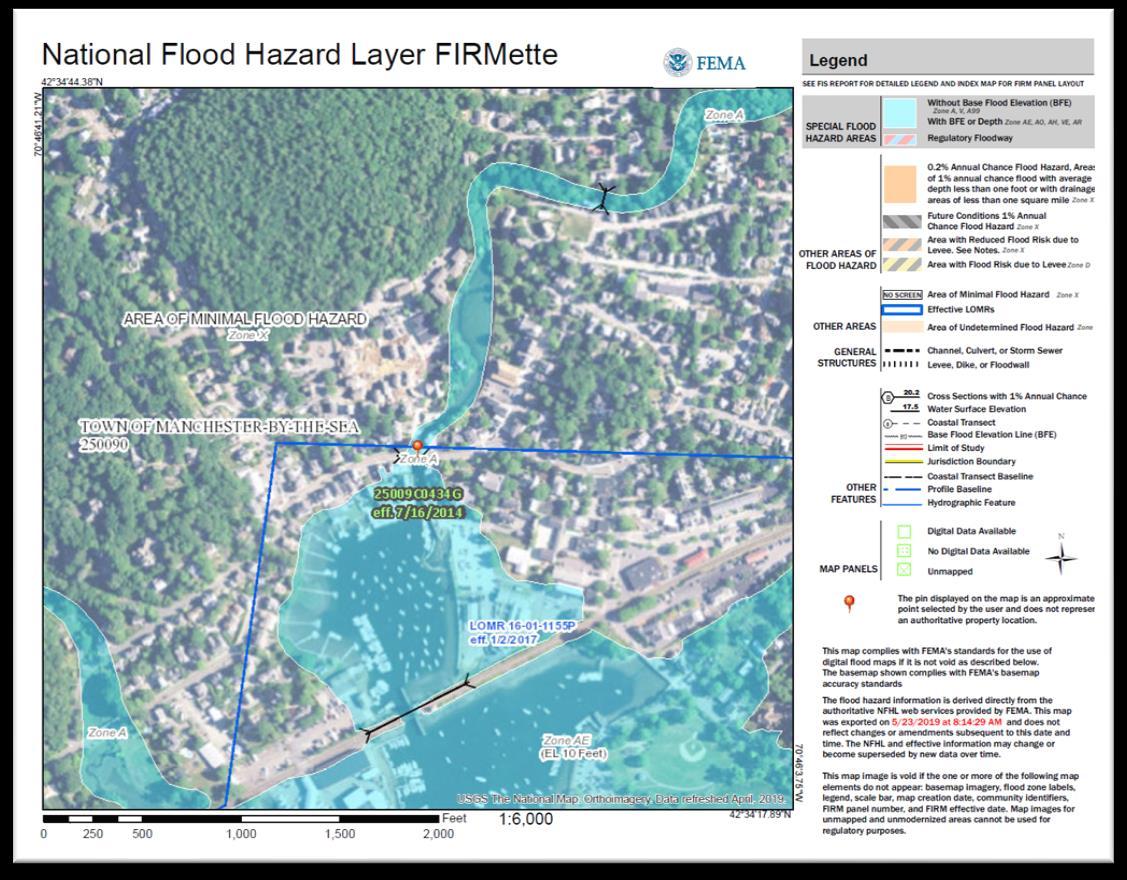
• Federal Emergency Management Agency (FEMA) flood mapping
• Past town-wide vulnerability studies and community resilience reports

• Updated hazard mitigation plans

• Threatened and endangered species fact sheets and prior coastal resource area delineations
• Previous feasibility studies on the Sawmill Brook tide gate removal
• Historical permitting and regulatory approvals documentation
• Previous assessments of the wastewater treatment plant (WWTP)
• Recent athletic fields master plan
A summary of the complete list of data collection references is included in Appendix A. Note: Additional references were collected during later phases of the planning process and are summarized in Section 5.
Coastal resource area delineations are an important first step in many coastal resilience planning projects, as they help establish the location and size of important environmental features for compliance with coastal regulations and protection of their essential functions. Coastal resource areas, such as salt marshes, coastal banks, beaches, and dunes, contribute to the overall resilience of coastal ecosystems by helping to reduce the risk of storm damages, providing critical habitats, and also supporting commercial, recreational, and education opportunities.
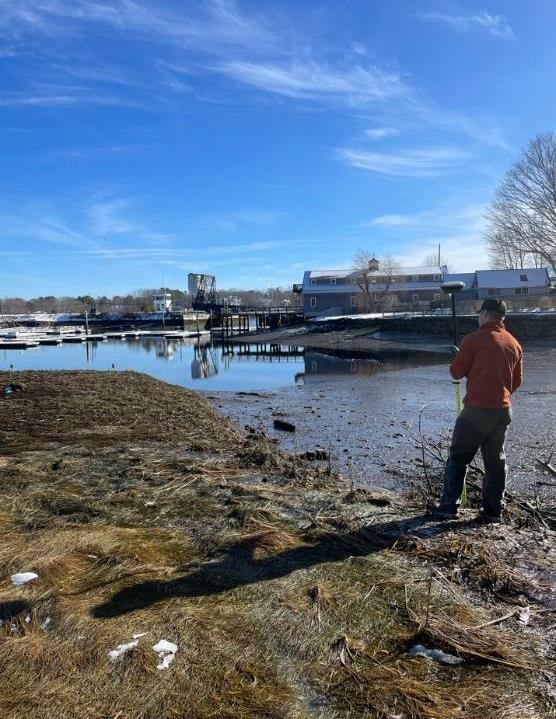
On January 17th, 2023, the project team conducted a site visit (see Figure 6) of Manchester’s inner harbor to review and build upon the coastal resource area delineation conducted by Rimmer Environmental Consulting (2015).

During the site visit, it was determined that the collection of additional survey points was warranted for a more robust resource delineation. The January 2023 survey extended the previous 2015 survey from the point of land located west of the parking area in Masconomo Park (Masconomo Point) north around the upper basin of Manchester Harbor, terminating at the pocket beach west of Crocker’s Boat Yard. The project team also conducted additional reconnaissance along the southern shore of Masconomo Park but did not formally delineate the resource areas along this shoreline, as it was out of the scope of this project.


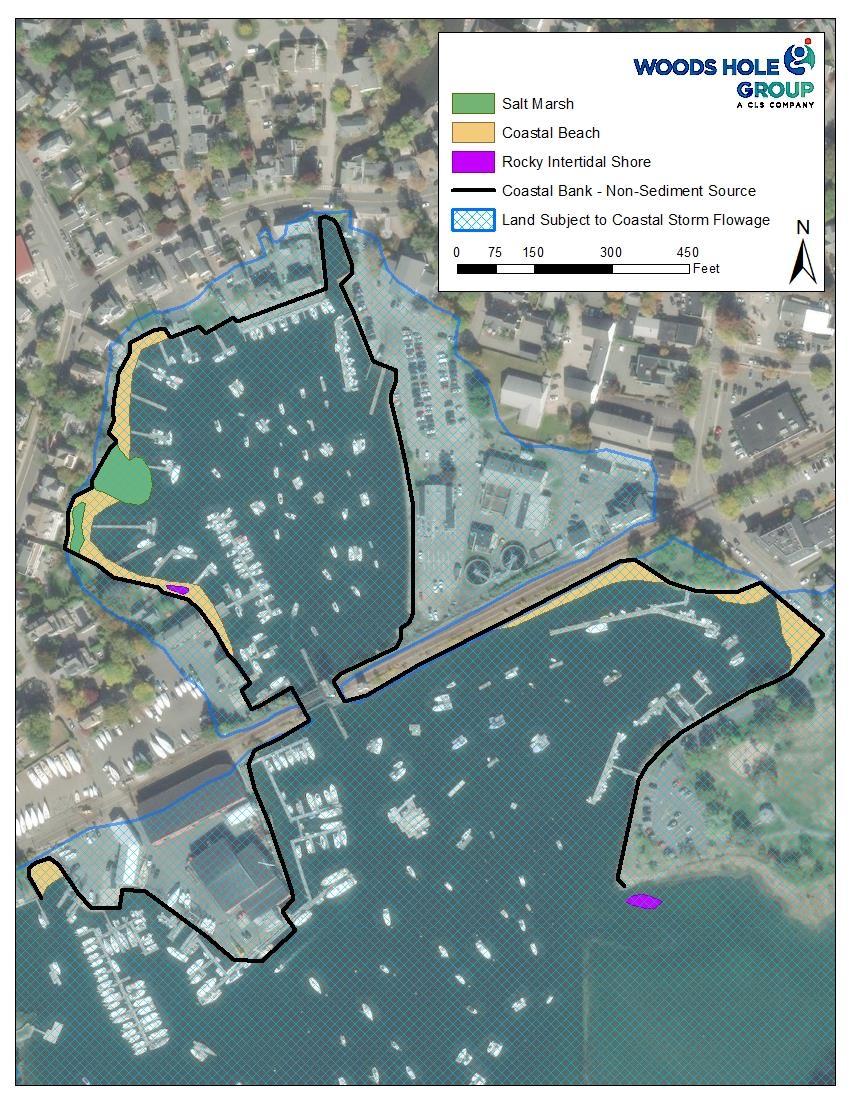
Coastal resource areas surveyed in the field included coastal bank, coastal beach, salt marsh, and rocky intertidal shore, and site photos and point data were reviewed by a professional wetland scientist to confirm the extents of all field delineations. Land Subject to Coastal Storm Flowage was also mapped as part of the assessment using data from the FEMA Flood Map Service Center. Figure 7 shows an overview of resource area extents.
For the complete report on the coastal resource area delineation, please see Appendix B.
Figure 6: Photo of field team collecting additional survey points during January 2023 site visit Figure 7: Aerial image showing resource areas delineated along the shoreline of the upper basin of Manchester Harbor up to Masconomo Point
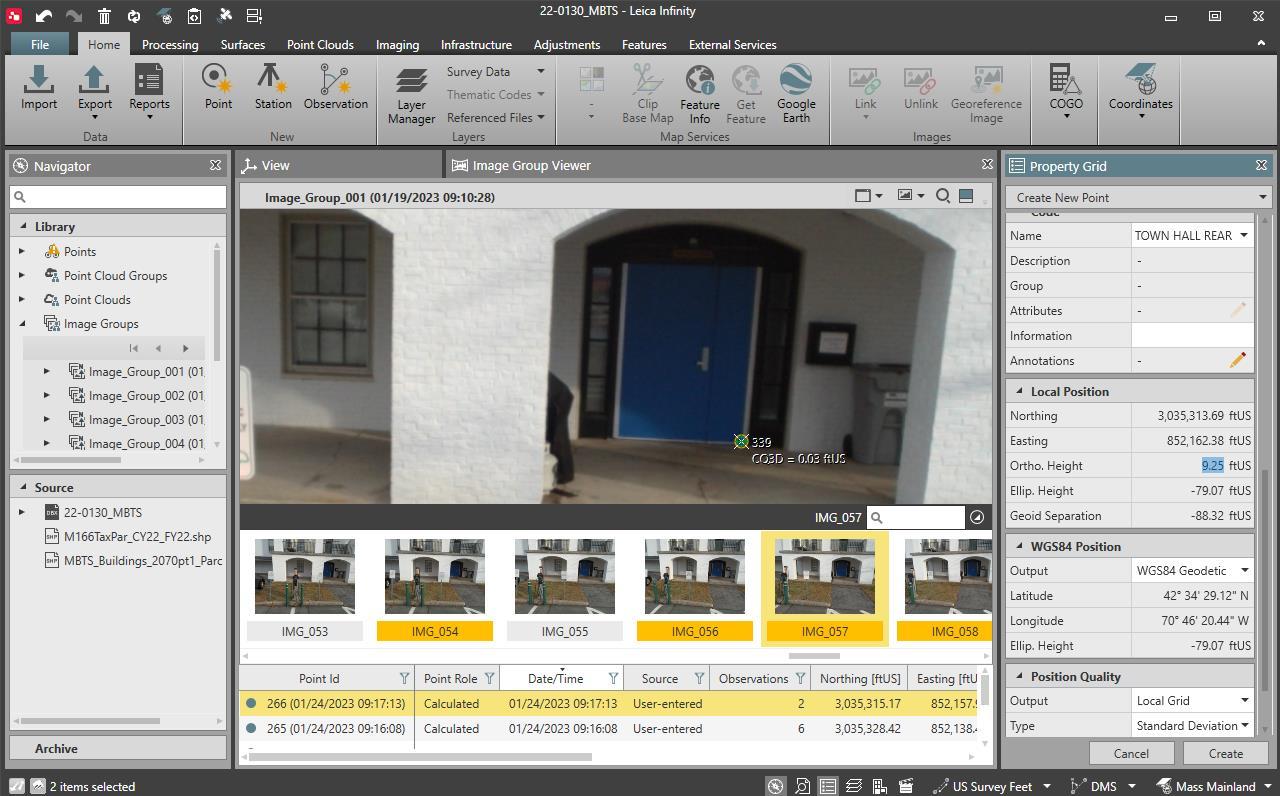
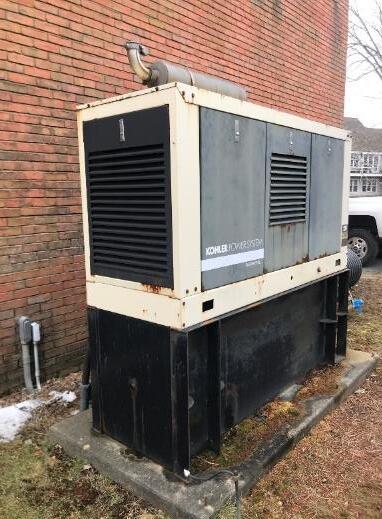
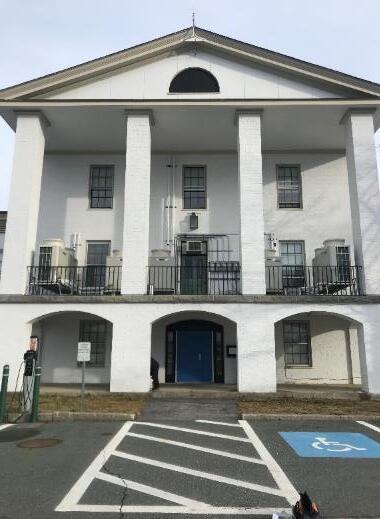
Over the course of January 19th and 23rd, 2023, the project team conducted a critical elevation survey for all buildings within the project area. Elevations of finished first floors, critical exterior infrastructure (e.g., generators), basement windows, or other possible flood entry points (see Figure 8) were surveyed using a Real-Time Kinematic Global Positioning System (RTK-GPS) and in-field measurements. The RTK-GPS was also coupled with a camera capable of scanning buildings, allowing the team to collect highly accurate elevation position measurements at points of interest from an elevation point cloud using the Leica Infinity software (see Figure 9).

The elevations gathered during the critical elevation surveys were compiled into a list of vulnerable elevations specific to each building within the project area. These critical elevations were then compared to future projected storm surge water surface elevations, and individual buildings were then assigned a critical elevation exceedance probability level based on the highest probability (and lowest intensity) storm that would exceed that building’s critical elevation as part of the updated vulnerability assessment.
 Figure 9: Snapshot of elevation point cloud analysis
Figure 8: Images showing examples of critical elevations from within the Manchester inner harbor study area, including the lower-level entry to Town Hall (left), a generator (center), and bulkhead door (right)
About the vulnerability assessment
Massachusetts Coast Flood Risk Model (MC-FRM)
Tidal flooding

Storm surge inundation
Vulnerability assessment
Marsh migration
During the next phase of the planning process, an updated vulnerability assessment was completed by coupling the information gathered during the review of existing conditions with tide gauge data collected in the field and probabilistic hydrodynamic models to develop maps showing future projected coastal flood risks. While a town-wide vulnerability and risk assessment was completed several years ago as part of the 2017 FEMA Hazard Mitigation Plan Enhancement (Tighe & Bond, 2017), this vulnerability assessment was an opportunity to update that assessment using more recently developed flood risk information and narrow the focus to coastal flooding in the inner harbor and downtown area.

The vulnerability assessment completed during this phase of the planning process assessed current and future projected flooding conditions and water surface elevations – along with projected habitat change as a result of sea level rise. Guided by outputs from the Massachusetts Coast Flood Risk Model (MC-FRM) and local tide gauge data, GIS-based inundation maps and figures were developed for the 2030, 2050, and 2070 planning horizons, and an asset-specific assessment was conducted for buildings within the study area. Additionally, the Massachusetts Sea Level Affecting Marshes Model (SLAMM) was consulted to investigate potential future changes to tidal marsh habitat types and locations as a result of projected sea level rise.
This updated vulnerability assessment later helped the project team identify and prioritize potential opportunities for improving coastal resilience and implementing phased flood mitigation strategies in Manchester’s inner harbor. For a full copy of the vulnerability assessment, see Appendix C.
Image shows high tide flooding near shoreline of Reed Park near the rail lines crossing Beach Street on January 23, 2023.Tidal flooding and sea level rise (SLR) are increasing concerns for many Massachusetts coastal communities, including Manchester.
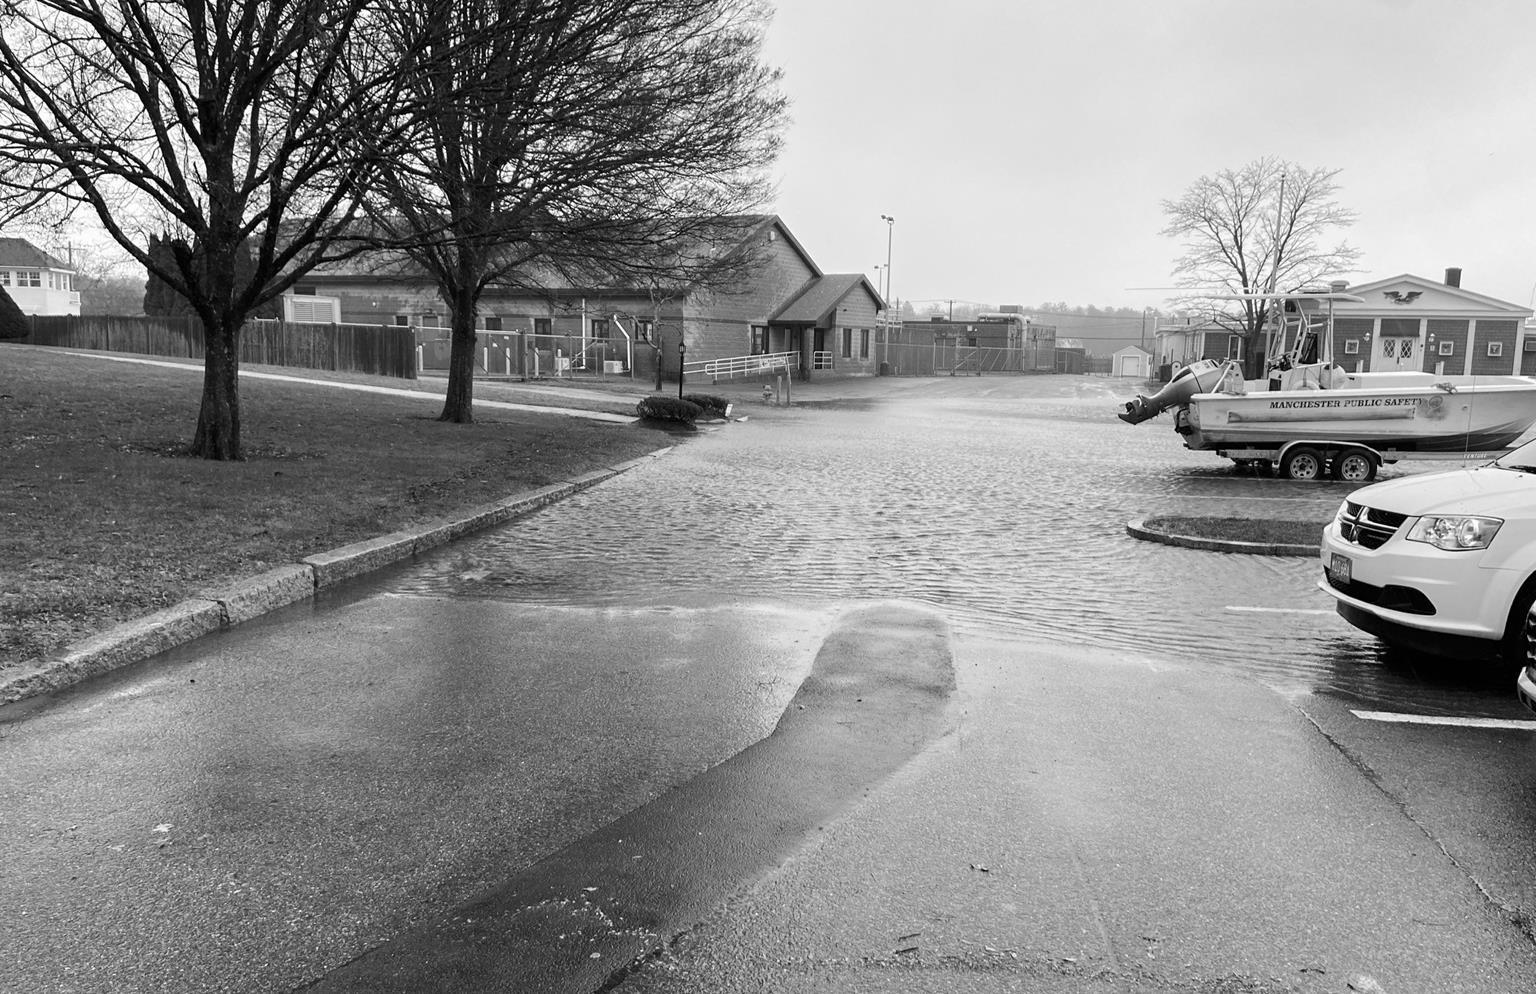 Image shows high tide flooding in Town Hall parking lot facing the WWTP on January 23, 2023.
3. Vulnerability Assessment | 16
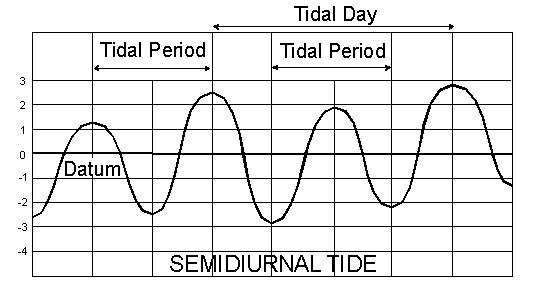
Tidal flooding is influenced by tidal heights that vary throughout the day, month, and year. In Massachusetts, high tides occur twice daily on a semidiurnal tide cycle, with one of the two high tides being higher due to diurnal inequality – a phenomenon caused by the tilt of the Earth in relation to the sun’s and moon’s orbital planes (see Figure 10).

Through the ResilientMA program, the Massachusetts Office of Energy and Environmental Affairs has developed projections of future mean sea level elevation for use in climate change planning that are locally downscaled from global climate models and provide a probabilistic crosswalk for a range of scenarios (DeConto & Kopp, 2017). These scenarios incorporate different modeled greenhouse gas emissions futures and anticipated contributions from global ice sheet melt. The Commonwealth uses the High Scenario for climate change planning. At the nearby Boston Harbor Tide Gauge (Station 8443970), this emissions scenario corresponds to 1.3 feet of additional SLR as soon as 2030, 2.5 feet as soon as 2050, and up to 4.3 feet as soon as 2070 (see Figure 11).

Note: Use of the High Scenario is deliberately conservative with respect to future emissions mitigation policies and actions that may slow the rate of sea level rise. 3 This ensures that planning measures are not under-predicting future sea levels. These sea level rise projections are used to assess potential high tide flooding over time and are also incorporated into the MC-FRM storm surge model. Upon continued observation and monitoring, SLR projections can be updated and used more flexibly over time to align with more likely scenarios.
3 The latest sea level rise scenarios from the National Oceanic and Atmospheric Administration (NOAA) present the 50th percentile confidence interval (Sweet et al., 2022), while the Massachusetts (MA) crosswalk generally presents projections associated with much higher not to exceed confidence intervals (95-99%). The MA High Scenario is similar to the 83rd percentile of NOAA's High Scenario and the Intergovernmental Panel on Climate Change (IPCC) Sixth Annual Report’s "low-likelihood, high-impact" scenario (IPCC, 2023). The MA Intermediate Scenario is similar to the 83rd percentile of NOAA's Intermediate Scenario.
 Figure 11: Massachusetts Executive Office of Energy and Environmental Affairs (EEA) probabilistic sea level rise projections: MC-FRM North (DeConto & Kopp, 2017)
Figure 10: Distribution of tidal phases (NOAA, 2023)
As mentioned earlier in the plan, the MC-FRM incorporates SLR projections and generates future tidal benchmarks, including mean higher high water (MHHW) water surface elevations, for 2030, 2050, and 2070, providing decision-makers with information on areas that may be most impacted by tidal flooding in the future. Water surface elevations (WSEs) from the MC-FRM are reported in feet (ft) above the North American Vertical Datum of 1988 (NAVD88), and in areas where inlet dynamics and harbor geometry are more complex (e.g., like Manchester’s inner harbor), WSEs can be further refined to the local context through the collection of tidal data.
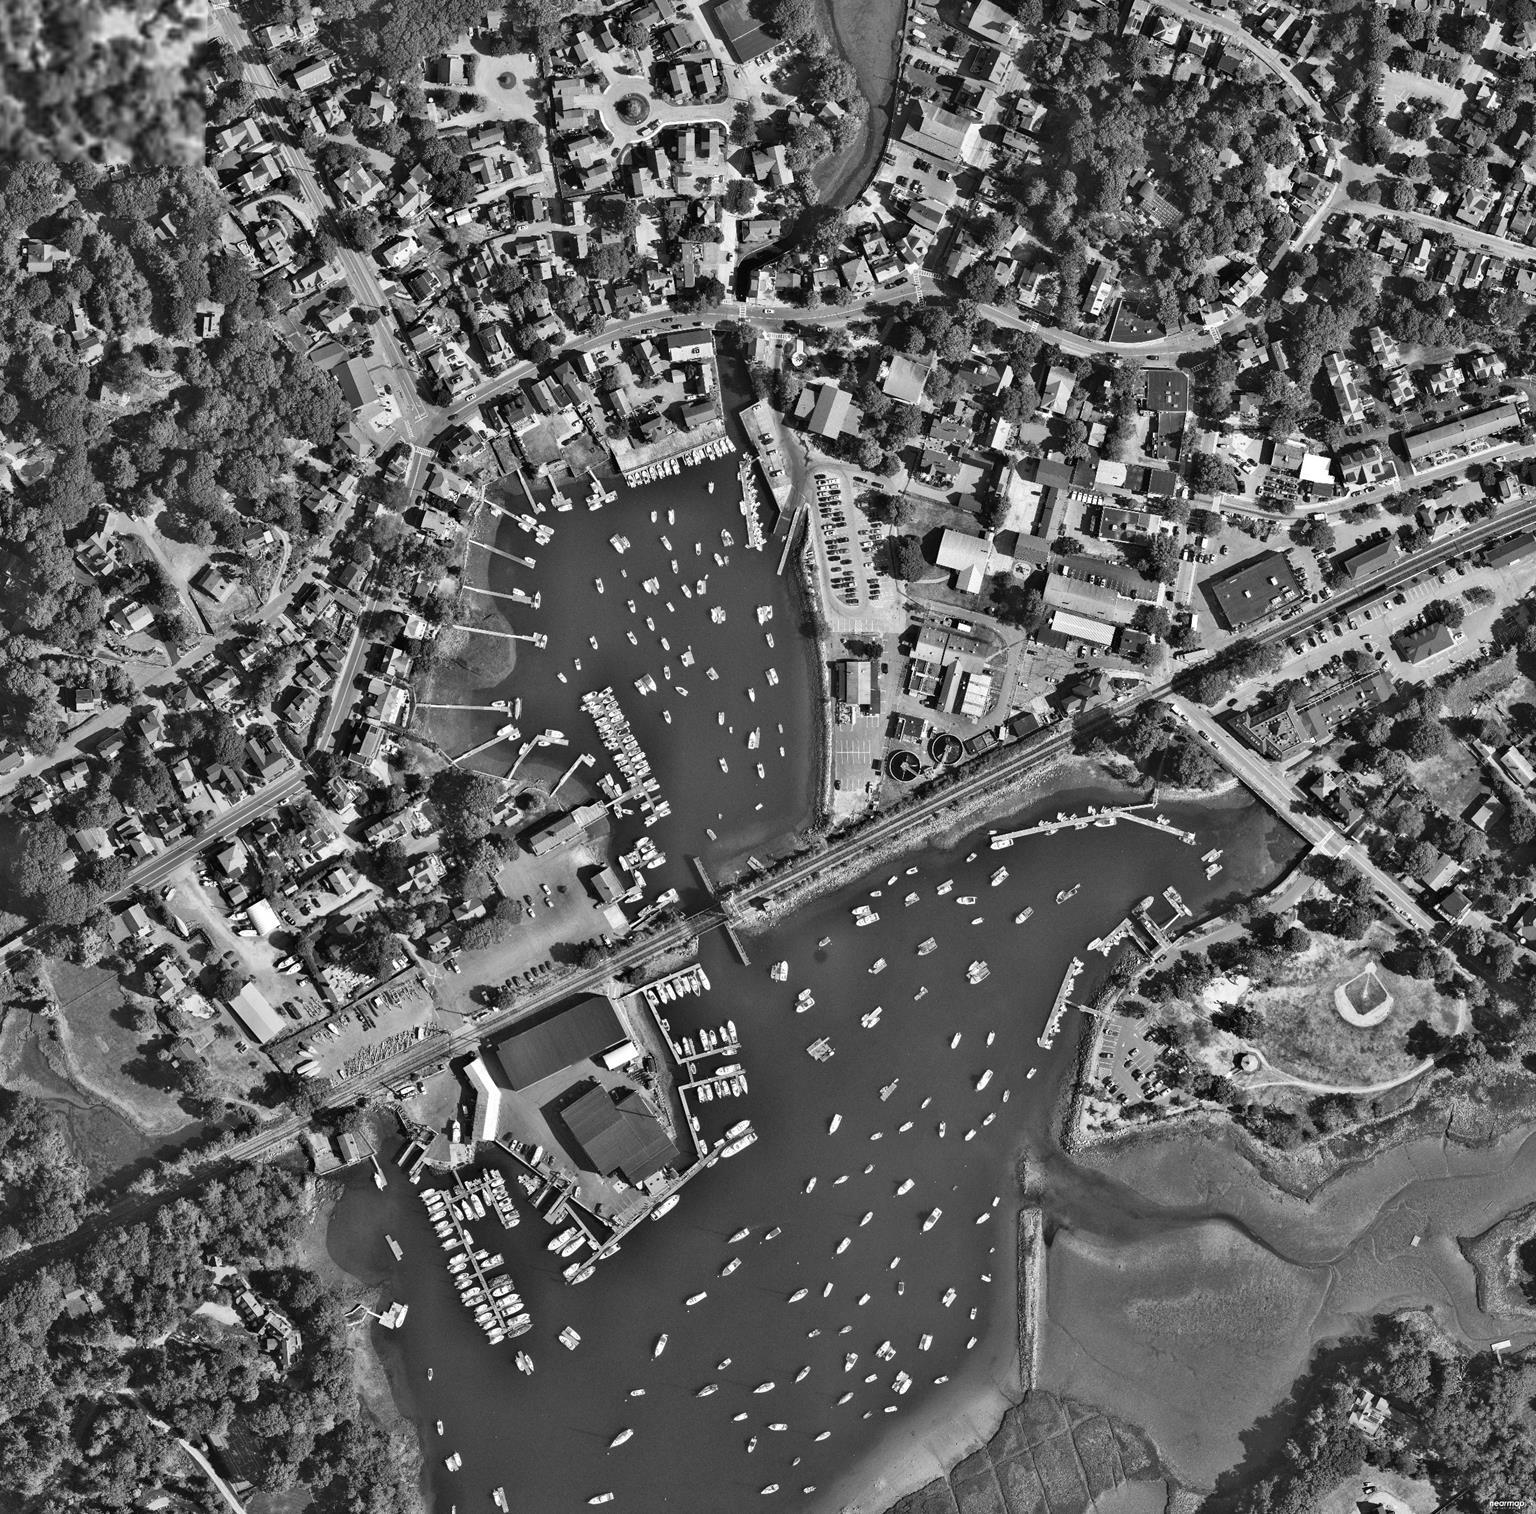
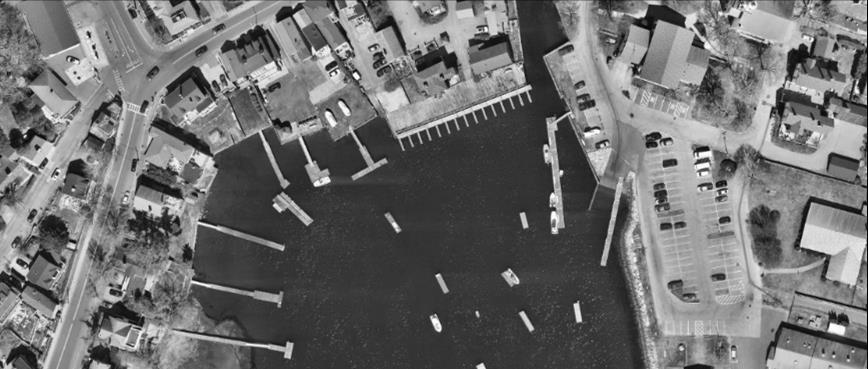
From November 30th, 2022 to January 18th, 2023, the project team deployed tide gauges in Manchester’s inner and outer harbor to capture tidal constituents and locally refine projected tidal benchmarks from the MC-FRM. Refinement of tidal benchmarks is sometimes needed where attenuation may affect local tide heights. Attenuation corresponds to a reduction in the amount of water able to enter an estuary during an incoming tide due to morphological constrictions (e.g., the Bascule Bridge and MBTA rail line), resulting in lower peak water levels.
The mean higher high water (MHHW) is a useful vertical elevation reference that corresponds to the average of all daily higher high tides that occur throughout a 19-year tidal epoch – a period long enough to account for lunar and solar variability.
Outer harbor tide gauge Aerial image showing the location of the local tide gauges deployed in the inner and outer harbor in Manchester, MA Inner harbor tide gauge

The information gathered during the deployment of the tide gauges (see Figure 12 and Figure 13) established that the Bascule Bridge and MBTA rail line do cause minor restrictions to tidal flow into the inner harbor. Therefore, slight adjustments were made to the mean high water (MHW) and mean low water (MLW) tidal benchmarks; however, the attenuation was not significant enough to meaningfully differentiate inner and outer harbor mean lower low water (MLLW) and MHHW. The MC-FRM MHHW tidal benchmarks were determined to be representative of local conditions for the entire study area in Manchester.

Based on MC-FRM projected tidal benchmarks (see Table 1), MHHW in Manchester’s inner harbor could reach 6.2 ft NAVD88 by 2030, 7.5 ft NAVD88 by 2050, and 9.4 ft NAVD88 by 2070. For comparison, the current MHHW datum (1983-2001 epoch) in nearby Boston Harbor is 4.77 ft NAVD88. However, while Boston Harbor is the closest long-term tide gauge station to Manchester, there is still a significant distance between the two locations, which creates uncertainty in utilizing Boston tidal datums in Manchester. Establishing a permanent local tide gauge would allow Manchester to keep track of tidal variations over time and better account for localized SLR. (Note: Installing a local tide gauge is one of the recommended near-term actions included in Scenario 1 on p. 35 of this plan.)
Projected Tidal Benchmarks (elevation in ft. NAVD88)

Using the data collected from the tide gauge deployment and adjusted tidal benchmarks, the project team developed geographic information system (GIS) representations of these projected future MHHW extents (shown on this page) by extracting corresponding elevation contours from the most current terrain elevation measurements available from MassGIS (Bureau of Geographic Information) light detection and ranging (LiDAR) terrain data.
According to sea level rise projections for the Manchester inner harbor study area, most of the project area is likely to remain unaffected by daily tidal flooding in the near-term (2030). However, as soon as 2050, areas of Masconomo Park, paved areas behind Town Hall, southern portions of the Manchester Marine bulkhead, and the back of buildings on School Street along Sawmill Brook are likely to become flooded more regularly. These 2050 patterns of flooding correspond to the conditions observed in the field during recent high tide flooding events (e.g., the January 23rd, 2023 flooding event). And as soon as 2070, the residential areas along Beach Street and Tappan Street, and expanded portions of the inner harbor (including the Town’s wastewater treatment plant) could be affected by (on average once daily) tidal flooding. Outside the inner harbor area, the Town’s Fire Station on School Street could experience tidal flooding in the lower parking lot along Sawmill Brook as soon as 2050, and inundation of the lower portions of the building (including the lower garage and mechanical room) as soon 2070.


The Massachusetts Coast Flood Risk Model (MC-FRM) is a probabilistic hydrodynamic model (see Figure 14) that is used as the standard for coastal climate change planning in the Commonwealth of Massachusetts. Unlike FEMA Flood Insurance Rate Maps (FIRMs) that estimate present flood risk at the 1% annual probability level (100-year return period water level), the MC-FRM statistically evaluates potential future (2030/2050/2070) flood risk across a range of probability levels using state-approved sea level rise scenarios and a large set of historical and projected future hurricane and nor'easter storms. The MC-FRM integrates the effects of wind, waves, tides and land-cover in a more site-specific and integrated physics-based approach to assess the probability of flooding across the Massachusetts coast. 4
With coastal communities throughout the Commonwealth –including Manchester – facing significant risks from rising sea levels and increasingly intense storms due to climate change, the MC-FRM model is a valuable tool for local decision makers in identifying areas that are most vulnerable to coastal flooding. Model outputs provide useful representations of potential future flood impacts, helping Massachusetts communities better understand and prepare for future storms and sea level rise conditions, and ultimately develop more informed strategies to mitigate those risks. Therefore, the MCFRM was the model used in establishing an updated vulnerability assessment for Manchester’s inner harbor during the second phase of the planning process.

For more information about the MC-FRM, see the following webpage for an overview of the model and answers to frequently asked questions: https://tinyurl.com/MCFRMSummary.


4 Data used in generating the MC-FRM are subject to change given the changing climate, and the model may lag behind real-world changes by varying periods of time. However, as mentioned above, the MC-FRM serves as the standard for coastal climate change planning in the Commonwealth and can be updated over time to incorporate new observations and changes in climate change science.
PROBABILISTIC / HYDRODYNAMIC MODEL


FLOOD PROBABILITY
Includes relevant physical processes: sea level rise, tides, storm surge, wind, wave setup / run-up / overtopping, future climate scenarios
Future version to incorporate coastal erosion
FLOOD DEPTH CURRENTS OUTPUTS


FLOOD DURATION

FLOOD VOLUMES

FLOOD PATHWAYS
WINDS WAVES

In addition to SLR, storms – and their corresponding impacts on local water surface levels – are another important factor to consider in assessing coastal vulnerability. Using the MC-FRM, a range of annual probable coastal flood storms were evaluated, along with their associated maximum projected stillwater water surface elevations for the 2030, 2050, and 2070 planning horizons (see Table 2).
Annual exceedance probability (AEP) is the probability that a storm of that magnitude will be met or exceeded within a given year. A storm causing coastal flooding with an AEP of 50% has a 1 in 2 chance of occurring at any point within a given year. For Manchester, in 2030, this AEP corresponds to a storm that will result in a water surface elevation of 7.9 ft (NAVD88).
However, with the likelihood that storms will become more intense and more frequent over time as a result of climate change, it will become more common for storms to result in higher water surface elevations. For example, a storm causing coastal flooding with an AEP of 50% in 2070 in Manchester harbor, is projected to result in a water surface elevation of 10.9 ft – 3 ft higher than 2030 projections. Note: The rear entrance to Manchester Town Hall (10 Central Street) has an elevation of 9.18 ft (NAVD88). This elevation would be exceeded by the water level associated with a 2% AEP in 2030, a 25% AEP in 2050, or a 50% AEP in 2070.

To assess risk of flooding to development, critical elevations collected during the first phase of this project were compared to the projected water surface elevations from the MC-FRM across different time horizons (2030, 2050, and 2070) and for different coastal storm flood probabilities. Individual buildings were then assigned a critical elevation exceedance probability level based on the highest probability (and lowest intensity) storm that would exceed that building’s critical elevation in a given projected year. This information formed the basis for the updated vulnerability assessment.
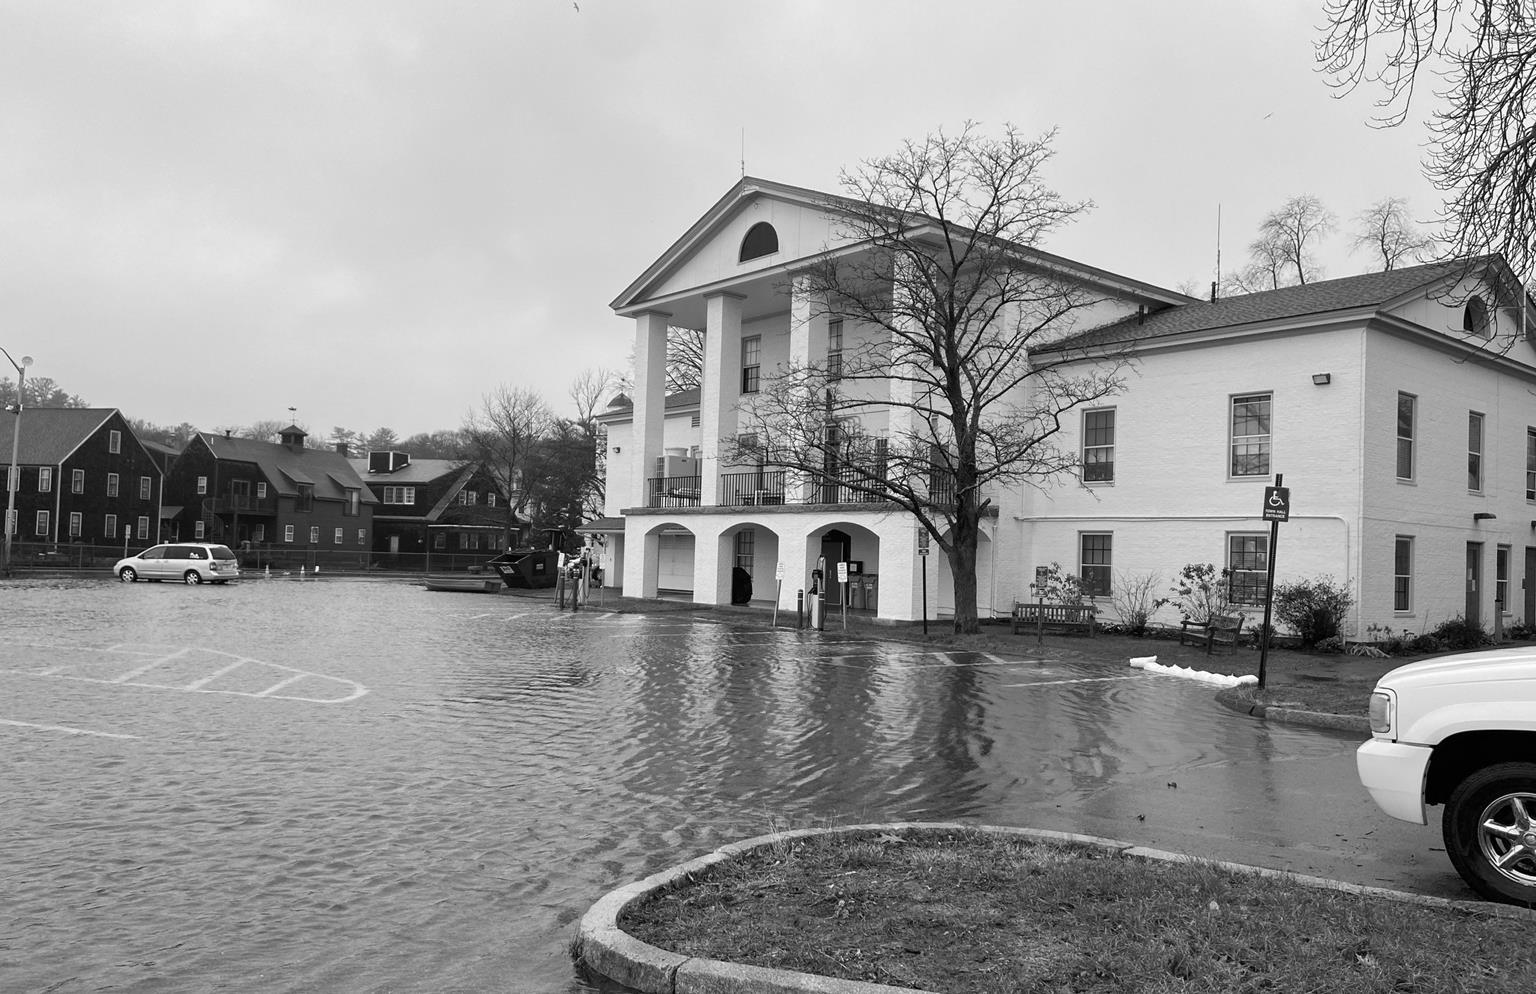 Image shows coastal flooding near Town Hall from December 23, 2022 storm.

In 2030, high elevation areas on the western side of the project area along Central Street, Bridge Street, and Ashland Avenue should remain dry during storms with AEPs of 0.1% or higher. Most of the high elevation areas along Union Street and Beach Street in the middle of the project area will also remain dry. Much of the residential area along the southern part of Beach Street and up Tappan Street is vulnerable to floods with AEPs between 1% and 5%. Clusters of buildings closer to the waterfront also could be susceptible to flooding in 2030. Key buildings for the Town of Manchester within this project area include Town Hall and the Fire Department on School Street (outside the main project area but significant for public safety in the study area and beyond). These buildings fall into the 2% and 25% flood risk categories (respectively), with critical elevations of 9.18 ft (Police Station garage door) and 8.11 ft (rear garage bay) (respectively).
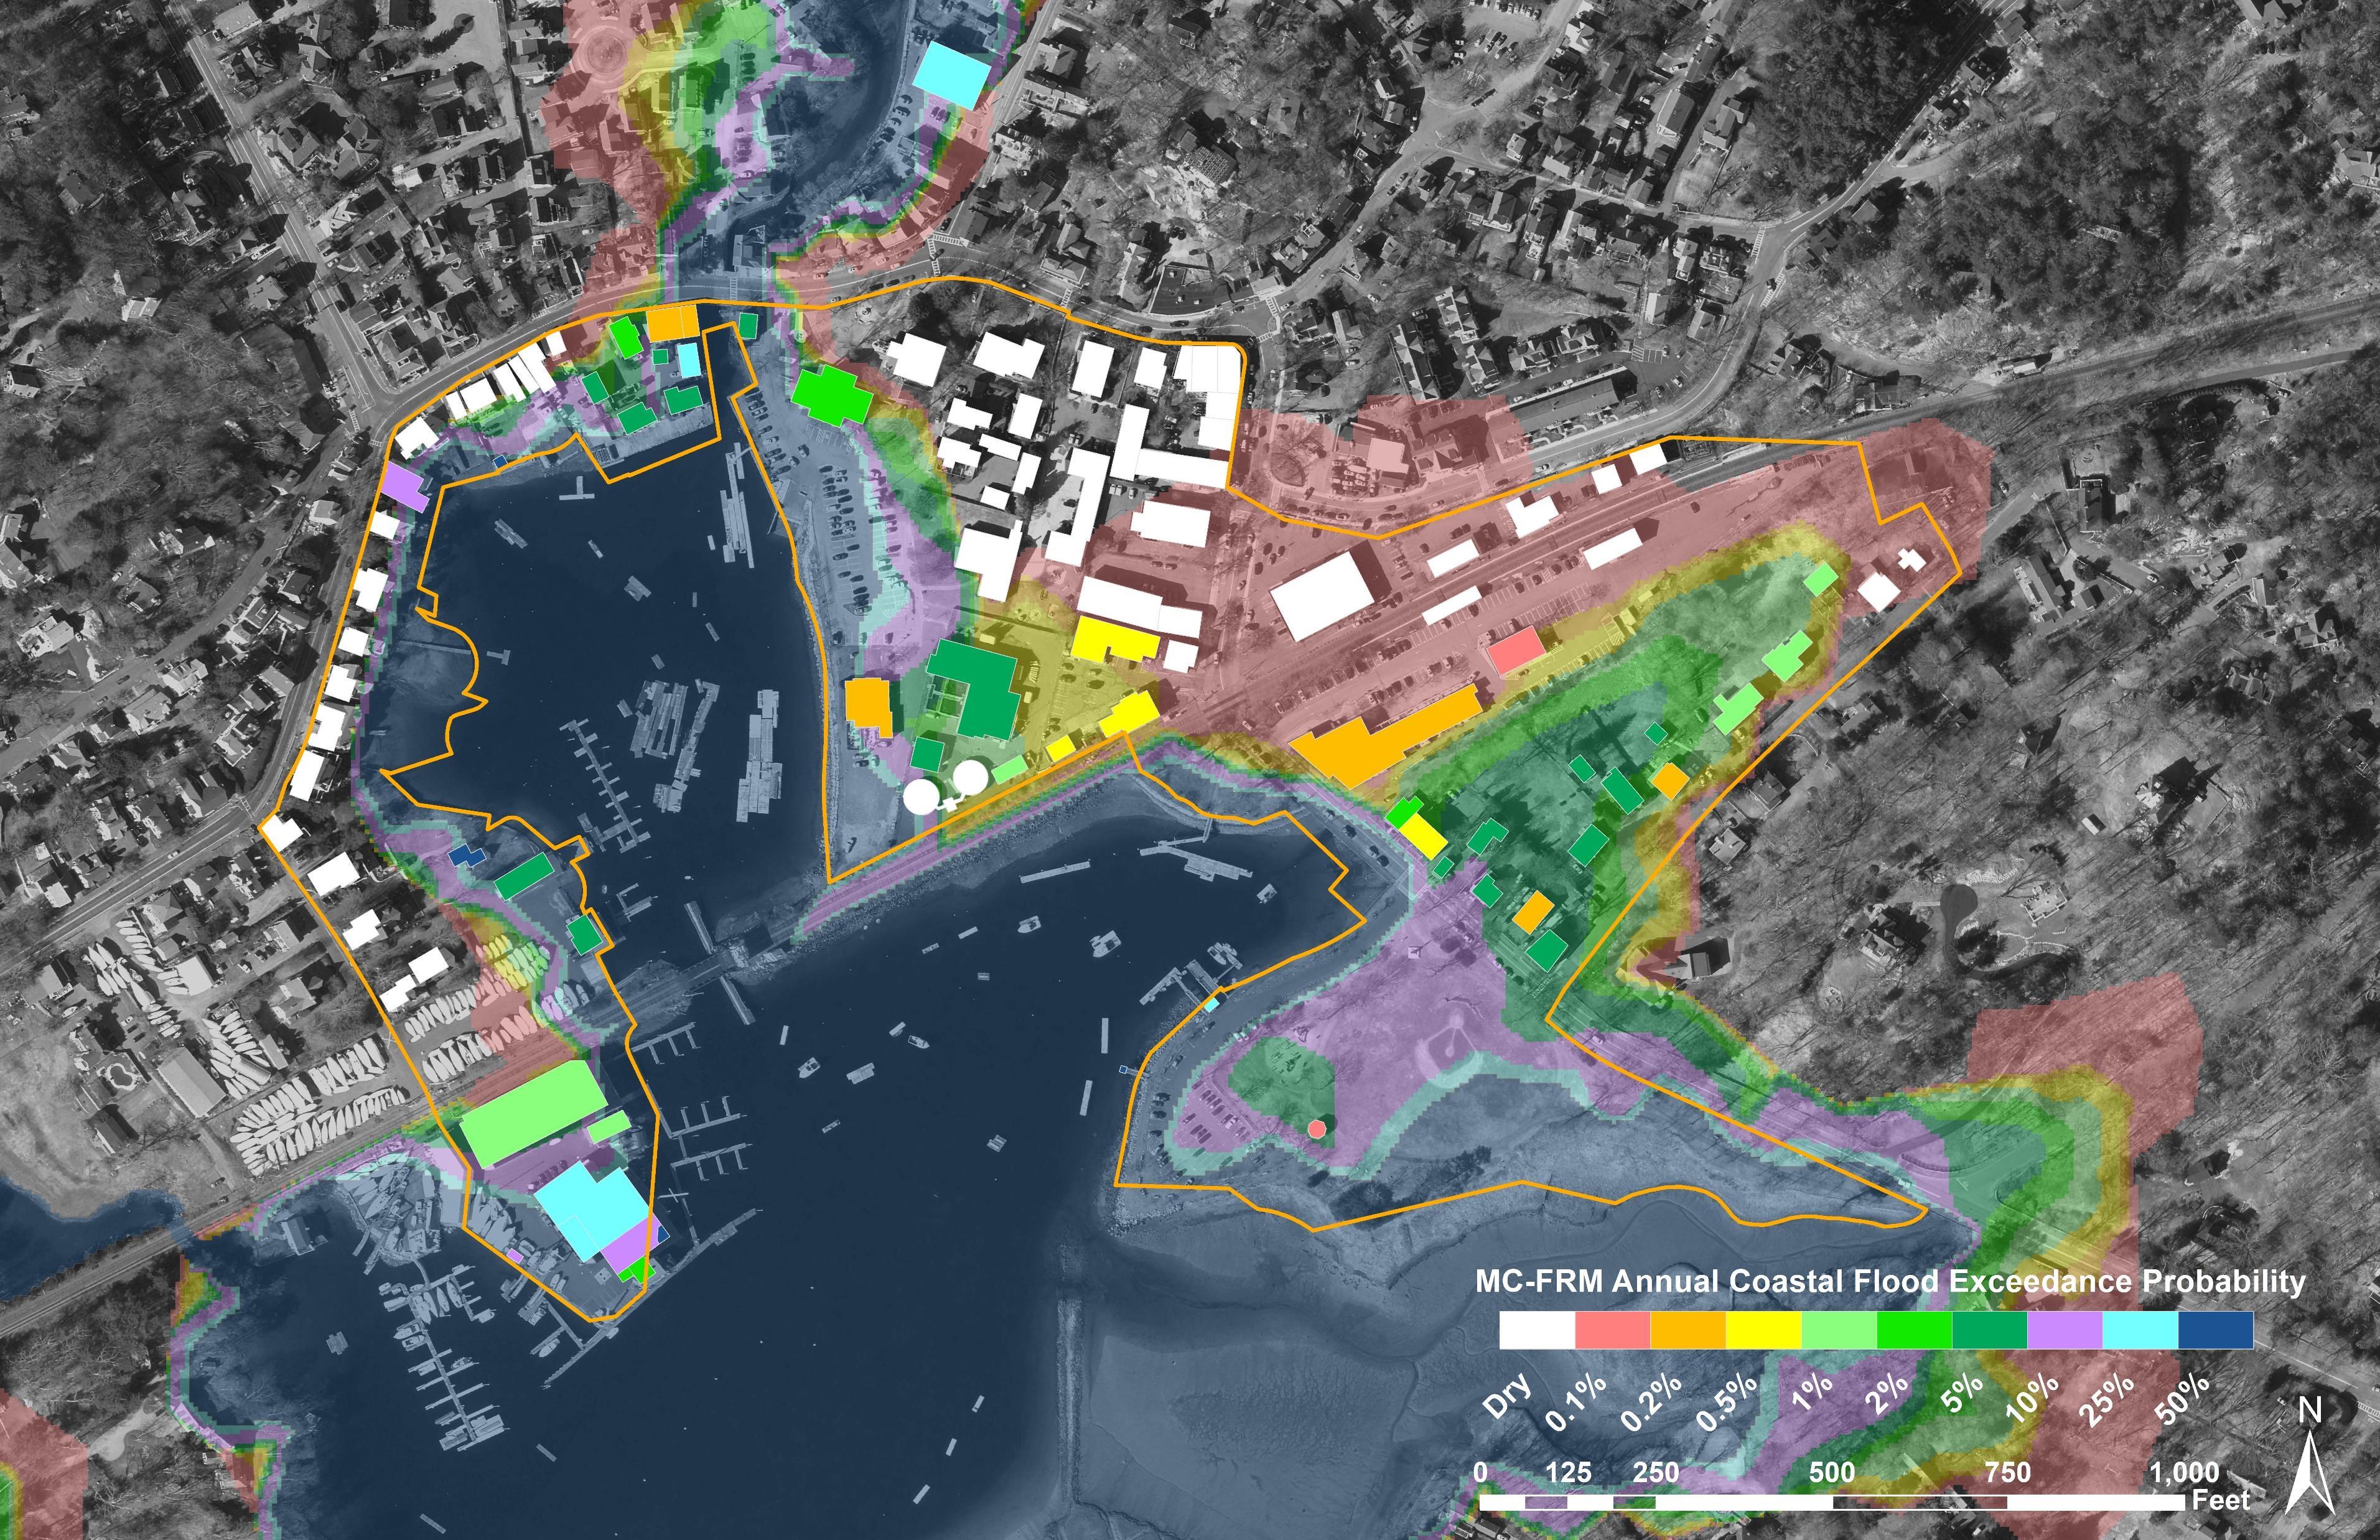

By 2050, most buildings in high elevation areas on the western side and middle of the project area are still not vulnerable to flooding. Much of the residential area along Beach Street and Tappan Street will be even more susceptible to floods, most being vulnerable to floods from storms with AEPs between 10% - 50%. Many buildings closer to the waterfront are projected to be impacted by storms with AEPs of 50%. Town Hall and the Fire Department on School Street would fall into the 25% and 50% flood risk categories (respectively) given their critical elevations of 9.18 ft and 8.11 ft (respectively).


By 2070, some buildings in high elevation areas on the western side and middle of the project area will still remain dry, but fewer than the 2050 time horizon, especially in the commercial area off Beach Street. Nearly the entire residential area along Beach Street and Tappan Street will be susceptible to floods from storms with AEPs of 50%. The majority of buildings closer to the waterfront are projected to be impacted by storms with AEPs of 50%, including the Town Hall, Fire Station, and Wastewater Treatment Plant, which has a critical elevation of 7.88 ft (low point of the odor control system obtained from LiDAR).

Coastal wetland resources – like salt marshes – provide important ecosystem services (e.g., storm protection and wildlife habitat) and are also affected by increasing water levels caused by sea level rise rather than episodic storm events. Wetland plant communities in the coastal zone are adapted to specific tidal ranges and amounts of saltwater inundation. As sea level rises, marsh habitats may be forced to migrate landward to maintain the same level of inundation to which they are adapted. However, barriers such as buildings and roads impede this migration, resulting in potential habitat loss.
The Sea Level Affecting Marsh Migration (SLAMM) model is a tool designed to help predict changes in marsh habitats in response to sea level rise.5 The model incorporates various inputs including LiDAR elevations, wetland classifications, sealevel rise, tide range, and accretion and erosion rates for different habitat types. The model intentionally omits interactions between migrating marsh habitats and physical barriers (e.g., roads, buildings, and other impervious surfaces) to help visualize how and where wetlands would migrate in natural conditions.
The SLAMM model was used as part of the vulnerability assessment to help to identify potential strategic areas throughout Manchester’s inner harbor area for impervious surface removal to facilitate marsh migration.

5 The Massachusetts Office of Coastal Zone Management (CZM) commissioned a statewide modeling project using SLAMM to address potential impacts of sea level rise on marsh systems. More information on marsh migration modeling methodology can be found in the "Modeling the Effects of Sea-Level Rise on Coastal Wetlands" report at https://www.mass.gov/files/documents/2018/12/07/czmslamm-report-nov2016.pdf
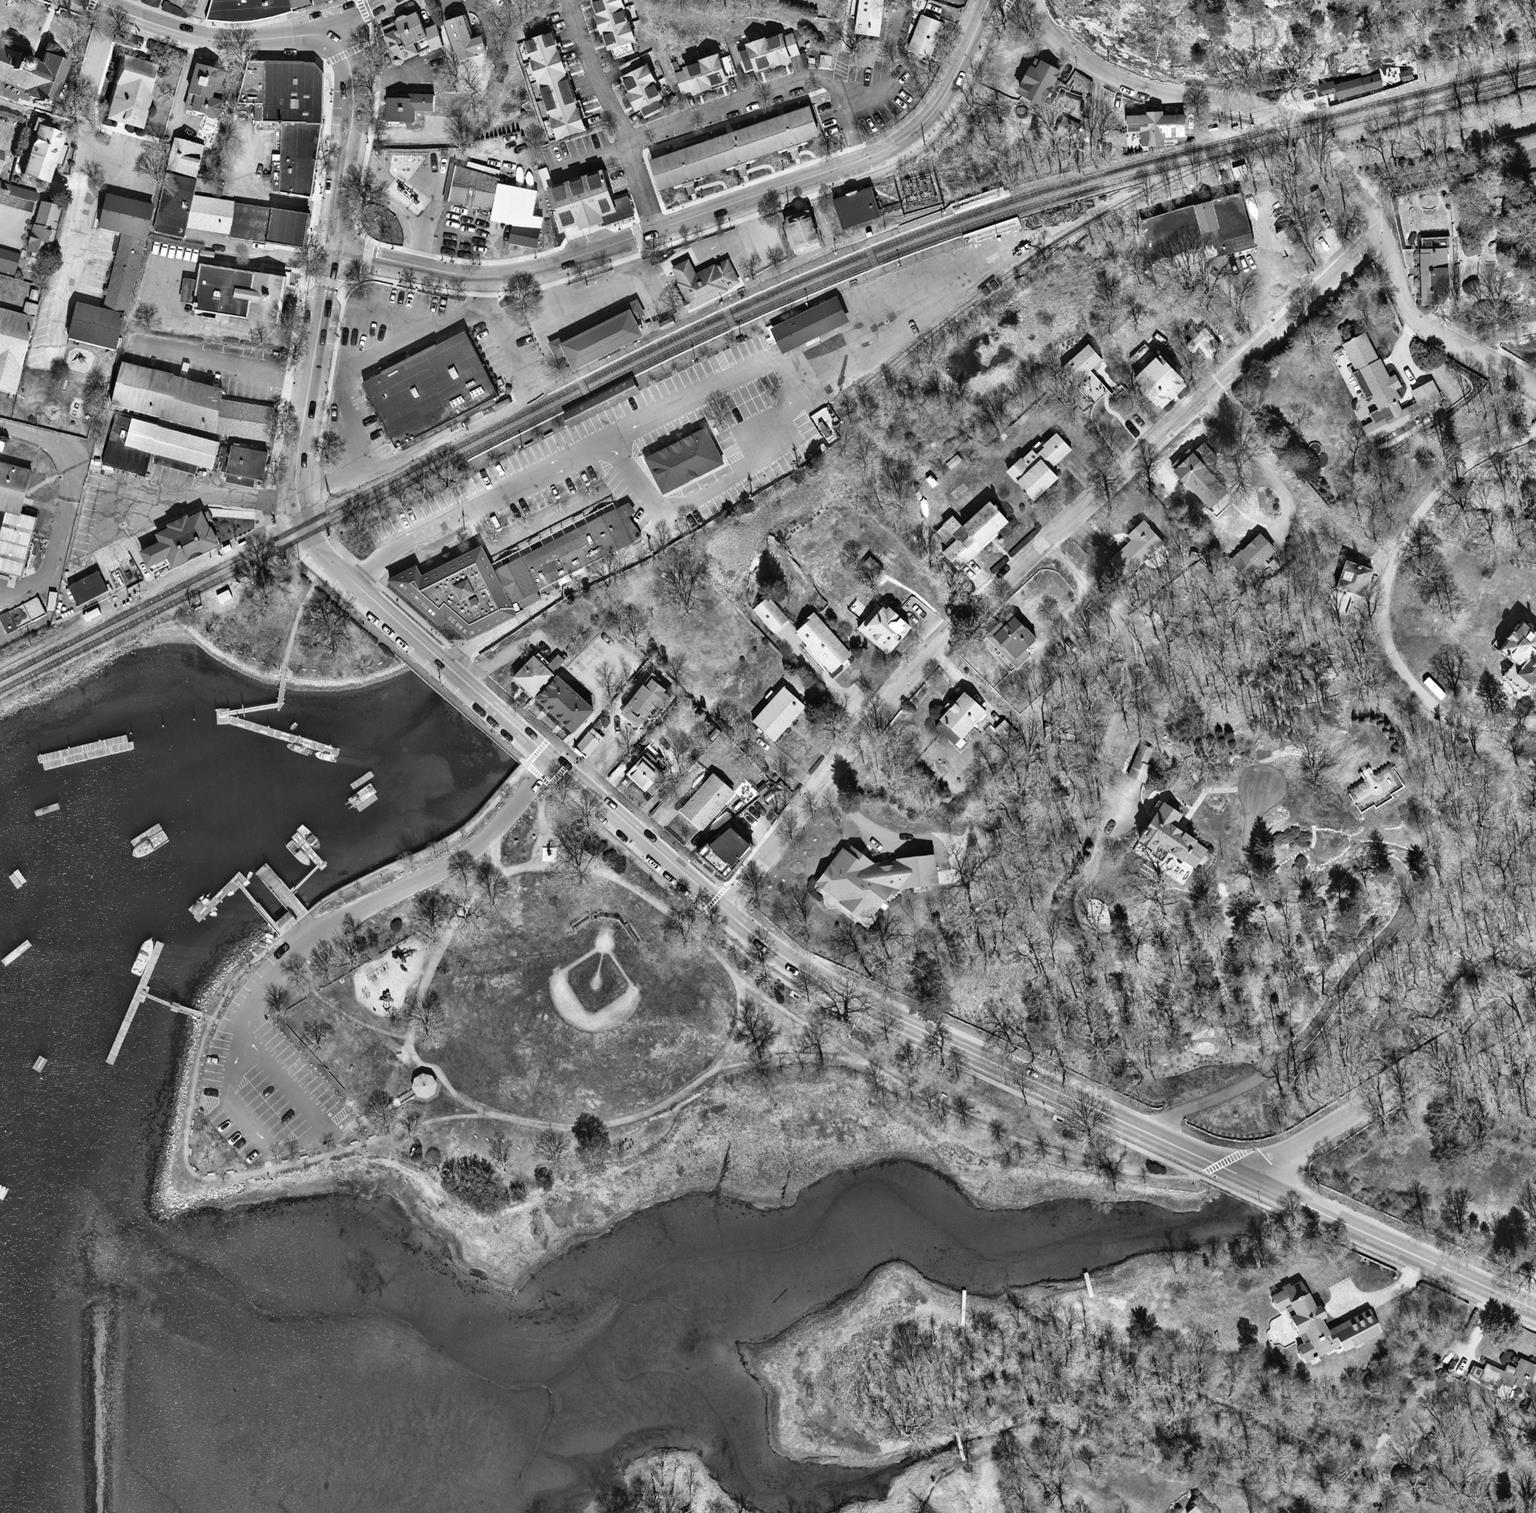
Present day habitat extents and boundaries are assumed to be similar to the 2011 National Wetland Inventory (NWI) wetland classification areas. The majority of the project area is classified as “upland," which includes both developed and undeveloped dry land. The area has some estuarine open water near the harbor, an irregularly flooded marsh along the southern edge of Masconomo Park, an inland fresh marsh behind the residences towards the northern end of Tappan Street, and smaller areas of regularly flooded marsh, estuarine beach/tidal flat, and ocean beach. Note: Some conditions (e.g., the area of estuarine open water along the western waterfront) were different than what was observed and documented during the field delineation study, as the NWI data and SLAMM projections are based on elevation data and remote sensing.

There are minimal changes projected for 2030 compared to present day conditions. All wetland habitat classification extents remain the same, except for a small increase of 0.1 acre in regularly flooded marsh habitat and the addition of a single 25-square meter area of transitional marsh/scrubshrub area at the boundary of the irregularly flooded marsh wetland on the southern edge of Masconomo Park.
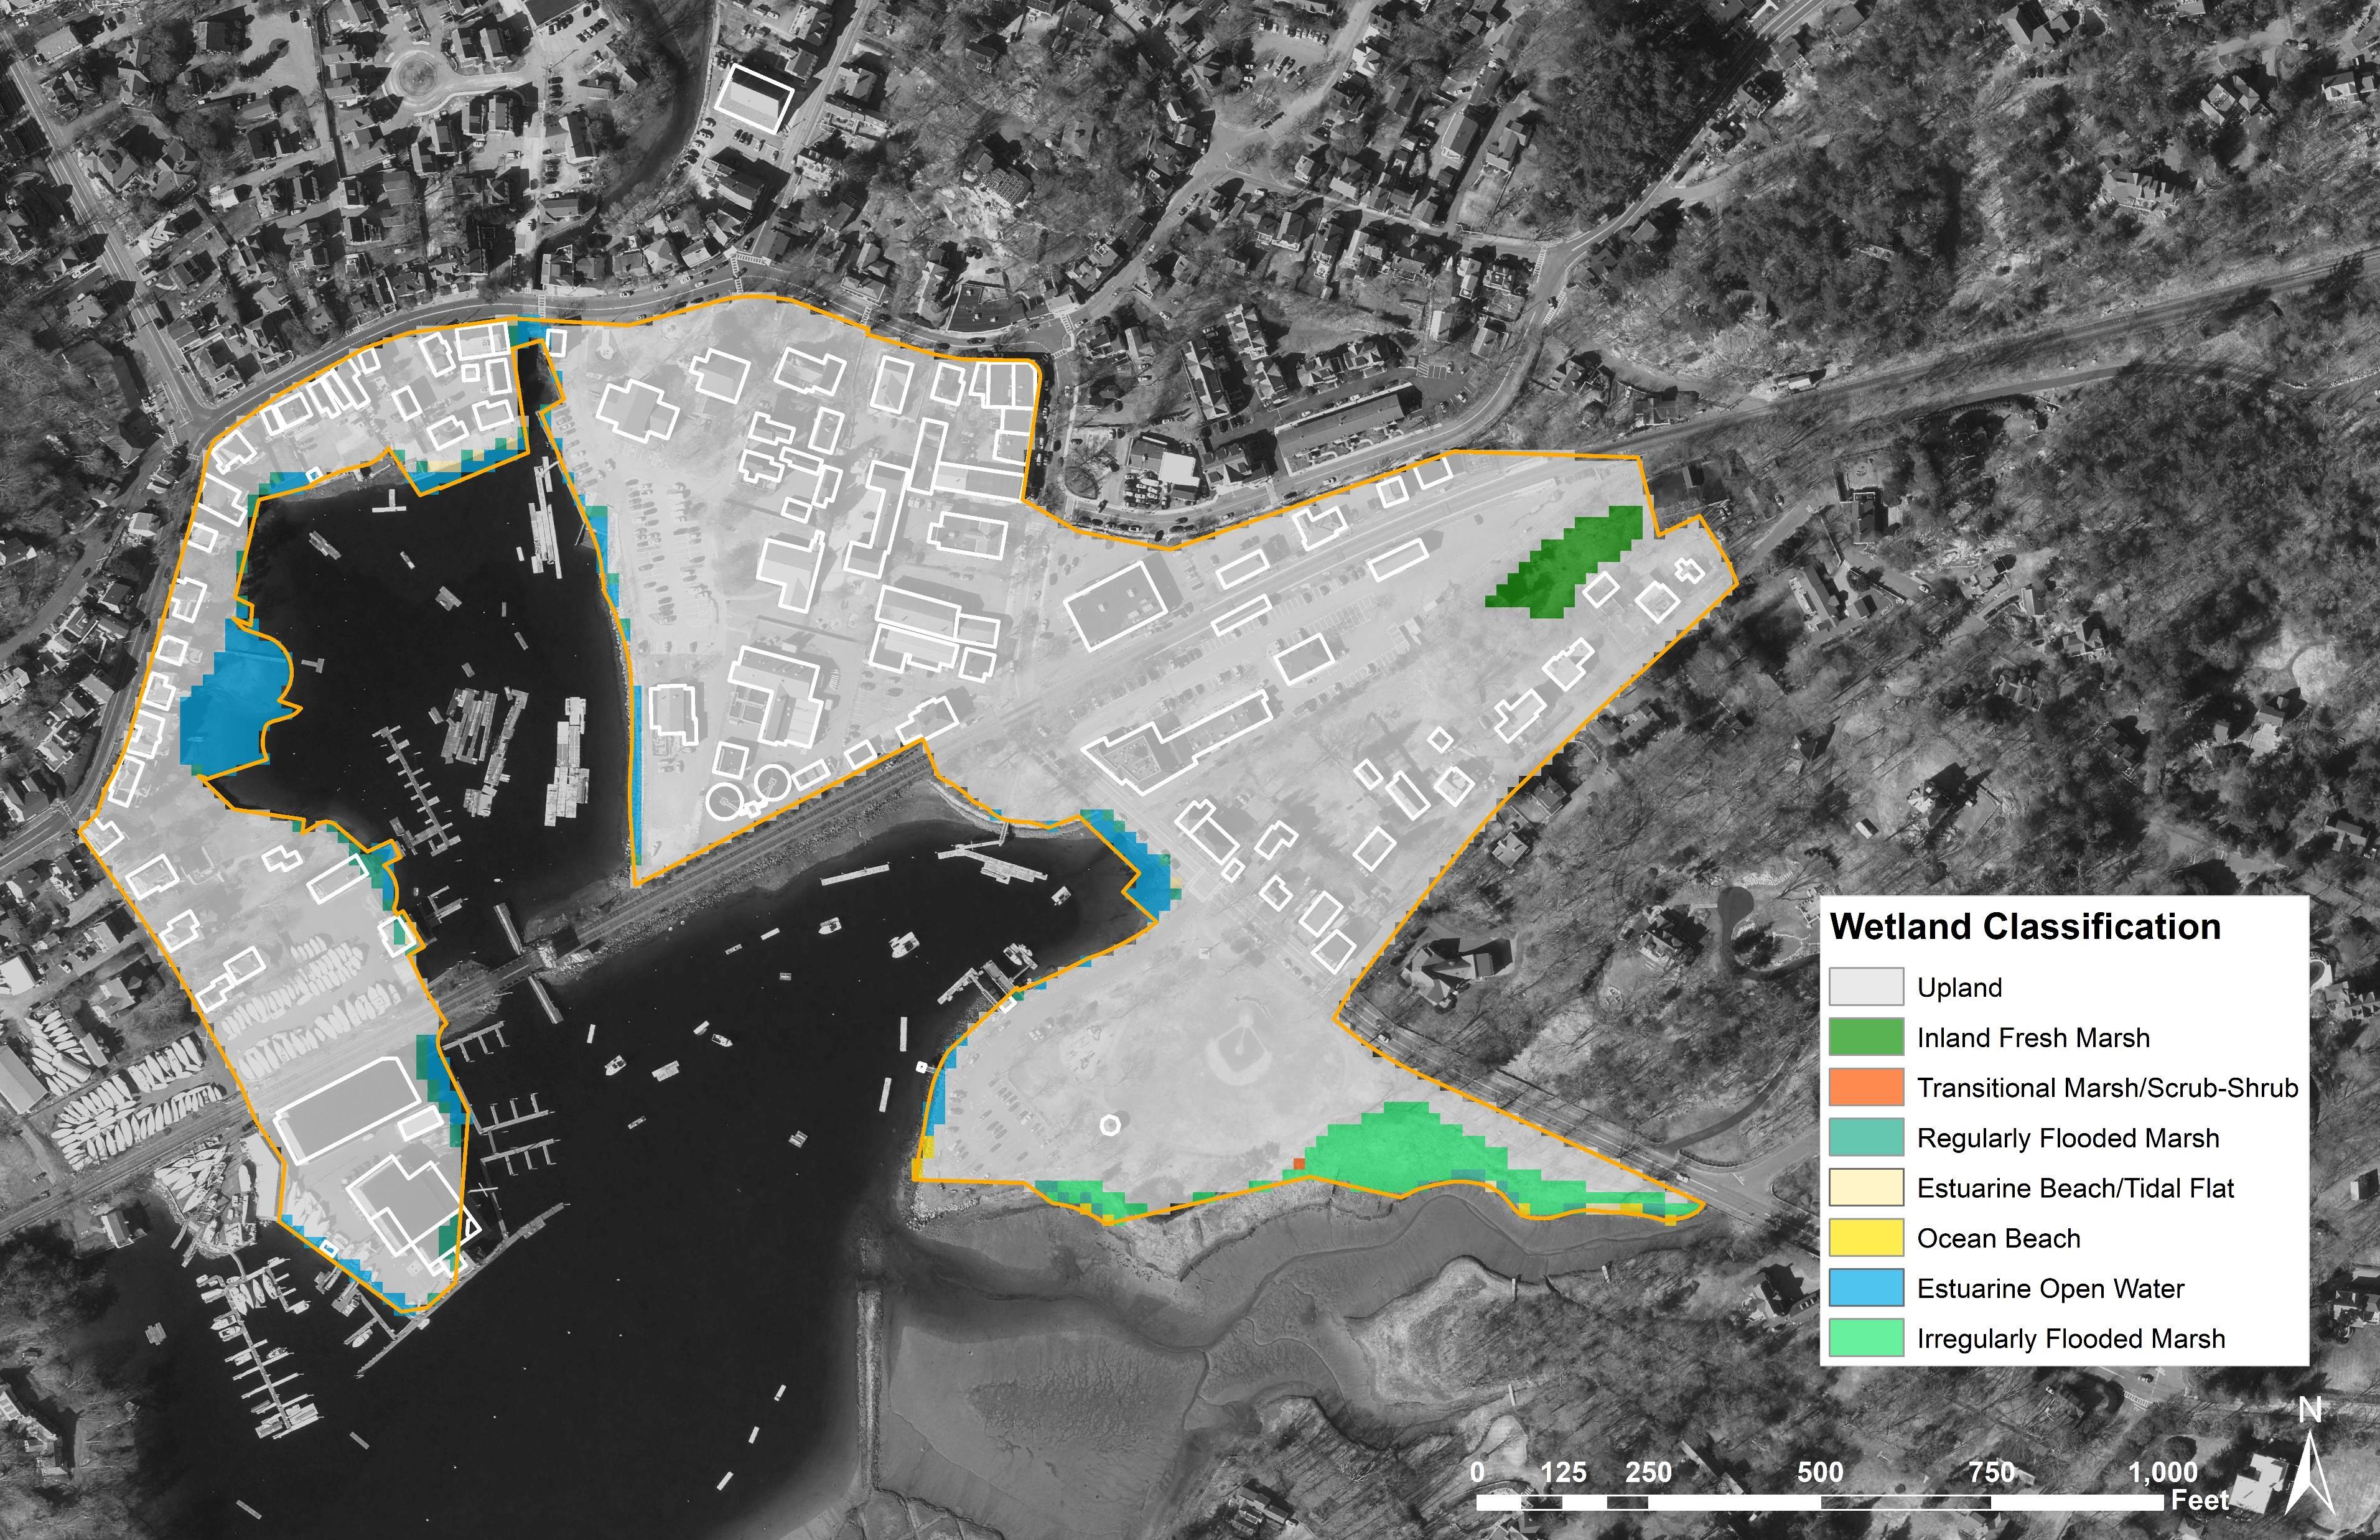
The projected SLAMM results for 2050 indicate slight changes in the wetland habitat types in Manchester. While the general extents of wetland habitats remain similar to the previous projections, there could be an additional 0.3 acres of regularly flooded marsh compared to 2030. Transitional marsh/scrub-shrub wetlands could become more prevalent, especially at the boundaries of established wetland areas such as on the southern edge of Masconomo Park and parts of the Manchester Marine peninsula. Additionally, ocean beach habitat would begin to take over the tip of the peninsula that borders the railroad, where the WWTP is currently located. Note: The projected changes at the WWTP and Manchester Marine area would not occur unless pavement was removed in these areas.
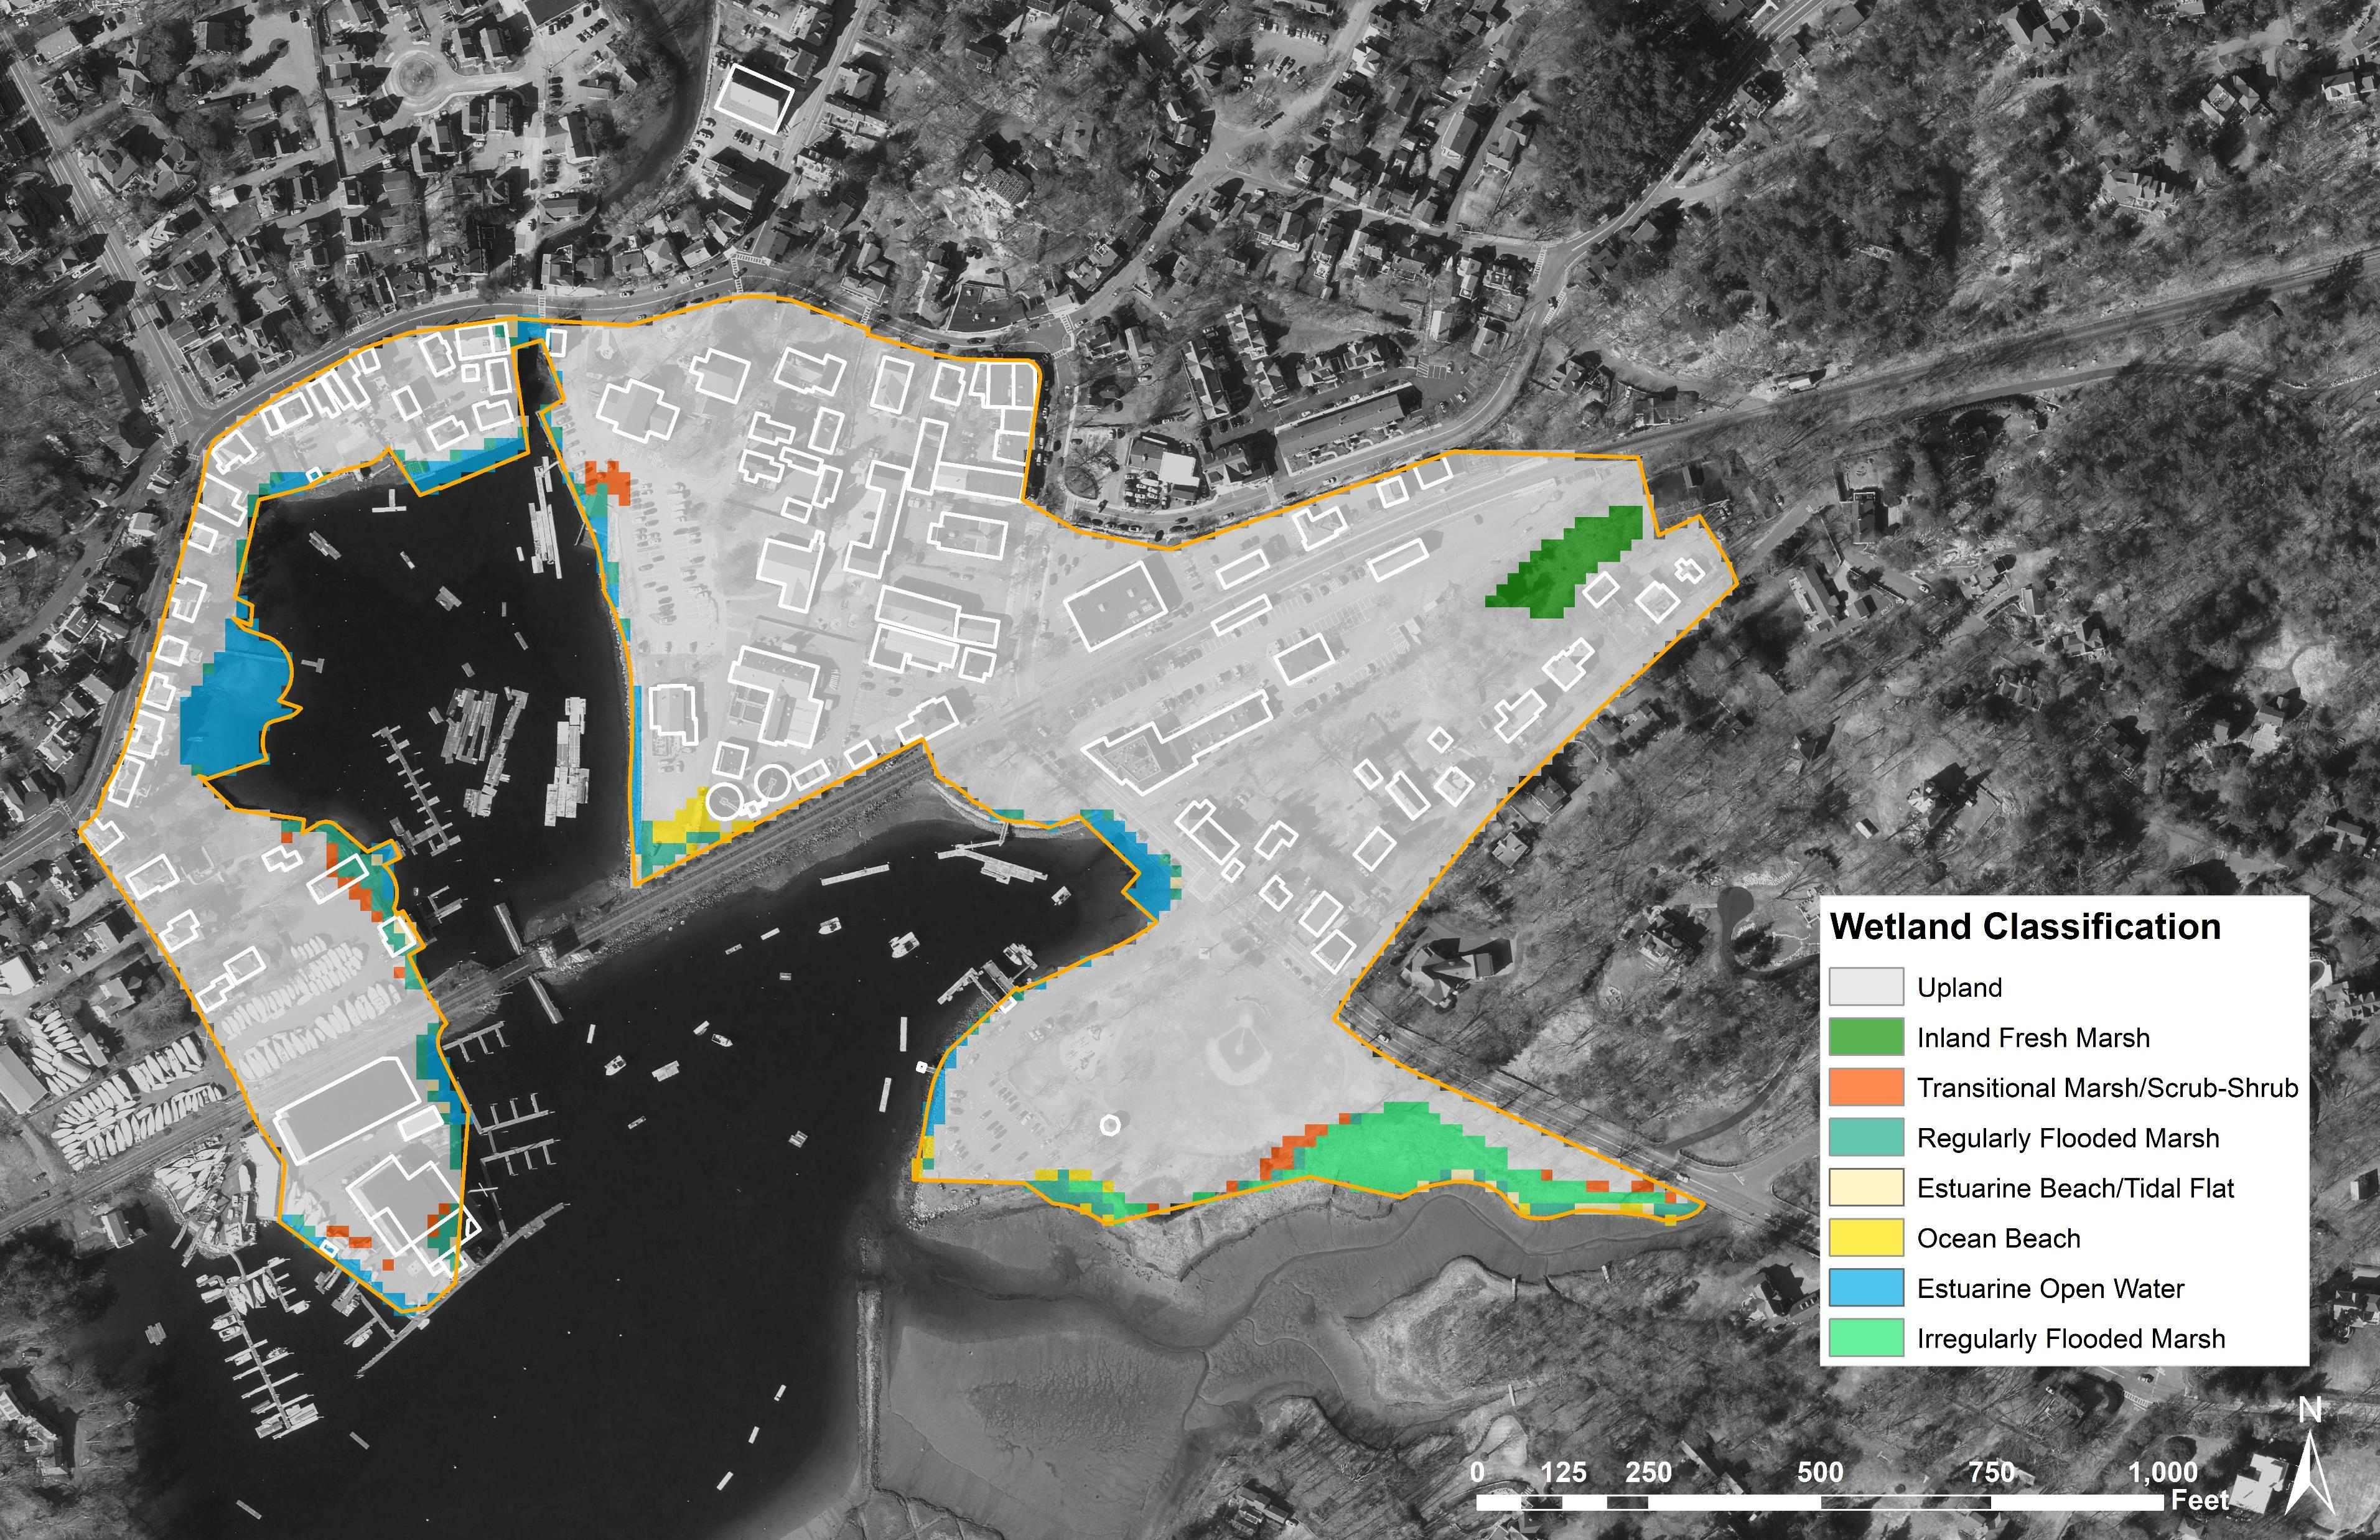
Assuming no barriers to marsh migration, the most significant change in habitat extent is projected to occur between 2050 and 2070. In the western part of the project area, the Manchester Marine peninsula and waterfront residential and commercial properties off Ashland Avenue and Commercial Street could be converted from upland to a combination of regularly flooded marsh and transitional marsh/scrub-shrub. In the middle of the area, the existing large parking lot could become a combination of regularly flooded marsh and ocean beach, while the rear entrances to Town Hall could become transitional marsh/scrub-shrub wetland habitat. In the eastern part of the area, the residential area behind Beach Street and Tappan Street could be converted into ocean beach, and the inland fresh marsh could become transitional marsh/scrub-shrub wetland by 2070. Finally, most of Masconomo Park could become a combination of ocean beach and regularly flooded marsh by 2070.

Between present day and projected 2070 conditions, there could be habitat extent changes in Manchester as marshes migrate due to SLR. Since the SLAMM model omits barriers to marsh migration such as roadways and structures, the results should be interpreted as possible marsh migration under natural or undeveloped conditions.
Between present day conditions and 2070, 11.1 acres of upland area, 0.8 acres of irregularly flooded marsh, and the entire 0.4 acre area of inland fresh marsh could be lost and converted to other wetland habitat types as inundation to these areas becomes more frequent (see Table 3).
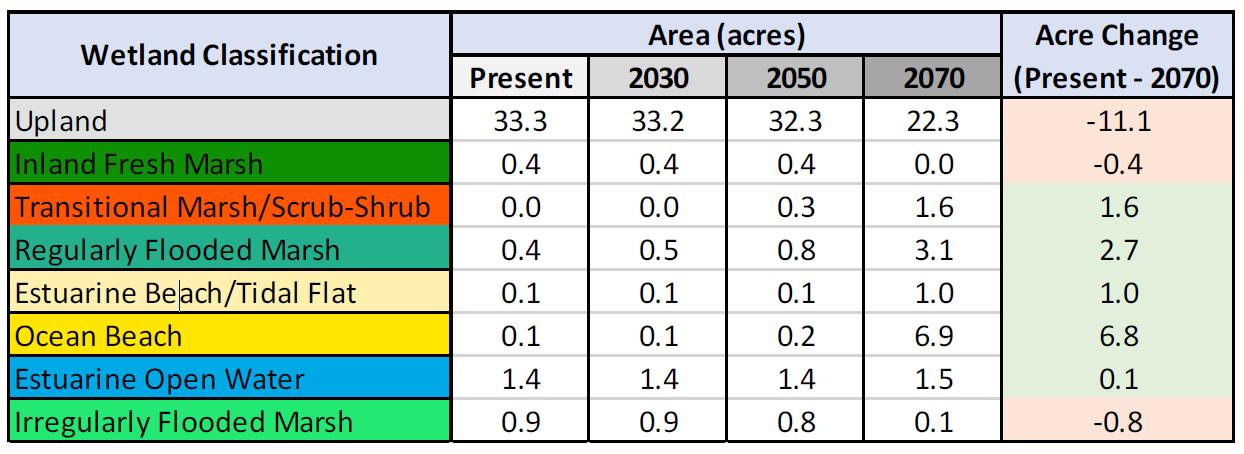
The largest increase in wetland habitat between present day conditions and 2070 is ocean beach, which increases from 0.1 acres to 6.9 acres. Regularly flooded marsh gains the second largest amount of area, growing from 0.4 acres to 3.1 acres. Transitional marsh/scrub-shrub and estuarine beach/tidal flat habitat areas are also projected to increase by 1.6 and 1.0 acres respectively, along with a slight 0.1 acre increase in estuarine open water.
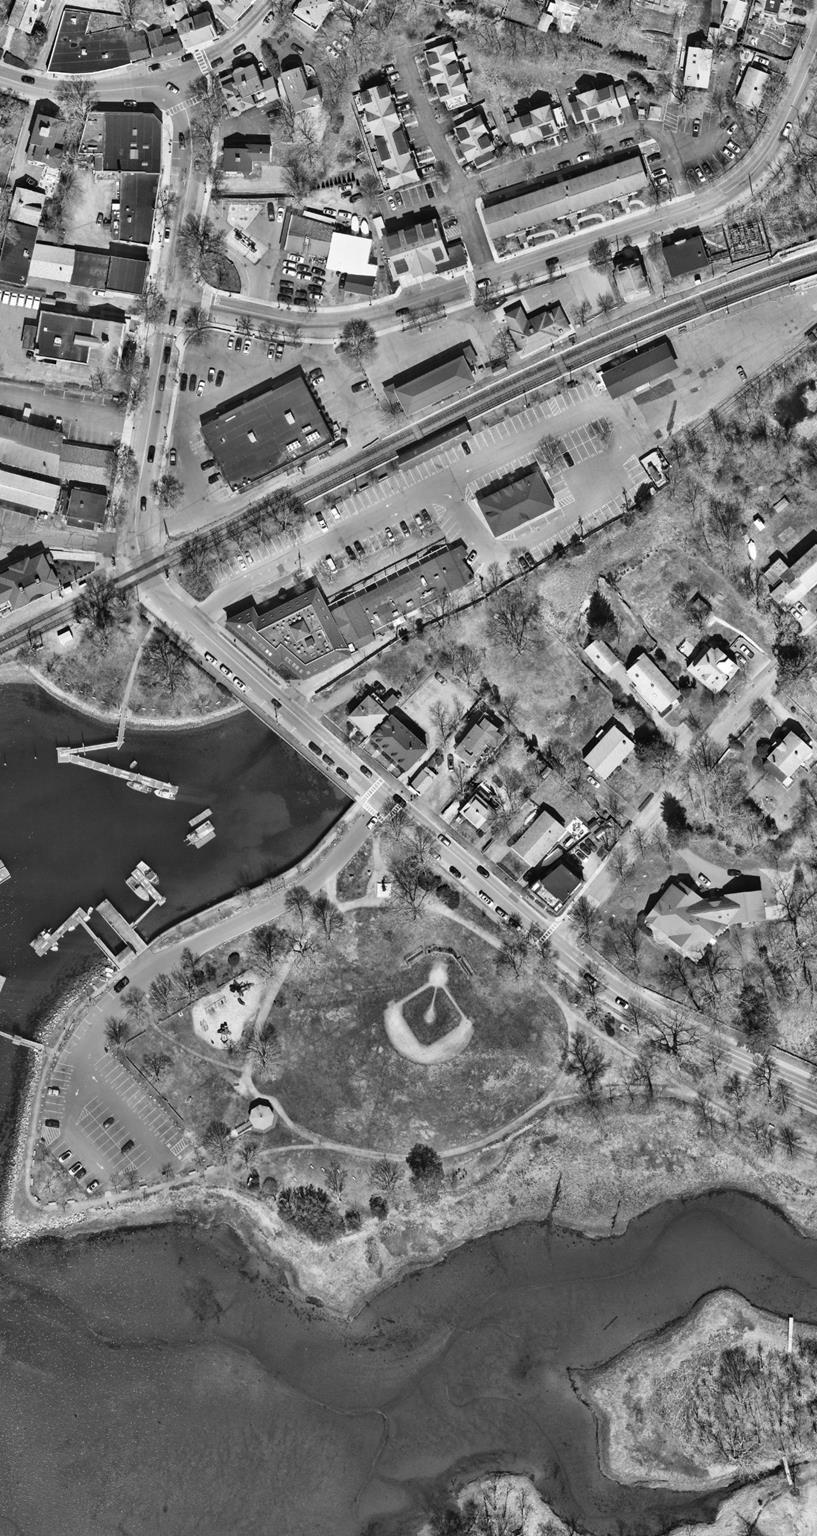
There are currently many barriers to marsh migration within the project area, as this part of Manchester is highly developed. Both commercial and residential buildings, roadways, train tracks, and other impervious surfaces (e.g., parking lots) would make the natural migration of marsh habitats impossible in most parts of the project area under its current configuration. However, having an understanding of the unobstructed habitat migration patterns could inform the development of concepts for a reimagined waterfront (e.g., transitioning Masconomo Park into a floodable park).

Scenario 0 | Do Nothing
Scenario 1 (Short-Term) | Protect + Plan Ahead
Scenario 2 (Medium- to Long-Term) | Adapt + Transition + Restore
Scenario 3A (Long-Term) | Raised Rail as Flood Control Structure
Scenario 3B (Long-Term) Full Retreat + Restore
As the results of the vulnerability assessment (see Section 3) highlight, the cost of taking no action – or the “do nothing” scenario – is not $0. Under the do nothing scenario, Manchester would continue to see the increasing impacts of sea level rise and coastal flooding over time that would result in larger swathes of the inner harbor becoming regularly exposed to high tide flooding (see p. 20) and flooding from higher probability coastal storm events (see pp. 24-26).
With these increasing flood impacts, come a range of possible short- and long-term consequences that might include:
• Property damages to both residential and commercial properties
• Repairing and replacing flood-damaged roads, bridges, utilities, and other public infrastructure
• Rising insurance premiums or possible loss of insurance coverage
• Economic losses in the form of lost business and/or wages
• Injury or exposure to chemical leaks or hazardous wastes
• Power outages and temporary loss of function of critical infrastructure (e.g., WWTP)
• Impacts to public safety operations (e.g., police and fire)
Overall, lack of action will not result in any risk reduction from coastal flooding, which was identified by members of the Manchester community as the top climate hazard as part of past community resilience building workshops (Tighe & Bond, 2018). This scenario directly contradicts the priorities of the community and was therefore disregarded as a viable alternative.
Scenario 0 was added to the plan after receiving feedback on the draft action plan during meetings with members of the Steering Committee and public. However, as was stated above, this scenario does not align with the priorities of the community, nor is it reflective of the many actions Manchester has already taken to begin addressing coastal flooding.
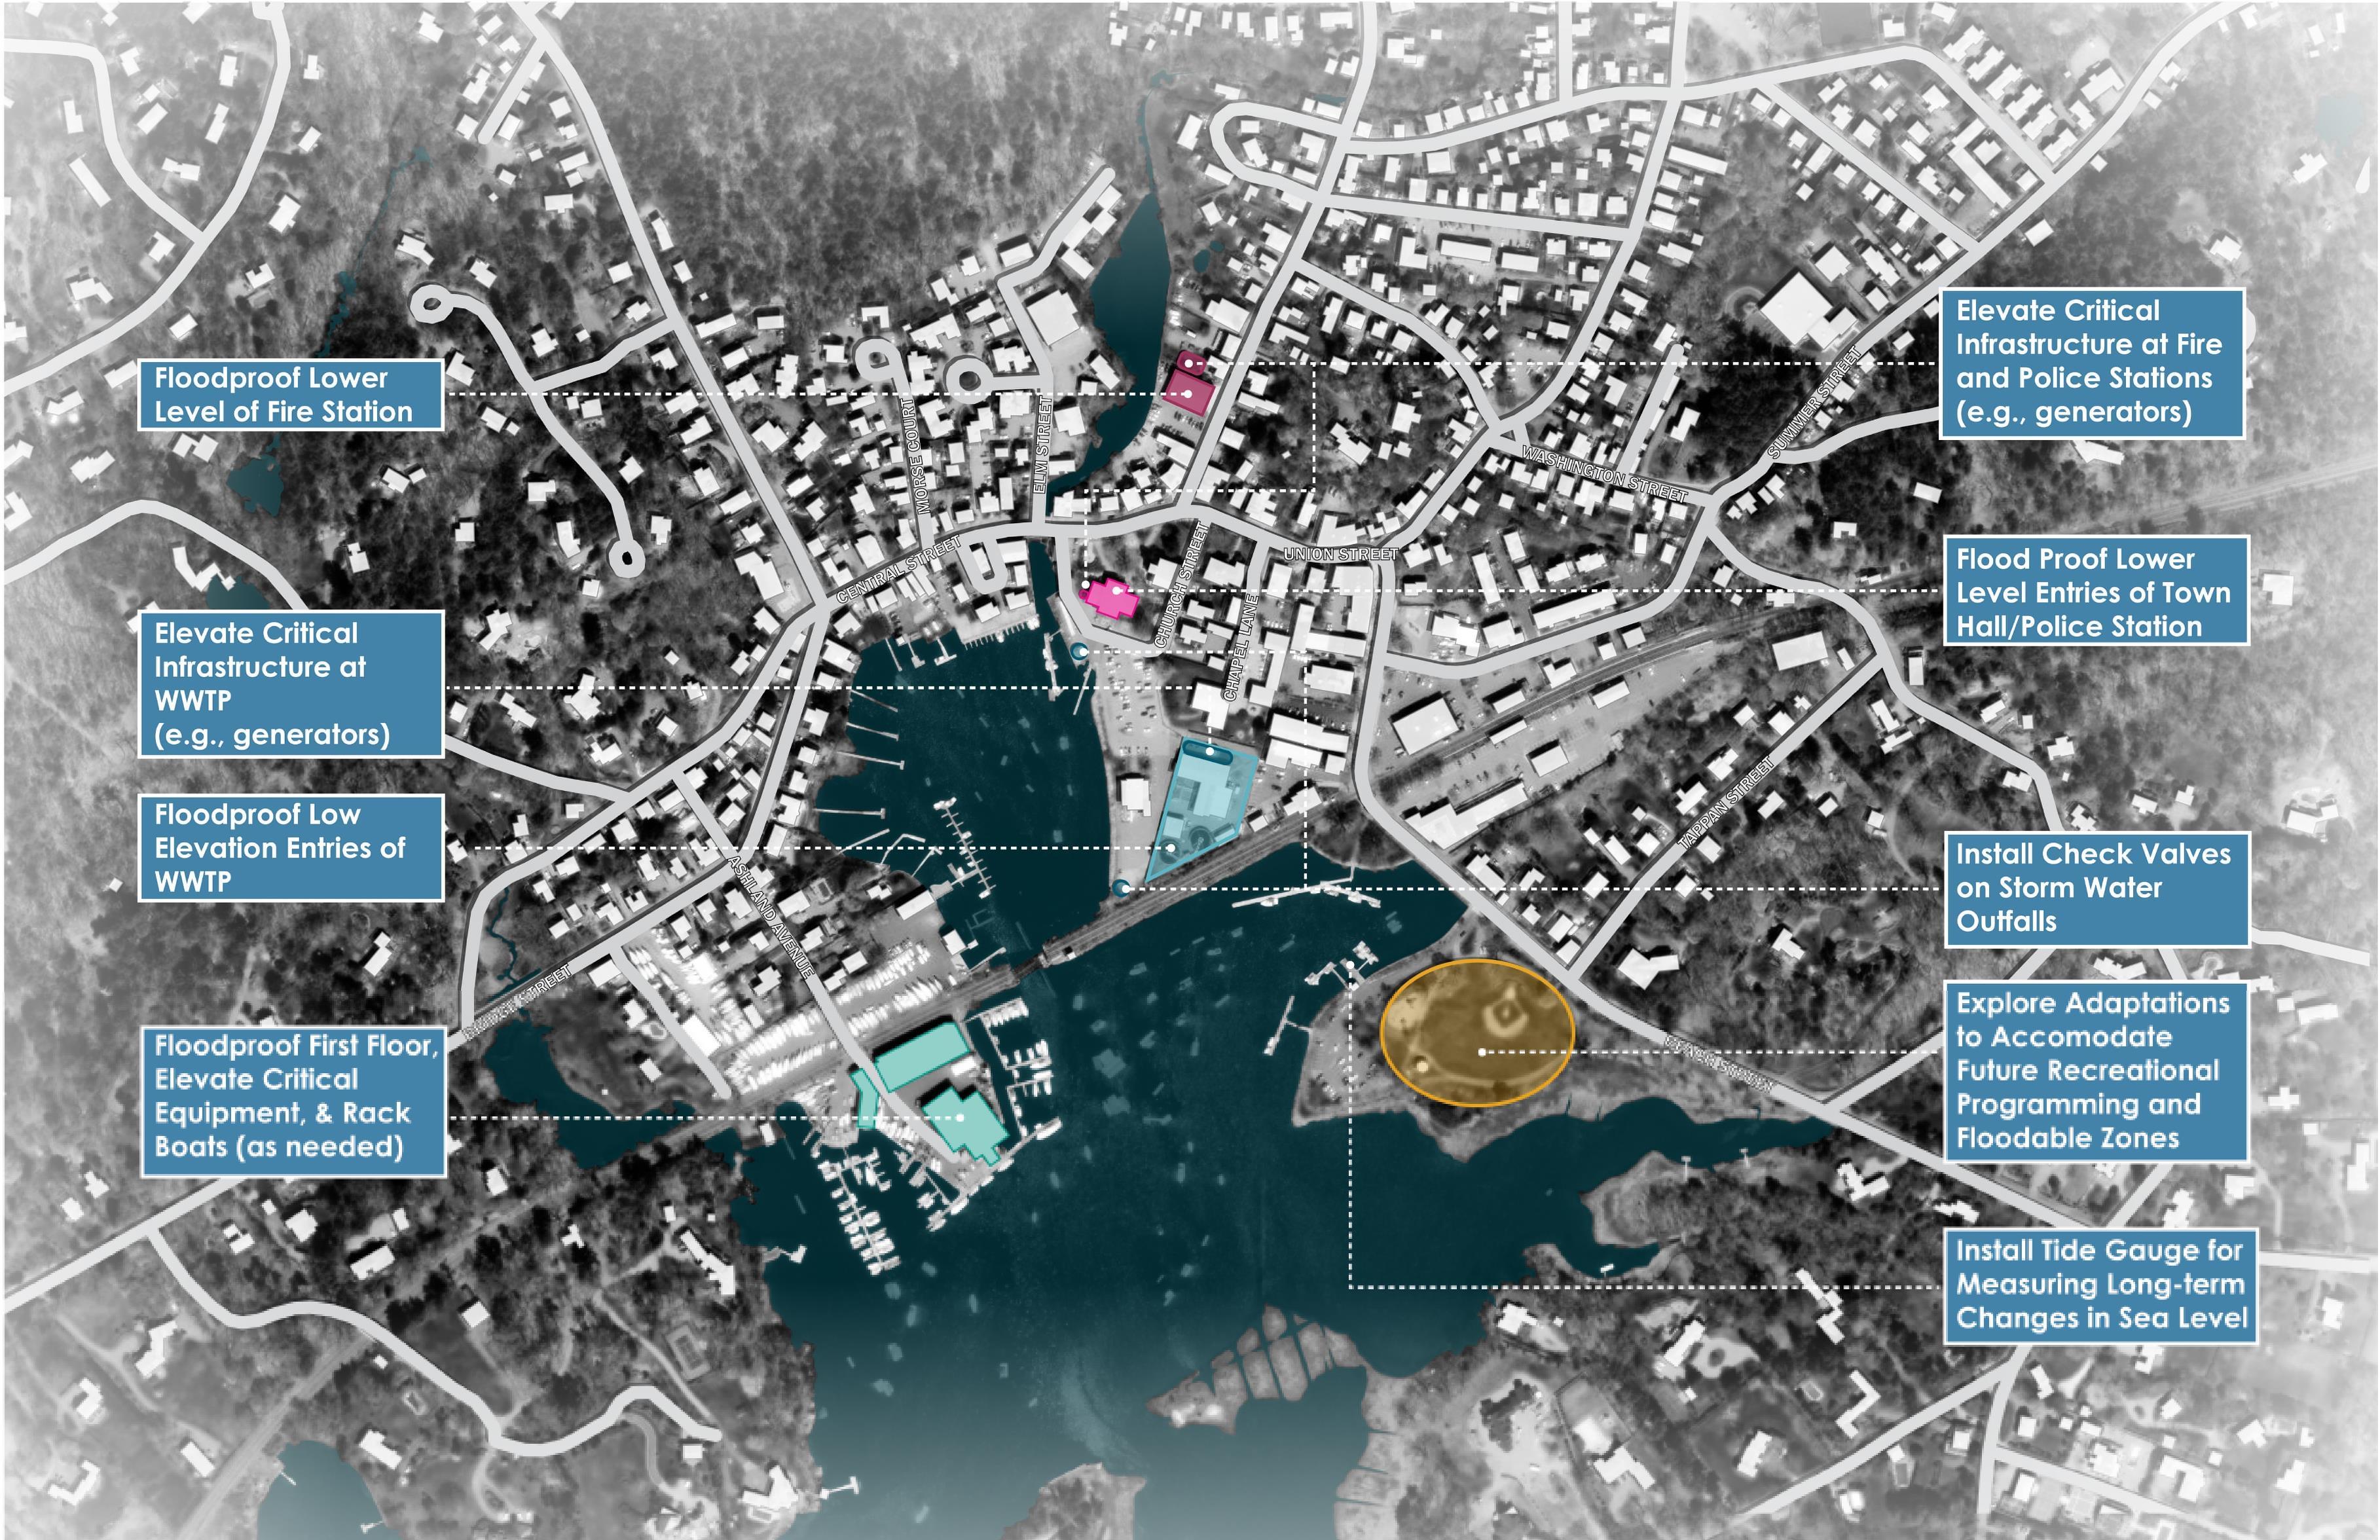
Scenario 1 focuses on actions that can be taken in the short term (i.e., by the 2030 planning horizon) to provide a level of protection against coastal flooding for several critical Town facilities and downtown industries through a mixture of floodproofing and elevating of critical building systems. In this scenario, the fabric of the existing inner harbor and downtown area are not significantly altered, and key facilities and critical infrastructure are protected in their existing locations largely through site- and buildingscale actions.
As part of this scenario, it is also recommended that the Town install a local tide gauge for long-term monitoring of sea level rise and that actions be taken to evaluate future potential design alternatives for transitioning Masconomo Park into a floodable park. The tide gauge could also be tied to flood thresholds and therefore act as an operational system to provide alerts to members of the community. And, alternative locations for existing recreational uses at Masconomo Park could include the Town-owned land along Pine Street or other properties identified in the recent Athletic Field Master Plan (Weston & Sampson, 2020)
See the following page for a visual plan highlighting the actions included in Scenario 1.

Some of the challenges that come with implementing the actions proposed as part of this scenario include:
• Elevation of existing generators will cause a temporary disruption of the emergency power supply
• Installation of check valves will require access at low tide and regular maintenance
• Installation of local tide gauge will require annual fees and the potential for added emergency maintenance costs
• Additional structural analysis may be needed to implement floodproofing measures and alternative access must be maintained when floodproofing has been implemented
Risk Reduction
The actions proposed under this scenario are aimed at reducing the risk of key Town infrastructure to being inundated by probable coastal flooding events out to the 2050 planning horizon, recognizing that many of the flood conditions projected for the 2030 time horizon are already occurring with some regularity. These actions are intended to buy time until larger, longer-term actions could be taken by the community to provide more neighborhood-scale risk reduction (see Scenarios 2-3B).

Community Feedback
Scenario 1 incorporates feedback the project team heard from the Steering Committee and other community members over the course of the planning process, who expressed concerns about immediate challenges posed by present-day and near-term coastal flooding. The project team received positive feedback on how this scenario prioritizes addressing deferred maintenance issues (e.g., drainage issues), implementing “low-hanging fruit” solutions, reducing immediate risks, and planning ahead for longer-term adaptation needs in Manchester Harbor. The project team also heard some skepticism about the need for longer-term planning scenarios to be developed given the importance of addressing current and near-term flooding concerns. However, a majority of the feedback received by the project team supported the development of additional longer-term alternatives, which are represented in the sections that follow the Scenario 1 description.
Dry floodproof the lower level of the Fire Station to elevation (el.) 13 feet (ft) (NAVD88) (including floodproofed garage door)
$125,000
Elevate the existing generator on the north side of the Fire Station by replacing the slab and elevating the base of fuel tank to el. 13 ft (NAVD88) $35,000
Dry floodproof lower-level entries of Town Hall/Police Station to el. 13 ft (NAVD88) using floodproof windows, doors, and garage door
$250,000
Elevate the existing generator on the west side of Town Hall/Police Station by replacing the slab and elevating the base of fuel tank to el. 13 ft (NAVD88) $22,000
Dry floodproof low elevation entries to office spaces, below grade pumps, and the odor control facility at the WWTP to el. 13 ft (NAVD 88) using flood shields
Elevate the existing generator on the north side of the Operations Building at the WWTP by replacing the slab and elevating the base of fuel tank to el. 13 ft (NAVD88)
Install check valves on two existing stormwater outfalls located west of the WWTP in the inner harbor (assumes no bid documents or new upstream manholes for maintenance will be required)
$45,000
$55,000
$40,000
Install a small, self-powered tide gauge with data telemetry and web hosting service on the bulkhead by the Town Hall parking lot or pier at Masconomo Park to monitor long-term changes in sea level rise
Tide gauge installation: $3,000 to $4,000
Instrument leasing, realtime telemetry, data storage and online portal: $2,100 per year
Emergency site visit/maintenance: $2,000 to $3,000 per visit Wet floodproof the first floor and elevate critical equipment to el. 13 ft (NAVD88) at Manchester Marine $140,000
Evaluate design alternatives for transitioning Masconomo Park into a floodable park and alternative locations and adaptations for recreational programming.
-
Note: Estimated order of magnitude costs included for each scenario represent preliminary, current costs for each action. These were used for scenario planning purposes to weigh costs and potential benefits (see Attachment D) of the proposed actions and may be subject to change over time based on (but not limited to) rising costs of labor/materials, additional design/permitting and site investigation work needed, and other changes to the assumptions noted with each scenario.
FLOODPROOF BELOW CRITICAL FLOOD ELEVATIONS
Site-scale adaptation of structures can include floodproofing of doors and windows
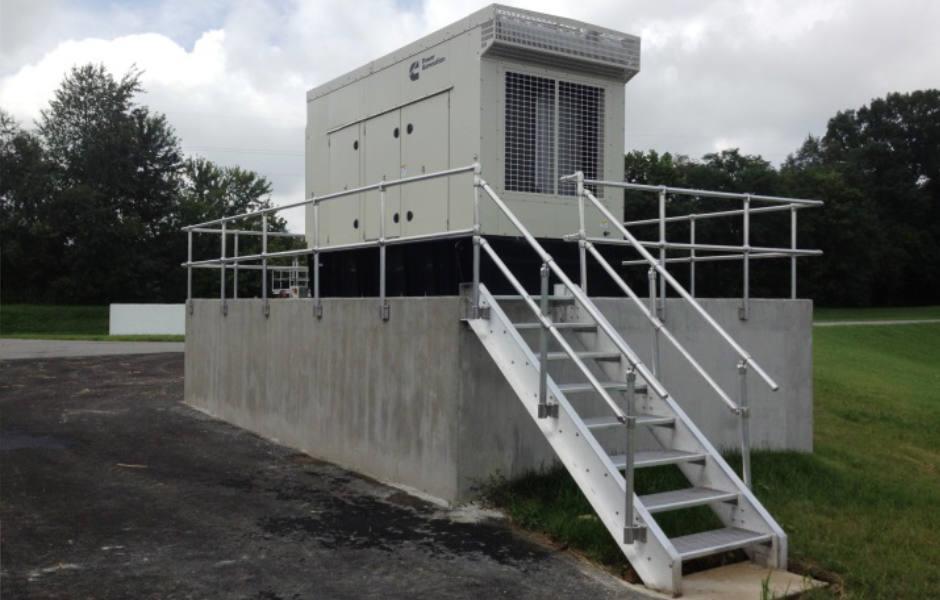


ELEVATE CRITICAL SYSTEMS ABOVE CRITICAL FLOOD ELEVATIONS
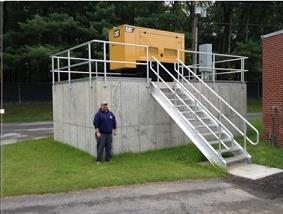
Site-scale adaptation of critical infrastructure can include elevating necessary backup power equipment (e.g., generators)
INSTALL LOCAL TIDE GAUGE
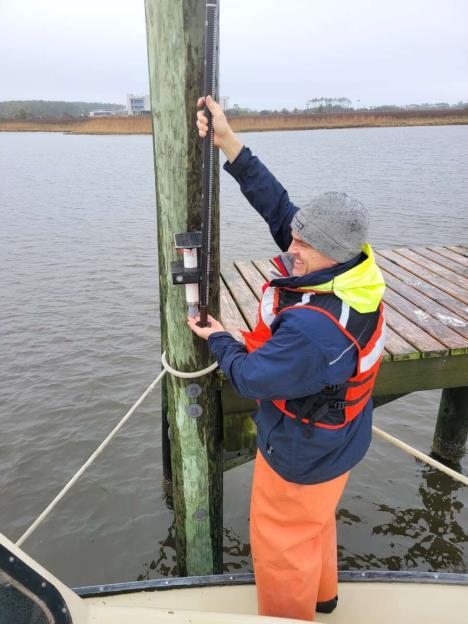
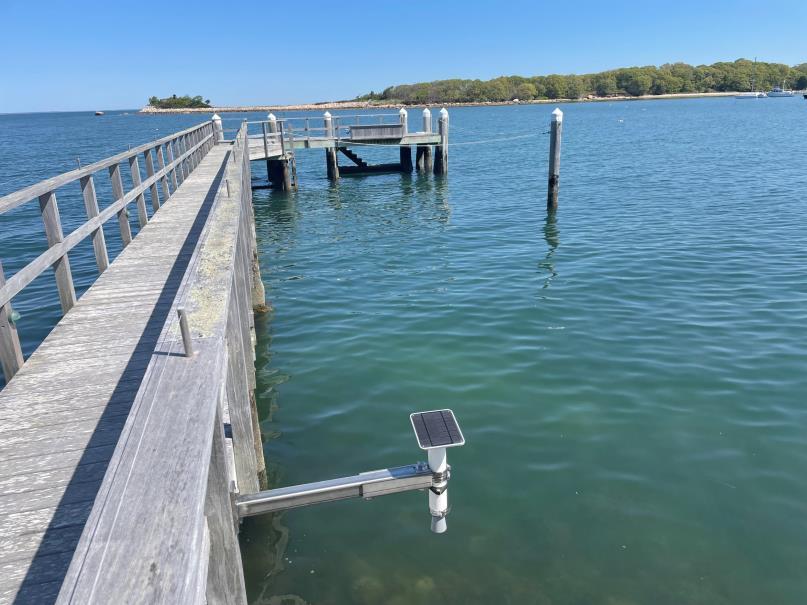
Long-term monitoring of sea level rise can help better cater future flood mitigation actions to the needs of the community

Floodproofed garage door

(Image credit: Flood Control International)
Elevation of standby generators
(Image credits: FEMA and Magna Engineers, 2013)
Quisset Harbor, MA
(Image credits: Hohonu and Coastal Studies Institute)
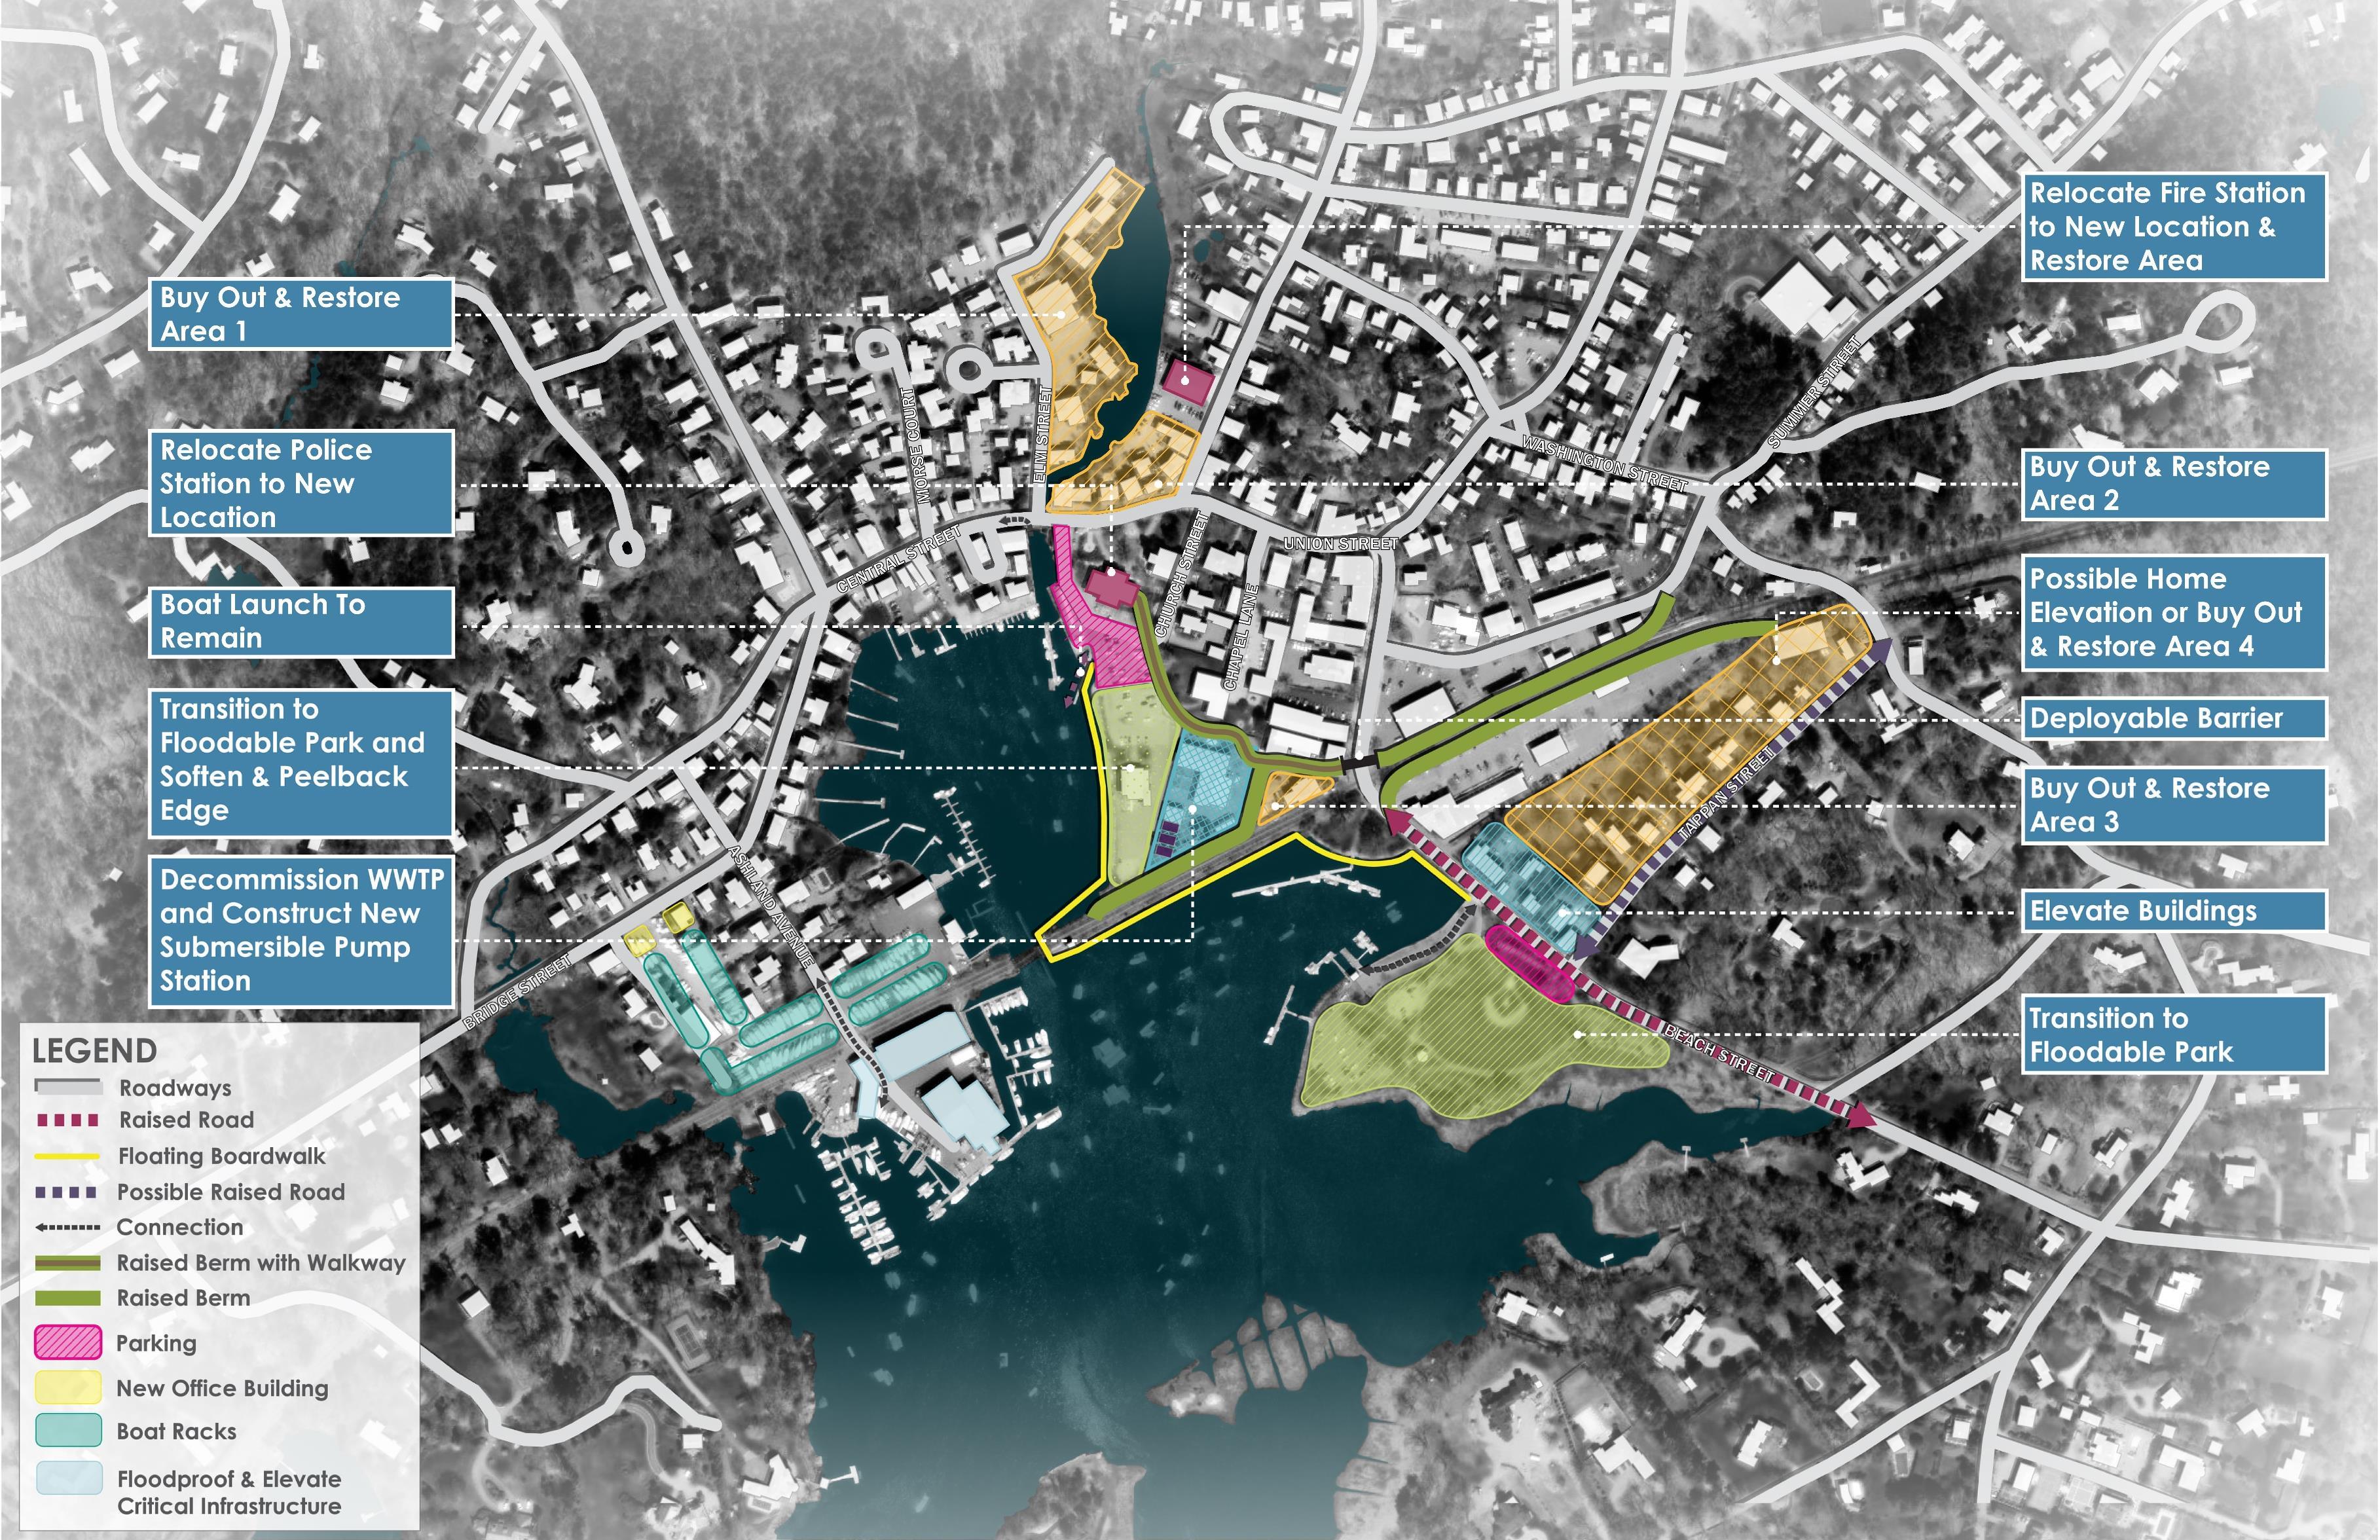
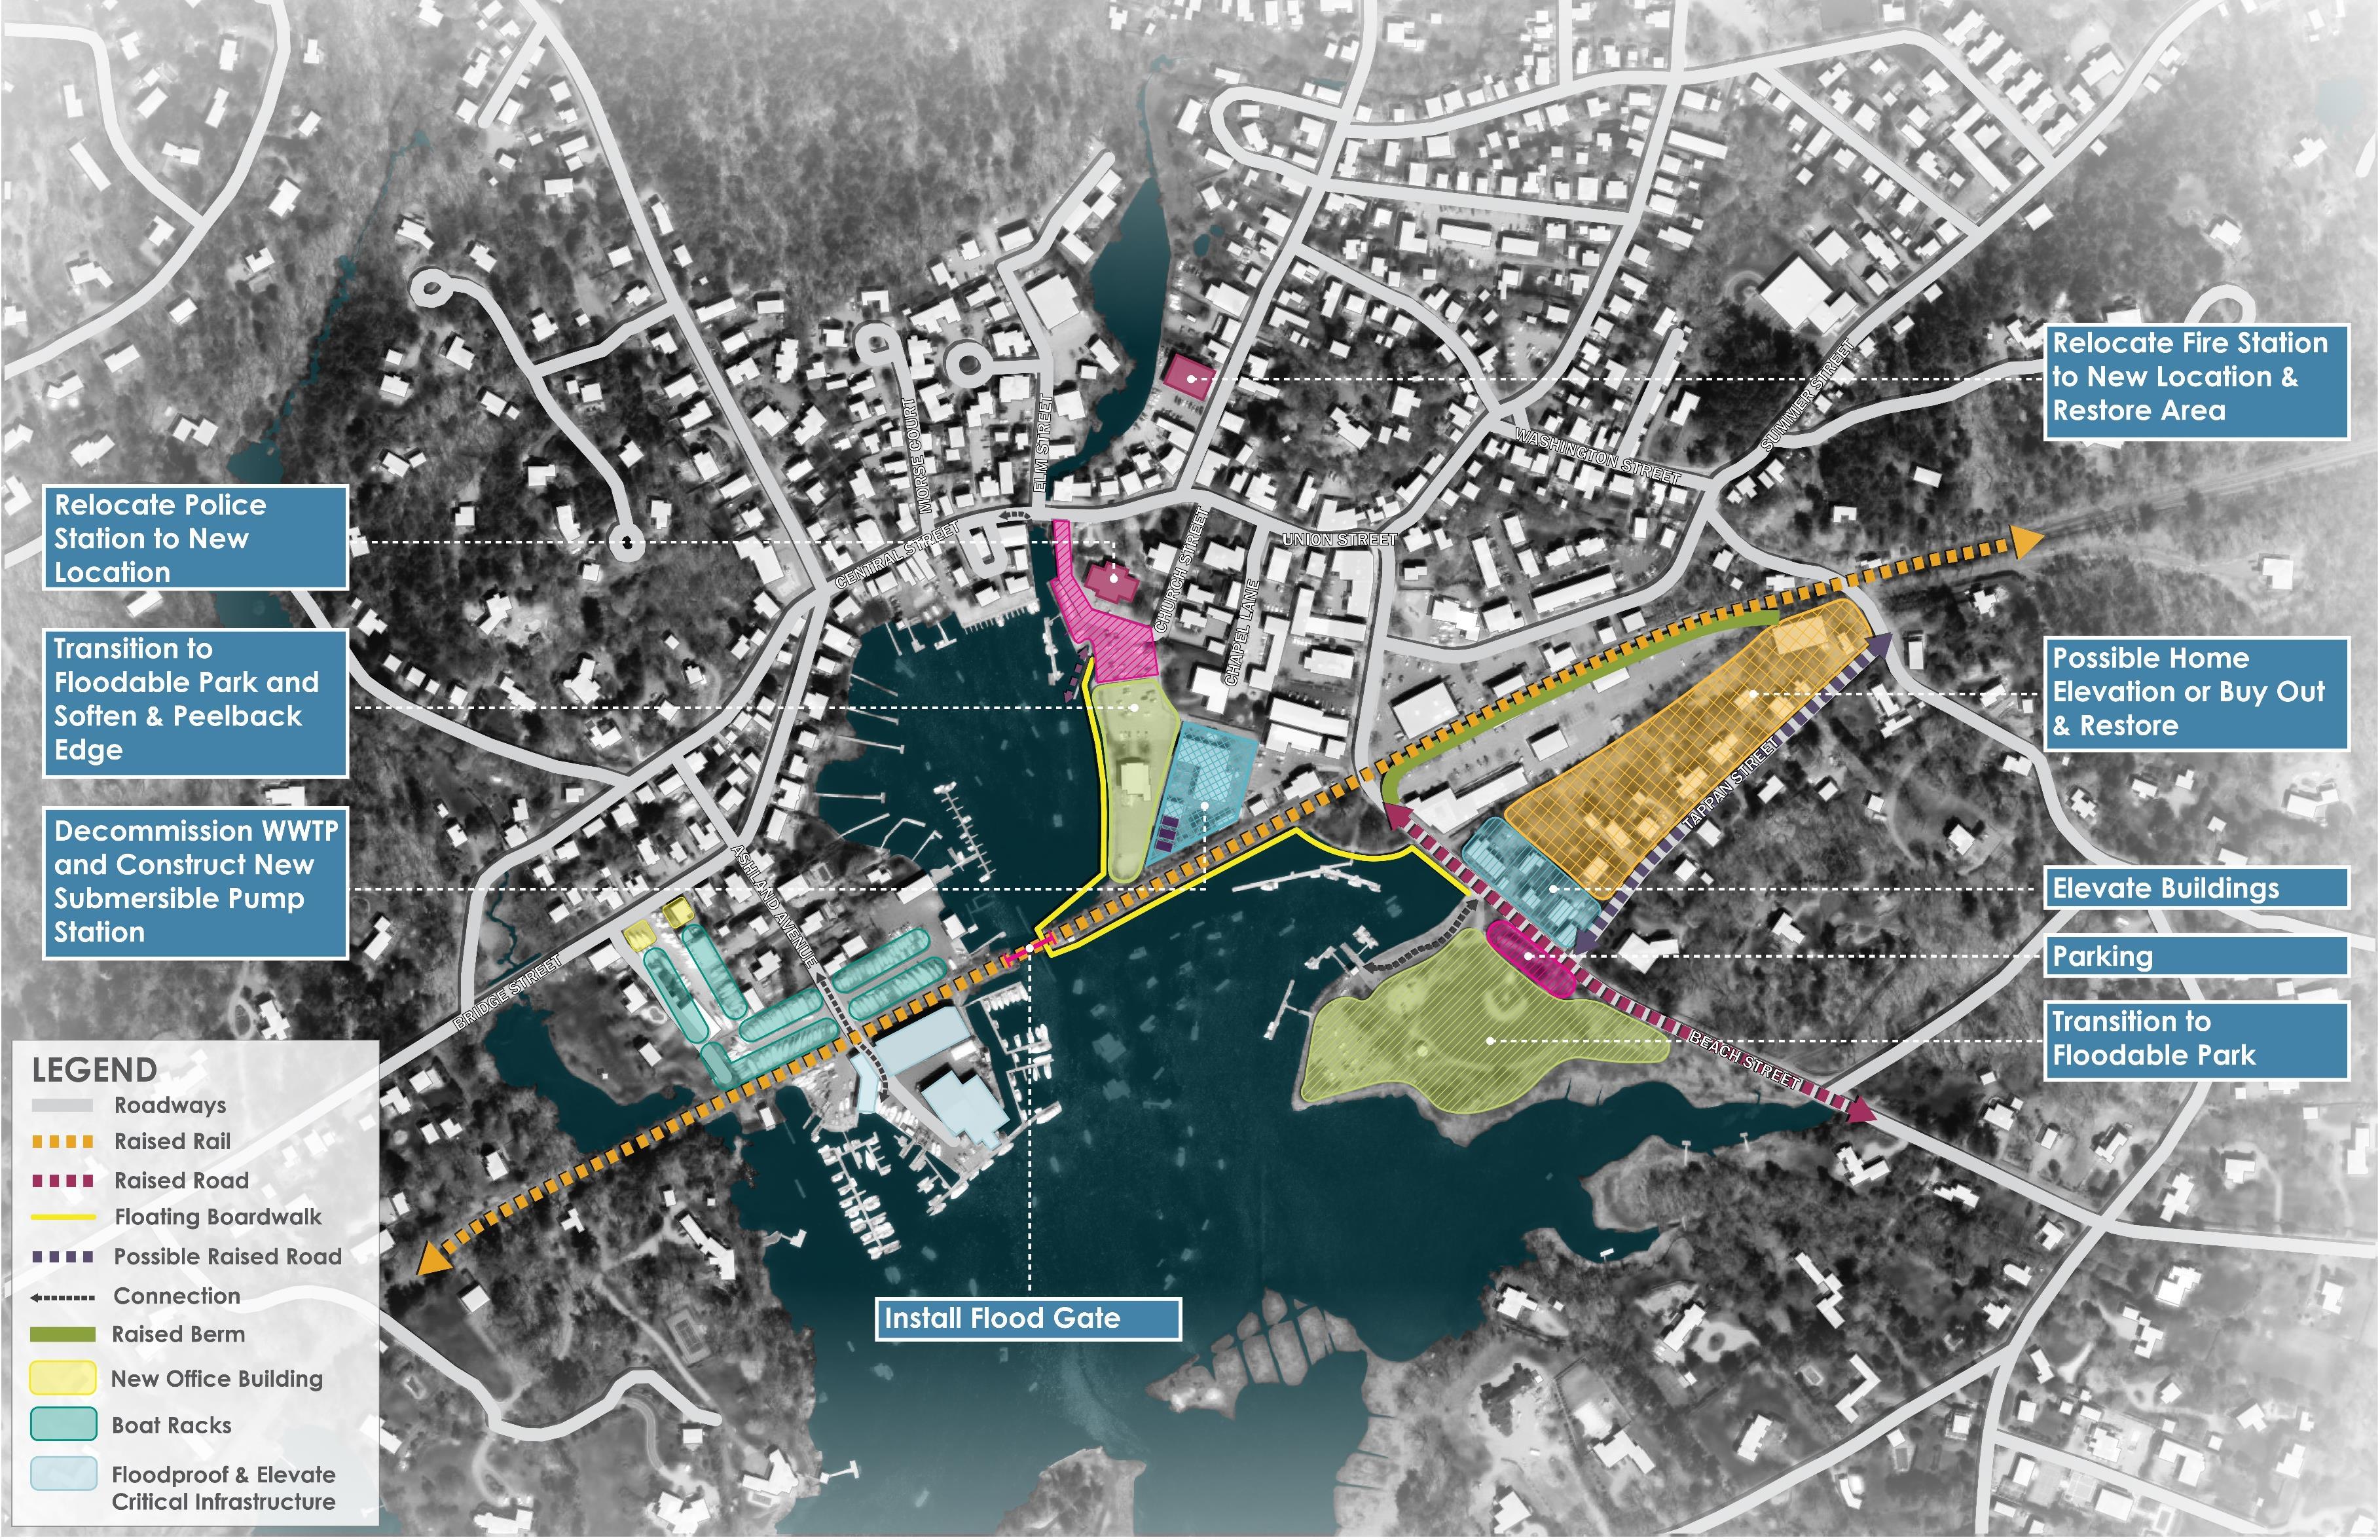
Tide gauge installations Lebanon, KYScenario 2 focuses on actions that can be taken in the medium- to long-term (i.e., by the 2050 to 2070 planning horizon) to adapt to greater levels of flood risk by minimizing exposure to worsening storm surge events and tidal flooding, reducing the density of development in more flood prone areas, relocating vulnerable municipal facilities, and restoring natural ecosystems and allowing opportunities for future marsh migration. Unlike Scenario 1, this scenario focuses more on neighborhood-scale flood mitigation actions that would require significant changes to the existing fabric of the downtown and inner harbor. However, some of the actions recommended in this scenario (e.g., converting Masconomo Park into a floodable park and installing a floatable boardwalk) also address ways that members of the Manchester community might reimagine their relationship to the waterfront in the future to maintain access to the water and provide meaningful recreational opportunities.

See the following page for a visual plan highlighting the actions included in Scenario 2.

Some of the challenges that come with implementing the actions proposed as part of this scenario include:
• Elevated berm may cause some visual obstructions and will require easements for construction
• Remotely deployable flood barrier requires annual inspections, and when implemented, will require the use of alternate routes around Beach Street
• Buyouts require the identification of willing sellers
• Road raisings require temporary closure of roads and detours during construction
• Accommodating recreational sports needs elsewhere in the community
The actions proposed under this scenario would completely eliminate the risk of coastal flooding at the existing Fire Station and Police Station by relocating those facilities to a higher elevation area. Additionally, the elevated berms, road raisings, and deployable flood barrier would reduce the risk of long-term flooding in the downtown area and the neighborhood bordered by Beach Street and Tappan Street. In lieu of implementing the actions of more drastic long-term scenarios –such as the rail raising scenario and full retreat scenario (see Scenarios 3A and 3B), Scenario 2 incorporates medium- to long-term actions aimed at reducing the risk of coastal flooding from storms up to approximately the 2070 1% AEP storm.
During meetings with the Steering Committee and the wider community, community members expressed interest in the proposed berm, deployable flood barrier, and conversion of Masconomo Park into a floodable park. Manchester residents wanted to further understand what these types of actions would look like in the context of the existing environment – especially the floodable park. Some members of the community also expressed concerns over: (1) the cost and disruption of the Scenario 2 actions relative to those proposed in the short-term Scenario 1, (2) the need to consider the cost of the Scenario 2 actions that may be avoided under other longterm scenarios (e.g., raising the rail lines), and (3) the need to lower the operational cost of a flood barrier across Beach Street.
Relocate Fire Station and Police Station to a new, 8-bay combined facility with dispatch (does not include site acquisition)
Construct a new submersible pumping station at WWTP and relocate the WWTP to another in-town location* or connect to a nearby WWTP facility
*Cost estimates for a new facility in town would require further study and may be able to leverage the outcomes of Manchester’s ongoing facilities master planning study that is currently evaluating possible Town-owned sites for a new Department of Public Works facility, as the existing facility on Pleasant Street has reached its useful life.
$60,000,000
Design and construction of new submersible pumping station:
$5,000,000
WWTP demolition and new force main connection options: $29,000,000 to $44,000,000
Design and construction of a 3- to 4-ft berm with 10-ft flat top, including a passive, horizontal deployable 4-ft flood barrier across Beach Street (easements needed)
Demolition and removal of material (assuming no contamination) and restoration of a portion of the Town Hall parking lot and the whole of the 14 Church Street lot
Conversion of Masconomo Park to a floodable park with a floodable fulldepth parking lot along Beach Street
Establish new public waterfront access/amenity via a floating boardwalk along the east side of the the inner harbor from Masconomo Park to the Town Hall parking lot
Buyout, demolition, material removal (assuming no contamination), and restoration of Buyout Area 1
$7,300,000 to $8,300,000
$400,000
$500,000 to $1,000,000
$350,000
$11,500,000 to $12,500,000
Buyout, demolition, material removal (assuming no contamination), and restoration of Buyout Area 2 $10,000,000 to $10,500,000
Buyout, demolition, material removal (assuming no contamination), and restoration of Buyout Area 3 $4,100,000
Elevate the low-lying portion of Beach Street to el. 14 ft (NAVD88) $2,500,000 to $3,000,000
Elevate residential and commercial buildings to el. 14 ft (NAVD88) along Beach Street between the rail lines and Tappan Street
$1,200,000 to $1,600,000
Elevate Tappan Street to el. 14 ft (NAVD88) $700,000
Elevate to el. 14 ft (NAVD88) or buyout, demolition, material removal (assuming no contamination), and restoration of at-risk properties along Tappan Street
Elevate all buildings: $2,000,000 to $2,500,000 or Buyout, etc. of all building areas: $7,900,000
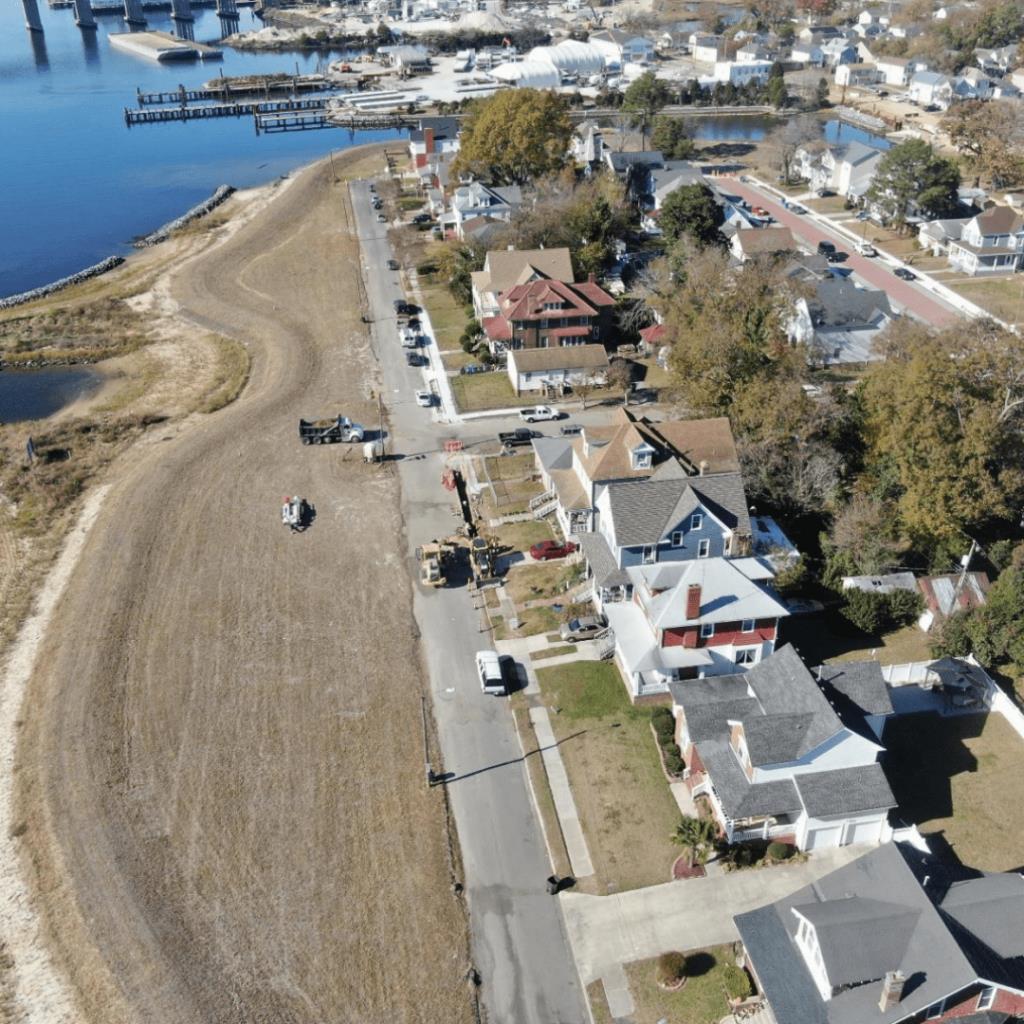
Elevated barriers like berms can reduce the risk of coastal flooding in low-lying areas
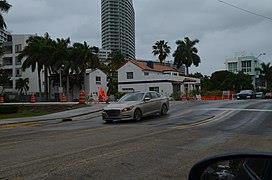


Raising low-lying roads can allow access to be maintained during certain flood events and can reduce flood risk in nearby low-lying areas

Deployable flood barriers can provide temporary flood protection when needed and then be incorporated into the fabric of the streetscape when not in use – allowing the passage of cars and pedestrians


Norfolk, VA
Elevated berm near coastal shoreline
(Image credit: NFKVA Currents, 2022)
Road raising project
(Image credit: CC 1.0)
Miami, FL
Wakefield, UK
Flip-up flood barriers that can be remotely deployed and incorporated into the street
(Image credit: Flood Control International)
4. Alternative Scenarios & Recommended Actions |
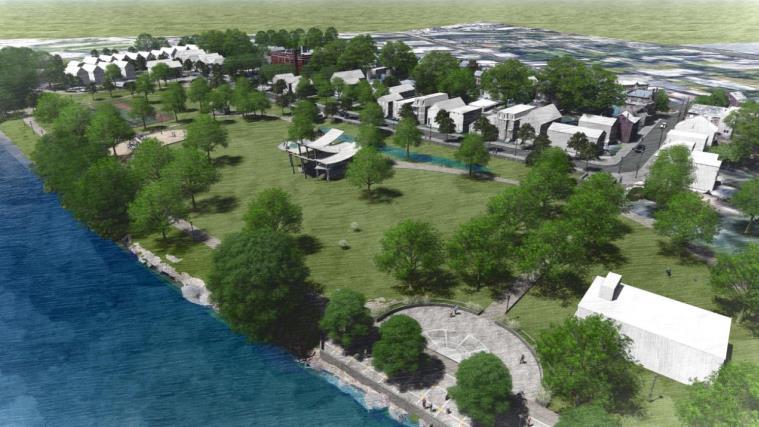
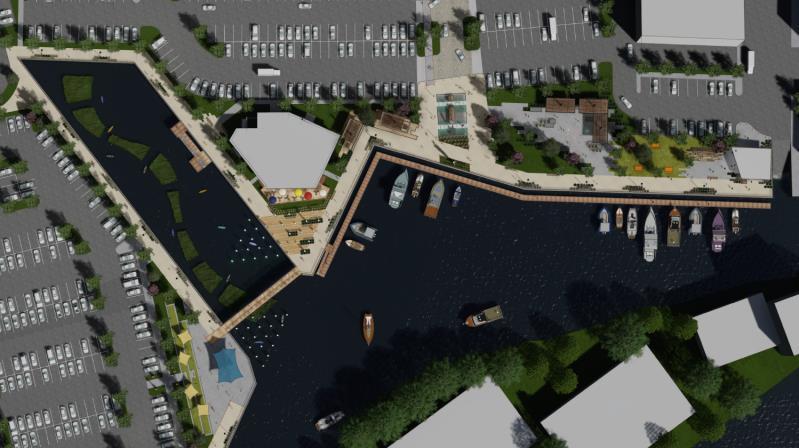
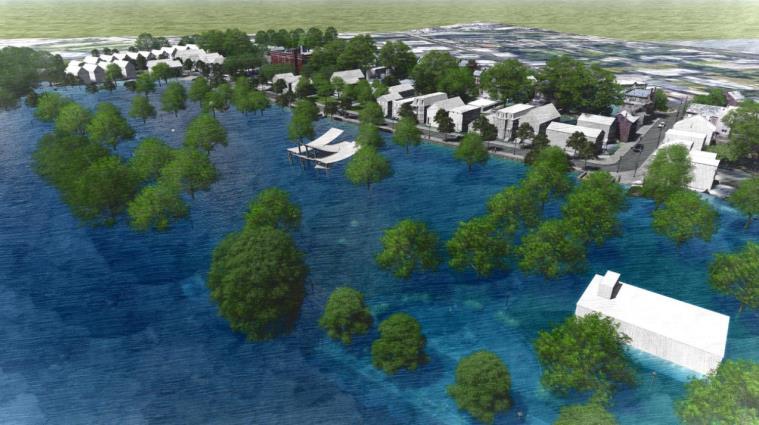
Floodable parks can be used to help buffer coastal storm events while also serving as a public amenity providing recreational and social gathering opportunities



Floating boardwalks can be incorporated into existing waterfronts to provide a climate resilient approach to improved access to the local waterfront


Seattle, WA
4. Alternative Scenarios & Recommended Actions |
Tallahassee, FL
Real examples of floodable coastal parks (Image credit: Marion Brenner and Halff) Modeled example of a floodable park (Fuss & O’Neill) Modeled examples of coastal waterfront boardwalk (Fuss & O’Neill)Scenario 3A was developed as one of two long-term scenarios after hearing interest from members of the community on how a flood gate might be used to provide more area-wide risk reduction in the inner harbor north of the existing Massachusetts Bay Transportation Authority (MBTA) Newburyport/Rockport Line. Following the results of the vulnerability assessment in the second phase of this project, the project team recognized early on that such a gate would require the elevation of the MBTA rail lines that run through this section of Manchester to provide enough freeboard to protect against long-term future coastal flooding events from 2070 and beyond. As shown in the visual plan on the following page, this scenario focuses on the elevation of the rail lines – along with the protection of critical town facilities within the inner harbor and similar adaptation measures to those proposed in Scenario 2 for the areas bordering Beach Street south of the rail lines.
Some of the challenges that come with implementing the actions proposed as part of this scenario include:
• Cooperation and support from the MBTA to plan for and implement the raising of lowlying sections of the Newburyport/Rockport Line (including the section through Manchester’s inner harbor)

• Berms, possible buyouts, building elevations, and road raising would still be required in the neighborhood bordered by Beach Street and Tappan Street to protect this area of the harbor
• Emergency moveable flood barriers require time to deploy and space for storage when not in use
Being that this is a long-term scenario, the scenario still proposes that the Fire Station and Police Station be relocated to another area as a measure of redundant risk reduction. However, the WWTP could remain in place with moveable flood barriers used as needed to protect the facility in the event of a major storm (e.g., storm greater than the 2070 0.2% AEP storm) overtopping the raised rail line.
During meetings with local residents, business owners, and Town staff, community members expressed some concerns over the feasibility of this scenario given the uncertainty around the MBTA’s long-term plans for the protection of its low-lying rail lines. While some expressed strong feelings that the MBTA was likely to make longterm investments in the Newburyport/Rockport Line that would enable such a scenario to be considered, others were more skeptical as to whether the rail line would remain operational long into the future. Either way, this scenario was developed as a way to engage in meaningful conversations with the MBTA and other regional partners.
Relocate Fire Station and Police Station to a new, 8-bay combined facility with dispatch (does not include site acquisition)
Construct a new submersible pumping station at WWTP and relocate the WWTP to another in-town location* or connect to a nearby WWTP facility
*Cost estimates for a new facility in town would require further study and may be able to leverage the outcomes of Manchester’s ongoing facilities master planning study that is currently evaluating possible Town-owned sites for a new Department of Public Works facility, as the existing facility on Pleasant Street has reached its useful life.
ESTIMATED ORDER OF MAGNITUDE COSTS
$60,000,000
Design and construction of new submersible pumping station: $5,000,000
WWTP demolition and new force main connection options: $29,000,000 to $44,000,000
Conversion of Masconomo Park to a floodable park with a floodable fulldepth parking lot along Beach Street
Demolition and removal of material (assuming no contamination) and restoration of a portion of the Town Hall parking lot and the whole of the 14 Church Street lot
Install 40-ft flood gate on raised rail section spanning the opening to the inner harbor, including gate and operators (excludes concrete work and controls)
Raise low-lying section* of the MBTA rail line running through the inner harbor and platform to el. 14 ft (NAVD88) (assuming minor contamination, borings needed to confirm quality of base material needed in the existing core, and does not include new rail infrastructure – e.g., signals, track )

*Note: This is only a portion of the tracks that span approximately 2,700 ft. This does not include other portions of the MBTA rail line likely to require raising throughout the rest of Manchester and the surrounding region to continue the operation of the Newburyport/Rockport Line long term.
$500,000 to $1,000,000
$400,000
$6,000,000
Elevate low-lying portion of track running through the inner harbor and elevate platform: $20,000,000 to $40,000,000
Elevate the low-lying portion of Beach Street to el. 14 ft (NAVD88) $2,500,000 to $3,000,000
Elevate residential and commercial buildings to el. 14 ft (NAVD88) along Beach Street between the rail lines and Tappan Street $1,200,000 to 1,600,000
Elevate Tappan Street to el. 14 ft (NAVD88) $700,000
Elevate to el. 14 ft (NAVD88) or buyout, demolition, material removal (assuming no contamination), and restoration of at-risk properties along Tappan Street
Elevate all buildings: $2,000,000 to $2,500,000 or Buyout, etc. of all building areas: $7,900,000
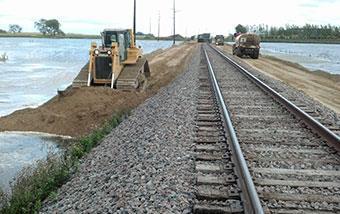
Raised rail lines can be used to improve the long-term resilience of rail lines to flooding and also reduce the risk of flooding in areas adjacent to the rail lines


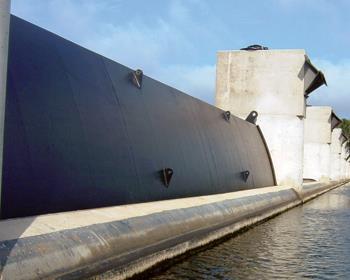
Flood gates can be used to hold back flood waters to provide more area-wide risk reduction during storm events

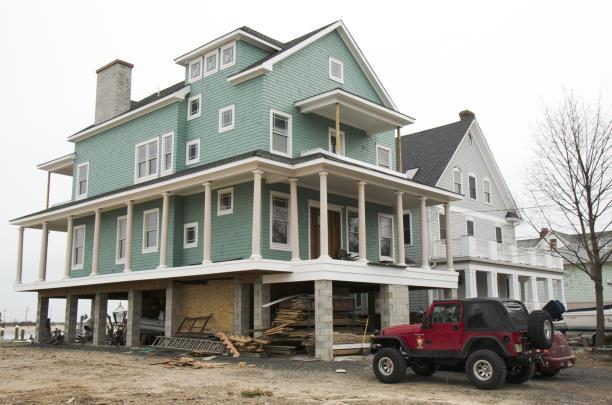
Elevating structures in place can help reduce the risk of flooding while avoiding buyouts and/or relocation

Track raising and embankment widening

(Image credit: Houston Engineering)
Crest gate mounted to the seabed for flood control (boats allowed to pass when not in use)
(Image credit: Mecan Hydro and Hydro Review)
Newport, RI
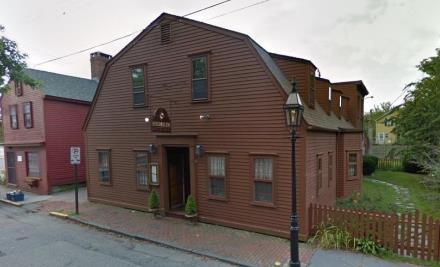
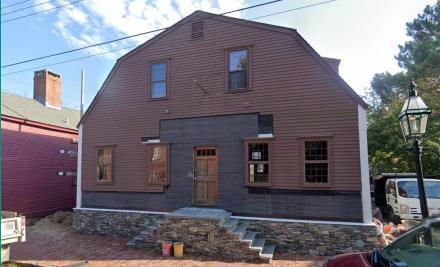
Elevations of new and historical structures
4. Alternative Scenarios & Recommended Actions
 Devils Lake, ND
Highlands, NJ
Devils Lake, ND
Devils Lake, ND
Highlands, NJ
Scenario 3B was developed as an alternative long-term scenario to Scenarios 2 & 3A, after considering comments from members of the public and Steering Committee about what a full retreat from vulnerable areas might involve. While this scenario is unlikely to be implemented given the importance placed on maintaining the structure and historic character of downtown Manchester and the inner harbor area, this scenario illustrates what actions would need to be taken if the decision was made to make minimal efforts to mitigate against flooding – and in essence, let the water in. Under this scenario, many of the structures within the downtown and eastern portion of the inner harbor study area that fall within the 2070 1% AEP storm flood extents would be bought out and restored to a natural ecosystem – creating an entirely different waterfront than exists at present. However, in an alternative version of this scenario, retreat from these areas could also present an opportunity to potentially relocate certain buildings and reconfigure the pattern of development and density of downtown Manchester.

The WWTP would still need to be decommissioned and demolished, and a submissible pump station would need to be put in place. Additionally, the Police and Fire Stations would need to be relocated to a new facility.
Some of the challenges that come with implementing the actions proposed as part of this scenario include:
• Public support for a full retreat from the existing downtown area and reimagined waterfront
• Establishing a program of planned retreat for local businesses and residents in the flood prone areas and collective cooperation among property owners
This long-term scenario would reduce the risk of flooding for many of the commercial and residential properties in the inner harbor area long term by completely buying out and restoring properties in some of the most flood prone areas under projected 2070 coastal flooding conditions.

This scenario was developed as an example of what a full retreat condition would look like. During meetings with the Steering Committee and community, the project team was encouraged to explore options to retreat under future coastal flooding scenarios. However, unlike Scenarios 2 and 3A, which incorporate some elements of planned retreat (especially in the areas bordering Central Pond and in the neighborhood bordered by Beach Street and Tappan Street), this scenario was developed to showcase more extensive, areawide retreat and is unlikely to receive widespread support. In the absence of taking the actions proposed under the other alternative scenarios presented in this plan, this scenario becomes more of a possibility long term (i.e., 2070 and beyond).
Relocate Fire Station and Police Station to a new, 8-bay combined facility with dispatch (does not include site acquisition)
Construct a new submersible pumping station at WWTP and relocate the WWTP to another in-town location* or connect to a nearby WWTP facility
*Cost estimates for a new facility in town would require further study and may be able to leverage the outcomes of Manchester’s ongoing facilities master planning study that is currently evaluating possible Town-owned sites for a new Department of Public Works facility, as the existing facility on Pleasant Street has reached its useful life.
$60,000,000
Design and construction of new submersible pumping station (no force main connections included): $5,000,000
WWTP demolition and new force main connection options: $29,000,000 to $44,000,000
Buyout, demolition, material removal (assuming no contamination), and restoration of all floodable areas
Structure demolition, material removal (assuming no contamination), new structures, elevation of land area and raising of bulkhead at Manchester Marine site to el. 14 ft (NAVD88)
$87,000,000 to $91,000,000
$23,000,000 to $24,000,000

Long-term retreat can offer residents/businesses an opportunity to relocate and/or consider buyouts and restoration of flood-prone properties

In the restored floodable areas, a reimagined waterfront can be established to create new connections to the water and opportunities for improved community access and public amenities



Model of a reimagined waterfront area providing access to floodable areas and new public amenities

 Existing conditions
Flood event under existing conditions
Restoration in areas where future buyouts have the potential to occur
Restoration areas during flood event
(Fuss & O’Neill)
(Fuss & O’Neill)
4. Alternative Scenarios & Recommended Actions |
While the scenarios presented above represent actionable, visual roadmaps for addressing coastal flooding in Manchester’s inner harbor over time, several actions can be taken now to begin implementing meaningful risk reduction measures. These actions include:
Implement several of the near-term actions from Scenario 1 that do not require the same level of costly investment to yield immediate benefits to the community. These include:
• Leverage existing funds to replace generators and concurrently elevate critical generators –especially at Town Hall and the Fire Station.
• Install check valves at critical outfalls within the study area to address stormwater drainage issues.
• Floodproof low entries at the WWTP, Police Station, and Fire Station.
To ensure that the plan remains actionable over time and serves as a living roadmap for increased coastal resilience, a governance structure should be put in place to oversee the prioritization and implementation of actions over time. Steps in this process could include:
• Bring the plan before the Select Board to decide who will guide the implementation of the plan. This could result in asking members of this project Steering Committee to join forces with members of an existing committee (e.g., Sustainability Committee) to oversee the implementation of the plan and future iterations of the plan over time.
• Establish a method for evaluating and prioritizing actions based on community goals that may stretch beyond coastal flood resilience to also include priorities related to economic development, accessibility, public health and safety.

While this plan was generously supported by a Coastal Resilience Grant from the Office of Coastal Zone Management (CZM), other grant mechanisms should be explored in the future to unlock additional funding to support the implementation of additional actions. These funding mechanisms could include:
• FEMA Hazard Mitigation Assistance Grant Programs
• National Coastal Resilience Fund
• Massachusetts Municipal Vulnerability Preparedness (MVP) Action Grant Program
• Environmental Impact Bond
Recognizing that many of the longer-term actions proposed in this plan (e.g., decommissioning the WWTP, raising the MBTA rail lines) will require local and regional coordination, starting now, it would be useful to:
• Share this action plan widely with others in the Manchester and broader Cape Ann community.
• Develop a regional working group (or leverage an existing group) to start conversations with important regional entities like the MBTA on long-term coastal resilience planning.
• Continue to make intentional connections between this plan and other long-term planning efforts (e.g., Municipal Facilities Master Plan, Harbor Master Plan) led by established committee/groups in Manchester (e.g., Planning Board, Sustainability Committee, Bicycle/Pedestrian Committee, Conservation Commission, Downtown Improvement Committee)

CDM Smith. (2019). Wastewater Treatment Plant - CDM Smith Site Visit and Preliminary Assessment.
CDM Smith. (2021). Wastewater Treatment Facility Decommissioning Study
DeConto, R. M., & Kopp, R. E. (2017). Massachusetts Sea Level Assessment and Projections.
Famely, J., & O’Connell, A. (2023). Manchester Harbor Climate Change Vulnerability Assessment.
Finkle, A. (2023). Re: Resource Area Delineation – Manchester Harbor
IPCC. (2023). AR6 Synthesis Report: Climate Change 2023.
NOAA. (2023). Chapter 4 - Variations in the Range of the Tides: Tidal Inequalities. Our Restless Tides. https://tidesandcurrents.noaa.gov/restles4.html
Rimmer Environmental Consulting. (2015). Wetland Delineation and Evaluation
Sweet, W. V., Hamlington, B. D., Kopp, R. E., Weaver, C. P., Barnard, P. L., Bekaert, D., Brooks, W., Craghan, M., Dusek, G., Frederikse, T., Garner, G., Genz, A. S., Krasting, J. P., Larour, E., Marcy, D., Marra, J. J., Obeysekera, J., Osler, M., Pendleton, M., … Zuzak, C. (2022). 2022: Global and Regional Sea Level Rise Scenarios for the United States: Updated Mean Projections and Extreme Water Level Probabilities Along U.S. Coastlines. In NOAA Technical Report NOS 01.
Tetra Tech. (2021). Maritime Visitor Center – Facility Siting Assessment.
Tighe & Bond. (2014). Flood Zone Expansion with Sea-Level Rise.
Tighe & Bond. (2015). Downtown Low Impact Development (LID) Feasibility Study.
Tighe & Bond. (2017). FEMA Hazard Mitigation Plan Enhancement: Task 3 Vulnerability and Risk Assessment Manchester-by-the-Sea.
Tighe & Bond. (2018). Town of Manchester-by-the-Sea: Community Resilience Building Workshops Summary of Findings.
Tighe & Bond. (2019). Flood Mitigation Alternatives for Critical Town Facilities.
Weston & Sampson. (2020). Manchester-by-the-Sea Athletic Fields Master Plan.
Woods Hole Group. (2016, November). Modeling the Effects of Sea-Level Rise on Coastal Wetlands. https://tidesandcurrents.noaa.gov/restles4.html
Woods Hole Group, & UMass Boston. (2022). The Massachusetts Coast Flood Risk Model: Modeling Overview and Frequently Asked Questions
Appendix A: Data Collection References
Appendix B: Coastal Resource Area Delineation
Appendix C: Manchester Harbor Climate Change Vulnerability Assessment
Appendix D: Summary of Benefits Assessment
FEMA. (2014). National Flood Hazard Layer FIRMette.
MEMA, & EEA. (2018). State Hazard Mitigation and Climate Adaptation Plan.
National Parks Service. (1989). National Register of Historic Places Registration Form: Manchester Village Historic District.
NE CASC. (2018). Massachusetts Climate Change Projections. Northeast Climate Science Center, University of Massachusetts Amherst.
Tighe & Bond. (2017). FEMA Hazard Mitigation Plan Enhancement: Task 3 Vulnerability and Risk Assessment Manchester-by-the-Sea.
Tighe & Bond. (2018a). Manchester-by-the-Sea: FEMA Hazard Mitigation Plan
Tighe & Bond. (2018b). Town of Manchester-by-the-Sea: Community Resilience Building Workshops Summary of Findings.

Natural Resource References:
Chase, B. C. (2006). Rainbow smelt (Osmerus mordax) spawning habitat on the Gulf of Maine coast of Massachusetts. Massachusetts Division of Marine Fisheries.
Chase, B. C. (2009). The Spawning Habitat of Anadromous Rainbow Smelt: Trouble at the Tidal Interface. American Fisheries Society Symposium, 69, 859862.
FWS. (2016). Small Whorled Pogonia: Isotria medeoloides. In Threatened and Endangered Species.
FWS. (2020a). National Wetlands Inventory: Manchester by the Sea Central St Bridge and Central Pond. In National Wetlands Inventory
FWS. (2020b). Official Species List, Project Name: Central Street Bridge Replacement and Central Pond/Sawmill Brook Restoration.
MHC. (2020). Project Area Relative to Massachusetts Historic Commission Inventory Areas and Points. In Massachusetts Historical Commission.
NHESP. (2020). Project Area Location Relative to NHESP Mapped NLEB Winter Hibernacula. In Natural Heritage & Endangered Species Program
Board of Selectmen, M.-S. (2019). Minutes of the Board of Selectmen.
Historic District Commission, M.-S. (2019). Letter of Support - Central Street Bridge Replacement Project
Tighe & Bond. (2015). Sawmill Brook Central St Seawall, Tide Gate & Culvert Observations .
Tighe & Bond. (2018a). Task 2: Hydrologic Monitoring and Flushing Studies - Sawmill Brook Flood Mitigation and Restoration Project
Tighe & Bond. (2018b). Task 3: Sediment Characterization and Sediment Transport - Sawmill Brook Flood Mitigation and Restoration Project.
Tighe & Bond. (2019a). Coastal Resiliency Criteria
Tighe & Bond. (2019b). Geotechnical Evaluation for Retaining Wall Improvements Sawmill Brook –Central Pond Restoration.
Tighe & Bond. (2019c). Sawmill Brook Restoration Project – Review of Technical Feasibility of Tide Gate Removal.
Tighe & Bond. (2019d). Sawmill Brook Restoration Project – Summary of Preliminary Concepts and Alternatives Recommendations.
Tighe & Bond. (2020). Sawmill Brook Central Pond Restoration Project Phase 2: Permitting and Final Design - MVP Case Study Report.
Tighe & Bond. (2016a). Sawmill Brook Culvert and Green Infrastructure Analysis Task 4 Final Report: Evaluation of Locations for Flood Mitigation .
Tighe & Bond. (2016b). Sawmill Brook Culvert and Green Infrastructure Analysis Task 4 Final Report: Evaluation of Locations for Flood Mitigation - Appendices.
Tighe & Bond. (2019). Central Street Bridge Replacement Hydrologic and Hydraulic Analysis.
Engineering Design References
Tighe & Bond. (2019a). Central Street Bridge Permitting Plans.
Tighe & Bond. (2019b). Central Street Bridge Replacement Basis of Design Memorandum.
Tighe & Bond. (2019c). Restored Sawmill Brook Architectural Rendering.
Tighe & Bond. (2020a). Sawmill Brook Central Pond Restoration Project Phase 2: Permitting and Final Design - MVP Case Study Report.
Tighe & Bond. (2020b). Task 2: Living Shoreline Design Sawmill Brook Central Pond Restoration Project.
Permitting References
Coastal Zone Management. (2019). Memorandum - EEA-16128, Central Street Bridge
Reconstruction and Central Pond/Sawmill Brook Restoration Project; Manchester-by-the-Sea.
Conservation Commission, M. (2020a). Order of Conditions Central & Elm St DEP File #039-0832. Conservation Commission, M. (2020b). Order of Conditions Central Pond Restoration project DEP File #039-0824.
Tighe & Bond. (2019a). Central Street Bridge Reconstruction & Central Pond / Sawmill Brook Restoration Project ENF Narrative.
Tighe & Bond. (2019b). Site Photographs - ENF Appendix B.
Tighe & Bond. (2019c). Transmittals of the Central Street Bridge Reconstruction & Central Pond / Sawmill Brook Restoration Project Environmental Notification Form (ENF).
Tighe & Bond. (2020). Central Pond/Sawmill Brook Restoration Project Central Street, Manchesterby-the-Sea 401 Water Quality Certification.
Town of Manchester-by-the-Sea. (2013). Manchester-by-the-Sea Town Report.

Public Outreach References
Tighe & Bond. (2018a). Sawmill Brook/ Central Pond Restoration FY 19 MVP Action Grant Kickoff Presentation.
Tighe & Bond. (2018b). Sawmill Brook Flood Mitigation and Restoration Project, Task 4: Public Outreach, MET Grant Report.
Tighe & Bond. (2020). Summary of Grants, Public Outreach and Articles.
June 12, 2023
Alex Maxwell, PhD Fuss & O'Neill, Inc.115 Broad Street 6th Floor
Boston, MA 02110
Sent via email: AMaxwell@fando.com

Re: Resource Area Delineation – Manchester Harbor

Dear Dr. Maxwell,
On January 17th, 2023, a Woods Hole Group Coastal Scientist conducted a site visit to review and QA/QC the 2015 coastal resource area delineation conducted by Rimmer Environmental Consulting along the shoreline of Manchester Harbor, Manchester-by-the-Sea, Massachusetts. During the site visit, it was determined that additional field data collection (survey points) was warranted, which would also allow the focus of the Task to shift from basic QA/QC of the Rimmer report to a more robust resource area delineation. The survey extended from the point of land located west of the parking area in Masconomo Park north around the upper basin of Manchester Harbor, terminating at the pocket beach west of Crocker’s Boat Yard (Figure 1). In addition to the extents of the resource area delineation shown in Figure 1, the Woods Hole Group field team also conducted additional reconnaissance along the southern shore of Masconomo Park. If conceptual alternatives include resilience-building actions in the park, any subsequent scope of work should include formal delineation of this section of shoreline.
Figure 1. Extent of resource area delineation and additional site recon.Coastal resource areas surveyed in the field included coastal bank, coastal beach, salt marsh, and rocky intertidal shore. The extents of all coastal resource areas observed on-site were surveyed using a Trimble R8 survey-grade Real-Time Kinematic (RTK) Global Positioning System (GPS) at sub-centimeter accuracy in both horizontal and vertical datums. RTK-GPS data were collected in the Massachusetts State PlaneMainland NAD83 (horizontal) and NAVD88 (vertical) datums, in units US survey feet. Site photographs were taken at 100’ intervals along shore within the project area. Site photos and point data were reviewed by a Woods Hole Group Professional Wetland Scientist (PWS) to confirm extents all field delineations. Land Subject to Coastal Storm Flowage was also mapped and detailed in this report using data from the FEMA Flood Map Service Center. An overview of resource area extents is provided in Figure 2. Descriptions of each resource area are included in the following sections.


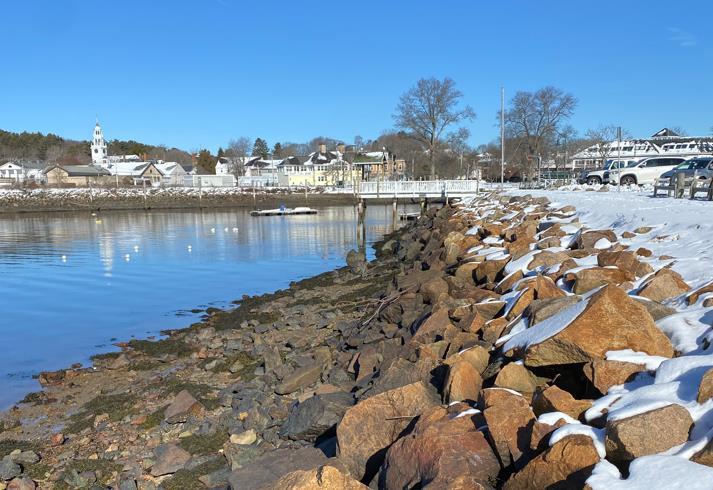
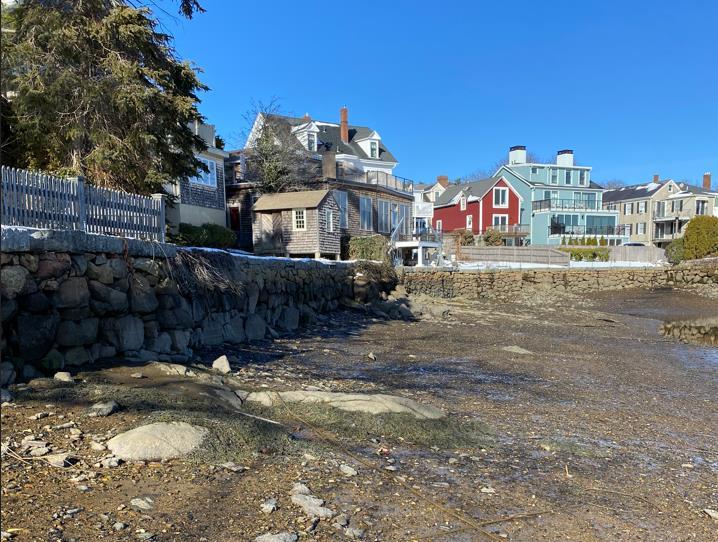
The entire shoreline within the study area was armored by a variety of coastal engineering structures including sloping rock revetments, seawalls, bulkheads, and knee walls (Figures 3-6). The presence of these structures precludes native coastal bank sediments from eroding and conveying to resource areas located seaward of the bank. Therefore, all banks abutting the upper basin were found to be nonsediment source coastal banks. It is important to note that non-sediment source coastal banks still act as a vertical buffer providing storm damage protection to landward assets.
Given the highly developed nature of the site, and heavy armoring of the coastal bank, no vegetation was observed physically growing on the coastal bank. Along the western shoreline of the terminal upstream basin of Manchester Harbor, high marsh species including salt marsh hay (S. patens) and spike grass (D. spicata) were observed growing along to toe of the coastal bank abutting the salt marsh. Invasive Asiatic bittersweet (C. orbiculatus) and English ivy (H. helix) were also observed.



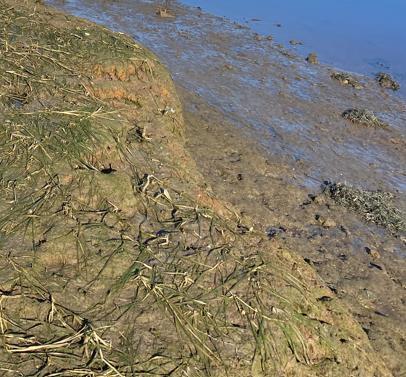
The salt marsh at the project site was limited to the western shoreline of the upper terminal basin of Manchester Harbor abutting private parcels. The fringing salt marsh in this location was primarily a low marsh – dominated by smooth chord grass (S. alterniflora) with some limited S. patens and D. spicata also observed, characteristic of New England coastal salt marshes (Figure 7-8). The fringing marsh showed some signs of vegetative stress and degradation, with areas of die back, algal growth, and erosion visible on the marsh plain and on the seaward edge of the resource area (Figures 8-9).


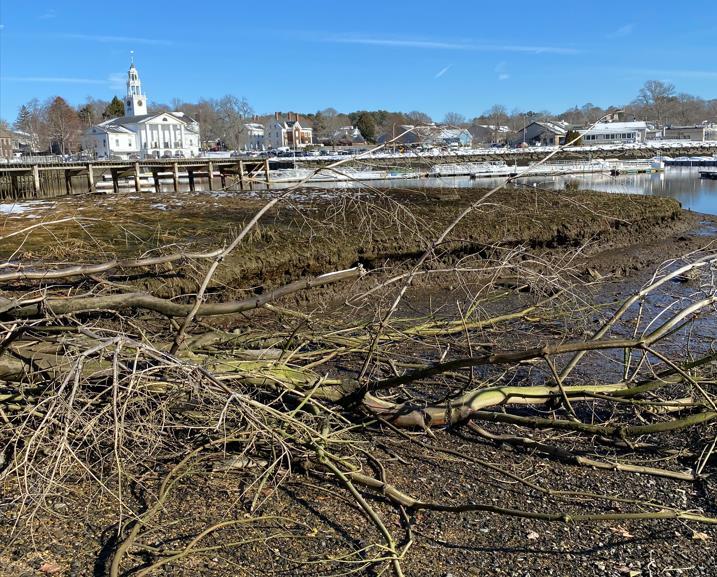


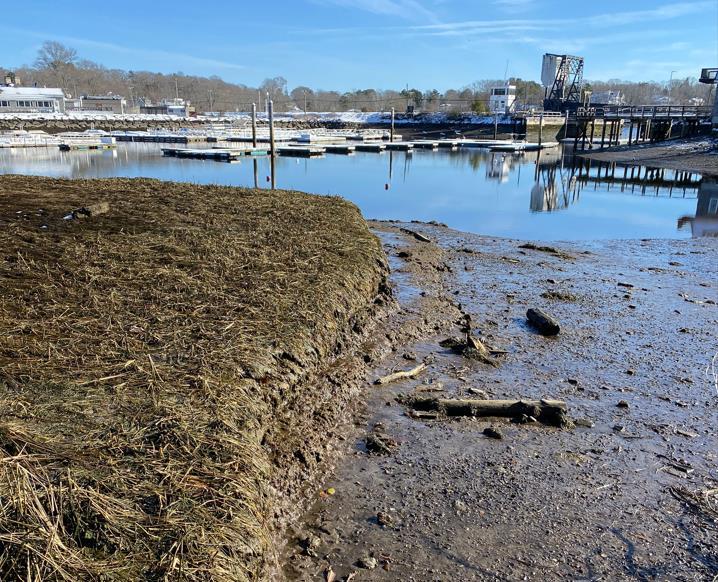

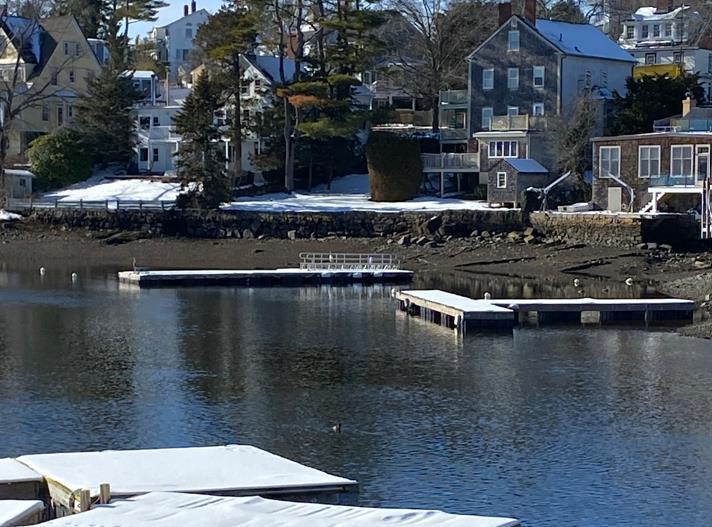
Rocky intertidal shore was mapped in 2 discrete locations in the study area (Figures 11-12). One small patch was mapped west of the parking area in Masconomo Park, and a second small patch was mapped just south of the fringing salt marsh located on the western shoreline of the upper terminal basin of Manchester Harbor. It is important to note that the toe of the sloping rock revetments along the northern shore of Masconomo Park and the eastern shore of the upper terminal basin contained fixed boulders with attached macroalgae that met the definition for rocky intertidal shore (Figures 13-14). However, because these areas are part of existing coastal engineering structures, the do not meet the performance standards for rocky intertidal shore as defined in the Massachusetts Wetlands Protection Act 3.10CMR10. Therefore, they were not delineated as rocky intertidal shore. This determination is consistent with guidelines outlined in the 2017 update to the Massachusetts Coastal Zone Management Office guide to Applying the Massachusetts Coastal Wetland Regulation (Coastal Manual). Mapped areas of rocky intertidal shore contained medium 6-8” cobble with some small 1-2’ boulders. Only limited attached macroalgae was observed.


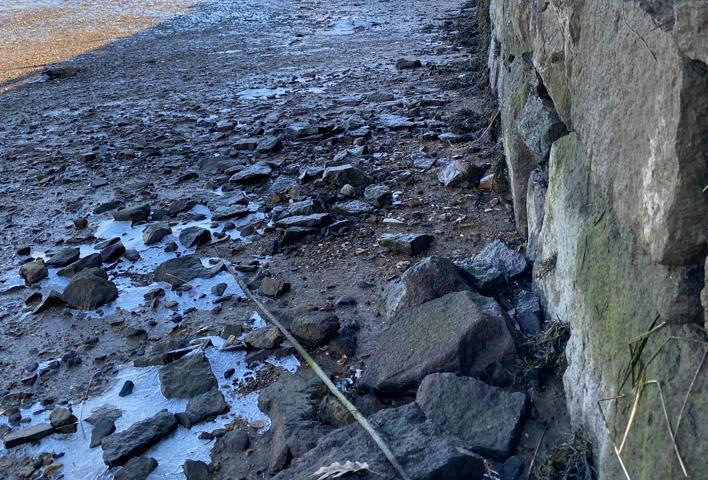
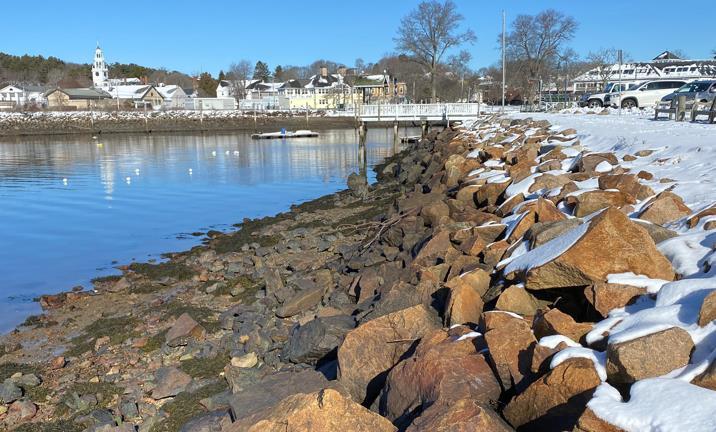

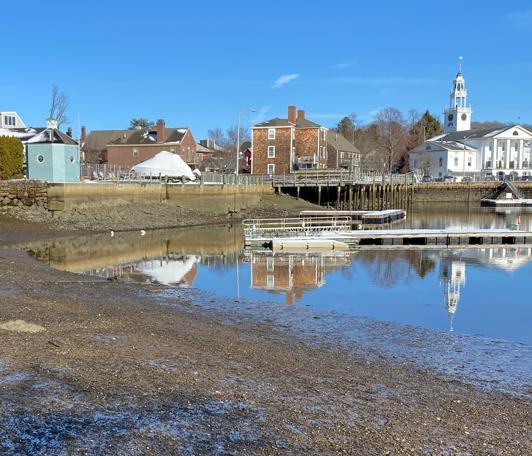
A series of small “pocket” coastal beaches were delineated seaward of the coastal engineering structures along the roadway east of Masconomo Park, along the southern shoreline of the railroad berm east of the drawbridge, along the western shoreline of the upper basin of Manchester Harbor, and immediately west of Crocker’s Boat Yard (Figures 15-19). Apart from the small pocket beach located west of Crocker’s Boat Yard, which was comprised of medium to coarse grained sand and gravel, the coastal beaches at the project site were comprised of medium to fine grained sediments overlain with mud. Seaward of the beaches, sediment quality because increasingly fine-grained, terminating in mudflat exposed during low tide periods (Figure 19). Again, given the highly developed nature of the shoreline and highly trafficked harbor, the beaches were devoid of vegetation.
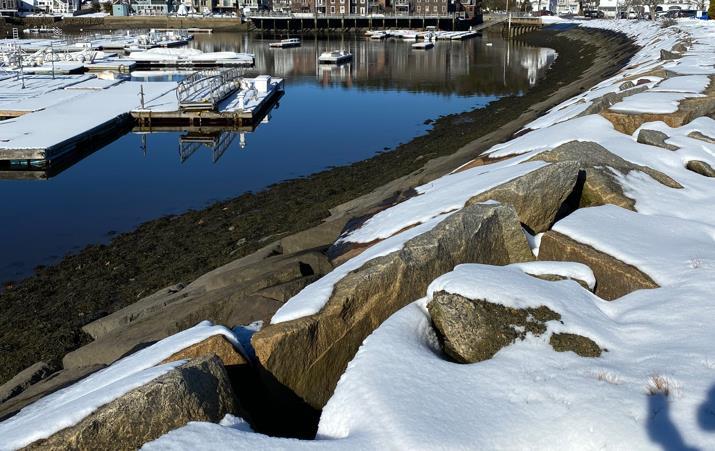

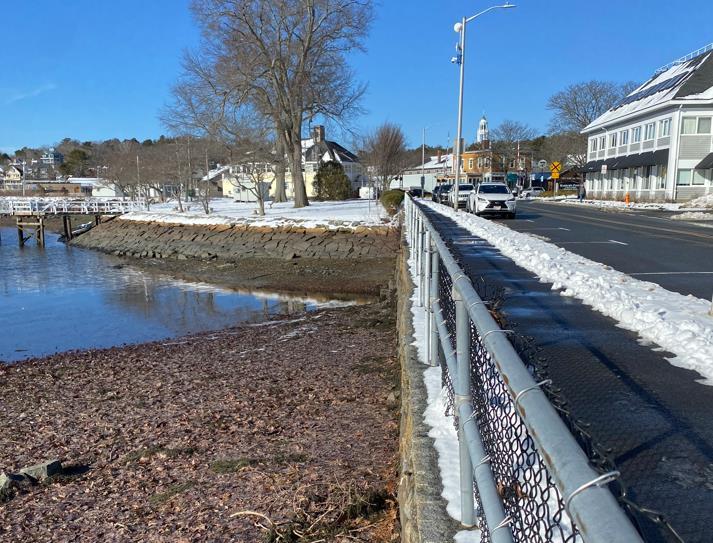
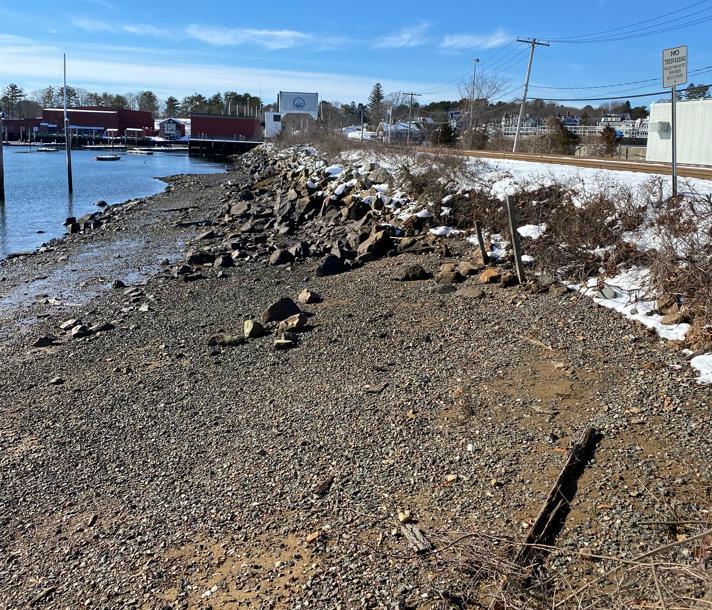



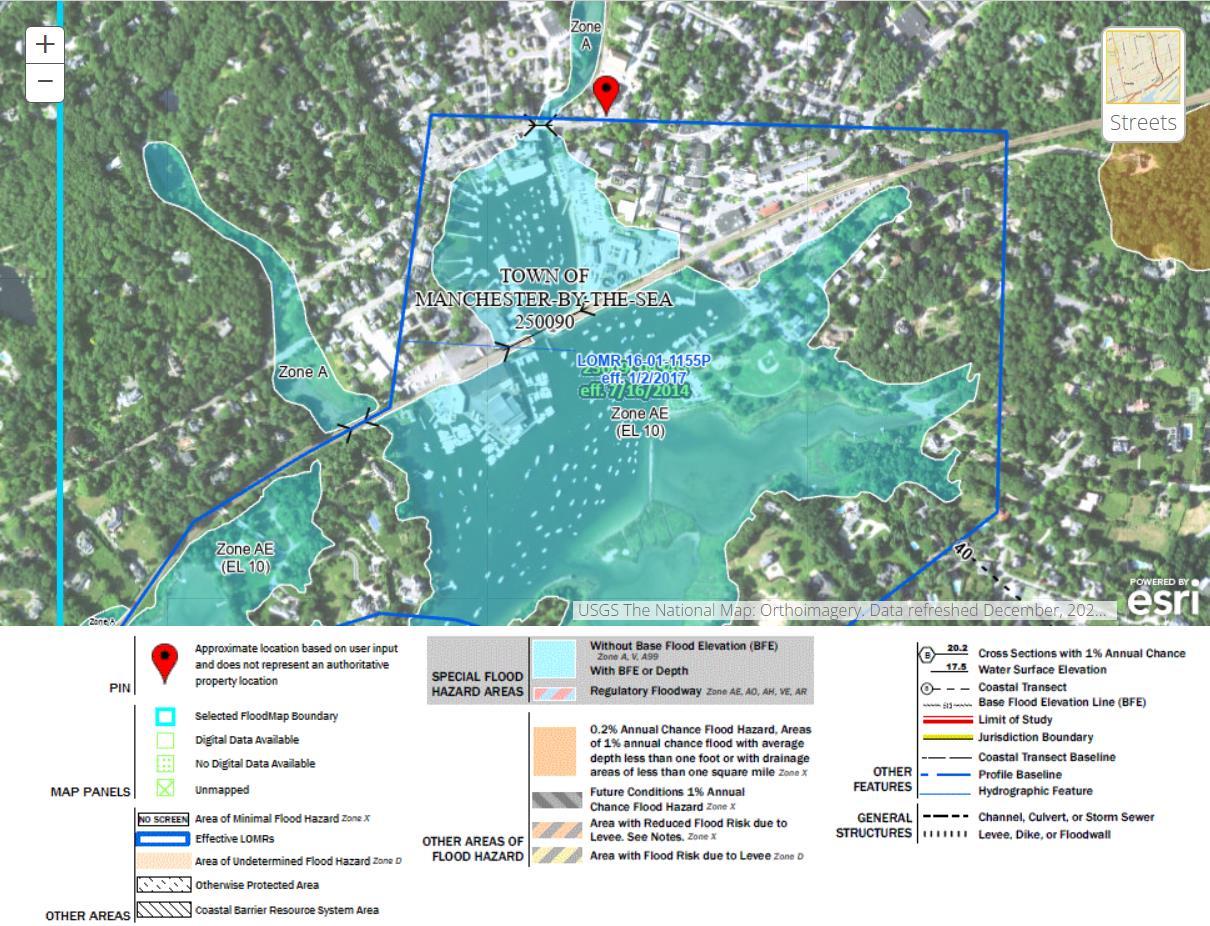
Land subject to coastal storm flowage (LSCSF) extended throughout the study area, extending up to the Base Flood Elevation (10.0’) of the site (Figure 20). As a result, LSCSF also encompasses all the resource areas that were observed on site.

No Estimated or Priority Habitat for Rare or Endangered Species was identified within the study area by the Massachusetts Natural Heritage and Endangered Species Program (Figure 21). However, a significant portion of the study area was identified as spawning and settlement habitat for soft-shell clam (Mya arenaria) and quahog (M. mercenaria) (Figure 21). Mya arenaria habitat also extended outside the study area downstream of Masconomo Park.
Masconomo Park acts as an open space, recreational, and flood damage protection asset to the Town of Manchester-by-the-Sea. If the land area of the park is leveraged to build local or regional resilience during subsequent phases of the project, it will be important to delineate coastal and/or freshwater resource areas abutting the site. During the January 2023 site visit, the field team conducted reconnaissance along the Masconomo Park shoreline (which was beyond the scope of the assessment) but did not delineate any resource areas. Field notes and a cursory overview of site photos indicate that sediment source (unarmored) coastal bank, coastal beach, fringing salt marsh, mudflat, rocky intertidal shore, and/or land subject to coastal storm flowage may be present (Figure 27). Unarmored coastal banks also often leach groundwater, leading to the formation of bordering vegetated wetland between the toe of the coastal bank and the saltmarsh. Prior to developing any resilience building actions or alternatives that leverage the land area of Masconomo Park, it will be important to delineate all resource areas to determine the potential impact of said actions and/or alternatives.

If you have any questions or require any further information, please do not hesitate to contact me directly at 508-495-6272 or via email at afinkle@woodsholegroup.com


Sincerely,
 Adam Finkle Coastal Scientist, PWS, CERP
DATE April 14, 2023
TO Nathan Desrosiers, PE Town Engineer and Facilities Manager Town of Manchester FROM Joseph Famely and Annie O’Connell Woods Hole GroupJOB NO. 2022-0130

Manchester-by-the Sea (Manchester) is a coastal town in Massachusetts. Residential homes, commercial businesses, and buildings that serve the community share space on all sides of inner Manchester Harbor (Figure 1). Due to the lowlying geography and proximity to the waterfront, the area surrounding the harbor is susceptible to both sea level rise and storm surge flooding. To address this issue, this project aims to create a comprehensive concept plan that will help mitigate the risk of flooding and adapt to the effects of climate change in the Manchester Harbor area. This technical memorandum outlines the approach used to determine building/asset vulnerability within the Manchester Harbor project area and provides insight into future flooding scenarios to inform decisions regarding flood risk adaptation at the building and neighborhood scales) and long-term planning. The memo also reviews potential future coastal habitat conditions in the project area based on sea level rise projections.

The Massachusetts Coast Flood Risk Model (MC-FRM) is a probabilistic hydrodynamic model that is used as the state standard for coastal climate change planning in Massachusetts (MC-FRM FAQ, 2022). The MC-FRM considers a variety of factors such as sea level rise projections, historical and projected future hurricanes and nor'easters, elevation data, and land cover data to provide an accurate representation of potential flood impacts along the state’s coast. With coastal communities facing significant risks from rising sea levels and increasingly intense storms due to climate change, the MC-FRM model is an essential tool for decision makers in identifying areas that are most vulnerable to flooding. The model provides the most accurate representation of potential future flood impacts, helping communities better prepare for future storms and sea level rise by developing informed strategies to mitigate those risks.
The outputs of the model include 2030, 2050, and 2070 storm surge flooding projections for a range of annual exceedance probabilities (AEPs). This vulnerability assessment evaluated potential future flood risk to infrastructure in the study area on a site-specific basis. Buildings outside the study area but within the zone of potential future flood exposure were evaluated in a desktop analysis to provide supplementary information and guide planning efforts.

Tidal flooding, an increasing concern for coastal communities like Manchester, is affected by tidal heights that vary throughout the day, month, and year. In Massachusetts, high tides occur twice daily on a semidiurnal tide cycle, with one of the two high tides being higher due to diurnal inequality. Mean Higher High Water (MHHW) is a useful vertical elevation reference that represents the average of all daily higher high tides that occur throughout a 19-year tidal epoch. The latest National Tidal Datum Epoch (NTDE) covers the period from 1983 to 2001 and is currently used as the standard for tidal measurements in the United States. Current tidal datums representative of this 19-year period (a period long enough to account for lunar and solar variability) are location-specific and are derived from calculations based on tidal data collected at tide gauge stations maintained by the National Oceanic and Atmospheric Administration (NOAA).
Massachusetts has developed projections of future mean sea level elevation for use in climate change planning that are locally downscaled from global climate models and provide a probabilistic crosswalk for a range of scenarios (DeConto & Kopp, 2017). These scenarios include different greenhouse gas emissions futures and different contributions from global ice sheet melt. The state uses the High scenario for climate change planning, which for nearby Boston corresponds to 1.3 feet of additional sea level rise as soon as 2030, 2.5 feet as soon as 2050, and up to 4.3 feet as soon as 2070 (Figure 2). Use of the High scenario is deliberately conservative regarding improvements to policies and actions that may slow the rate of sea level rise so that planning measures are not under-predicting future sea levels. These sea level rise projections are used to assess potential high tide flooding over time and are also incorporated into the MC-FRM storm surge model.
MC-FRM incorporates sea-level rise projections and generates future tidal benchmarks, including MHHW water surface elevations, for 2030, 2050, and 2070, providing decision-makers with information on areas that may be most impacted by tidal flooding in the future. MC-FRM output water surface elevations are in feet above the North American Vertical Datum of 1988 (NAVD88), a commonly used vertical datum used in North America to measure elevation

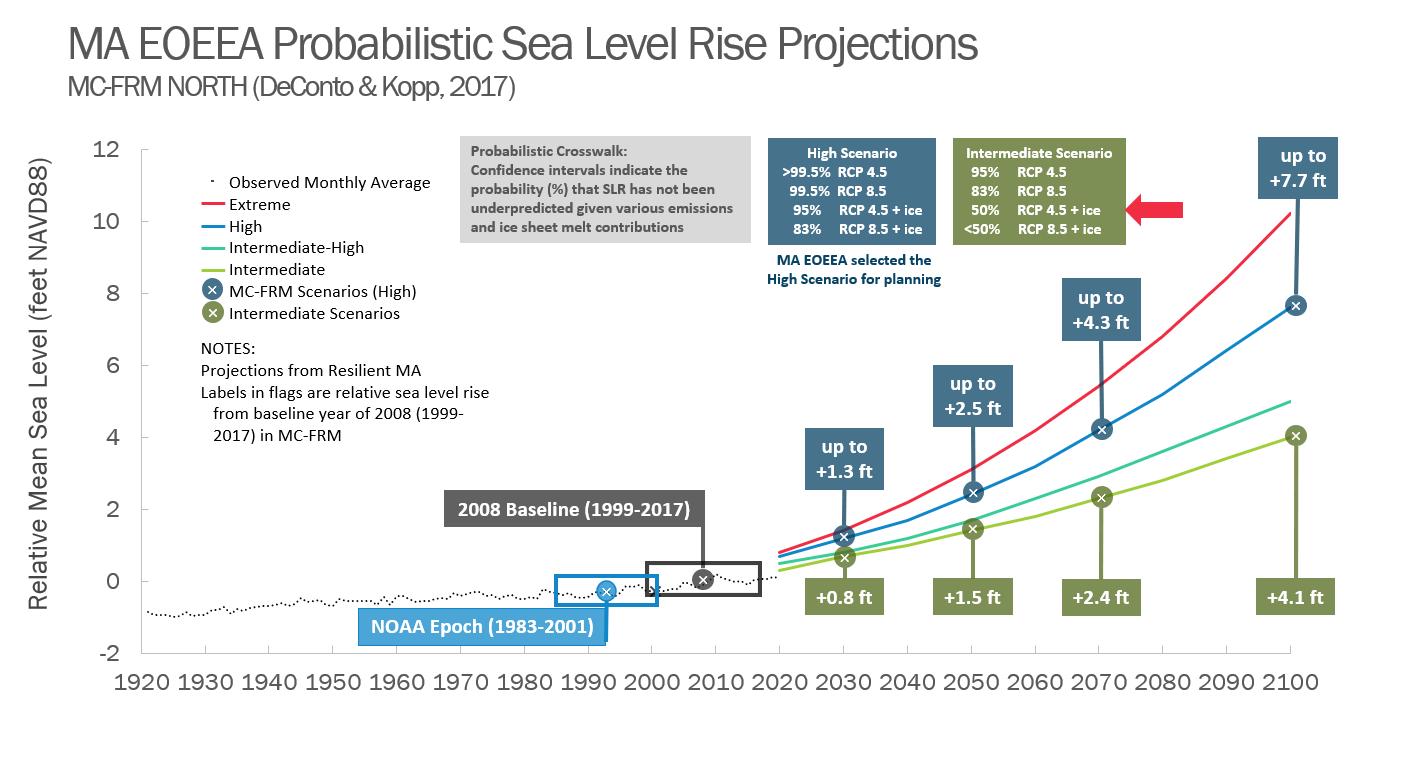
Woods Hole Group deployed tide gauges in the inner and outer harbor areas to monitor water levels over the period of 11/30/22 – 1/18/23 (a period that captures nearly all of the tidal constituents). These tide gauges were utilized to locally refine projected tidal benchmarks from MC-FRM in case the MBTA bridge and tracks forming the Inner Harbor introduced attenuation into the system. Attenuation would correspond to a reduction in the amount of water able to enter the estuary on an incoming tide due to morphological constrictions, resulting in lower peak water levels. The information gathered (Figure 3) established that the MBTA bridge and tracks do cause slight restrictions to tidal flow, so adjustments to the Mean High Water (MHW) and Mean Low Water (MLW) tidal benchmarks for the inner harbor were recommended (Table 1). However, the restriction is not large enough to meaningfully differentiate inner and outer harbor Mean Lower Low Water (MLLW) and MHHW. The MC-FRM MHHW tidal benchmarks were determined to be representative of local conditions for the entire study area in Manchester.
Based on MC-FRM projected tidal benchmarks, MHHW in Manchester Harbor could reach 6.2 ft NAVD88 by 2030, 7.5 ft NAVD88 by 2050, and 9.4 ft NAVD88 by 2070 (Table 1). For comparison, the current MHHW datum in nearby Boston Harbor is 4.77 ft NAVD88. While Boston Harbor has the closest tidal gauge station to Manchester, there is still a significant distance between the two locations which creates uncertainty in utilizing Boston tidal datums for this site. It is also important to note that this datum comes from the 1983 – 2001 tidal epoch, and will be updated in 2025 with a new datum centered on years 2002-2020. For reference, the average of the higher high water levels measured for this project over the 11/30/22 – 1/18/23 period was 4.94 ft NAVD88 (note that this calculation does not remove the effects of surge/wind and included the 12/23/22 storm).

Woods Hole Group developed GIS representations of these projected future MHHW extents (Figure 4) by extracting corresponding elevation contours from the most current terrain elevation measurements available from the MassGIS

LiDAR Terrain Data. LiDAR, which stands for Light Detection and Ranging, is a remote sensing technology that uses laser light to create highly accurate and detailed maps of the contours of Earth’s surface.
According to sea level rise projections for the Manchester Harbor study area, most of the project area should remain unaffected by daily tidal flooding in the near-term (2030) time horizon. As soon as 2050, areas of Masconomo Park, paved areas behind Town Hall, southern portions of the Manchester Marine bulkhead, and the back of buildings on School Street along Sawmill Brook could become flooded more regularly. As soon as 2070, residential areas on Beach Street and Tappan Street, and expanded portions of the inner Manchester Harbor including the Town’s wastewater treatment plant could be affected by (on average once daily) tidal flooding (Figure 4). Outside the study area, the Town’s Fire Station on School Street could experience tidal flooding in the lower parking lot along Sawmill Brook as soon as 2050 and inundation of lower portions of the building (including the lower garage and mechanical room) as soon 2070.
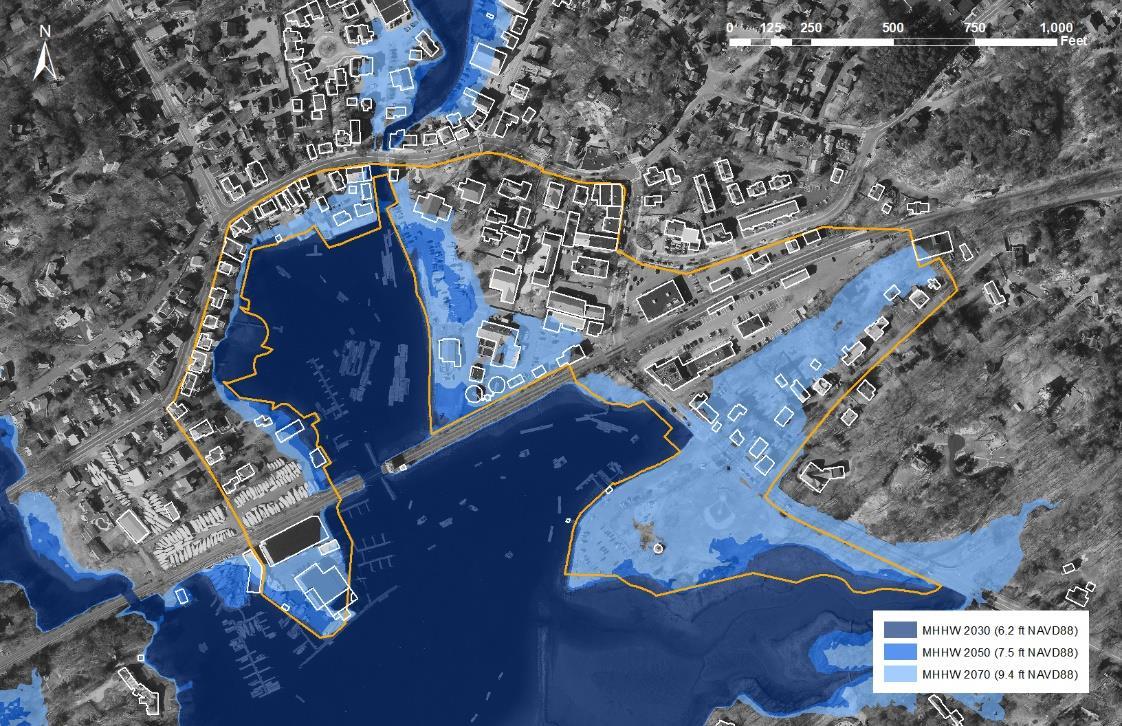
In addition to sea level rise, storms and their impacts on coastal areas factor into the coastal vulnerability of the area. The MC-FRM results for Manchester Harbor include a range of flood probabilities and associated water surface elevations. These results include two levels of data - Level 1 data shows the inland extent of coastal flooding associated with each annual exceedance probability (AEP), while Level 2 data provides water surface elevations (WSEs) associated with each AEP. Previously finalized Level 2 data for this region reports WSEs for AEPs 0.1% through 5%; for this project,

Woods Hole Group developed additional localized WSE layers in the study area for the 10%, 25% and 50% AEPs to inform planning for higher probability (lower intensity) flooding. A 1% AEP water level has a 1 in 100 chance of occurring in any given year, while a 50% AEP water level has a 1 in 2 chance of occurring in a given year.
The flood risk associated with storms of lower AEPs is higher, since these tend to be more intense storms that impact wider areas. Conversely, storms with higher AEPs are more moderate. Within the project area in Manchester in 2030, a 50% storm is associated with a maximum water surface elevation of 7.9 ft NAVD88, while a 0.1% storm could have a maximum water surface elevation almost 3 feet higher at 10.7 ft NAVD88 (Table 2).
The model also considers a range of time horizons – near-term (2030), mid-term (2050), and long term (2070) As time progresses and sea levels rise, more intense storms with higher associated water levels will become more frequent A 0.1% AEP storm in 2030 has an associated maximum water surface elevation of 10.7 ft, and by 2070 water levels associated with a 0.1% AEP storm increase to 14.2 ft (Table 2).

This means that different buildings in the Manchester Harbor study area have different flood probabilities for different time horizons. For instance, the rear entrance to Manchester Town Hall (10 Central Street) has an elevation of 9.18 ft NAVD88. This elevation is exceeded by the water level associated with a 2% AEP in 2030, a 25% AEP in 2050, or a 50% AEP in 2070.
To assess risk of flooding to development, water surface elevations obtained from the MC-FRM Level 2 data are compared to the critical elevations of built infrastructure (either the elements of the surrounding landscape or significant flood entry points for buildings). Woods Hole Group conducted a critical elevation survey for all buildings within the project area over the course of two days (January 19 and January 23, 2023). Buildings were visited and the elevations of finished first floors, important exterior infrastructure (e.g. generators), basement windows, or other possible flood entry points were surveyed using a Leica Real-Time Kinematic Global Positioning System (RTK-GPS) and infield measurements. An RTK-GPS is a type of GPS instrument that uses a network of reference stations to collect highly accurate elevation position measurements. This particular RTK was also outfitted with a camera capable of “scanning” buildings so that exact elevations of points of interest can be identified later from an elevation point cloud using the
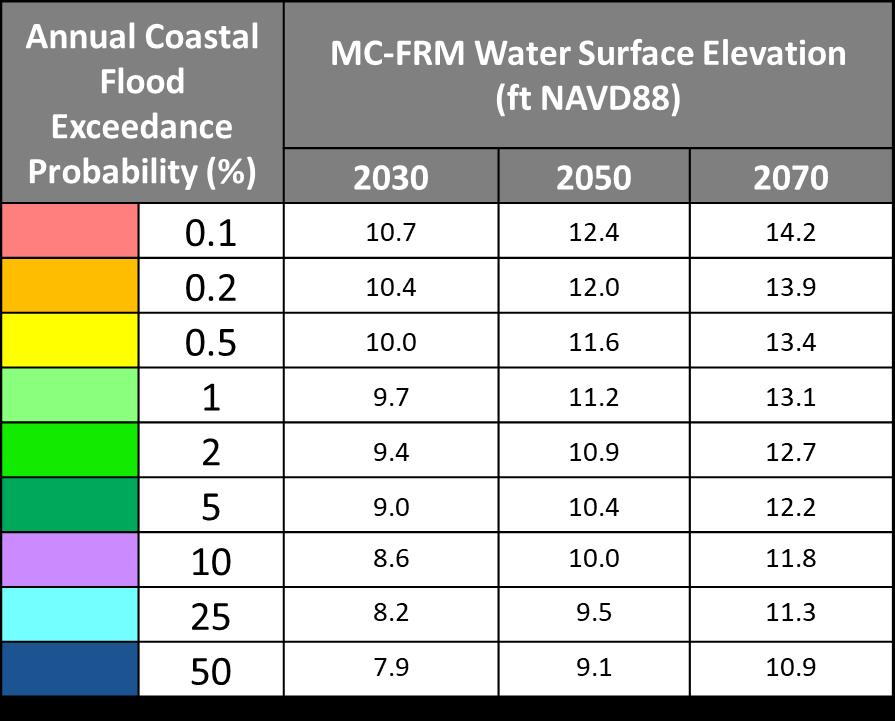
Leica Infinity software (Figure 5). This feature was utilized to facilitate data collection and supplemented with a number of standard survey shots.


The elevations gathered during the critical elevation surveys were compiled into a list of vulnerable elevations specific to each building within the project area. These critical elevations were then compared to the projected water surface elevations from the MC-FRM across different time horizons (2030, 2050, and 2070) and for different storm surge flood probability levels (AEPs ranging from 0.1% to 50% annually). Individual buildings were then assigned a critical elevation exceedance probability level based on the highest probability (and lowest intensity) storm that would exceed that building’s critical elevation in a given projected year.
An initial analysis used the finished floor elevation (FFE) as the critical elevation for buildings within the project area. For this analysis, the FFE of each building within the project area was assumed to be the ground level floor at street level. If a building were to be flooded at the FFE, access to and use of that building could be significantly impacted and significant remediation/remodeling of interiors would be required Figures 6-8 show the results of the FFE vulnerability assessment in the study area for 2030/2050/2070 MC-FRM water levels The buildings are colored according to the highest probability (and lowest intensity) AEP that would impact the building FFE at the critical elevation. The flooding map presented underneath the building footprints is the MC-FRM Level 1 data for the same range of AEPs, indicating onthe-ground extents of flooding by AEP To be assigned a critical elevation exceedance probability level, the building had to have both been within the flood extent of a given AEP and have a designated critical elevation lower than the associated water surface elevation.
Following 2030 MC-FRM projections, with the exception of the Manchester Marine facility on the western end of the project area, most of the impacted buildings are generally susceptible to storms with AEPs of 5% or lower. Many buildings in the residential area on the western side of the project area and also in the downtown commercial area will remain dry at the first floor level for all projected storm surge conditions (Figure 6).


In 2050, several buildings at the Manchester Marine facility could be susceptible to flooding during storms with AEPs between 10% - 50%. Buildings in the residential area on the western side of the project area and in the downtown commercial area should remain dry at the first floor level but more could begin to become impacted by flooding. The Town’s wastewater treatment plant will also likely have flooding issues at the first floor level by 2050 – the main building could be impacted by storms with AEPs of 50% (Figure 87).
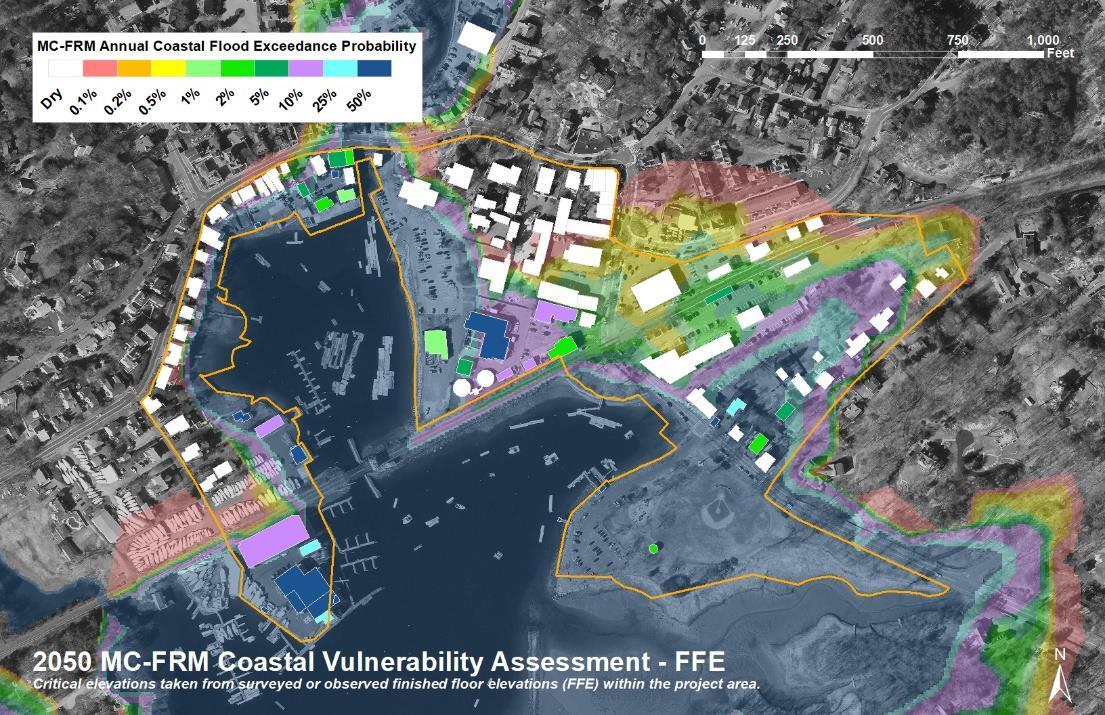

In 2070, the entire peninsula that Manchester Marine occupies could be impacted by flooding during storms with AEPs of 50%. Though many buildings in the residential area on the western side of the project area and in the downtown commercial area will continue to remain dry at the first floor level, more buildings throughout the project area will be impacted by floods of all sizes. The Town’s wastewater treatment plant could flood regularly at the 50% AEP (Figure 8).
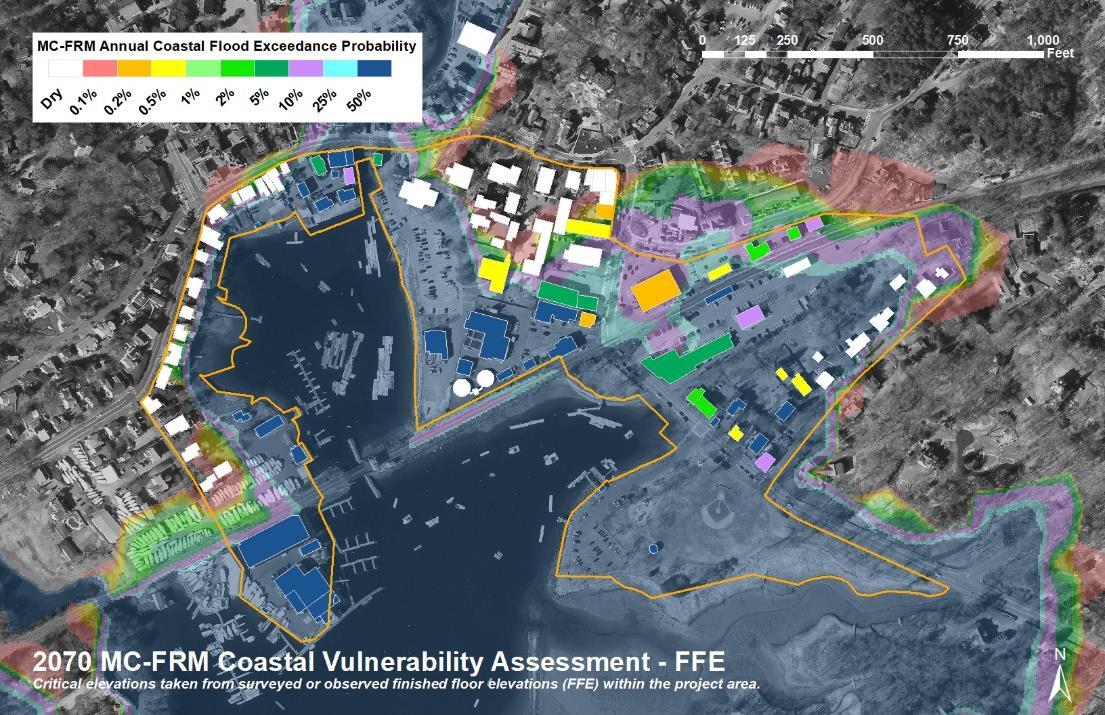
A limitation of this street-level FFE analysis is that many buildings in the project area have lower levels and flood entry points present that may be vulnerable and important to access/use/function of the buildings. For buildings such as the Manchester Town Hall and Fire Departments, assigning the FFE at street level as the critical elevation would imply that the functionality of the building may not be impacted below the elevation of the entrances to the first-floor level. However, if the lower levels were flooded in these buildings, critical services to the town could be impacted. There were also differences in elevation between the first floor entrances and rear entrances of many of the residential structures along Central Street, Bridge Street and Ashland Avenue observed during the site visits. To address this limitation, an additional analysis was conducted using secondary critical elevations to capture the probability of flooding at lower levels of buildings within the project area. Surveyed or field-observed lower-level entry elevations (including basement windows and bulkheads or walk out basement door thresholds) were used for all non-residential buildings within the project area. For consistency, lower-level critical elevations were also assigned or estimated for residential buildings within the study area. For residential buildings where the lowest entry elevation was not visible on the Leica scans, a critical elevation was estimated from the minimum LiDAR elevation within the building footprint (from MassGIS Building

Structures 2-D layer). These critical elevations represent conservative probabilities of flood impacts where flood waters during a storm would reach the building’s lowest point elevation, potentially impacting building systems and finished/unfinished basements. The results of the secondary CE analysis are presented in Figure 9-11.

Figure 9 displays the results of the analysis conducted using the lower secondary critical elevations for 2030. In 2030, high elevation areas on the western side of the project area along Central Street, Bridge Street, and Ashland Avenue should remain dry during storms with AEPs of 0.1% or higher in the near-term time horizon. Most of the high elevation areas along Union Street and Beach Street in the middle of the project area will also remain dry. Much of the residential area along the southern part of Beach Street and up Tappan Street is vulnerable to floods with AEPs between 1% and 5%. Clusters of buildings closer to the waterfront also could be susceptible to flooding in 2030. Key buildings for the Town of Manchester within this project area include Town Hall and the Fire Department on School Street (outside the main project area but significant for public safety in the study area and beyond). These buildings fall into the 2% and 25% flood risk categories, respectively.

By 2050 (Figure 10), most buildings in high elevation areas on the western side and middle of the project area are still not vulnerable to flooding. Much of the residential area along Beach Street and Tappan Street will be even more susceptible to floods, most being vulnerable to floods from storms with AEPs between 10% - 50%. Many buildings closer to the waterfront are projected to be impacted by storms with AEPs of 50%. Town Hall and the Fire Department on School Street would fall into the 25% and 50% flood risk categories, respectively.
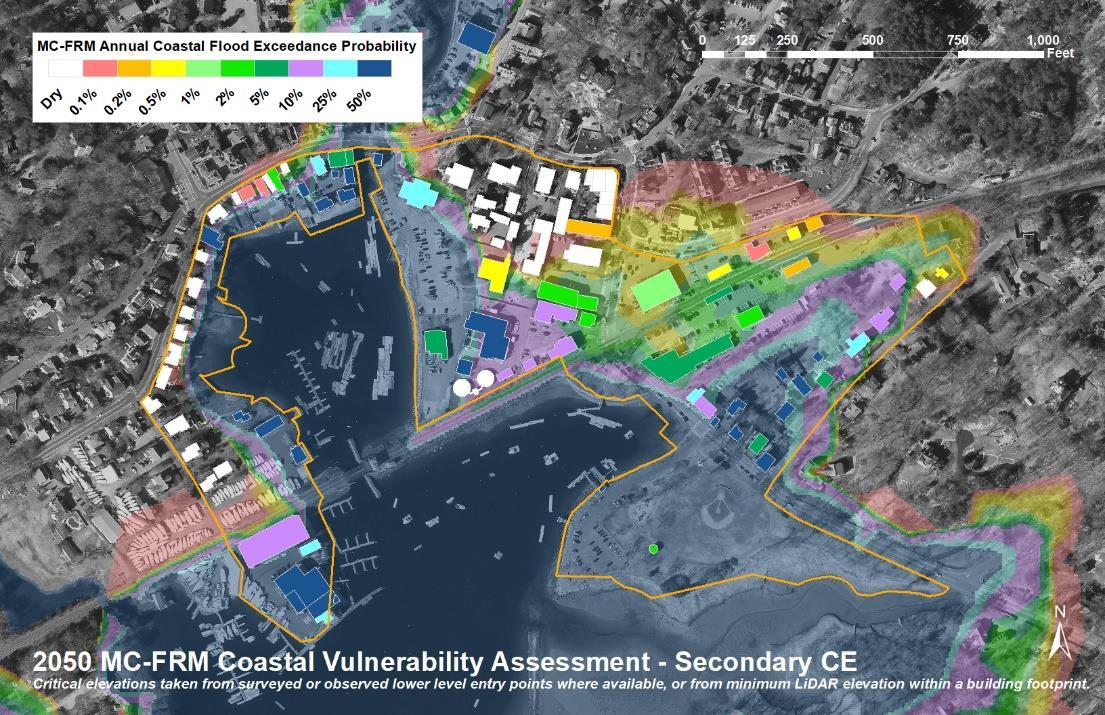


By 2070 (Figure 11), some buildings in high elevation areas on the western side and middle of the project area will still remain dry, but fewer than the 2050 time horizon, especially in the commercial area off of Beach Street. Nearly the entire residential area along Beach Street and Tappan Street will be susceptible to floods from storms with AEPs of 50%. The majority of buildings closer to the waterfront are projected to be impacted by storms with AEPs of 50%, including the Town Hall, Fire Station, and Wastewater Treatment Plant.
In summary, as time progresses and coastal flooding increases in frequency and intensity, the number of buildings associated with each AEP increases. For example, focusing on the 50% AEP, the number of buildings impacted increases from 4 in 2030 to 56 by 2070, as the same probability storms intensify due to the impacts of climate change and sea level rise. Table 3 summarizes the results of the building vulnerability analysis using the more conservative secondary critical elevations below.
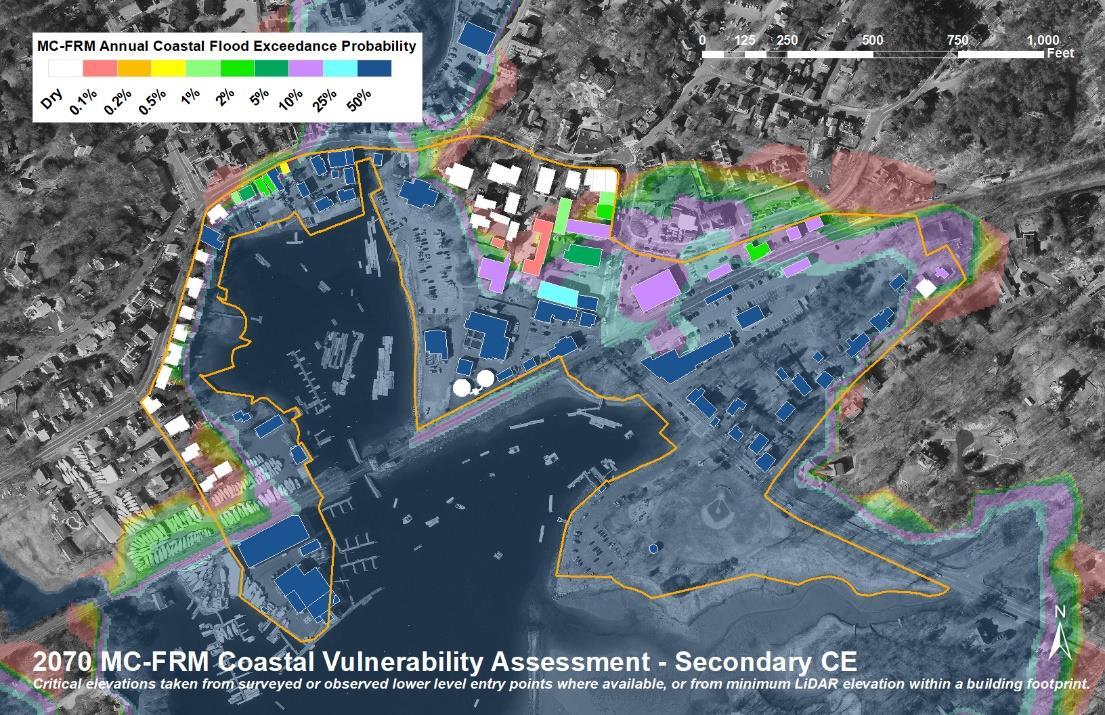
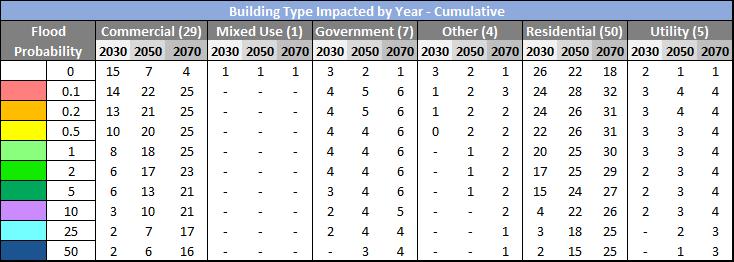

Buildings outside of the project area are also potentially vulnerable to storm surge flooding, but were not assessed within the scope of this project. Instead, a screening assessment for buildings within the 2070 0.1% flood extent was performed in an effort to estimate this potential risk. For each building within the 0.1% 2070 flood extent but outside of the project area, the minimum elevation within a building footprint (from MassGIS Building
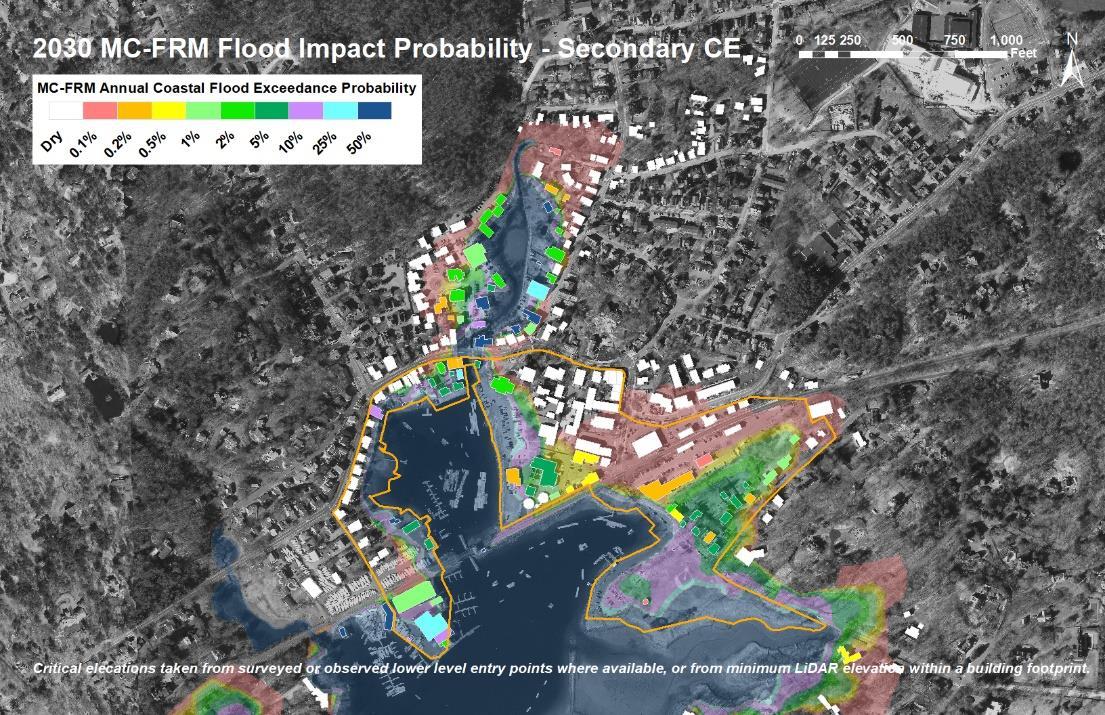
2-D layer) was extracted from available LiDAR and assigned as the critical elevation (Figure 12-14).


Wetland resources are affected by increasing water levels caused by sea level rise rather than episodic storm events. As sea level rises, marsh habitats may be forced to migrate landward to maintain the same level of inundation to which they are adapted. However, barriers such as buildings and roads impede this migration, resulting in potential habitat loss.
The Sea Level Affecting Marsh Migration (SLAMM) model is a tool designed to help predict changes in marsh habitats in response to sea level rise. The model incorporates various inputs including LiDAR elevations, wetland classifications, sealevel rise, tide range, and accretion and erosion rates for different habitat types. The Massachusetts Office of Coastal Zone Management commissioned a statewide modeling project using SLAMM to address potential impacts of sea level rise on marsh systems throughout Massachusetts. More information on marsh migration modeling methodology can be found in the "Modeling the Effects of Sea-Level Rise on Coastal Wetlands" report (Woods Hole Group, 2016). The model intentionally omits interactions between migrating marsh habitats and physical barriers (e.g., roads, buildings, and other impervious surfaces) to help visualize how and where wetlands would migrate in natural conditions. This allows communities to identify strategic areas for impervious surface removal to facilitate marsh migration.
Present day habitat extents and boundaries are assumed to be similar to the 2011 National Wetland Inventory (NWI) wetland classification areas. The majority of the project area is classified as "Upland," which includes both developed and undeveloped dry land. The area has some Estuarine Open Water near the harbor, an Irregularly Flooded Marsh along the southern edge of Masconomo Park, an Inland Fresh Marsh behind the residences towards the western end of Tappan Street, and smaller areas of Regularly Flooded Marsh, Estuarine Beach/Tidal Flat, and Ocean Beach (Figure 15).

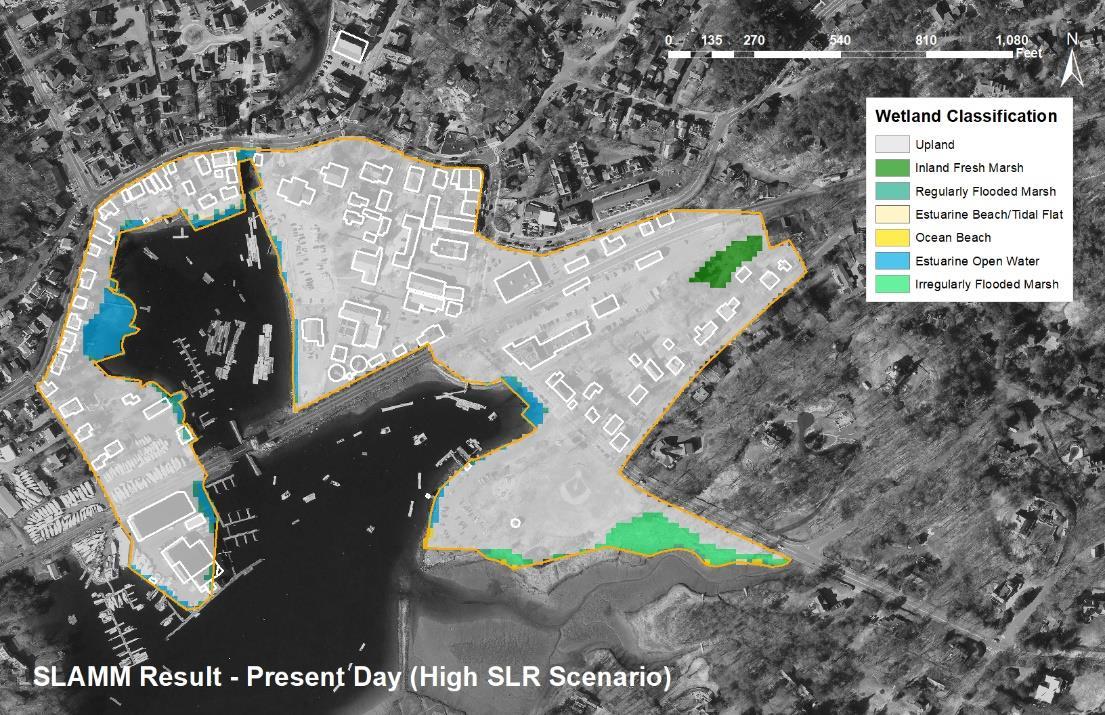
There are minimal changes projected for 2030 compared to present day conditions. All wetland habitat classification extents remain the same, except for a small increase of 0.1 acre in Regularly Flooded Marsh habitat and the addition of a single 25-square meter area of Transitional Marsh/Scrub-Shrub area at the boundary of the Irregularly Flooded Marsh wetland on the southern edge of Masconomo Park (Figure 16).


The projected SLAMM results for 2050 indicate slight additional changes in the wetland habitat types in Manchester. While the general extents of wetland habitats remain similar to the previous projections, there could be an additional 0.3 acres of Regularly Flooded Marsh compared to 2030. Transitional Marsh/Scrub-Shrub wetlands could become more prevalent, especially at the boundaries of established wetland areas such as on the southern edge of Masconomo Park and parts of the Manchester Marine peninsula. Additionally, Ocean Beach habitat would begin to take over the tip of the peninsula that borders the railroad, where the Manchester Wastewater Treatment Plant is currently located (Figure 17).


Assuming no barriers to marsh migration, the most significant change in habitat extent is projected to occur between 2050 and 2070. In the western part of the project area, the Manchester Marine peninsula and waterfront residential and commercial properties off of Ashland Avenue and Commercial Street could be converted from Upland to a combination of Regularly Flooded Marsh and Transitional Marsh/Scrub-Shrub. In the middle of the area, the current large parking lot could become a combination of Regularly Flooded Marsh and Ocean Beach, while the rear entrances to Town Hall could become Transitional Marsh/Scrub-Shrub wetland habitat. In the eastern part of the area, the residential area behind Beach Street and Tappan Street could be converted into Ocean Beach, and the Inland Fresh Marsh could become Transitional Marsh/Scrub-Shrub wetland by 2070. Finally, most of Masconomo Park could become a combination of Ocean Beach and Regularly Flooded Marsh by 2070 (Figure 18).


Between present day and projected 2070 conditions, there could be habitat extent changes in Manchester as marshes migrate due to sea level rise. Since the model omits barriers to marsh migration such as roadways and structures, the results should be interpreted as possible marsh migration under natural or undeveloped conditions. Between present day conditions and 2070, 11.1 acres of Upland area, 0.8 acres of Irregularly Flooded Marsh, and the entire 0.4 acre area of Inland Fresh Marsh could be lost and converted to other wetland habitat types as inundation to these areas becomes more frequent (Table 4).
The largest increase in wetland habitat between present day conditions and 2070 is Ocean Beach, which increases from 0.1 acres to 6.9 acres. Regularly Flooded Marsh gains the second largest amount of area, growing from 0.4 acres to 3.1 acres. Transitional Marsh/Scrub-Shrub and Estuarine Beach/Tidal Flat habitat areas are also projected to increase 1.6 and 1.0 acres respectively, along with a slight 0.1 acre increase in Estuarine Open Water.
There are currently many barriers to marsh migration within the project area, as this part of Manchester is highly developed. Both commercial and residential buildings, roadways, train tracks, and other impervious surfaces like parking lots would make the natural migration of marsh habitats impossible in most parts of the project area under its current configuration.
This vulnerability assessment revealed potential risks to open space, infrastructure, and buildings due to sea level rise and flooding from storm surges. It also indicated potential future coastal habitat conditions in the project area if impervious surfaces and other impediments to wetlands migration were to be removed. This information helps identify key areas surrounding the Manchester Harbor area where adaptive interventions may need to be considered, including floodproofing, landscape-scale alterations, and/or changes in use or building construction. The effectiveness, benefits, and impacts of these various approaches will be explored in further detail in the next phase of the project.

DeConto, R.M. and R.E. Kopp. 2017. Massachusetts Sea Level Assessment and Projections. Technical Memorandum.
DeConto, R. and D. Pollard. 2016. Contribution of Antarctica to past and future sea-level rise. Nature. 531: 591–597. https://doi.org/10.1038/nature17145.
Kopp, R.E., R.M. Horton, C.M. Little, J.X. Mitrovica, M. Oppenheimer, D.J. Rasmussen, B.H. Strauss and C. Tebaldi. 2014. Probabilistic 21st and 22nd century sea‐level projections at a global network of tide‐gauge sites. Earth's Future. 2: 383-406. https://doi.org/10.1002/2014EF000239.
Kopp, R.E., R.M. DeConto, D.A. Bader, C.C. Hay, R.M. Horton, S. Kulp, M. Oppenheimer, D. Pollard and B.H. Strauss. 2017. Evolving Understanding of Antarctic Ice‐Sheet Physics and Ambiguity in Probabilistic Sea‐Level Projections. Earth's Future. 5: 1217-1233. https://doi.org/10.1002/2017EF000663.Woods Hole Group. 2016. Modeling the Effects of Sea Level Rise on Coastal Wetlands. https://www.mass.gov/files/documents/2018/12/07/czm-slammreport-nov2016.pdf
MassGIS (Bureau of Geographic Information). (n.d.). MASSGIS. https://www.mass.gov/orgs/massgis-bureau-ofgeographic-information. Accessed 21 March 2023.

NOAA Tides & Currents. (n.d.). Tidal Datums.
https://tidesandcurrents.noaa.gov/datum_options.html#:~:text=Mean%20Higher%20High%20Water,MHW. Accessed 21 March 2023.
NTDE - NOAA Tides & Currents. (n.d.). National Tidal Datum Epoch
https://tidesandcurrents.noaa.gov/datum-updates/ntde/ Accessed 14 April 2023.
Woods Hole Group. 2016. Modeling the Effects of Sea Level Rise on Coastal Wetlands.
https://www.mass.gov/files/documents/2018/12/07/czm-slamm-report-nov2016.pdf
Woods Hole Group. 2022. The Massachusetts Coast Flood Risk Model – Modeling Overview and Frequently Asked Questions.
https://eea-nescaum-dataservices-assets-prd.s3.amazonaws.com/cms/GUIDELINES/MC-FRM_FAQ_04-06-22.pdf
DATE: June 29, 2023

This memorandum summarizes Fuss & O'Neill’s approach to quantifying the benefits associated with mitigation scenarios developed in response to the increased likelihood of damages associated with coastal flooding. Scenarios and specific flood resilience actions were developed in consultation with the Town, residents, and stakeholders, and are detailed in the Coastal Vulnerability Action Plan.
A benefit-cost analysis (BCA) is a project evaluation tool developed by FEMA to compare the benefits and costs of any project intended to reduce the future risk or associated hazards of flooding. FEMA’s BCA Calculator (Toolkit Version 6.0) allows users to identify whether the anticipated benefits of a proposed mitigation project will outweigh the costs of different action scenarios Ultimately, for a project, which can be comprised of multiple actions, to be considered cost-effective, the benefits must outweigh the costs. Or in other words, the benefit-to-cost ratio (BCR) must be greater or equal to 1.0.
The FEMA BCA Calculator quantifies the benefits of a project as flood-related damages avoided by completion of the project. Damages are calculated through building-specific data for each structure located in the project area and projected stillwater elevations Examples of damages include both structural losses (up to and including total loss and demolition) and non-structural losses (such as loss of service and income). This information was acquired from a variety of data sources listed below:
Building information was obtained from property cards through the Town of Manchester.
Stillwater elevations for the current (2030) 10-, 50-, 100-, and 500-year recurrence intervals and approximate values for projected sea level rise were modeled and provided as part of an earlier vulnerability assessment and compared against the nearest transect calculated in the FEMA Flood Insurance Study.
Elevations (lowest finished floor and ground elevations) and measurements of the lowest entry point for water to enter a building were determined through a field survey by the project team and light detection and ranging (LiDAR) data.
The base flood elevation (BFE), i.e., elevation 10 feet, was acquired from FEMA Flood Insurance Rate Maps (FIRM).
Costs for each mitigation action for each individual building are based on an engineering order of magnitude cost relying on past experience. Note: The costs developed for the project represent estimates that can be refined over time as certain actions move forward to design
Residential buildings were assumed to hold two residents on average, half of whom are of working age.
MEMO- Town of Manchester-by-the-Sea, MA
June 29, 2023
Page 2 of 3
The project useful life is how long the mitigation action will be effective. The useful life of each mitigation action varies and was based on the FEMA BCA Reference Guide, June 2009. The expected duration for each mitigation action is:
Building Elevation
Floodproofing
Acquisition
Floodplain and Stream Restoration (greenspace) - calculated with acquisitions
30 years (residential)
50 years (non-residential)
30 years (residential)
50 years (non-residential)
100 years
100 years
The following assumptions and generalizations were made to generate an order-of-magnitude quantification of mitigation benefits and can be further refined if this BCA is developed for submission as part of a FEMA grant application. The assumptions and generalizations were made to provide a more conservative BCR. Generally, incorporating additional information specific to parcels to refine the following areas would provide a more accurate, and likely higher, BCR The costs included for each alternative were determined in accordance with FEMA standards and documentation, which states what costs can ultimately be funded. Note: Relocation and redevelopment costs were not included, as they would not be reimbursed by FEMA.
Multiple buildings had varying uses and types due to having multiple storefronts in a single structure The least beneficial building use and type were applied to the entire square footage to produce more conservative benefits. Including those varying uses would increase the BCR.
All buildings were assumed to not have an active National Flood Insurance Program (NFIP) Policy. The in-force, active NFIP Policy number will need to be acquired and documented to account for these benefits. Incorporating that NFIP Policy coverage information would increase the BCR.
Annual operating budgets were not estimated for non-residential structures. As a result, loss of function/income was not calculated. Additional effort to quantify this benefit in the future when submitting a BCA for FEMA funding would increase the BCR, and likely substantially, when applied across the project area.
Where both residential and non-residential uses are collocated on a parcel, and within the same structure, two mitigation actions were developed, one for the non-residential use, one for the residential use. Because there is only one structure, the project cost was only applied once.
F:\P2022\0485\A10\Deliverables\Task

MEMO- Town of Manchester-by-the-Sea, MA
June 29, 2023
Page 3 of 3
The FEMA default values were used for:

Recurrence intervals
Maintenance duration
Building replacement value
Demolition threshold
Contents value
Monthly cost of temporary space
One time displacement cost
Depending on the mitigation action proposed, costs were developed on a neighborhood-wide or sitespecific basis. In Scenarios 2 and 3A, proposed neighborhood-wide mitigation action benefits accrue to multiple structures. The total project cost for those mitigation actions designed to avoid losses was assigned to protected structures proportionally to the floor area of the protected structure.
Where acquisition is the proposed site-specific mitigation action, the mitigation cost includes the parcel assessed value plus a 15% escalator, demolition costs ($70,000 per single family residential property; $100/sf of structure area for non-residential structures), and restoration costs ($1.5/sf of parcel area). It was assumed that 25% of acquired waterfront properties would be restored to riparian habitat, with the balance restored to urban open space. Non-waterfront acquired properties would be entirely restored to urban open space.
Buildings that have a BCR above 1.0 are considered cost-effective to mitigate; however, some buildings have a BCR below 1.0 and are not considered cost-effective to mitigate. If the BCA is considered on a building-by-building basis, these buildings would not be eligible for FEMA funding However, if the total BCR is above 1.0 for the entire project, the project would be considered cost-effective and be eligible for FEMA funding.
The following table summarizes the scenario benefits, based on the methodology described above. These numbers should be considered preliminary estimates following the FEMA BCA methodology and were used for planning purposes to determine the viability of proposed actions with each scenario developed as part of the Coastal Vulnerability Action Plan. As noted above, these estimates will require additional documentation, beyond the scope of this effort, to be ready for submission with a grant application to FEMA.
F:\P2022\0485\A10\Deliverables\Task