your Passion since 1916!

Annual Report
Financing 2022

What’s Inside 4 From the President’s Desk & Financials 6 Your Board of Directors 7 People Who Work For You 8 Financing Your Passion Since 1916! 10 Small Farm Facts & Patronage Report 12 Financial Report Table of Contents
“If passion drives you, let reason hold the reins.”
FARM CREDIT OF CENTRAL FLORIDA FARM CREDIT OF CENTRAL FLORIDA 2022 Annual Report 2022 Annual Report 2 3
—Benjamin Franklin
Financing Your Passion Since 1916
President’s Message
Farm Credit of Central Florida is a story of success — year after year. Because of the trust that you, the member-owners, have placed in us to deliver the fnancing and crop insurance services essential to your business. For this reason, let me begin with a big THANK YOU.
With 2022 now in the books I am pleased to report another strong year of operating results for your Farm Credit of Central Florida Association. The next page provides a graphical representation of the fnancial performance for your Association over the past fve years, it shows a growing and fnancially strong organization. Several key highlights for the year include:
• Servicing loan volume of $1.37 billion, up 14% year over year
• Total Assets of $855 million, up 9% year over year
• Core income from operations of $17.8 million, up 30% year over year
• Member Equity $135.4 million, up $8 million year over year

• More than 50% of net earnings ($10.2 million) returned to members lowering the average interest rate by 1%
While 2022 was an exceptional year for your Association there remain headwinds for both our member-owners and the Association as we look towards the future. Increasing interest rates, supply chain shortages and disruptions, increased labor costs and geopolitical risk

Our Mission
have all increased the cost and complexity of doing business, and it is likely those issues will remain and evolve into 2023. But despite those challenges I feel certain that with a strong fnancial position for your Association and because of the passion for agriculture that our members exhibit every day in their operation we are well prepared to meet those challenges head on.
Throughout my career with Farm Credit, I have always been fascinated to learn and hear the stories of how you got started and how Farm Credit was able to play a small role in fnancing your passion. Over the next several pages there are three diferent stories of how these members were able to turn their passion into a successful career. I hope that you enjoy them as much as I did!
Once again THANK YOU for trusting us with your business and best wishes for a successful 2023!
Sincerely,
Reginald T. Holt President & CEO
2020 2022 2018 2019 2021 2018 2019 2020 2022 2021 2018 2019 2020 2022 2021 2018 2019 2020 2022 2021 2018 2019 2020 2022 2021 2018 2019 2020 2022 2021 2018 2019 2020 2022 2021
*DOLLAR AMOUNTS IN MILLIONS SERVICING LOAN VOLUME $21.2 $590 $855 $136 98.6% $113 $119 $127 98.6% 99.5% TOTAL ASSETS MEMBER EQUITY CREDIT QUALITY $563 $109 97.7 % $689 $790 99.1% $17.8 2.4% $10.2 $ 8.5 2.6% $ 6.2 NET INCOME CORE INCOME FROM OPERATIONS ROA CASH PATRONAGE REFUNDS $9.7 $11.2 2.2% 2.6% $ 6.5 $9.5 $14.2 $ 12.3 $ 16.1 REGGIE
HOLT Chief Executive Officer
2018 2019 2020 2022 2021 $1,077 $1,202 $1,375 $960 $919
To be the premier partner with farmers and rural communities throughout all of Central Florida by providing reliable, consistent credit and financial services.
$19.3 $13.7 3.1% $11.6 FARM CREDIT OF CENTRAL FLORIDA FARM CREDIT OF CENTRAL FLORIDA 2022 Annual Report 2022 Annual Report 4 5
Board of Directors
Our board of directors is dedicated to ensuring your prosperity by always keeping your interests in mind.


People Who Work For You
Our strong team of leaders makes supporting you, the agriculture industry and its stakeholders our number-one priority.
SCOTT FONTENOT Chief Operating Officer
REGGIE HOLT Chief Executive Officer
DAWN TUTEN Chief Administrative Officer
TIMOTHY D. SCHAAL
DAVID A. MERENESS
RANDY L. LARSON Vice Chairman
KEITH D. MIXON Chairman
DANIEL T. APRILE
REED C. FISCHBACH W. REX CLONTS JR.
C. DENNIS CARLTON JR.
ROBERT M. BEHR JENNY R. BLACK
ANNIE SULLIVAN Chief Financial Officer
JEFF PHILLIPS Chief Lending Officer JOHAN DAM Chief Marketing & Risk Oficer
RANDALL E. STRODE
FARM CREDIT OF CENTRAL FLORIDA FARM CREDIT OF CENTRAL FLORIDA 2022 Annual Report 2022 Annual Report 6 7
KERRI COSTINE Chief Credit Officer
Financing Yor Passion Since 1916!
Being a farmer can come in many ways. For some it starts as a passion, others have it in their DNA and many were simply raised in it. All of these inspiring stories have one thing in common, everyday people who turned their passion into a fulltime operation. At Farm Credit of Central Florida, we are proud to support your passion and commitment to the agriculture industry.
Solaris Farms:

Ross and Sarah Russell, owners of Solaris Farm, an equestrian facility known for its welcoming environment for both kids and adults. Many call it their happy place! Sarah has had a passion and love for horses her entire life. This passion is what drove her to open her own equestrian facility in 2015. Solaris Farms has up to 100 riding lessons a week and owns over 50 horses. Over the years, they have impacted not only the horses but also the people that ride them. Scan the QR code to watch their story!


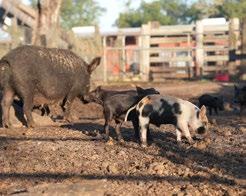
Shogun Farms: Pamela Fay shares a glimpse into their wild hog farm, Shogun Farms. Pamela and her husband David began trapping wild hogs from private, commercial, and government properties. However, David frmly believes that you should eat whatever you harvest, which led to the beginning of Shogun Farms. Scan the QR code to watch their story!
Urban Tropical:
Ever wonder where those beautiful tropical fsh come from in pet stores? Urban Tropical, a tropical fsh farm in Lakeland, FL, specializes in breeding high-quality ornamental freshwater tropical fsh, which are sold to pet stores. Brittany Hollon, the operations ofcer, shares how her father started the business out of his love for fshing and eventually became one of the largest Angelfsh fsh farms in the United States. Scan the QR code to watch their story!

FARM CREDIT OF CENTRAL FLORIDA FARM CREDIT OF CENTRAL FLORIDA 2022 Annual Report 2022 Annual Report 8 9
Small Farm Facts
by

TOP 5 COUNTIES
LEAST
NUMBER of small farms is: Pinellas County


FARM CREDIT OF CENTRAL FLORIDA FARM CREDIT OF CENTRAL FLORIDA 2022 Annual Report 2022 Annual Report 10 11

BEEF
204 ACRES AVER AGE FARM SIZE :
A B ORR O W ER O W NED C O OP ER ATI V E PAID $ 56.9 MILLION CASH BACK TO MEMBERS SINCE 2015 2 02 2 CASH PATRONAGE PAID OF $10.2
TOP 5 COMMODITIES BY LOAN VOLUME OF SMALL FARMERS: Our success is because of you! This year your board voted to approve a cash patronage distribution of $10.2 million, reducing the average members rate
CATTLE FIELD CROPS FLORICULTURE/ NURSERY PRODUCTION CITRUS EQUINE 1,195 MEMBER/ BORROWERS Classified as Small Farmers which is 80% of portfolio 1%. IT PAYS TO BE A MEMBER! Member Appreciation Dinners hosted in Apopka & Plant City during 2022.
Small
Farms in Florida make up about 15% OF ALL FARM PRODUCT SALES
Small Farms are classified by USDA as one with up to $250,000 IN SALES where small farms are located: Hillsborough, Polk, Lake, Volusia, and Hernando
MILLION
90% are classified as
47,500 FARMS FLORIDA HAS SMALL FARMS
Farm Credit of Central Florida, ACA FARM CREDIT OF CENTRAL FLORIDA, ACA 2022 ANNUAL REPORT Contents Report of Management 2 Five-Year Summary of Selected Financial Data .................................................................................................... 3 Management’s Discussion & Analysis of Financial Condition & Results of Operations 4-17 Disclosure Required by FCA Regulations 18-23 Report of the Audit Committee ............................................................................................................................ 24 Report of Independent Auditors 25-26 Consolidated Financial Statements 27-30 Notes to the Consolidated Financial Statements ............................................................................................ 31-52 1 2022 Annual Report
Report of Management
The accompanying Consolidated Financial Statements and related financial information appearing throughout this annual report have been prepared by management of Farm Credit of Central Florida, ACA (Association) in accordance with generally accepted accounting principles appropriate in the circumstances. Amounts which must be based on estimates represent the best estimates and judgments of management. Management is responsible for the integrity, objectivity, consistency, and fair presentation of the consolidated financial statements and financial information contained in this report.
Management maintains and depends upon an internal accounting control system designed to provide reasonable assurance that transactions are properly authorized and recorded, that the financial records are reliable as the basis for the preparation of all financial statements, and that the assets of the Association are safeguarded. The design and implementation of all systems of internal control are based on judgments required to evaluate the costs of controls in relation to the expected benefits and to determine the appropriate balance between these costs and benefits. The Association maintains an internal audit program to monitor compliance with the systems of internal accounting control. Audits of the accounting records, accounting systems and internal controls are performed and internal audit reports, including appropriate recommendations for improvement, are submitted to the Board of Directors.
The Consolidated Financial Statements have been audited by Independent Auditors, whose report appears elsewhere in this annual report. The Association is also subject to examination by the Farm Credit Administration.
The Consolidated Financial Statements, in the opinion of management, fairly present the financial condition of the Association. The undersigned certify that we have reviewed the 2022 Annual Report of Farm Credit of Central Florida, ACA, that the report has been prepared under the oversight of the audit committee of the Board of Directors and in accordance with all applicable statutory or regulatory requirements, and that the information contained herein is true, accurate, and complete to the best of our knowledge and belief.
 David A. Mereness Chairman of the Audit Committee
Reginald T. Holt Chief Executive Officer
Anne M. Sullivan Chief Financial Officer March 9, 2023
David A. Mereness Chairman of the Audit Committee
Reginald T. Holt Chief Executive Officer
Anne M. Sullivan Chief Financial Officer March 9, 2023


Farm Credit of Central Florida, ACA
2 2022 Annual Report
Consolidated Five - Year Summary of Selected Financial Data
* General financing agreement is renewable on a one-year cycle. The next renewal date is December 31, 2023. ** Tier 1 leverage ratio must include a minimum of 1.50% of URE and URE equivalents.
Farm Credit Of Central Florida, ACA
December 31, (dollars in thousands) 2022 2021 2020 2019 2018 Balance Sheet Data Cash $ 11 $ 11 $ 12 $ 14 $ 189 Investments in debt securities 1,808 2,748 3,966 5,262 7,913 Loans 825,785 757,407 658,098 568,435 538,999 Allowance for loan losses (4,378) (3,067) (3,283) (3,113) (3,270) Net loans 821,407 754,340 654,815 565,322 535,729 Equity investments in other Farm Credit institutions Other property owned Other assets 10,927 — 20,787 6,755 — 26,285 6,636 227 23,669 6,677 — 13,149 6,568 — 12,949 Total assets $ 854,940 $ 790,139 $ 689,325 $ 590,424 $ 563,348 Notes payable to AgFirst Farm Credit Bank* Accrued interest payable and other liabilities with maturities of less than one year $ 694,754 $ 635,922 $ 548,714 23,735 26,909 21,918 $ 463,711 13,266 $ 442,646 11,602 Total liabilities 718,489 662,831 570,632 476,977 454,248 Capital stock and participation certificates Retained earnings Allocated 1,212 17,827 1,149 19,103 1,008 20,380 942 21,637 882 22,907 Unallocated 116,802 107,687 98,129 91,532 85,772 Accumulated other comprehensive income (loss) 610 (631) (824) (664) (461) Total members' equity 136,451 127,308 118,693 113,447 109,100 Total liabilities and members' equity $ 854,940 $ 790,139 $ 689,325 $ 590,424 $ 563,348 Statement of Income Data Net interest income $ 19,550 $ 16,356 $ 15,332 $ 14,737 $ 13,983 Provision for (reversal of) allowance for loan losses Noninterest income (expense), net 1,258 973 (340) 4,462 214 979 (424) (2,878) (1,775) (1,607) Net income $ 19,265 $ 21,158 $ 16,097 $ 12,283 $ 14,151 Key Financial Ratios Rate of return on average: Total assets 2.42% 3.05% 2.59% 2.23% 2.62% Total members' equity Net interest income as a percentage of average earning assets Net (chargeoffs) recoveries to average loans Total members' equity to total assets Debt to members' equity (:1) Allowance for loan losses to loans 14.35% 2.52% 0.007% 15.96% 5.27 0.53% 16.92% 2.43% 0.018% 16.11% 5.21 0.40% 13.56% 2.54% (0.007)% 17.22% 4.81 0.50% 10.78% 2.74% 0.050% 19.21% 4.20 0.55% 13.19% 2.63% 0.165% 19.37% 4.16 0.61% Permanent capital ratio Common equity tier 1 capital ratio Tier 1 capital ratio Total regulatory capital ratio Tier 1 leverage ratio** Unallocated retained earnings (URE) and URE equivalents leverage ratio 17.80% 17.82% 17.82% 18.26% 15.88% 13.71% 16.81% 16.74% 16.74% 17.17% 16.32% 14.34% 17.97% 17.87% 17.87% 18.40% 17.41% 15.00% 20.13% 20.04% 20.04% 20.48% 19.49% 16.48% 20.03% 19.91% 19.91% 20.54% 19.00% 15.61% Net Income Distribution Estimated patronage refunds: Cash $ 10,150 $ 11,600 $ 9,500 $ 6,500 $ 6,200
3 2022 Annual Report
Management’s Discussion & Analysis of Financial Condition & Results of Operations
(dollars in thousands, except as noted)
GENERAL OVERVIEW
The following commentary summarizes the financial condition and results of operations of Farm Credit of Central Florida, ACA, (Association) for the year ended December 31, 2022 with comparisons to the years ended December 31, 2021 and December 31, 2020. This information should be read in conjunction with the Consolidated Financial Statements, Notes to the Consolidated Financial Statements and other sections in this Annual Report. The accompanying consolidated financial statements were prepared under the oversight of the Audit Committee of the Board of Directors. For a list of the Audit Committee members, refer to the “Report of the Audit Committee” reflected in this Annual Report. Information in any part of this Annual Report may be incorporated by reference in answer or partial answer to any other item of the Annual Report.
The Association is an institution of the Farm Credit System (System), which was created by Congress in 1916 and has served agricultural producers for over 100 years. The System’s mission is to maintain and improve the income and well-being of American farmers, ranchers, and producers or harvesters of aquatic products and farm-related businesses. The System is the largest agricultural lending organization in the United States. The System is regulated by the Farm Credit Administration, (FCA), which is an independent safety and soundness regulator.
The Association is a cooperative, which is owned by the members (also referred to throughout this Annual Report as stockholders or shareholders) served. The territory of the Association extends across a diverse agricultural region of central Florida. Refer to Note 1, Organization and Operations, of the Notes to the Consolidated Financial Statements for counties in the Association’s territory. The Association provides credit to farmers, ranchers, rural residents, and agribusinesses. Our success begins with our extensive agricultural experience and knowledge of the market.
The Association obtains funding from AgFirst Farm Credit Bank (AgFirst or Bank). The Association is materially affected and shareholder investment in the Association could be affected by the financial condition and results of operations of the Bank. Copies of the Bank’s Annual and Quarterly Reports are on the AgFirst website, www.agfirst.com, or may be obtained at no charge by calling 1-800-845-1745, extension 2832, or writing Susanne Caughman, AgFirst Farm Credit Bank, Post Office Box 1499, Columbia, SC 29202.
Copies of the Association’s Annual and Quarterly reports are also available upon request free of charge on the Association’s website, www.FarmCreditCFL.com, or by calling 1-800-533-2773, or writing Anne M. Sullivan, Chief Financial Officer, Farm Credit of Central Florida, ACA, Post Office Box 8009, Lakeland, FL 33802-8009. The Association prepares an electronic version of the Annual Report, which is available on
the website, within 75 days after the end of the fiscal year and distributes the Annual Reports to shareholders within 90 days after the end of the fiscal year. The Association prepares an electronic version of the Quarterly report, which is available on the website, within 40 days after the end of each fiscal quarter, except that no report needs to be prepared for the fiscal quarter that coincides with the end of the fiscal year of the Association.
FORWARD LOOKING INFORMATION
This annual information statement contains forward-looking statements. These statements are not guarantees of future performance and involve certain risks, uncertainties and assumptions that are difficult to predict. Words such as “anticipates,” “believes,” “could,” “estimates,” “may,” “should,” “will”, or other variations of these terms are intended to identify the forward-looking statements. These statements are based on assumptions and analyses made in light of experience and other historical trends, current conditions, and expected future developments. However, actual results and developments may differ materially from our expectations and predictions due to a number of risks and uncertainties, many of which are beyond our control. These risks and uncertainties include, but are not limited to:
• political, legal, regulatory and economic conditions and developments in the United States and abroad;
• economic fluctuations in the agricultural, rural utility, international, and farm-related business sectors;
• weather-related, disease, and other adverse climatic or biological conditions that periodically occur that impact agricultural productivity and income;
• changes in United States government support of the agricultural industry and the Farm Credit System, as a government-sponsored enterprise, as well as investor and rating-agency reactions to events involving other government-sponsored enterprises and other financial institutions; and
• actions taken by the Federal Reserve System in implementing monetary policy.
AGRICULTURAL OUTLOOK
Production agriculture is a cyclical business that is heavily influenced by commodity prices, weather, government policies (including, among other things, tax, trade, immigration, crop insurance and periodic aid), interest rates, input costs and various other factors that affect supply and demand.
The following United States Department of Agriculture (USDA) analysis provides a general understanding of the U.S. agricultural economic outlook. However, this outlook does not take into account all aspects of the Association’s business. References to USDA information in this section refer to the
Farm Credit of Central Florida, ACA
4 2022 Annual Report
U.S. agricultural market data and are not limited to information/data for the Association.
The USDA’s February 2023 forecast estimates net farm income (income after expenses from production in the current year; a broader measure of profits) for 2022 at $162.7 billion, a $21.8 billion increase from 2021 and $70.0 billion above the 10-year average. The forecasted increase in net farm income for 2022, compared with 2021, is primarily due to increases in cash receipts for animals and animal products of $61.9 billion to $257.7 billion and crop receipts of $44.7 billion to 285.7 billion, partially offset by a decrease of $10.3 billion to $15.6 billion in direct government payments and an increase in cash expenses of $65.7 billion to $411.1 billion. If realized, 2022 net farm income (in real dollars of $167.3 billion) would be the highest level since 1973 when net farm income was $172.9 billion adjusted for real dollars.
The USDA’s outlook projects net farm income for 2023 at $136.9 billion, a $25.8 billion or 15.9 percent decrease from 2022, but $44.2 billion above the 10-year average. The forecasted decrease in net farm income for 2023 is primarily due to an expected decrease in cash receipts for animals and animal products of $14.7 billion, crop receipts of $8.8 billion and direct government payments of $5.4 billion, as well as an increase in cash expenses of $13.7 billion. The decrease in cash receipts for animals and animal products are predicted for milk, hogs, broilers and eggs, while cattle receipts are forecast to increase. The expected decline in cash receipts for crops is primarily driven by decreases in corn, soybeans, vegetables and melon receipts, while receipts for wheat are expected to increase. Most production expenses are expected to remain elevated, while feed expenses are projected to decline in 2023 after rising significantly in 2022. Fertilizer-lime-soil conditioner expenses are expected to have peaked in 2022 but remain high in 2023. In addition, interest and labor are forecasted to increase, while fuel and oil expenses are projected to decline.
Working capital (which is defined as cash and cash convertible assets minus liabilities due to creditors within 12 months) is forecasted to increase 5.4 percent in 2022 to $133.4 billion from $126.5 billion in 2021. Although working capital increased, it remains far below the peak of $165 billion in 2012.
The value of farm real estate accounted for 84 percent of the total value of the U.S. farm sector assets for 2022 according to the USDA in its February 2023 forecast. Because real estate is such a significant component of the balance sheet of U.S. farms, the value of farm real estate is a critical measure of the farm sector’s financial performance. Changes in farmland values also affect the financial well-being of agricultural producers because farm real estate serves as the principal source of collateral for farm loans.
USDA’s forecast projects (in nominal dollars) that farm sector equity, the difference between farm sector assets and debt, will rise 10.6 percent in 2022. Farm real estate value is expected to increase 10.1 percent and non-real estate farm assets are expected to increase 9.7 percent, while farm sector debt is forecast to increase 6.3 percent in 2022. Farm real estate debt as a share of total debt has been rising since 2014 and is expected to account for 69.3 percent of total farm debt in 2022.
The USDA is forecasting farm sector solvency ratios to improve in 2022 to 15.1 percent for the debt-to-equity ratio and 13.1 percent for the debt-to-asset ratio, which are well below the peak of 28.5 percent and 22.2 percent in 1985.
Expected agricultural commodity prices can influence production decisions of farmers and ranchers on planted/harvested acreage of crops or inventory of livestock and thus, affect the supply of agricultural commodities. Actual production levels are sensitive to weather conditions that may impact production yields. Livestock and dairy profitability are influenced by crop prices as feed is a significant input to animal agriculture.
Global economic conditions, government actions (including tariffs, war, and response to disease) and weather volatility in key agricultural production regions can influence export and import flows of agricultural products between countries. U.S. exports and imports may periodically shift to reflect short-term disturbances to trade patterns and long-term trends in world population demographics. Also impacting U.S. agricultural trade are global agricultural and commodity supplies and prices, changes in the value of the U.S. dollar and the government support for agriculture.
The following table sets forth the commodity prices per bushel for certain crops, by hundredweight for hogs, milk, and beef cattle, and by pound for broilers and turkeys from December 31, 2019 to December 31, 2022:
Geographic and commodity diversification across the District coupled with existing government safety net programs, ad hoc support programs and additional government disaster aid payment for many borrowers help to mitigate the impact of challenging agricultural conditions. The District's financial performance and credit quality are expected to remain sound overall due to strong capital levels and favorable credit quality position at the end of 2022. Additionally, while the District benefits overall from diversification, individual District entities may have higher geographic, commodity, and borrower concentrations which may accentuate the negative impact on those entities' financial performance and credit quality. Nonfarm income support for many borrowers also helps to mitigate the impact of periods of less favorable agricultural conditions. However, agricultural borrowers who are more reliant on nonfarm income sources may be more adversely impacted by a weakened general economy.
CRITICAL ACCOUNTING POLICIES
The financial statements are reported in conformity with accounting principles generally accepted in the United States of America. Our significant accounting policies are critical to the understanding of our results of operations and financial position because some accounting policies require us to make
Farm Credit of Central Florida, ACA
Commodity 12/31/22 12/31/21 12/31/20 12/31/19 Hogs $ 62.50 $ 56.50 $ 49.10 $ 47.30 Milk $ 24.70 $ 21.70 $ 18.30 $ 20.70 Broilers $ 0.71 $ 0.74 $ 0.44 $ 0.45 Turkeys $ 1.20 $ 0.84 $ 0.72 $ 0.62 Corn $ 6.58 $ 5.47 $ 3.97 $ 3.71 Soybeans $ 14.40 $ 12.50 $ 10.60 $ 8.70 Wheat $ 8.98 $ 8.59 $ 5.46 $ 4.64 Beef Cattle $ 154.00 $ 137.00 $ 108.00 $ 118.00
5 2022 Annual Report
complex or subjective judgments and estimates that may affect the value of certain assets or liabilities. We consider these policies critical because management must make judgments about matters that are inherently uncertain. For a complete discussion of significant accounting policies, see Note 2, Summary of Significant Accounting Policies, of the Notes to the Consolidated Financial Statements. The following is a summary of certain critical policies.
• Allowance for loan losses — The allowance for loan losses is maintained at a level considered adequate by management to provide for probable and estimable losses inherent in the loan portfolio. The allowance for loan losses is increased through provisions for loan losses and loan recoveries and is decreased through allowance reversals and loan charge-offs. The allowance for loan losses is determined based on a periodic evaluation of the loan portfolio by management in which numerous factors are considered, including economic and political conditions, loan portfolio composition, credit quality and prior loan loss experience.
Significant individual loans are evaluated based on the borrower’s overall financial condition, resources, and payment record, the prospects for support from any financially responsible guarantor, and, if appropriate, the estimated net realizable value of any collateral. The allowance for loan losses encompasses various judgments, evaluations and appraisals with respect to the loans and their underlying security that, by nature, contains elements of uncertainty and imprecision. Changes in the agricultural economy and their borrower repayment capacity will cause these various judgments, evaluations and appraisals to change over time. Accordingly, actual circumstances could vary from the Association’s expectations and predictions of those circumstances.
Management considers the following factors in determining and supporting the levels of allowance for loan losses: the concentration of lending in agriculture, combined with uncertainties in farmland values, commodity prices, exports, government assistance programs, regional economic effects and weather-related influences. Changes in the factors considered by management in the evaluation of losses in the loan portfolios could result in a change in the allowance for loan losses and could have a direct impact on the provision for loan losses and the results of operations.
Valuation methodologies — Management applies various valuation methodologies to assets and liabilities that often involve a significant degree of judgment, particularly when liquid markets do not exist for the particular items being valued. Quoted market prices are referred to when estimating fair values for certain assets for which an observable liquid market exists, such as most investment securities. Management utilizes significant estimates and assumptions to value items for which an observable liquid market does not exist. Examples of these items include impaired loans, other property owned, pension and other postretirement benefit obligations, and certain other financial instruments. These valuations require the use of various assumptions, including, among others, discount rates, rates of return on assets, repayment rates, cash flows, default rates, costs of servicing and liquidation values. The use of different assumptions could produce
significantly different results, which could have material positive or negative effects on the Association’s results of operations.
REGIONAL ECONOMICS
General Economy
While consensus among economists and analysts is for a national recession beginning in 2023, Florida remains poised to weather weakness better than other states. The Sunshine State experienced massive growth over the pandemic and recovery periods, with over 1 million people moving here since the beginning of coronavirus lockdowns. In spite of high interest rates, real estate prices remain strong as demand outpaces available supply.
The University of Central Florida’s Institute of Economic Forecasting projects the state’s Real Gross State Product to grow, on average, 0.6% through 2026, slowing to a 1.3% contraction due to recession in 2023. Labor force growth is expected to decelerate in 2023-2024, with the largest benefactors of job increases being e Education & Health Services (1.6%), State & Local Government (1.3%), Financial Services (1.1%), Federal Government (0.6%), and Leisure & Hospitality (0.4%).
Real personal income growth will average 2.0% during 20232026. Following an inflation-driven pullback in 2022, growth will average 3.1% during 2025-2026, hitting 3.2% in 2025. Florida’s average growth will be 0.3 percentage points higher than the national rate over the 2023-2026 four-year span.
The January 2023 single-family home report, released by Florida Realtors, reveals a market for existing housing that remains tight, though more inventory is coming onto market. The median sales price for single family homes decreased by $5,010 in in January 2023 compared with December 2022 to $389,900, and in year over year terms prices are up 4% from January 2022. Statewide, however, median sales prices have retreated 7.1% since their peak in June 2022.
While national recession is expected to strain Florida’s economy, the state’s pro-business legislature, continued net inmigration, rising household wealth, and strong labor market are factors that will help it weather the storm better than most.
Agricultural Sectors
Agriculture, agribusiness, food processing and manufacturing are still a significant driver to the Florida economy. These business segments provide significant jobs and revenues to the state and local economies.
The agricultural industry in the Central Florida region produces a wide variety of farm commodities with nurseries, cattle, citrus and strawberries still the largest market segments and principal commodities financed. Generally, commodities produced in the region are not included in USDA government support programs and are not materially impacted by changes in U.S. farm legislation. The agricultural demographics of the region have changed significantly as a result of non-agricultural development, changing consumer demands and impacts from various pests and diseases.
Farm Credit of Central Florida, ACA
6 2022 Annual Report
While the overall agricultural economy in the Central Florida region has been good over the last few years, there are several significant issues that have affected the area. These issues include the introduction of pest and plant diseases such as citrus greening to the citrus industry, weather-related risks, water-use regulations, environmental rules and regulations, land use and growth management regulations, challenges to property rights and a tight labor supply.
Citrus
The citrus industry is an essential part of the Florida economy but has been severely harmed by the greening disease. Florida Citrus Mutual has reported in the past that the citrus industry in the state provides a total economic revenue impact of $8.6 billion, but with declining acreage and significant damage from Hurricane Ian, it can be inferred that number shrunk substantially in 2023. In 2022, for the first time in history, total citrus production in California was larger than in the Sunshine State.
Results of the annual Commercial Citrus Inventory show total citrus acreage is 375,302 acres, down 8% from the last survey and the lowest in a series which began in 1966. The net loss of 32,046 acres is 19,942 acres more than what was lost last season. New plantings at 7,980 acres are down from the previous season. All citrus trees, at 55.8 million, are down 7% from the previous season. Of the 24 published counties included in the survey, 23 recorded decreases in acreage while one county (Brevard) showed an increase. Hendry county lost the most acreage, down 6,640 acres from last year. For the fourth consecutive season, Desoto County records the most citrus acres at 64,641 acres.
The 2022-2023 Florida all orange forecast released in December 2022 by the USDA Agricultural Statistics Board is 20 million boxes, down 8 million boxes from the October forecast. If realized, this will be 51.2% less than last season’s final production. The forecast consists of 7 million boxes of the non-Valencia oranges (early, mid-season, and Navel varieties) and 13 million boxes of the Valencia oranges.
Nursery
Florida’s floriculture and nursery product industry continues to grow and remains the largest single commodity by cash receipts in the state. According to USDA, total wholesale sales value for floriculture in the state for 2021 was $1.12 billion, slightly below last year’s record, and the top in the country. This is over 17% of all floriculture cash receipts nationwide. While sales growth in the nursery/floriculture sector have ebbed and flowed over the past fifteen years, especially experiencing reductions after the 2008 housing crisis, consumer demand jumped during the pandemic and remained strong through 2022.
Trees, woody ornamentals, and sod are generally produced for end-use in the outdoor landscape market and sales are highly sensitive to neighborhood regulations, total new housing starts, and home improvement activity. Over the course of the pandemic, especially in Florida, home building ramped-up, supporting increases in purchases. Though the Sunshine State is projected to remain one of the fastest growing states in the country, the nationwide dampening in new construction will be felt to the downside, though muted compared with other states. Annuals, garden plants, foliage, and greenery are produced
mainly for the retail consumer market and correlate strongly with discretionary consumer spending, which is expected to decline as American savings have fallen below pre-pandemic levels. Fern growers, tied heavily to the floral industry, generally experience seasonal spikes in demand around Valentine’s and Mother’s Day. Trends on social media sites such as TikTok and Instagram, as well as platforms such as Pinterest and Etsy, continue to instigate sales in the foliage and greenery sectors. Further, with the percentage of Americans working remotely drastically increasing over the past three years, there has been an elevated interest in gardening and “greening” of interior spaces. This demand for plants has remained strong over the course of the pandemic and recovery but has shown signs of plateauing.
Strawberries
The Sunshine State is the country’s primary location for winter growing and the second largest strawberry producer after California. Though Florida’s acreage is about 27% of California’s, its harvested production is 10.3% of the national total, owing to significantly lower yields due to a shorter production window. Acreage peaked in the mid-2010s around 11,000 and in 2021 was estimated at 10,400. For 2023, the California Strawberry Commission is forecasting its state total acreage at 41,570 between fall and summer seasons, an increase of 2% over last year. The California strawberry commission also forecasts Mexican acreage up 10% from 50,200 acres to 55,222 acres.
While the industry faced significant challenges over the pandemic procuring inputs, supply chain kinks are mostly worked out. On the employment side, with increasing wages across the country finding domestic workers is challenging, but large increases in H2-A permit certifications by the Department of Labor should help bridge the gap. It is possible, however, that with Mexican acreage expanding some experienced labor will decide to remain there. Consumer demand is expected to remain strong nearby, as evidenced by growing acreage in California and Mexico. The recent decline in truck transportation costs should provide a trickle-down benefit to growers. Long-term, labor issues are likely to speed-up attempts to mechanize harvesting as well as potentially encourage producers to expand into other regions of Latin America. Drought and water rationing in the West will likely pressure California acreage, potentially shifting some growers into Florida or Mexico. Irrigation concerns are expected to boost interest in controlled environment strawberry production. Further, the expansion of Tampa suburbs and growth in Central Florida are expected to build competition for Florida cropland.
Cattle
Florida is predominantly a cow-calf state. Weaned calves (usually 6-10 months old weighing 300 to 600 pounds) are shipped to stockers or feedlots. While feed costs are a main driver in the cattle industry, Florida’s role in production is almost entirely cow-calf operations developing feeder cattle. Total beef cows in the state for 2022 were 895,000, but including calves the overall cattle number was 1.63 million head. This is down 4% from 2021 and on trend with declining numbers statewide since the early 2000s. Nationally, cattle herd numbers have dipped below national totals last experienced in the 1950s, supportive of strong continued demand from feedlot operations and processors.
Farm Credit of Central Florida, ACA
7 2022 Annual Report
Currently, Florida’s pastureland is not stricken by drought, and with only 31% of the state moderately dry. Cattle conditions overall in January 2023 remained mostly good but many forages have been unable to bounce back from the hard freeze over Christmas 2022. While prices last year were high, Southeast feeder steers are even more elevated, up 13% from this time in 2021. Nationwide, feeder cattle prices are about 20% above the five-year average. Near term risks for Florida’s cattle industry include the ongoing potential for drought, damaged forage/conditions from an expected colder and rainier 2023 winter, and encroaching development buying acres out of production. Long-term, beef consumption in the US is expected to have peaked, with total meat eaten per capita reaching an alltime-high of 225lbs in 2020 and expected to have declined (marginally) to 224.6lbs in 2022. Of this, beef consumption accounts for just under 60lbs per annum. Plant-based protein and high prices are likely to dampen consumer demand over the next few years while prices remain elevated. Further,
societal pressures and political volatility could lead to increased regulation on methane emissions, resulting in added risk to producers.
LOAN PORTFOLIO
The Association provides funds to farmers, rural homeowners, and farm-related businesses for financing of short and intermediate-term loans and long-term real estate mortgage loans through numerous product types. The Association’s loan portfolio is diversified over a range of agricultural commodities in our region, including horticulture, citrus, strawberries, and cattle. Farm size varies and many of the borrowers in the region have diversified farming operations. This factor, along with the numerous opportunities for non-farm income in the area, reduces the level of dependency on a given commodity.
The Association’s total servicing loan volume outstanding for the past three years is shown below.
The diversification of the Association loan volume by type for each of the past three years is shown below.
While we make loans and provide financially related services to qualified borrowers in the agricultural and rural sectors and to certain related entities, our loan portfolio is diversified.
The distribution of the loan volume by line of business for the past three years is as follows:
Farm Credit of Central Florida, ACA
December 31, Servicing Loan Volume 2022 2021 2020 (dollars in thousands) Net Loans Outstanding $ 825,785 60.05% $ 757,407 62.97% $ 658,098 61.08% Participations Sold 281,099 20.44 235,364 19.57 191,220 17.75 Available Commitments 266,385 19.37 207,334 17.23 224,078 20.80 Investments 1,808 0.14 2,748 0.23 3,966 0.37 Total $ 1,375,077 100.00% $ 1,202,853 100.00% $ 1,077,362 100.00%
December 31, Loan Type 2022 2021 2020 (dollars in thousands) Real estate mortgage $ 491,531 59.52 % $ 450,053 59.42 % $ 389,241 59.15 % Production and Intermediate-term 174,627 21.15 177,705 23.46 148,613 22.58 Processing and marketing 86,916 10.53 76,109 10.05 74,677 11.35 Farm-related business 31,173 3.77 21,115 2.79 6,241 0.95 Rural residential real estate 16,420 1.99 12,993 1.71 9,576 1.45 Communication 8,661 1.05 4,961 0.66 14,446 2.19 Loans to Cooperatives 8,574 1.04 6,591 0.87 8,866 1.35 International 6,440 0.78 6,438 0.85 6,438 0.98 Power and water/waste disposal 1,443 0.17 1,442 0.19 – –Total $ 825,785 100.00 % $ 757,407 100.00 % $ 658,098 100.00 %
December 31, Line of Business 2022 2021 2020 Apopka 8.19 % 8.07 % 7.45 % Plant City 7.65 5.36 5.05 Brooksville 3.57 2.94 2.59 Lakeland 2.71 2.40 2.45 Agribusiness 57.17 60.65 57.11 Capital Markets 17.33 17.04 21.83 Residential Lending 2.19 1.67 0.87 Special Assets 1.19 1.87 2.65 100.00 % 100.00% 100.00 % 8 2022 Annual Report
Commodity and industry categories are based upon the Standard Industrial Classification (SIC) system published by the federal government. The system is used to assign commodity or industry categories based upon the largest agricultural commodity of the customer.
The major commodities in the Association loan portfolio are shown below. The predominant commodities are livestock, strawberries, nursery, fruits and vegetables, and citrus, which constitute over 70 percent of the entire portfolio.
The Association manages concentration risks, both industry and large borrower, through an internal hold limit policy based on individual loan risk ratings, loss given defaults, and industry concentrations. Industry concentrations for hold limit purposes are calculated using the repayment dependency code rather than the SIC code. As a result, for portfolio management purposes, industry classifications are determined based on high dependency of repayment coming from the actual commodity itself. Repayment ability is closely related to the commodities produced by our borrowers, and increasingly, the off-farm income of borrowers. For example, citrus and livestock industries are a large percent of the total portfolio but each also have very low repayment dependency coming from the actual commodity itself. Portfolio management industry concentrations are classified in three concentration levels based on the industry concentration (with high dependency) as a percent of total ACA capital; 1) High – greater than 100% of total capital; 2) Medium – between 50% and 100% of total capital; and 3) Low – less than 50% of total capital. The Association’s current loan portfolio contains one medium concentration, the nursery industry. All other industries are in the low concentration level.
31,
The short-term portfolio, which is cyclical in nature and heavily influenced by operating-type loans, normally reaches a minimum balance in August or September and rapidly increases in the fall months as strawberry and other winter vegetable growers increase their borrowings to prepare for the next crop season. The Association has grown the long-term portfolio through increased long term fully funding loans with guarantees.
Loan participations purchased provides a means for the Association to spread credit concentration risk and realize nonpatronage sourced interest and fee income, which strengthens its capital position.
Loan Participations:
Portfolio Management
The risk in the portfolio associated with commodity concentration and large loans is reduced by the range of diversity of enterprises in the Association’s territory as well as the internal hold limit policy which limits any additional increases to already high concentrations.
The increase in loan volume for the twelve months ended December 31, 2022, is primarily attributed to increased demand for loans from within the Association’s charted territory.
For the years ended December 31, 2022, 2021, and 2020, the Association did not have any loans sold with recourse, retained subordinated participation interests in loans sold, or interests in pools of subordinated participation interests.
The Association sells qualified long-term residential mortgage loans into the secondary market. For the years ended December 31, 2022, 2021, and 2020, the Association originated loans for resale totaling $9,865, $13,407, and $12,494, respectively, which were sold into the secondary market.
The Association also participates in the Farmer Mac Long Term Stand-By program. Farmer Mac was established by Congress to provide liquidity to agricultural lenders. At December 31, 2022, 2021 and 2020, the Association had loans totaling $178,121, $114,176 and $95,951, respectively, that are 100 percent guaranteed by Farmer Mac.
The Association additionally has loans wherein a certain portion of the loans are guaranteed by various governmental entities for the purpose of reducing risk. At December 31, 2022, 2021 and 2020, the balance of these loans was $13,997, $17,089 and $20,870, respectively.
Farm Credit of Central Florida, ACA
Commodity Group per SIC Codes December 31, 2022 December 31, 2021 December 31, 2020 (dollars in thousands) Livestock $ 158,563 19.20% $ 149,125 19.69% $ 118,098 17.95% Strawberries 137,361 16.63 128,824 17.01 94,578 14.37 Fruits & Vegetables 109,302 13.24 94,455 12.47 86,757 13.18 Nursery 102,692 12.44 96,670 12.76 80,251 12.19 Citrus 74,021 8.96 69,819 9.22 71,309 10.84 Landlord/Lessors Timber 49,372 42,078 5.98 5.09 46,625 45,997 6.16 6.07 19,801 41,083 3.01 6.24 Rural Home 16,977 2.06 13,474 1.78 9,586 1.46 Blueberries 16,093 1.95 16,226 2.14 17,092 2.60 Poultry 7,618 0.92 5,519 0.73 8,849 1.34 Other 111,708 13.53 90,673 11.97 110,694 16.82 Total $ 825,785 100.00% $ 757,407 100.00% $ 658,098 100.00%
December
Industry as % of Capital 2022 2021 2020 (% of Total Capital) Nursery 74.25 % 76.41 % 68.59 % Strawberries 46.54 62.16 57.37 Cattle 25.72 31.05 41.16 Citrus 23.53 29.29 28.92 Fruits & Vegetables 10.58 8.17 9.73 Blueberries 8.08 8.92 9.05
Participations Purchased – FCS Institutions Participations Sold Total 2022 (d $ 147,598 (281,099) $ (133,501) December 31, 2021 ollars in thousands) $ 133,347 (235,364) $ (102,017) $ $ 2020 144,715 (191,220) (46,505)
9 2022 Annual Report
INVESTMENT SECURITIES
As permitted under FCA regulations, the Association is authorized to hold eligible investments for the purposes of reducing interest rate risk and managing surplus short-term funds. The Bank is responsible for approving the investment policies of the Association. The Bank annually reviews the investment portfolio of every Association that it funds. The Association’s investments consist of pools of Small Business Administration (SBA) guaranteed loans. These investments carry the full faith and credit of the United States government. The balance of these SBA investments, classified as being held-to-maturity, amounted to $1,808 at December 31, 2022, $2,478 at December 31, 2021, and $3,966 at December 31, 2020. Due to FCA regulations, the Association was not able to purchase new investments for several years, and as a result, the balance of these investments has decreased each year. However, the FCA issued new regulations effective January 1, 2019, that allows Associations to begin purchasing investments under specific circumstances. The Association plans to reenter the market in 2023.
CREDIT RISK MANAGEMENT
Credit risk arises from the potential inability of an obligor to meet its repayment obligation. As part of the process to evaluate the success of a loan, the Association continues to review the credit quality of the loan portfolio on an ongoing basis. With the approval of the Association Board of Directors, the Association establishes underwriting standards and lending policies that provide direction to loan officers and credit staff. Underwriting standards include, among other things, an evaluation of:
Character – borrower integrity and credit history
Capacity – repayment capacity of the borrower based on cash flows from operations or other sources of income
Collateral – protection for the lender in the event of default and a potential secondary source of repayment
Capital – ability of the operation to survive unanticipated risks
Conditions – intended use of the loan funds
The credit risk management process begins with an analysis of the borrower’s credit history, repayment capacity, and financial position. Repayment capacity focuses on the borrower’s ability to repay the loan based upon cash flows from operations or other sources of income, including non-farm income. Real estate loans must be collateralized by first liens on the real estate (collateral). As required by FCA regulations, each institution that makes loans on a collateralized basis must have collateral evaluation policies and procedures Long term real estate mortgage loans may be made only in amounts up to 85 percent of the original appraised value of the property taken as collateral or up to 97 percent of the appraised value if guaranteed by a state, federal, or other governmental agency. The actual loan to appraised value when loans are made is generally lower than the statutory maximum percentage. With certain exceptions identified in Association policy, appraisals are required for loans of more than $1,000,000. The ACA will, on occasion, make loans in amounts that exceed the above advance rates for very strong borrowers when the loan will be repaid in less than 10 years. In addition, each loan is assigned a credit risk rating
based upon the underwriting standards. This credit risk rating process incorporates objective and subjective criteria to identify inherent strengths, weaknesses, and risks in a particular relationship.
We review the credit quality of the loan portfolio on an ongoing basis as part of our risk management practices. Each loan is classified according to the Uniform Classification System, which is used by all Farm Credit System institutions. Below are the classification definitions.
Acceptable – Assets are expected to be fully collectible and represent the highest quality.
Other Assets Especially Mentioned (OAEM) – Assets are currently collectible but exhibit some potential weakness.
Substandard – Assets exhibit some serious weakness in repayment capacity, equity, and/or collateral pledged on the loan.
Doubtful – Assets exhibit similar weaknesses to substandard assets. However, doubtful assets have additional weaknesses in existing facts, conditions and values that make collection in full highly questionable.
Loss – Assets are considered uncollectible.
The following table presents selected statistics related to the credit quality of loans including accrued interest at December 31.
High-Risk Assets
The Association’s loan portfolio is divided into performing and high-risk categories. The Special Assets Management Department is responsible for servicing loans classified as highrisk. The high-risk assets, including accrued interest, are detailed below:
Nonaccrual loans represent all loans where there is a reasonable doubt as to the collection of principal and/or future interest accruals, under the contractual terms of the loan. In substance, nonaccrual loans reflect loans where the accrual of interest has been suspended. Nonaccrual loans increased $5,456 or 124.48% in 2022. This increase is due to one fruit and vegetable borrower that moved into nonaccrual in the fourth quarter. The largest nonaccrual sectors are fruits and vegetable and blueberry loans due to the weakness associated with the individual borrower’s repayment capacity and continuing decline of overall collateral values. Of the $9,839 in nonaccrual volume at
Farm Credit of Central Florida, ACA
Credit Quality 2022 2021 2020 Acceptable & OAEM 98.58% 99.13% 99.45% Substandard 1.42% 0.87% 0.55% Total 100.00% 100.00% 100.00%
December 31, High-risk Assets 2022 2021 2020 (dollars in thousands) Nonaccrual loans $ 9,839 $ 4,383 $ 5,464 Restructured loans 1,454 2,247 3,051 Accruing loans 90 days past due – – –Total high-risk loans $ 11,293 $ 6,630 $ 8,515 Other property owned – – 227 Total high-risk assets $ 11,293 $ 6,630 $ 8,742 Ratios Nonaccrual loans to total loans 1.19% 0.58% 0.83% High-risk assets to total assets 1.32% 0.84% 1.27%
10 2022 Annual Report
December 31, 2022, $6,536 or 66.43%, was current as to scheduled principal and interest payments, but did not meet all regulatory requirements to be transferred into accrual status compared to 15.47% and 61.11% at December 31, 2021 and 2020, respectively. The Association had no other property owned at December 31, 2022, and did no acquire or sell any other property owned during the year.
Loan restructuring is available to financially distressed borrowers. Restructuring of loans occurs when the Association grants a concession to a borrower based on either a court order or good faith in a borrower’s ability to return to financial viability. The concessions can be in the form of a modification of terms or rates, a compromise of amounts owed, or deed in lieu of foreclosure. Other receipts of assets and/or equity to pay the loan in full or in part are also considered restructured loans. The type of alternative financing structure chosen is based on minimizing the loss incurred by both the Association and the borrower.
Allowance for Loan Losses
The allowance for loan losses at each period end was considered by Association management to be adequate to absorb probable losses existing in and inherent to its loan portfolio. The allowance for loan losses is broken down between specific reserves assigned to an individual loan and general reserves which are available for the expected losses within the entire portfolio. The current allowance for loan losses at December 31, 2022 contains $3,480 in specific reserves and $898 in general reserves. The following table presents the activity in the allowance for loan losses for the most recent three years.
The allowance for loan losses by loan type for the most recent three years is as follows:
The $1,258 provision of allowance for loan loss in 2022 was primarily the result of one commercial fruit and vegetable grower that moved to nonaccrual in the fourth quarter. The net loan recoveries of $61 is due to the payment of allocated surplus on loans with prior charge-offs.
The allowance for loan losses as a percentage of loans outstanding and as a percentage of certain other credit quality indicators is shown below:
Please refer to Note 3, Loans and Allowance for Loan Losses, of the Notes to the Consolidated Financial Statements, for further information concerning the allowance for loan losses. The Allowance for Loan Losses was determined according to generally accepted accounting principles.
RESULTS OF OPERATIONS
Net Interest Income
Net interest income was $19,550, $16,356, and $15,332 in 2022, 2021 and 2020, respectively. Net interest income is the difference between interest income and interest expense. Net interest income is the principal source of earnings for the Association and is impacted by volume, yields on assets and cost of debt. Higher average daily balances on loan volumes, as well as higher rates on loanable funds are the primary reasons for the increases over 2021. The effects of changes in average volume and interest rates on net interest income over the past three years are presented in the following table:
Change in Net Interest Income:
* Volume variances can be the result of increased/decreased loan volume or from changes in the percentage composition of assets and liabilities between periods.
Farm Credit of Central Florida, ACA
Year Ended December 31, Allowance for Loan Losses Activity: 2022 2021 2020 (dollars in thousands) Balance at beginning of year $ 3,067 $ 3,283 $ 3,113 Charge-offs: Real estate mortgage – – –Production and intermediate-term (7) (7) (6) Rural residential real estate (1) – (61) Total charge-offs (8) (7) (67) Recoveries: Real estate mortgage 20 36 7 Production and intermediate-term 37 75 –Rural residential real estate 4 20 16 Total recoveries 61 131 23 Net (charge-offs) recoveries 53 124 (44) Provision for (reversal of allowance for) loan losses 1,258 (340) 214 Balance at end of year $ 4,378 $ 3,067 $ 3,283 Ratio of net (charge-offs) recoveries during the period to average loans outstanding during the period 0.007% 0.018% (0.007)%
December 31, Allowance for Loan Losses by Type 2022 2021 2020 (dollars in thousands) Real estate mortgage $ 124 $ 1,033 $ 1,196 Production and intermediate-term 3,942 1,750 1,775 Agribusiness 274 257 257 Communication 7 6 20 Power and water/waste disposal 2 2 –Rural residential real estate 27 17 33 International 2 2 2 Total loans $ 4,378 $ 3,067 $ 3,283
Allowance for Loan Losses December 31, as a Percentage of: 2022 2021 2020 Total loans 0.53% 0.40% 0.50% Nonperforming loans 38.77% 46.26% 38.56% Nonaccrual loans 44.50% 69.97% 60.08%
Volume* Rate Total (dollars in thousands) 12/31/22 - 12/31/21 Interest income $ 4,367 $ 4,484 $ 8,851 Interest expense 2,008 3,649 5,657 Change in net interest income $ 2,359 $ 835 $ 3,194 12/31/21 - 12/31/20 Interest income $ 3,220 $ (2,232) $ 988 Interest expense 1,512 (1,548) (36) Change in net interest income $ 1,708 $ (684) $ 1,024
11 2022 Annual Report
Noninterest Income
Noninterest income for each of the three years ended December 31 is shown in the following table:
Noninterest income decreased $2,013 or 11.47% for the year ended December 31, 2022, as compared to the same period of 2021. 2021 noninterest income increased $3,787 or 27.52% when compared to the same period of 2020. The decrease in noninterest income for 2022 is primarily the result decreased fees and patronage from other Farm Credit Institutions, offset by increases in fees from financially related services. Loan fees decreased $162 or 18.84% as a result of no PPP fees in 2022, as opposed to $379 in 2021. The Association received a $3,654 special patronage distribution from the Bank in 2022 as compared to $7,615 in 2021 and $5,757 in 2020. Fees for
Noninterest Expense
financial related services increased $1,256 or 47.79% in 2022 due to increased focus on crop insurance sales. Gains on other rural home loans decreased $97 or 28.78% from the prior year due to market conditions decreasing. During 2022 the Association did not receive insurance premium refunds from the Farm Credit System Insurance Corporation (FCSIC), which insures the System’s debt obligations. These payments are nonrecurring and resulted from the assets of the Farm Credit Insurance Fund exceeding the secure base amount as defined by the Farm Credit Act.
Noninterest expense for each of the three years ended December 31 is shown in the following table:
Noninterest expense increased $1,511 or 11.58 percent for the year ended December 31, 2022, as compared to the same period of 2021, and for the year ended December 31, 2021, it increased $344 or 2.71 percent compared to the same period of 2020. The primary reason for the increase in 2022 were the increases in salaries and employee benefits, insurance fund premiums and nonaccrual and guarantee fees in other operating expenses.
During 2022, salaries and employee benefits increased 6.02% from 2021 as a result of increased headcount and increased payroll costs due to current market conditions. The 3.23% increase during 2021 from 2020 was also due to increased headcount and increased pension expenses.
Occupancy and equipment expenses increased 1.43% from 2021 as a result of the normal recurring annual increases. The 8.36% decrease during 2021 was the result of nonrecurring lease expenses while the Association was building out the new Administration building.
Insurance Fund premiums increased 47.35 percent for the twelve months ended December 31, 2022, compared to the same period of 2021. For 2022, the FCSIC set premiums at 20 basis points on adjusted insured debt outstanding with an additional 10 basis point premium on the average principal outstanding of nonaccrual loans and other than temporarily impaired investments. For 2021, the FCSIC set premiums at 16 basis points on adjusted insured debt outstanding with an additional 10 basis point premium on the average principal outstanding of nonaccrual loans and other than temporarily impaired investments. For 2020, the FCSIC set premiums at 8 basis points on adjusted insured debt outstanding for the first six months and 11 basis points for the last six months, with an additional 10 basis point premium on the average principal outstanding of nonaccrual loans and other than temporarily impaired investments.
Farm Credit of Central Florida, ACA
Percentage For the Year Ended Increase/(Decrease) December 31, 2022/ 2021/ Noninterest Income 2022 2021 2020 2021 2020 (dollars in thousands) Loan fees $ 698 $ 860 $ 1,108 (18.84)% (22.38)% Fees for financially related services 3,884 2,628 1,506 47.79 74.50 Patronage refund from other Farm Credit Institutions 10,771 13,573 10,819 (20.64) 25.46 Gains (losses) on other rural home loans, net 240 337 227 (28.78) 48.46 Gains (losses) on sales of premises and equipment, net – 57 (69) 100.00 (182.61) Gains (losses) on other transactions (61) 85 60 (171.76) 41.67 Insurance Fund refunds – – 107 – (100.00) Other noninterest income 2 7 2 (71.43) 250.00 Total noninterest income $ 15,534 $ 17,547 $ 13,760 (11.47)% 27.52 %
Percentage For the Year Ended Increase/(Decrease) December 31, 2022/ 2021/ Noninterest Expense 2022 2021 2020 2021 2020 (dollars in thousands) Salaries and employee benefits $ 9,143 $ 8,624 $ 8,354 6.02 % 3.23% Occupancy and equipment 990 976 1,065 1.43 (8.36) Insurance Fund premium 1,279 868 459 47.35 89.11 Purchased Services 503 547 484 (8.04) 13.02 Data Processing 161 167 250 (3.59) (33.20) (Gains) losses on other Property owned, net 1 (158) 15 (100.63) (1,153.33) Other operating expenses 2,484 2,026 2,079 22.61 (2.55) Total noninterest expense $ 14,561 $ 13,050 $ 12,706 11.58 % 2.71%
12 2022 Annual Report
Purchased services decreased 8.04% in 2022 from 2021 as a result of a cancellation of an IT services contract with AgFirst. The 13.02% increase in 2021 was a result of increased audit fees as well as increased temporary employment fees.
Data processing decreased 3.59% in 2022 from 2021 as a result of decreased internet costs. The 33.2% decrease during 2021 was a result of decreased internet costs in the new administrative building.
Other operating expenses increased 22.61% during 2022 as compared to 2021 as a result of increased training, travel and advertising and public relations as the Association returned to normal operating activities post COVID, as well as increased nonaccrual expenses and guarantee fees.
Income Taxes
The Association recorded no provision for income taxes for the year ended December 31, 2022, as compared to $35 provision for 2021 and $75 provision for 2020. The 2021 and 2020 tax provisions were the direct result of non-patronage based PPP fee income. Refer to Note 2, Summary of Significant Accounting Policies, Income Taxes, of the Notes to the Consolidated Financial Statements, for more information concerning Association income taxes.
Key Results of Operations Comparisons
Key results of operations comparisons for each of the twelve months ended December 31 are shown in the following table:
LIQUIDITY AND FUNDING SOURCES Liquidity and Funding
The principal source of funds for the Association is the borrowing relationship established with the Bank through a General Financing Agreement (GFA). The GFA utilizes the Association’s credit and fiscal performance as criteria for establishing a line of credit on which the Association may draw funds. The Bank advances the funds to the Association, creating notes payable (or direct loans) to the Bank. The Bank manages interest rate risk through direct loan pricing and asset/liability management. The notes payable are segmented into variable rate and fixed rate components. The variable rate note is utilized by the Association to fund variable rate loan advances and operating funds requirements. The fixed rate note is used specifically to fund fixed rate loan advances made by the Association. Association capital levels effectively create a borrowing margin between the amount of loans outstanding and the amount of notes payable outstanding. This margin is commonly referred to as “Loanable Funds.”
Total notes payable to the Bank at December 31, 2022, was $694,754 as compared to $635,922 at December 31, 2021 and $548,714 at December 31, 2020. The increase of 9.25 percent compared to December 31, 2021 was attributable to the increase in total loan assets. The average daily volume of outstanding notes payable to the Bank was $647,883 and $553,705 for the years ended December 31, 2022 and 2021, respectively. Refer to Note 6, of the Notes to the Consolidated Financial Statements, for weighted average interest rates and maturities, and additional information concerning the Association’s notes payable.
The Association’s return on average assets decreased by 63 basis points and the return on average members’ equity decreased by 257 basis points during 2022 compared to 2021 primarily due to decreased special patronage from AgFirst. The net interest income as a percentage of average earning assets, or net interest margin increased 9 basis points to 2.52% mostly due to higher earnings on loanable funds due to higher market rates. The percentage of net charge-offs and recoveries to average loans was 0.007 percent in the 2022 reporting period and the Association’s recoveries were higher than charge-offs.
A key factor in the growth of net income for future years will be continued improvement in net interest and noninterest income as well as maintaining asset quality. Our goal is to generate earnings sufficient to fund operations, adequately capitalize the Association, and achieve an adequate rate of return for our members. To meet this goal, the agricultural economy must continue to grow and the Association must meet certain objectives. These objectives are to attract and maintain high quality loan volume priced at competitive rates and to manage credit risk in our entire portfolio, while efficiently meeting the credit needs of our members.
Liquidity management is the process whereby funds are made available to meet all financial commitments including the extension of credit, payment of operating expenses and payment of debt obligations. The Association receives access to funds through its borrowing relationship with the Bank and from income generated by operations. The liquidity policy of the Association is to manage cash balances to maximize debt reduction and to increase loan volume. As borrower payments are received, they are applied to the Association’s note payable to the Bank. The Association's investments and other secondary market programs provide additional liquidity. Sufficient liquid funds have been available to meet all financial obligations. There are no known trends likely to result in a liquidity deficiency for the Association.
The Association had no lines of credit from third party financial institutions as of December 31, 2022.
Funds Management
The Bank and the Association manage assets and liabilities to provide a broad range of loan products and funding options, which are designed to allow the Association to be competitive in all interest rate environments. The primary objective of the asset/liability management process is to provide stable and rising earnings, while maintaining adequate capital levels by managing exposure to credit and interest rate risks.
Demand for loan types is a driving force in establishing a funds management strategy. The Association offers fixed, adjustable and variable rate loan products that are marginally priced according to financial market rates. Variable rate loans may be
Farm Credit of Central Florida, ACA
Key Results of For the 12 Months Ended Operations Comparisons 12/31/22 12/31/21 12/31/20 Return on average assets 2.42% 3.05% 2.59% Return on average members’ equity 14.35% 16.92% 13.56% Net interest income as a percentage of average earning assets 2.52% 2.43% 2.54% Net (charge-offs) recoveries to average loans 0.007% 0.018% (0.007)%
13 2022 Annual Report
indexed to market indices such as the Prime Rate. Adjustable rate mortgages are indexed to U.S. Treasury Rates. Fixed rate loans are priced based on the current cost of System debt of similar terms to maturity.
The majority of the interest rate risk in the Association’s Consolidated Balance Sheets is transferred to the Bank through the notes payable structure. The Bank, in turn, actively utilizes funds management techniques to identify, quantify and control risk associated with the loan portfolio.
Relationship with the Bank
The Association’s statutory obligation to borrow only from the Bank is discussed in Note 6, Notes Payable to AgFirst Farm Credit Bank, of the Notes to the Consolidated Financial Statements in this annual report. The Bank’s ability to access capital of the Association is discussed in Note 4, Investment in Other Farm Credit Institutions, of the Notes to the Consolidated Financial Statements. The Bank’s role in mitigating the Association’s exposure to interest rate risk is described in the “Liquidity and Funding” section of this Management’s Discussion and Analysis and in Note 6, Notes Payable to AgFirst Farm Credit Bank, included in this annual report.
CAPITAL RESOURCES
Capital serves to support asset growth and provide protection against unexpected credit and interest rate risk and operating losses. Capital is also needed for future growth and investment in new products and services.
The Association Board of Directors establishes, adopts, and maintains a formal written capital adequacy plan to ensure that adequate capital is maintained for continued financial viability, to provide for growth necessary to meet the needs of members/borrowers, and to ensure that all stockholders are treated equitably. There were no material changes to the capital plan for 2022 that would affect minimum stock purchases or would have an effect on the Association’s ability to retire stock and distribute earnings.
The following sets forth the regulatory capital ratios:
Total members’ equity at December 31, 2022, increased $9,143 to $136,451 from the December 31, 2021, total of $127,308. At December 31, 2021, total members’ equity increased 7.26 percent from the December 31, 2020 total of $118,693. The increase in 2022 was primarily attributed to the positive earnings being offset by the payment of $10,150 in cash patronage distributions and the revolvement of $1,276 in allocated surplus.
Total capital stock and participation certificates were $1,212 on December 31, 2022, compared to $1,149 on December 31, 2021 and $1,008 on December 31, 2020. The 2022 increase from 2021 was attributed to the issuance of new protected borrower stock and participation certificates due to increased loan volume, partially offset by the retirement of protected borrower stock and participation certificates on loans liquidated in the normal course of business and the retirement of excess stock through revolvement.
Effective January 1, 2017, the regulatory capital requirements for System Banks and associations were modified. The new regulations ensure that the System’s capital requirements are comparable to the Basel III framework and the standardized approach that the federal banking regulatory agencies have adopted. New regulations replaced core surplus and total surplus ratios with common equity tier 1 (CET1) capital, tier 1 capital, and total capital risk-based capital ratios. The new regulations also include a tier 1 leverage ratio and an unallocated retained earnings equivalents (UREE) leverage ratio. The permanent capital ratio (PCR) remains in effect.
FCA sets minimum regulatory capital requirements with a capital conservation buffer for System banks and associations. Capital adequacy is evaluated using a number of regulatory ratios. According to the FCA regulations, each institution’s permanent capital ratio is calculated by dividing permanent capital by a risk adjusted asset base. Risk adjusted assets mean the total dollar amount of the institution’s assets adjusted by an appropriate credit conversion factor as defined by regulation. For all periods represented, the Association exceeded minimum regulatory standards for all the ratios. The Association’s capital ratios as of December 31 and the FCA minimum requirements follow:
If the capital ratios fall below the minimum regulatory requirements, including the buffer amounts, capital distributions (equity redemptions, dividends, and patronage) and discretionary senior executive bonuses are restricted or prohibited without prior FCA approval.
The increase in the Association’s Total Regulatory Capital Ratio for December 31, 2022 from December 31, 2021 was attributed to regulatory capital outpacing the growth of risk weighted assets. The increase in the actual dollar capital is due to 2022 earnings.
Farm Credit of Central Florida, ACA
Ratio Minimum Requirement Capital Conservation Buffer* Minimum Requirement with Capital Conservation Buffer 2022 Capital Ratios as of December 31, 2021 2020 Risk-adjusted ratios: CET1 Capital Ratio 4.5% 2.5% 7.0% 17.82% 16.74% 17.87% Tier 1 Capital Ratio 6.0% 2.5% 8.5% 17.82% 16.74% 17.87% Total Capital Ratio Permanent Capital Ratio 8.0% 7.0% 2.5% –% 10.5% 7.0% 18.26% 17.80% 17.17% 16.81% 18.40% 17.97% Non-risk-adjusted: Tier 1 Leverage Ratio* 4.0% 1.0% 5.0% 15.88% 16.32% 17.41% UREE Leverage Ratio 1.5% –% 1.5% 13.71% 14.34% 15.00%
Tier 1 Leverage Ratio must include a minimum of 1.5% of URE and URE equivalents.
*The
14 2022 Annual Report
There are no trends, commitments, contingencies, or events that are likely to affect the Association’s ability to meet regulatory minimum capital standards and capital adequacy requirements.
See Note 7, Members’ Equity, of the Consolidated Financial Statements, for further information concerning capital resources.
PATRONAGE PROGRAM
Prior to the beginning of any fiscal year, the Association’s Board of Directors, by adoption of a resolution, may establish a Patronage Allocation Program to distribute its available consolidated net earnings. This resolution provides for the application of net earnings in the manner described in the Association’s Bylaws. This includes the setting aside of funds to increase surplus to meet minimum capital adequacy standards established by FCA Regulations, to increase surplus to meet Association capital adequacy standards to a level necessary to support competitive pricing at targeted earnings levels, and for reasonable reserves for necessary purposes of the Association. After excluding net earnings attributable to (a) the portion of loans participated to another institution, (b) non-patronage participation loans purchased, and (c) other nonpatronage sourced activities, the remaining consolidated net earnings are eligible for allocation to borrowers. Refer to Note 7, Members’ Equity, of the Notes to the Consolidated Financial Statements, for more information concerning the patronage distributions. The Association declared patronage distributions of $10,150 in 2022, $11,600 in 2021 and $9,500 in 2020.
YOUNG, BEGINNING AND SMALL (YBS) FARMERS AND RANCHERS PROGRAM
The Association’s mission is to provide financial services to agriculture and the rural community, which includes providing credit to Young*, Beginning** and Small*** farmers. Because of the unique needs of these individuals, and their importance to the future growth of the Association, the Association has established annual marketing goals to increase our market share of loans to YBS farmers. Specific marketing plans have been developed to target these groups, and resources have been designated to help ensure YBS borrowers have access to a stable source of credit. As a result, 2022 goals for new volume were established. In 2022 the Association achieved all of its YBS goals.
The following table outlines the loan volume and number of YBS loans in the loan portfolio for the Association.
Note: For purposes of the above table, a loan could be classified in more than one category, depending upon the characteristics of the underlying borrower.
The 2017 USDA Ag census data has been used as a benchmark to measure penetration of the 19,235 reported farmers of which by definition 897 or 4.67 percent were Young, 5,629 or 29.26 percent were Beginning, and 12,709 or 66.07 percent were Small. Comparatively, as of December 31, 2022, the demographics of the Association’s agricultural portfolio contained 1,724 YBS farmers, of which by definition 192 or 11.14 percent were Young, 556 or 32.25 percent were beginning and 976 or 56.61 percent were Small.
The Association Board of Directors has adopted a Young, Beginning, and Small Farmer Plan with specific goals for the number of loans and new volume closed for 2023 and two succeeding years. The Association will continue to review the demographics of its territory during 2023 utilizing 2017 Ag census data.
The following strategies and outreach programs have been conducted which assists and supports the Association’s efforts to meet its objectives and goals for financing to the Young, Beginning, and Small farmers.
Support of 4-H, FFA, and young farmer organizations through sponsorships and donations.
Sponsor seminars on farm transition planning and financial management.
Youth livestock financing program for Youth Steer and Swine Shows. Available territory wide.
Financial Training in cooperation with Florida Southern College, Citrus and Horticulture Dept.
Employees serve as judges for youth livestock project record books.
Sponsor participants and participate in Florida Council of Coops, Young Cooperator Conference.
Sponsor Florida Nursery Growers Young Professional Award.
Sponsors and attends the statewide Farm Bureau Young Farmers and Ranchers Leadership Conference.
In addition, the Association’s lending personnel actively participate in various commodity trade group conferences and continuing education programs. Association lenders have established performance goals to provide informational and financial training to agricultural youth groups and industry trade associations.
The Association is committed to the future success of Young, Beginning and Small farmers.
* Young farmers are defined as those farmers, ranchers, producers or harvesters of aquatic products who are age 35 or younger as of the date the loan is originally made.
Farm Credit of Central Florida, ACA
2022 YBS 2022 2022 Goals and Results Goal Result % of Goal Young # of New Loans 35 55 157.14% $ of New Loans $2,500 $8,619 344.78% Beginning # of New Loans 110 152 138.18% $ of New Loans $9,500 $37,754 397.41% Small # of New Loans 140 233 166.43% $ of New Loans $14,000 $35,079 250.56% Total YBS Program # of New Loans 285 440 154.39% $ of New Loans $26,000 $81,452 313.28%
As of December 31, 2022 Number of Loans Amount of Loans Young 192 $32,470 Beginning 556 $121,057 Small 976 $111,865
15 2022 Annual Report
** Beginning farmers are defined as those farmers, ranchers, producers or harvesters of aquatic products who have 10 years or less farming or ranching experience as of the date the loan is originally made.
*** Small farmers are defined as those farmers, ranchers, producers or harvesters of aquatic products who normally generate less than $250 thousand in annual gross sales of agricultural or aquatic products at the date the loan is originally made.
REGULATORY MATTERS
On April 14, 2022, the FCA approved a final rule that amends certain regulations to address changes in accounting principles generally accepted in the United States. Such changes reflect the Current Expected Credit Losses (CECL) methodology that will replace the incurred loss methodology upon adoption. Credit loss allowances related to loans, lessor’s net investments in leases, and held-to-maturity debt securities would be included in a System institution’s Tier 2 capital up to 1.25 percent of the System institution’s total risk weighted assets. Credit loss allowances for available-for-sale debt securities and purchased credit impaired assets would not be eligible for inclusion in a System institution’s Tier 2 capital. The regulation does not include a transition phase-in period for the CECL day 1 cumulative effect adjustment to retained earnings on a System institution’s regulatory capital ratios. In addition, the regulation does not include an exclusion for the CECL day 1 cumulative effective adjustment from the “safe harbor” deemed prior approval provision. The rule became effective on January 1, 2023.
On August 26, 2021, the FCA issued a proposed rule to revise its regulatory capital requirements to define and establish riskweightings for High Volatility Commercial Real Estate (HVCRE) by assigning a 150 percent risk-weighting to such exposures, instead of the current 100 percent. The proposed rule would ensure that the FCA’s rule remains comparable with the capital rule of other federal banking regulatory agencies and recognizes the increased risk posed by HVCRE exposures. The public comment period ended on January 24, 2022.
On June 30, 2021, the FCA issued an advance notice of proposed rulemaking (ANPRM) that seeks public comments on whether to amend or restructure the System bank liquidity regulations. The purpose of this advance notice is to evaluate the applicability of the Basel III framework to the Farm Credit System and gather input to ensure that System banks have the liquidity to withstand crises that adversely impact liquidity and threaten their viability. The public comment period ended on November 27, 2021.
month US dollar LIBOR settings immediately following the LIBOR publication on December 31, 2021, and the remaining US dollar LIBOR settings immediately following the LIBOR publication on June 30, 2023. On the same day, the UK FCA announced that the IBA had notified the UK FCA of its intent, among other things, to cease providing certain US dollar LIBOR settings as of June 30, 2023. In its announcement, the UK FCA confirmed that all 35 LIBOR tenors (including with respect to US dollar LIBOR) will be discontinued or declared nonrepresentative as of either: (a) immediately after December 31, 2021 or (b) immediately after June 30, 2023.
The Association has exposure to LIBOR arising from loans made to customers, investment securities purchased, and Systemwide Debt Securities issued by the Funding Corporation on the Bank’s behalf. Alternative reference rates that replace LIBOR may not yield the same or similar economic results over the lives of the financial instruments, which could adversely affect the value of, and return on, instruments held.
The FCA has issued guidance similar to that of the U.S. prudential regulators but applicable for System institutions to follow as they prepare for the expected phase-out of LIBOR. The guidelines direct each System institution to develop a LIBOR transition plan designed to provide an orderly roadmap of actions that will reduce LIBOR exposure, stop the inflow of new LIBOR volume, and adjust operating processes to implement alternative reference rates.
The Association has implemented a LIBOR transition plan and continue to analyze potential risks associated with the LIBOR transition, including, but not limited to, financial, market, accounting, operational, legal, tax, reputational, and compliance risks.
On December 16, 2022, the Federal Reserve Board adopted a final rule implementing certain provisions of the LIBOR Act (“Regulation ZZ”). Regulation ZZ specifies that on the LIBOR replacement date, which is the first London banking day after June 30, 2023, the Federal Reserve Board-selected benchmark replacement, based on SOFR and including any tenor spread adjustment as provided by Regulation ZZ, will replace references to overnight, one-month, three-month, six-month, and 12-month LIBOR in certain contracts that do not mature before the LIBOR replacement date and that do not contain adequate fallback language. While substantially all contracts, including Systemwide Debt Securities and loans made by District institutions, have adequate fallbacks to replace LIBOR, the LIBOR Act and Regulation ZZ could apply to certain Systemwide Debt Securities and investments, and loans that reference LIBOR and have no or inadequate fallback provisions.
LIBOR Transition
In 2017, the United Kingdom’s Financial Conduct Authority (UK FCA), which regulates LIBOR, announced its intention to stop persuading or compelling the group of major banks that sustains LIBOR to submit rate quotations after 2021. As a result, it was uncertain whether LIBOR would continue to be quoted after 2021.
On March 5, 2021, ICE Benchmark Administration (IBA) (the entity that is responsible for calculating LIBOR) announced its intention to cease the publication of the one-week and two-
The following is a summary of the Association’s outstanding variable-rate financial instruments tied to LIBOR at December 31, 2022:
Farm Credit of Central Florida, ACA
Due in 2023 on or Due after Due in Before June 30, (dollars in millions) 2022 June 30, 2023 Total Loans $ 441 $ 1,464 $ 31,255 $ 33,160 Total Assets $ 441 $ 1,464 $ 31,255 $ 33,160 Note Payable to AgFirst Farm Credit Bank $ 366 $ 1,212 $ 25,875 $ 27,453 Total Liabilities $ 366 $ 1,212 $ 25,875 $ 27,453 16 2022 Annual Report
The Association is evaluating all variable rate instruments and actively monitoring LIBOR exposure of the financial instruments listed in the table above as part of its LIBOR transition Plan (Plan). The Plan includes implementing fallback language into variable-rate financial instruments which provides the ability to move these instruments to another index. A large portion of the Association’s loans that have exposure to LIBOR are purchased from other financial institutions and the
RECENTLY ISSUED ACCOUNTING PRONOUNCEMENTS
Association is dependent on the other financial institutions to perform the borrower negotiations. To the extent that any loan has not been prepaid, redeemed or amended prior to June 30, 2023 to include a non-LIBOR fallback rate, pursuant to the LIBOR Act and Regulation ZZ, the LIBOR-based rate that would have been paid under such loan will be replaced by operation of law.
Please refer to Note 2, Summary of Significant Accounting Policies, in the Notes to the Consolidated Financial Statements for recently issued accounting pronouncements.
The following Accounting Standards Updates (ASUs) were issued by the Financial Accounting Standards Board (FASB) but have not yet been adopted:
Summary of Guidance Adoption and Potential Financial Statement Impact
Financial Instruments – Credit Losses (Topic 326): Measurement of Credit Losses on Financial Instruments
•
Replaces multiple existing impairment standards by establishing a single framework for financial assets to reflect management’s estimate of current expected credit losses (CECL) over the entire remaining life of the financial assets.
Changes the present incurred loss impairment guidance for loans to an expected loss model.
Modifies the other-than-temporary impairment model for debt securities to require an allowance for credit impairment instead of a direct write-down, which allows for reversal of credit impairments in future periods based on improvements in credit quality.
Eliminates existing guidance for purchased credit impaired (PCI) loans, and requires recognition of an allowance for expected credit losses on these financial assets.
Modifies and enhances financial instruments disclosures.
Eliminates the accounting guidance for TDRs by creditors in Subtopic 310-40, Receivables—Troubled Debt Restructurings by Creditors, while enhancing disclosure requirements for certain loan refinancings and restructurings by creditors when a borrower is experiencing financial difficulty. Specifically, rather than applying the recognition and measurement guidance for TDRs, an entity must apply the loan refinancing and restructuring guidance in paragraphs 310-20-35-9 through 35-11 to determine whether a modification results in a new loan or a continuation of an existing loan.
Requires a cumulative-effect adjustment to retained earnings as of the beginning of the reporting period of adoption.
Effective for fiscal years beginning after December 15, 2022, and interim periods within those fiscal years. Early application is permitted.
• The Association has established a cross-discipline governance structure utilizing common guidance developed across the Farm Credit System.
• The Association has completed development of PD/LGD model and independently validated the model for conceptual soundness. The implementation of processes, internal controls and policy updates are complete.
• The Association macroeconomic forecast includes a weighted selection of the Moody’s baseline, upside 10th percentile and downside 90th percentile scenarios.
• The adoption of the standard will not have a material impact on the Association’s investment portfolio.
• The guidance has been adopted on January 1, 2023 and did not have a material impact on the Association’s consolidated financial statements.
Farm Credit of Central Florida, ACA
• • • • • • •
17 2022 Annual Report
Disclosure Required by Farm Credit Administration Regulations
Description of Business
Descriptions of the territory served, persons eligible to borrow, types of lending activities engaged in, financial services offered and related Farm Credit organizations are incorporated herein by reference to Note 1, Organization and Operations, of the Consolidated Financial Statements included in this Annual Report to shareholders.
The description of significant developments that had or could have a material impact on earnings or interest rates to borrowers, acquisitions or dispositions of material assets, material changes in the manner of conducting the business, seasonal characteristics, and concentrations of assets, if any, is incorporated in “Management’s Discussion and Analysis of Financial Condition and Results of Operations” included in this Annual Report.
Unincorporated Business Entities
The Association had no unincorporated business entities at December 31, 2022.
Description of Property
The following table sets forth certain information regarding the properties of the reporting entity, all of which are located in Florida:
Legal Proceedings
Information, if any, to be disclosed in this section is incorporated herein by reference to Note 11, Commitments and Contingencies, of the Consolidated Financial Statements included in this Annual Report.
Description of Capital Structure
Information to be disclosed in this section is incorporated herein by reference to Note 7, Members’ Equity, of the Consolidated Financial Statements included in this Annual Report.
Description of Liabilities
The description of liabilities, contingent liabilities and obligations to be disclosed in this section is incorporated herein by reference to Notes 2, 6, 9 and 11 of the Consolidated Financial Statements included in this Annual Report.
Management’s Discussion and Analysis of Financial Condition and Results of Operations
“Management’s Discussion and Analysis of Financial Condition and Results of Operations,” which appears in this Annual Report and is to be disclosed in this section, is incorporated herein by reference.
Farm Credit of Central Florida, ACA
Form of Location Description Ownership 204 E. Orange Street* Administrative/ Leased Lakeland Branch 57 E. Third Street Branch Owned Apopka 2301 Thonotosassa Road Branch Owned Plant City 31050 Cortez Blvd. Branch Owned Brooksville
The Administrative / branch office
at 204 E, Orange St. is
December 31, 2035.
*
located
leased through
18 2022 Annual Report
Senior Officers
The following represents certain information regarding the senior officers of the Association and their business experience for the past five years:
Senior Officer Time in Position Prior Experience
Reginald T. Holt,
14 years Sr. VP & Director of Agribusiness Lending from October 1997 to April 2008. Area President & Chief Executive Officer VP from June 1992 to October 1997. Serves on the AgFirst/Farm Credit Bank of Texas Benefits Plan Sponsor Committee, and is the Vice Chair of the AgFirst Farm Credit Bank Benefits Plan Sponsor Committee.
D. Scott Fontenot, 6 years Association CFO from June 2009 until September 2016. Association Director of Risk Executive Vice President & Chief Management from March 2009 to June 2009. EVP & CFO of Jack M. Berry, Inc. from Operating Officer 2005 to 2009. CFO of Farm Credit of Southwest Florida from 2000 to 2004.
Anne M. Sullivan, 6 years Association Controller from June 2011 until September 2016. Director of Accounting
Sr. Vice President / Corporate with Century Residential, LLC from June 2009 until June 2011. Senior Accountant Treasurer, Chief Financial Officer with the NCT Group from September 2006 until June 2009.
A. Dawn Tuten
3 years Association Corporate Secretary and Director of Corporate Services 2017-2019.
Sr. Vice President/Corporate Secretary, Association Corporate Secretary and HR Manager 2012-2017. Association Paralegal Chief Administrative Officer from 2005 to 2011. Paralegal with Publix Super Markets 1997 to 2005.
Jeffrey T. Phillips
Sr. Vice President/Chief Lending Officer
Johan S. Dam
2 years Association Chief Relationship Manager from April 2007 to October 2020.
2 years Association Chief Digital Strategist and Marketing Officer 2019-2020. Association
Sr. Vice President/Chief Marketing & Capital Markets and Investment Officer 2018-2019. Principal with Prudential Ag Risk Officer Investments 2015 to 2018. Association Chief Relationship Manager 2007 to 2015. Commercial Relationship Manager with SunTrust Bank 1997 to 2007.
Kerri Y. Costine
1 year Association Credit Analyst Manager from August 2017 until September 2021. Vice
Sr. Vice President/Chief Credit Officer President Commercial Account Manager with TD Bank, NA from May 2012 to August 2017. Vice President Commercial Portfolio Loan Officer with TD Bank, NA from October 2010 to May 2012.
The total amount of compensation earned by the CEO and the highest paid officers as a group during the years ended December 31, 2022, 2021 and 2020 is as follows:
* Amounts in
Disclosure of information on the total compensation paid during 2022 to any senior officer or to any other employee included in the aggregate group total as reported in the above is available and will be disclosed to the shareholders of the institution upon request.
In addition to base salary, all Association employees (except the Director of Internal Audit and internal audit and review staff who may earn additional compensation under the Auditor Incentive Plan) may earn additional compensation under a corporate bonus plan (Plan). The Plan is designed to encourage participants to achieve the objectives of the Association by providing incentives to those employees who attain and sustain consistently high levels of performance, which contribute to the overall success and profitability of the Association. The Plan is designed to support the ACA’s organizational vision, long-range and annual strategic plans. The Plan consists of the following pools; 1) General Pool;
The General Pool covers all employees that are not included in any of the other defined pools. The payout of the pool is based on the Association meeting and exceeding certain objectives for Earnings and Liquidity (weighted at 50%), Asset Quality and Credit Administration (weighted at 25%), and Lending and Growth (weighted at 25%). Payments are calculated at yearend based on the weighted average performance in each category, paid 100 percent in cash. The General Pool contains five different payout levels. Level 1 contains all non-exempt employees (for wage and salary administration purposes) and the maximum award at this level shall not exceed 5% of their annual earned salary. Level 2 contains non-exempt employees of the Pre-Close Team, the Doc-Prep Team and the Post-Cost Team and the maximum award for this level shall not exceed 7.5% of the annual earned salary. Level 3 contains exempt employees (except CEO, Senior Officers, Director of Internal Audit, and employees identified in other defined pools) and the maximum award at this level shall not exceed 12% of their annual earned salary. Level 4 contains Senior Officers (except CEO, Director of Internal Audit, and employees identified in other defined pools) and the maximum award at this level shall not exceed 25% of their annual earned salary. Level 5 contains
Farm Credit of Central Florida, ACA
Name of Individual or Deferred Change in Perq/ Number in Group Year Salary Bonus Comp. Pension Value Other* Total Reginald T. Holt 2022 $ 410,130 $ 184,440 $ – $ (514,674) $ – $ 79,896 Reginald T. Holt 2021 $ 410,141 $ 163,933 $ – $ (1,751) $ – $ 572,323 Reginald T. Holt 2020 $ 390,616 $ 155,895 $ – $ 426,305 $ – $ 972,816 7 2022 $ 1,406,323 $ 413,041 $ – $ (718,967) $ – $ 1,100,397 6 2021 $ 1,454,741 $ 469,906 $ – $ 127,803 $ – $ 2,052,450 7 2020 $ 1,169,333 $ 346,065 $ – $ 417,969 $ – $ 1,933,367
the above table classified as Perquisites include travel incentives, group life insurance, automobile compensation, purchased automobile, spousal travel, relocation and tuition reimbursement, if the annual aggregate value of such Perquisites is more than $5,000.
2) Loan Officer Pool; 3) Credit Analysts Pool; and 4) Manager Pool.
19 2022 Annual Report
the CEO only and the maximum award at this level shall not exceed 50% of the annual earned salary. Each of the levels requires a certain minimum individual employee evaluation score. In addition, the General Pool limits the total of all payments within the pool to a maximum of 10 percent of the total net income.
The Loan Officer Pool covers lenders and the lending managers and is based upon the individual performance of each. Award percentage points are earned for Portfolio Management (weighted 65%) and Loan Administration (weighted 35%) standards based upon a points scoring matrix with performance areas weighted according to the individual’s standard of performance. Deductions to earned awards shall be made for the individual’s performance score in the area of Loan Administration (asset quality and delinquencies). Payments at this level are calculated at year-end based on the weighted average performance in each category and also require a certain minimum individual employee evaluation score. The maximum award at this level shall not exceed 75% of their annual earned salary. All payments are paid 100% in cash.
The Credit Analysts Pool covers credit analysts and is based upon the individual performance of each. Award percentage points are earned based on number of transactions activity with a payout % based on the individual’s standards of performance evaluation. Payments at this level are calculated at year-end based on the weighted average performance in each category and also require a certain minimum individual employee evaluation score. The maximum award at this level shall not exceed 18% of the annual earned salary for credit analysts. All payments are paid 100% in cash.
The Managers Pool covers certain managers with individual performance goals (other managers without individual performance goals are in the General Pool) and is based upon the individual performance for each. Award percentage points are earned based on a payout % of the individual’s standards of performance evaluation. Payments at this level are calculated at year-end based on the weighted average performance in each category and also require a certain minimum individual employee evaluation score. The maximum award at this level shall not exceed 20% of their annual earned salary. All payments are paid 100% in cash.
The Director of Internal Audit and internal audit and review staff may earn additional compensation under the Auditor Incentive Plan. The purpose of the plan is to encourage participants to achieve the long-term objectives of the Association by providing incentives to eligible audit staff that attain and sustain consistently high levels of performance, which contribute to the safety and soundness of the Association. The pay-out of the plan is based on the audit employee’s performance rating as determined by their respective employee evaluations. The Director of Internal Audit’s evaluation is conducted by the audit committee and reviewed by the board. The audit staff’s evaluation is conducted by the Director of Internal Audit and reviewed by the audit committee. While the award is based on the employee’s performance the final payout is made at the discretion of the board of directors.
Payment of the 2022 Corporate Bonus is in the first quarter of 2023. Bonuses are shown in the year earned, which may be different than the year of payment.
In 2020, the CEO, Mr. Holt, and the Association entered into a change of control agreement that is effective for 5 years. Should a change of control occur, the Association will continue to employ Mr. Holt for a minimum of three years. Should his employment be terminated during the two years prior or the three years after the change of control or should any major changes to the employment conditions occur during the same time periods, Mr. Holt will be entitled to a severance package as outlined in the agreement.
The present value of pension benefits is the value at a specific date of the benefit payment stream an individual is expected to receive upon retirement based on pay and service earned to date. These present values change year over year as (1) pension benefits increase due to an additional year of pay and service being earned under the benefit formula, (2) individuals are one year older and one year closer to receiving payments, and (3) the assumptions used to determine the present value change.
The present value of pension benefits will naturally increase as the benefits earned under the plan increase. Since the pension benefit formula is dependent on base pay, pay increases directly impact the pension values.
The present value is calculated by discounting each expected future benefit payment back to the determination date at a specified interest (or discount) rate. When a year passes, there is one less year of discounting, which increases the present value. For those already eligible for unreduced retirement (e.g. have 85 age + service points), this increase is offset by the decrease in early retirement subsidy value. The early retirement subsidy provided under the plan is most valuable when a participant first reaches eligibility for unreduced benefits. The value decreases every year thereafter until age 65.
Finally, the present value of the expected future benefit payment stream is based on actuarial assumptions, chiefly the discount rate mentioned above. Other assumptions are also used, such as expected retirement age and life expectancy. Changes in the actuarial assumptions can increase or decrease the pension values. The discount rate is updated every year based on the interest rate environment at December 31. A decrease in the discount rate (i.e. less discounting) increases the present values and vice versa. There was an increase in the discount rate assumption from December 31, 2021 to December 31, 2022, which decreased the pension values.
Farm Credit of Central Florida, ACA
20 2022 Annual Report
* Represents the average years of credited service for the group
Mr. Holt participates in the AgFirst Farm Credit Bank Supplemental Retirement Plan, a nonqualified supplemental executive retirement plan. Benefits that would have accrued in the qualified defined benefit retirement plan in the absence of Internal Revenue Code limitations are made up through the nonqualified supplemental executive retirement plan. At the election of the retiree, benefits are paid based upon various annuity terms.
Directors
As a non-qualified plan, assets have been allocated and separately invested for this plan, but are not isolated from the general creditors of the Association. Additionally, all employees are reimbursed for all direct travel expenses incurred when traveling on Association business. A copy of the travel policy is available to shareholders upon written request.
The following chart details the year the director began serving on the board, the current term of expiration, current committee assignments, number of meetings, other activities, compensation for Board meetings and other activities and total cash compensation paid:
* Includes board committee meetings and other board activities other than regular board meetings.
**C. Dennis Carlton, Sr. and William L. Klinger resigned from the Board June 3, 2022.
(1)
Chair of the Audit Committee Chair of the Governance Committee Chair of the Compensation Committee Chair of the Risk Management Committee
Pension Benefits Table As of December 31, 2022 Name of Individual or Number in Group CEO: Reginald T. Holt Reginald T. Holt Year 2022 2022 Plan Name AgFirst Retirement Plan Supplemental Executive Retirement Plan Number of Years Credited Service 43.00 43.00 Actuarial Present Value of Accumulated Benefits $ 3,200,255 1,501,164 $ 4,251,419 Payments During 2022 $ ––$ –Senior Officers and Highly Compensated Employees: 3 Officers, excluding the CEO 2022 AgFirst Retirement Plan 25.44* $ 2,749,604 $ 2,749,604 $ $ ––
Farm Credit of Central Florida, ACA
Term in Office Number of Days Served Compensation Election or Current Director Position Appointment Year Term Expiration Board Meetings Other Official Activities* Total Paid During 2022 Committee Assignments^ Keith D. Mixon Randy L. Larson Daniel T. Aprile (3) Robert M. Behr Chair Vice-Chair/ Outside Director Director Director 2012 2016 2019 2022 2023 2023 2025 2025 7 6 7 4 18 10 8 6 $ 35,000 29,167 28,833 16,333 Audit, Governance Risk Management, Governance Compensation, Risk Management Audit, Compensation, Governance Jenny R. Black (2) Director C. Dennis Carlton, Jr. Director C. Dennis Carlton, Sr.** Director 2014 2022 2004 2024 2025 2022 7 4 3 5 3 4 30,000 16,333 11,667 Governance, Compensation Compensation, Risk Management Risk Management, Compensation W. Rex Clonts, Jr. Director 1997 2024 7 10 28,000 Audit, Governance Reed C. Fischbach Director 2020 2023 7 11 28,000 Audit, Risk Management William L. Klinger** Director 2019 2022 3 4 11,667 Audit, Governance David A. Mereness (1) Outside Director 2016 2025 7 11 33,000 Audit, Risk Management Timothy D. Schaal Randall E. Strode (4) Director Director 2022 2016 2024 2023 4 7 5 8 $ 16,333 30,000 314,333 Audit, Compensation Risk Management, Compensation
21 2022 Annual Report
(2) (3) (4)
Subject to approval by the board, the Association may allow directors an annual retainer of $28,000 to be paid monthly. The chairs of the Compensation, Governance and Risk Management committees also receive $2,000. The chair of the audit committee receives $5,000, and the chair of the Board receives $7,000. All additional compensation amounts are annual stipends, paid monthly. Total compensation paid to directors as a group was $314,333 for 2022. No director received more than $5,000 in non-cash compensation during the year.
Directors are reimbursed on an actual cost basis for all expenses incurred in the performance of official duties. Such expenses may include transportation, lodging, meals, tips, tolls, parking of cars, laundry, registration fees, and other expenses associated with travel on official business. A copy of the policy is available to shareholders of the Association upon request.
The aggregate amount of reimbursement for travel, subsistence and other related expenses for all directors as a group was $72,457 for 2022, $33,210 for 2021 and $32,965 for 2020.
The following represents certain information regarding the directors of the Association, including their principal occupation and employment for the past five years. Unless specifically listed, the principal occupation of the board member for the past five years has been as a self-employed farmer.
Keith D. Mixon, Chair, is a citrus grower and past Chair of the board of the Florida Fruit and Vegetable Association. He and his family owned and operated SunnyRidge Farms prior to being sold to Dole Food Company, he then served as President of Dole Berry Company. Mr. Mixon is a member of the District Advisory Committee. His principal occupation and employment for the past five years has been self-employed farmer.
Randy L. Larson, Vice-Chair, was appointed to the Board in December 2016 as the Association’s second Outside Director. He is a licensed professional engineer, a registered general contractor in Florida. His principal occupation and employment for the past five years has been with R Larson Company.
Daniel T. Aprile was elected to the Board in April 2019. Mr. Aprile is the Manager of Golden A Cattle Company, LLC and Aprile Farms, Inc. located in Tampa. Mr. Aprile is a former member of the Hillsborough County Independent Oversight Committee and on the Hillsborough County Agricultural Economic Development Council. He is also a past president of the Hillsborough County Farm Bureau. His principal occupation and employment for the past five years has been with Golden A Cattle Company, LLC and Aprile Farms, Inc.
Robert M. Behr was re-elected to the Board in June 2022. Dr. Behr is the former CEO of Citrus World, Inc. and having retired from that role at the end of 2022 still remains active in the organization. Dr. Behr is also a member of the CoBank board of directors. His principal occupation and employment for the past five years has been as the CEO of Citrus World, Inc. and its subsidiaries.
Jenny R. Black has served on the Board since 2014. Mrs. Black is a partner in multiple citrus growing operations and is a member of Peace River Packing, a citrus growing cooperative. Mrs. Black has more than 20 years experience in the Information Technology field and her primary employment since 2008 has been managing her own IT consulting practice.
Jenny Black Consulting, LLC serves clients in the transportation and agriculture industries. Mrs. Black was elected to the AgFirst Farm Credit Bank Board in August 2018 and is a director of the Farm Credit Council, a trade organization. Mrs. Black also serves on the Polk County 4-H Foundation Board, the Advisory Board for Volunteers in Service to the Elderly (VISTE), and the Board of Trustees at All Saints Academy.
C. Dennis Carlton, Jr. was elected to the Board in June 2022. Mr. Carton is a cattleman and partner in Carlton and Carlton Ranches and Audubon Ranch which are cow/calf operations throughout Central Florida. He is the owner/operator of D Carlton LLC, a real estate holding company and is active in real estate working under Mid-State Reality. He serves on Hillsborough County Farm Bureau as President, the Seffner Christian Academy Board and the Ag Economic Development Council. Mr. Carlton’s principal occupation and employment for the past five years has been with Carlton and Carlton Ranches and D Carlton LLC.
W. Rex Clonts, Jr, is a citrus and vegetable grower. He is also past President of Seminole County Farm Bureau 2013 - 2015, 2019-20. Mr. Clonts is also a Director Emeritus of the Florida Fruit and Vegetable Association. His principal occupation and employment for the past five years has been with Clonts Farms, Inc.
Reed C. Fischbach is a real estate broker specializing in sales, development and management of agricultural land. Mr. Fischbach serves on the Brandon Regional Hospital Board of Trustees. His principal occupation and employment for the past five years has been with Fischbach Land Company.
David A. Mereness was appointed to the Board in March 2016 as the Association’s Outside Director. Mr. Mereness is a partner in Dearolf & Mereness LLP, a member of the American Institute of Certified Public Accountants, the Florida Institute of Certificated Public Accounts, and on the board of the National Society of Accountants for Cooperatives. His principal occupation and employment for the past five years has been with Dearolf & Mereness LLP.
Timothy D. Schaal was elected to the board in June 2022. Mr. Schaal is CEO of Airtec Sprayers, Inc. a specialized manufacturer of agricultural spraying equipment. Mr. Schaal is a Certified Public Accountant and a member of the American and Florida Institutes of Certified Public Accountants. He is also the managing partner in a fresh citrus growing operation. Mr. Schaal serves as the Treasurer for the Boys and Girls Clubs of Polk County. His principal occupation since 2011 has been with Airtec Sprayers, Inc.
Randall E. Strode was elected to the Board in April 2016. Mr. Strode is the Founder and Vice President of AgriStarts, Inc. a cloning tissue culture operation in Apopka, FL. His principal occupation and employment since 1984 has been with AgriStarts, Inc.
Transactions with Senior Officers and Directors
The reporting entity’s policies on loans to and transactions with its officers and directors, to be disclosed in this section are incorporated herein by reference to Note 10, Related Party Transactions, of the Consolidated Financial Statements included in this Annual Report. There have been no transactions between
Farm Credit of Central Florida, ACA
22 2022 Annual Report
the Association and senior officers or directors which require reporting per FCA regulations.
Involvement in Certain Legal Proceedings
There were no matters which came to the attention of management or the board of directors regarding involvement of current directors or senior officers in specified legal proceedings which should be disclosed in this section. No directors or senior officers have been involved in any legal proceedings during the last five years which require reporting per FCA regulations.
Relationship with Independent Auditors
There were no changes in or material disagreements with our Independent Auditors on any matter of accounting principles or financial statement disclosure during this period.
Aggregate fees for services rendered by its Independent Auditor for the year ended December 31, 2022 were as follows:
Independent Auditor
PricewaterhouseCoopers LLP
Audit services
2022
$ 92,730
Total $ 92,730
PricewaterhouseCoopers audit fees were for the annual audit of and for rendering an opinion on the Association’s Consolidated Financial Statements.
Consolidated Financial Statements
The Consolidated Financial Statements, together with the report thereon of PricewaterhouseCoopers LLP dated March 9, 2023 and the report of management, which appear in this Annual Report, are incorporated herein by reference.
Copies of the Association’s Annual and unaudited Quarterly reports are available upon request free of charge by calling 1800-533-2773 or writing Anne M. Sullivan, Chief Financial Officer, Farm Credit of Central Florida, ACA, P.O. Box 8009, Lakeland, FL 33802 or accessing the web site, www.farmcreditcfl.com. The Association prepares an electronic version of the Annual Report which is available on the Association’s web site within 75 days after the end of the fiscal year and distributes the Annual Reports to shareholders within 90 days after the end of the fiscal year. The Association prepares an electronic version of the Quarterly report within 40 days after the end of each fiscal quarter, except that no report need be prepared for the fiscal quarter that coincides with the end of the fiscal year of the institution.
Borrower Information Regulations
Since 1972, Farm Credit Administration (FCA) regulations have required that borrower information be held in strict confidence by Farm Credit System (FCS) institutions, their directors, officers and employees. These regulations provide Farm Credit institutions clear guidelines for protecting their borrowers’ nonpublic personal information.
On November 10, 1999, the FCA Board adopted a policy that requires FCS institutions to formally inform new borrowers at loan closing of the FCA regulations on releasing borrower information and to address this information in the Annual
Report. The implementation of these measures ensures that new and existing borrowers are aware of the privacy protections afforded them through FCA regulations and Farm Credit System institution efforts.
Credit and Services to Young, Beginning, and Small Farmers and Ranchers and Producers or Harvesters of Aquatic Products
Information to be disclosed in this section is incorporated herein by reference to the similarly named section in the Management's Discussion and Analysis of Financial Condition and Results of Operations section included in this Annual Report to the shareholders.
Shareholder Investment
Shareholder investment in the Association could be materially affected by the financial condition and results of operations of AgFirst Farm Credit Bank (Bank or AgFirst). Copies of the Bank’s Annual and Quarterly reports are available upon request free of charge by calling 1-800-845-1745, ext. 2764, or writing Matthew Miller, AgFirst Farm Credit Bank, P. O. Box 1499, Columbia, SC 29202. Information concerning AgFirst Farm Credit Bank can also be obtained by going to AgFirst’s web site at www.agfirst.com The Bank prepares an electronic version of the Annual Report, which is available on the website, within 75 days after the end of the fiscal year. The Bank prepares an electronic version of the Quarterly report within 40 days after the end of each fiscal quarter, except that no report needs to be prepared for the fiscal quarter that coincides with the end of the fiscal year of the Bank.
Farm Credit of Central Florida, ACA
23 2022 Annual Report
Report of the Audit Committee
The Audit Committee of the Board of Directors (Committee) is comprised of the directors named below. None of the directors who serve on the Committee is an employee of Farm Credit of Central Florida, ACA and in the opinion of the Board of Directors, each is free of any relationship with the Association or management that would interfere with the director’s independent judgment on the Committee.
The Committee has adopted a written charter that has been approved by the Board of Directors. The Committee has reviewed and discussed the Association’s audited financial statements with management, which has primary responsibility for the financial statements.
PricewaterhouseCoopers LLP (PwC), the Association’s Independent Auditor for 2022, is responsible for expressing an opinion on the conformity of the Association’s audited financial statements with accounting principles generally accepted in the United States of America. The Committee has discussed with PwC the matters that are required to be discussed by Statement on Auditing Standards No. 114 (The Auditor's Communication With Those Charged With Governance). The Committee discussed with PwC its independence from Farm Credit of Central Florida, ACA. The Committee also reviewed the non-audit services provided by PwC and concluded that these services were not incompatible with maintaining PwC’s independence.

The Committee has also concluded that PwC’s provision of non-audit services, if any, to the Association is compatible with PwC’s independence.
Based on the considerations referred to above, the Committee recommended to the Board of Directors that the audited financial statements be included in the Association’s Annual Report for 2022. The foregoing report is provided by the following independent directors, who constitute the Committee:
David A. Mereness
Chair of the Audit Committee
Members of Audit Committee
Robert M. Behr, Vice Chair
W. Rex Clonts, Jr.
Reed C. Fischbach
Keith D. Mixon
Timothy D. Schaal
March 9, 2023
Farm Credit of Central Florida, ACA
24 2022 Annual Report
Report of Independent Auditors
To the Board of Directors and Management of Farm Credit of Central Florida, ACA Opinion
We have audited the accompanying consolidated financial statements of Farm Credit of Central Florida, ACA and its subsidiaries (the “Association”), which comprise the consolidated balance sheets as of December 31, 202 2, 202 1 and 2020, and the related conso lidated statements of comprehensive income, of changes in members' equity and of cash flows for the years then ended, including the related notes (collectively referred to as the “consolidated financial statements”).
In our opinion, the accompanying consol idated financial statements present fairly, in all material respects, the financial position of the Association as of December 31, 2022 , 202 1 and 2020, and the results of its operations and its cash flows for the years then ended in accordance with account ing principles generally accepted in the United States of America.
Basis for Opinion
We conducted our audit in accordance with auditing standards generally accepted in the United States of America (US GAAS). Our responsibilities under those standards are f urther described in the Auditors’ Responsibilities for the Audit of the Consolidated Financial Statements section of our report. We are required to be independent of the Association and to meet our other ethical responsibilities, in accordance with the relevant ethical requirements relating to our audit. We believe that the audit evidence we have obtained is sufficient and appropriate to provide a basis for our audit opinion.
Responsibilit ies of Management for the Consolidated Financial Statements
Management is responsible for the preparation and fair presentation of the consolidated financial statements in accordance with accounting principles generally accepted in the United States of America, and for the design, implementation, and maintenance of internal control relevant to the preparation and fair presentation of consolidated financial statements that are free from material misstatement, whether due to fraud or error.
In preparing the consolidated financial statements, management is required to evaluate whether there are conditions or events, considered in the aggregate, that raise substantial doubt about the Association’s ability to continue as a going concern for one year after the date the consolidated financial statements are available to be issued.
Auditors’ Responsibilit ies for the Audit of the Consolidated Financial Statements
Our objectives are to obtain reasonable assurance about whether the consolidated financial statements as a whole are free from material misstatement, whether due to fraud or error, and to issue an auditors’ report that includes our opinion . Reasonable assurance is a high level of assurance but is not absolute assurance and therefore is not a guarantee that an audit conducted in accordance with US GAAS will always detect a material misstatement when it exists. The risk of not detecting a material misstatement resulting from fraud is higher than for one resulting from error, as fraud may involve collusion, forger y, intentional omissions, misrepresentations, or the override of internal control. Misstatements are considered material if there is a substantial

PricewaterhouseCoopers LLP, 1075 Peachtree Street NE, Suite 2600, Atlanta, GA 30309 T: (678) 419 1000, F: (678 ) 419 1239, www.pwc.com/us
likelihood that, individually or in the aggregate, they would influence the judgment made by a reasonable use r based on the consolidated financial statements.
In performing an audit in accordance with US GAAS, we:
● Exercise professional judgment and maintain professional skepticism throughout the audit.

● Identify and assess the risks of material misstatement of t he consolidated financial statements, whether due to fraud or error, and design and perform audit procedures responsive to those risks. Such procedures include examining, on a test basis, evidence regarding the amounts and disclosures in the consolidated financial statements.
● Obtain an understanding of internal control relevant to the audit in order to design audit procedures that are appropriate in the circumstances, but not for the purpose of expressing an opinion on the effectiveness of the Association 's internal control. Accordingly, no such opinion is expressed.
● Evaluate the appropriateness of accounting policies used and the reasonableness of significant accounting estimates made by management, as well as evaluate the overall presentation of the consolidated financial statements.
● Conclude whether, in our judgment, there are conditions or events, considered in the aggregate, that raise substantial doubt about the Association ’s ability to continue as a going concern for a reasonable period of time.
We are required to communicate with those charged with governance regarding, among other matters, the planned scope and timing of the audit, significant audit findings, and certain internal control- related matters that we identified during the audit.
Other Information
Management is responsible for the other information included in the annual report. The other information comprises the information included in the 202 2 Annual Report, but does not include the consolidated financial statements and our auditors’ re port thereon. Our opinion on the consolidated financial statements does not cover the other information, and we do not express an opinion or any form of assurance thereon.
In connection with our audit of the consolidated financial statements, our responsib ility is to read the other information and consider whether a material inconsistency exists between the other information and the consolidated financial statements or the other information otherwise appears to be materially misstated. If, based on the work performed, we conclude that an uncorrected material misstatement of the other information exists, we are required to describe it in our report.
Atlanta, Georgia March 9, 202 3
Consolidated Balance Sheets
The accompanying notes are an integral part of these consolidated financial statements.
Farm Credit Of Central Florida, ACA
(dollars in thousands) 2022 December 31, 2021 2020 Assets Cash $ 11 $ 11 $ 12 Investments in debt securities: Held to maturity (fair value of $1,788, $2,720, and $3,924, respectively) 1,808 2,748 3,966 Loans Allowance for loan losses 825,785 (4,378) 757,407 (3,067) 658,098 (3,283) Net loans 821,407 754,340 654,815 Accrued interest receivable Equity investments in other Farm Credit institutions Premises and equipment, net Other property owned Accounts receivable Other assets 4,248 10,927 4,428 — 7,347 4,764 2,877 6,755 4,801 — 13,760 4,847 2,671 6,636 4,936 227 11,030 5,032 Total assets $ 854,940 $ 790,139 $ 689,325 Liabilities Notes payable to AgFirst Farm Credit Bank Accrued interest payable Patronage refunds payable Accounts payable Other liabilities $ 694,754 2,004 10,262 1,643 9,826 $ 635,922 1,117 11,761 1,469 12,562 $ 548,714 950 9,757 793 10,418 Total liabilities 718,489 662,831 570,632 Commitments and contingencies (Note 11) Members' Equity Capital stock and participation certificates Retained earnings Allocated Unallocated Accumulated other comprehensive income (loss) 1,212 17,827 116,802 610 1,149 19,103 107,687 (631) 1,008 20,380 98,129 (824) Total members' equity 136,451 127,308 118,693 Total liabilities and members' equity $ 854,940 $ 790,139 $ 689,325
27 2022 Annual Report
Consolidated Statements of Comprehensive Income
Farm Credit Of Central Florida, ACA
For the year ended December 31, (dollars in thousands) 2022 2021 2020 Interest Income Loans Investments $ 36,966 46 $ 28,104 58 $ 27,069 104 Total interest income 37,012 28,162 27,173 Interest Expense Notes payable to AgFirst Farm Credit Bank 17,462 11,806 11,841 Net interest income Provision for (reversal of) allowance for loan losses 19,550 1,258 16,356 (340) 15,332 214 Net interest income after provision for (reversal of) allowance for loan losses 18,292 16,696 15,118 Noninterest Income Loan fees Fees for financially related services Patronage refunds from other Farm Credit institutions Gains (losses) on sales of rural home loans, net Gains (losses) on sales of premises and equipment, net Gains (losses) on other transactions Insurance Fund refunds Other noninterest income 698 3,884 10,771 240 — (61) — 2 860 2,628 13,573 337 57 85 — 7 1,108 1,506 10,819 227 (69) 60 107 2 Total noninterest income 15,534 17,547 13,760 Noninterest Expense Salaries and employee benefits Occupancy and equipment Insurance Fund premiums Purchased services Data processing Other operating expenses (Gains) losses on other property owned, net 9,143 990 1,279 503 161 2,484 1 8,624 976 868 547 167 2,026 (158) 8,354 1,065 459 484 250 2,079 15 Total noninterest expense 14,561 13,050 12,706 Income before income taxes Provision for income taxes 19,265 — 21,193 35 16,172 75 Net income $ 19,265 $ 21,158 $ 16,097 Other comprehensive income net of tax Employee benefit plans adjustments 1,241 193 (160) Comprehensive income $ 20,506 $ 21,351 $ 15,937 The accompanying notes are an integral part of these consolidated financial statements. 28 2022 Annual Report
Consolidated Statements of Changes in Members’ Equity
Farm Credit Of Central Florida, ACA
Capital Accumulated Stock and Retained Earnings Other Total Participation Comprehensive Members' (dollars in thousands) Certificates Allocated Unallocated Income (Loss) Equity Balance at December 31, 2019 Comprehensive income Capital stock/participation certificates issued/(retired), net Patronage distribution Cash Retained earnings retired $ 942 66 $ 21,637 (1,257) $ 91,532 16,097 (9,500) $ (664) (160) $ 113,447 15,937 66 (9,500) (1,257) Balance at December 31, 2020 $ 1,008 $ 20,380 $ 98,129 $ (824) $ 118,693 Comprehensive income Capital stock/participation certificates issued/(retired), net Patronage distribution Cash Retained earnings retired 141 (1,277) 21,158 (11,600) 193 21,351 141 (11,600) (1,277) Balance at December 31, 2021 $ 1,149 $ 19,103 $ 107,687 $ (631) $ 127,308 Comprehensive income Capital stock/participation certificates issued/(retired), net Patronage distribution Cash Retained earnings retired 63 (1,276) 19,265 (10,150) 1,241 20,506 63 (10,150) (1,276) Balance at December 31, 2022 $ 1,212 $ 17,827 $ 116,802 $ 610 $ 136,451 The accompanying notes are an integral part of these consolidated financial statements. 29 2022 Annual Report
Consolidated Statements of Cash Flows
The accompanying notes are an integral part of these consolidated financial statements.
Farm Credit Of Central Florida, ACA
For the year ended December 31, (dollars in thousands) 2022 2021 2020 Cash flows from operating activities: Net income $ 19,265 $ 21,158 $ 16,097 Adjustments to reconcile net income to net cash provided by (used in) operating activities: Depreciation on premises and equipment 384 411 229 Amortization (accretion) of net deferred loan costs (fees) (201) (124) (80) Premium amortization (discount accretion) on investments in debt securities 53 57 74 Provision for (reversal of) allowance for loan losses 1,258 (340) 214 (Gains) losses on other property owned — (169) — (Gains) losses on sales of premises and equipment, net — (57) 69 (Gains) losses on sales of rural home loans, net (Gains) losses on other transactions (240) 61 (337) (85) (227) (60) Changes in operating assets and liabilities: Origination of loans held for sale Proceeds from sales of loans held for sale, net (9,865) 10,105 (13,407) 13,744 (12,495) 12,722 (Increase) decrease in accrued interest receivable (Increase) decrease in accounts receivable (1,371) 6,413 (206) (2,730) (277) (4,046) (Increase) decrease in other assets 83 185 (3,844) Increase (decrease) in accrued interest payable Increase (decrease) in accounts payable Increase (decrease) in other liabilities 887 174 (1,556) 167 676 2,422 (247) 140 5,593 Total adjustments 6,185 207 (2,235) Net cash provided by (used in) operating activities 25,450 21,365 13,862 Cash flows from investing activities: Proceeds from maturities of or principal payments received on investments in debt securities, held to maturity 887 1,161 1,222 Net (increase) decrease in loans (Increase) decrease in equity investments in other Farm Credit institutions Purchases of premises and equipment Proceeds from sales of premises and equipment (68,124) (4,172) (11) — (99,063) (119) (276) 57 (89,854) 41 (2,651) Proceeds from sales of other property owned — 398 Net cash provided by (used in) investing activities (71,420) (97,842) (91,242) Cash flows from financing activities: Advances on (repayment of) notes payable to AgFirst Farm Credit Bank, net 58,832 87,208 85,003 Capital stock and participation certificates issued/(retired), net Patronage refunds and dividends paid Retained earnings retired 63 (11,649) (1,276) 141 (9,596) (1,277) 66 (6,434) (1,257) Net cash provided by (used in) financing activities 45,970 76,476 77,378 Net increase (decrease) in cash — (1) (2) Cash, beginning of period 11 12 14 Cash, end of period $ 11 $ 11 $ 12 Supplemental schedule of non-cash activities: Receipt of property in settlement of loans $ — $ 2 $ 227 Estimated cash dividends or patronage distributions declared or payable 10,150 11,600 9,500 Employee benefit plans adjustments (Note 9) (1,241) (193) 160 Supplemental information: Interest paid $ 16,575 $ 11,639 $ 12,088 Taxes (refunded) paid, net 9 34 77
30 2022 Annual Report
Notes to the Consolidated Financial Statements
(dollars in thousands, except as noted)
Note 1 — Organization and Operations
A. Organization: Farm Credit of Central Florida, ACA (the Association or ACA) is a member-owned cooperative that provides credit and credit-related services to qualified borrowers in the counties of Brevard, Citrus, Hernando, Hillsborough, Lake, Orange, Osceola, Pasco, Pinellas, Polk, Seminole, Sumter, and Volusia in the state of Florida.
The Association is a lending institution in the Farm Credit System (System), a nationwide network of cooperatively owned banks and associations. It was established by Acts of Congress and is subject to the provisions of the Farm Credit Act of 1971, as amended (Farm Credit Act). The System specializes in providing financing and related services to qualified borrowers for agricultural and rural purposes.
The nation is served by three Farm Credit Banks (FCBs) and one Agricultural Credit Bank (ACB), (collectively, the System Banks) each of which has specific lending authorities within its chartered territory. The ACB also has additional specific nationwide lending authorities.
Each System Bank serves one or more Agricultural Credit Associations (ACAs) that originate long-term, short-term and intermediate-term loans, Production Credit Associations (PCAs) that originate and service short- and intermediate-term loans, and/or Federal Land Credit Associations (FLCAs) that originate and service long-term real estate mortgage loans. These associations borrow a majority of the funds for their lending activities from their related bank. System Banks are also responsible for supervising the activities of associations within their districts. AgFirst (Bank) and its related associations (Associations or District Associations) are collectively referred to as the AgFirst District. The District Associations jointly own substantially all of AgFirst’s voting stock. As of year-end, the District consisted of the Bank and eighteen District Associations. All eighteen were structured as ACA holding companies, with PCA and FLCA subsidiaries. FLCAs are tax-exempt while ACAs and PCAs are taxable.
The Farm Credit Administration (FCA) is delegated authority by Congress to regulate the System banks and associations. The FCA examines the activities of the associations and certain actions by the associations are subject to the prior approval of the FCA and the supervising bank.
The Farm Credit Act also established the Farm Credit System Insurance Corporation (Insurance Corporation) to administer the Farm Credit Insurance Fund (Insurance Fund). The Insurance Fund is required to be used (1) to ensure the timely payment of principal and interest on Systemwide debt obligations (Insured Debt), (2) to ensure the retirement of protected borrower capital at par or stated value, and (3) for other specified purposes. The Insurance
Fund is also available for discretionary uses by the Insurance Corporation to provide assistance to certain troubled System institutions and to cover the operating expenses of the Insurance Corporation. Each System bank has been required to pay premiums, which may be passed on to the Association, into the Insurance Fund, based on its average adjusted outstanding Insured Debt until the assets in the Insurance Fund reach the “secure base amount.” The secure base amount is defined in the Farm Credit Act as 2.0 percent of the aggregate insured obligations (adjusted to reflect the reduced risk on loans or investments guaranteed by federal or state governments) or such other percentage of the aggregate obligations as the Insurance Corporation at its sole discretion determines to be actuarially sound. When the amount in the Insurance Fund exceeds the secure base amount, the Insurance Corporation is required to reduce premiums and may return excess funds above the secure base amount to System institutions. However, it must still ensure that reduced premiums are sufficient to maintain the level of the Insurance Fund at the secure base amount.
B. Operations: The Farm Credit Act sets forth the types of authorized lending activity and financial services that can be offered by the Association, and the persons eligible to borrow.
The Associations borrow from the Bank and in turn may originate and service short- and intermediate-term loans to their members, as well as long-term real estate mortgage loans.
The Bank primarily lends to the District Associations in the form of a line of credit to fund the Associations’ earning assets. These lines of credit (or Direct Notes) are collateralized by a pledge of substantially all of each Association’s assets. The terms of the Direct Notes are governed by a General Financing Agreement (GFA) between the Bank and Association. Each advance is structured such that the principal cash flow, repricing characteristics, and underlying index (if any) of the advance match those of the assets being funded. By match-funding the Association loans, the Associations’ exposure to interest rate risk is minimized.
In addition to providing funding for earning assets, the Bank provides District Associations with banking and support services such as accounting, human resources, information systems, and marketing. The costs of these support services are included in the cost of the Direct Note, or in some cases billed directly to certain Associations that use a specific service.
The Association is authorized to provide, either directly or in participation with other lenders, credit, credit commitments, and related services to eligible borrowers. Eligible borrowers include farmers, ranchers, producers or harvesters of aquatic products, rural residents, and farmrelated businesses.
Farm Credit of Central Florida, ACA
31 2022 Annual Report
The Association may sell to any System borrowing member, on an optional basis, credit or term life insurance appropriate to protect the loan commitment in the event of death of the debtor(s). The sale of other insurance necessary to protect a member’s farm or aquatic unit is permitted, but limited to hail and multi-peril crop insurance, and insurance necessary to protect the facilities and equipment of aquatic borrowers.
Note 2 — Summary of Significant Accounting Policies
The accounting and reporting policies of the Association conform with accounting principles generally accepted in the United States of America (GAAP) and prevailing practices within the banking industry. The preparation of financial statements in conformity with GAAP requires management to make estimates and assumptions that affect the amounts reported in the Consolidated Financial Statements and accompanying notes. Significant estimates are discussed in these footnotes, as applicable. Actual results may differ from these estimates.
The accompanying consolidated financial statements include the accounts of the ACA, PCA and FLCA.
Certain amounts in the prior year financial statements have been reclassified to conform to the current period presentation. Such reclassifications had no effect on net income or total members’ equity of prior years.
A. Cash: Cash represents cash on hand and on deposit at banks. At the most recent year-end, the Association held no cash in excess of insured amounts.
B. Loans and Allowance for Loan Losses: The Association is authorized to make long-term real estate loans with maturities of 5 to 40 years and certain short- and intermediate-term loans for agricultural production or operating purposes with maturities of not more than 10 years.
Loans are carried at their principal amount outstanding adjusted for charge-offs, premiums, discounts, deferred loan fees or costs, and hedging valuation adjustments, if any. Interest on loans is accrued and credited to interest income based upon the daily principal amount outstanding. The difference in the total investment in a loan and its principal amount may be deferred as part of the carrying amount of the loan and the net difference amortized over the life of the related loan as an adjustment to interest income using the effective interest method.
Impaired loans are loans for which it is probable that all principal and interest will not be collected according to the contractual terms of the loan and are generally considered substandard or doubtful, which is in accordance with the loan rating model, as described below. Impaired loans include nonaccrual loans, restructured loans, and loans past due 90 days or more and still accruing interest. A loan is considered contractually past due when any principal repayment or interest payment required by the loan instrument is not received on or before the due date. A loan remains contractually past due until the entire amount past due, including principal, accrued interest, and penalty interest incurred as the result of past due status, is collected
or otherwise discharged in full. A formal restructuring may also cure a past due status.
Loans are generally classified as nonaccrual when principal or interest is delinquent for 90 days (unless adequately collateralized and in the process of collection) or circumstances indicate that collection of principal and/or interest is in doubt. When a loan is placed in nonaccrual status, accrued interest deemed uncollectible is reversed (if accrued in the current year) or charged against the allowance for loan losses (if accrued in the prior year).
When loans are in nonaccrual status, payments are applied against the recorded investment in the loan asset. If collection of the recorded investment in the loan is fully expected and the loan does not have a remaining unrecovered prior charge-off associated with it, the interest portion of payments received in cash may be recognized as interest income. Nonaccrual loans may be returned to accrual status when principal and interest are current, prior charge-offs have been recovered, the ability of the borrower to fulfill the contractual repayment terms is fully expected, and the loan is not classified “doubtful” or “loss.” Loans are charged off at the time they are determined to be uncollectible.
In cases where the Association makes certain monetary concessions to the borrower through modifications to the contractual terms of the loan, the loan is classified as a restructured loan. A restructured loan constitutes a troubled debt restructuring (TDR) if for economic or legal reasons related to the debtor’s financial difficulties the Association grants a concession to the debtor that it would not otherwise consider. If the borrower’s ability to meet the revised payment schedule is uncertain, the loan is classified as a nonaccrual loan.
The allowance for loan losses is maintained at a level considered adequate by management to provide for probable and estimable losses inherent in the loan portfolio as of the report date. The allowance for loan losses is increased through provisions for loan losses and loan recoveries and is decreased through loan charge-offs and allowance reversals. A review of individual loans in each respective portfolio is performed periodically to determine the appropriateness of risk ratings and to ensure loss exposure to the Association has been identified. The allowance for loan losses is a valuation account used to reasonably estimate loan losses as of the financial statement date. Determining the appropriate allowance for loan losses balance involves significant judgment about when a loss has been incurred and the amount of that loss.
The Association considers the following factors, among others, when determining the allowance for loan losses:
Changes in credit risk classifications
Changes in collateral values
Changes in risk concentrations
Changes in weather-related conditions
Changes in economic conditions
A specific allowance may be established for impaired loans under Financial Accounting Standards Board (FASB) guidance on accounting by creditors for impairment of a
Farm Credit of Central Florida, ACA
32 2022 Annual Report
loan. Impairment of these loans is measured based on the present value of expected future cash flows discounted at the loan’s effective interest rate or, as practically expedient, at the loan’s observable market price or fair value of the collateral if the loan is collateral dependent.
A general allowance may also be established under FASB guidance on accounting for contingencies, to reflect estimated probable credit losses inherent in the remainder of the loan portfolio which excludes impaired loans considered under the specific allowance discussed above. A general allowance can be evaluated on a pool basis for those loans with similar characteristics. The level of the general allowance may be based on management’s best estimate of the likelihood of default adjusted for other relevant factors reflecting the current environment.
The credit risk rating methodology is a key component of the Association’s allowance for loan losses evaluation, and is generally incorporated into the institution’s loan underwriting standards and internal lending limit. The Association uses a two-dimensional loan rating model based on internally generated combined system risk rating guidance that incorporates a 14-point risk rating scale to identify and track the probability of borrower default and a separate scale addressing loss given default over a period of time. Probability of default is the probability that a borrower will experience a default within 12 months from the date of the determination of the risk rating. A default is considered to have occurred if the lender believes the borrower will not be able to pay its obligation in full or the borrower is past due more than 90 days. The loss given default is management’s estimate as to the anticipated economic loss on a specific loan assuming default has occurred or is expected to occur within the next 12 months.
Each of the ratings carries a distinct percentage of default probability. The 14-point risk rating scale provides for granularity of the probability of default, especially in the acceptable ratings. There are nine acceptable categories that range from a borrower of the highest quality to a borrower of minimally acceptable quality. The probability of default between 1 and 9 is very narrow and would reflect almost no default to a minimal default percentage. The probability of default grows significantly as a loan moves from a 9 to 10 (other assets especially mentioned) and grows more significantly as a loan moves to a substandard viable level of 11. A substandard non-viable rating of 12 indicates that the probability of default is almost certain. Loans risk rated 13 or 14 are generally written off.
C. Loans Held for Sale: Loans are classified as held for sale when there is intent to sell the loans within a reasonable period of time. Loans intended for sale are carried at the lower of cost or fair value.
D. Other Property Owned (OPO): Other property owned, consisting of real estate, personal property, and other assets acquired through a collection action, is recorded upon acquisition at fair value less estimated selling costs. Any initial reduction in the carrying amount of a loan to the fair value of the collateral received is charged to the allowance for loan losses. Revised estimates to the fair value less cost to sell are reported as adjustments to the carrying amount of the asset, provided that such adjusted value is not in excess of the carrying amount at acquisition. Income, expenses,
and carrying value adjustments related to other property owned are included in Gains (Losses) on Other Property Owned, Net in the Consolidated Statements of Comprehensive Income.
E. Premises and Equipment: Land is carried at cost. Premises and equipment are carried at cost less accumulated depreciation. Depreciation is provided on the straight-line method over the estimated useful lives of the assets. Gains and losses on dispositions are reflected in current earnings. Maintenance and repairs are charged to expense and improvements are capitalized. Premises and equipment are evaluated for impairment whenever events or circumstances indicate that the carrying value of the asset may not be recoverable.
From time to time, assets classified as premises and equipment are transferred to held for sale for various reasons. These assets are carried in Other Assets at the lower of the recorded investment in the asset or fair value less estimated cost to sell based upon the property’s appraised value at the date of transfer. Any write-down of property held for sale is recorded as a loss in the period identified.
F. Investments: The Association may hold investments as described below.
Equity Investments in Other Farm Credit System Institutions
Investments in other Farm Credit System institutions are generally nonmarketable investments consisting of stock and participation certificates, allocated surplus, and reciprocal investments in other institutions regulated by the FCA. These investments are carried at cost and evaluated for impairment based on the ultimate recoverability of the par value rather than by recognizing temporary declines in value.
Investments in Debt Securities
The Association holds certain investment securities, as permitted under the FCA regulations. These investments are classified based on management’s intention on the date of purchase and are generally recorded in the Consolidated Balance Sheets as securities on the trade date.
Securities for which the Association has the intent and ability to hold to maturity are classified as held-to-maturity (HTM) and carried at amortized cost. Investment securities classified as available-for-sale (AFS) are carried at fair value with net unrealized gains and losses included as a component of Other Comprehensive Income (OCI). Purchase premiums and discounts are amortized or accreted ratably over the term of the respective security using the interest method. The amortization of premiums on certain purchased callable debt securities that have explicit, noncontingent call features and that are callable at fixed prices on preset dates are amortized to the earliest call date.
Other Equity Investments
Any equity securities with a readily determinable fair value are carried at fair value with unrealized gains and losses included in earnings. Equity securities without a readily determinable fair value are carried at cost less any impairment.
Farm Credit of Central Florida, ACA
33 2022 Annual Report
Other Investments
As discussed in Note 8, certain investments, consisting primarily of mutual funds, are held in trust and investment accounts and are reported at fair value. Holding period gains and losses are included within Noninterest Income on the Consolidated Statements of Comprehensive Income and the balance of these investments is included in Other Assets on the accompanying Consolidated Balance Sheets.
Impairment
The Association reviews all investments that are in a loss position in order to determine whether the unrealized loss, which is considered an impairment, is temporary or otherthan-temporary. As mentioned above, changes in the fair value of AFS investments are reflected in OCI, unless the investment is deemed to be other-than-temporarily impaired (OTTI). Impairment is considered to be otherthan-temporary if the present value of cash flows expected to be collected from the debt security is less than the amortized cost basis of the security (any such shortfall is referred to as a credit loss). If the Association intends to sell an impaired debt security or is more likely than not to be required to sell the security before recovery of its amortized cost basis less any current-period credit loss, the impairment is other-than-temporary and recognized currently in earnings in an amount equal to the entire difference between fair value and amortized cost. If a credit loss exists, but the Association does not intend to sell the impaired debt security and is not more likely than not to be required to sell before recovery, the impairment is otherthan-temporary and is separated into (i) the estimated amount relating to credit loss, and (ii) the amount relating to all other factors. Only the estimated credit loss amount is charged to current earnings, with the remainder of the loss amount recognized in OCI.
In subsequent periods, if the present value of cash flows expected to be collected is less than the amortized cost basis, the Association will record additional OTTI and adjust the yield of the security prospectively. The amount of total OTTI for an AFS security that previously was impaired is determined as the difference between its carrying amount prior to the determination of OTTI and its fair value.
Investment Income
Interest on investment securities, including amortization of premiums and accretion of discounts, is included in Interest Income. Realized gains and losses from the sales of investment securities are recognized in current earnings using the specific identification method.
Dividends from Investments in Other Farm Credit Institutions are generally recorded as patronage income and included in Noninterest Income.
G. Voluntary Advance Conditional Payments: The Association is authorized under the Farm Credit Act to accept advance payments from borrowers. To the extent the borrower’s access to such advance payments is restricted, the advanced conditional payments are netted against the borrower’s related loan balance. Amounts in excess of the related loan balance and amounts to which the borrower has unrestricted access are presented as liabilities in the accompanying Consolidated Balance Sheets.
Advanced conditional payments are not insured. Interest is generally paid by the Association on such accounts.
H. Employee Benefit Plans: The Association participates in District and multi-district sponsored benefit plans. These plans may include defined benefit final average pay retirement, defined benefit cash balance retirement, defined benefit other postretirement benefits, and defined contribution plans.
Defined Contribution Plans
Substantially all employees are eligible to participate in the defined contribution Farm Credit Benefit Alliance (FCBA) 401(k) Plan, subsequently referred to as the 401(k) Plan, which qualifies as a 401(k) plan as defined by the Internal Revenue Code. Employee deferrals are not to exceed the maximum deferral as determined and adjusted by the Internal Revenue Service. Company contributions to the 401(k) Plan are expensed as funded.
The Association also offers a FCBA supplemental 401(k) plan for certain key employees. This plan is nonqualified. Company contributions are expensed as funded.
Additional information may be found in Note 9.
Multiemployer Defined Benefit Plans
Substantially all employees hired before January 1, 2003 may participate in the AgFirst Farm Credit Retirement Plan (Plan), which is a defined benefit plan and considered multiemployer under FASB accounting guidance. The Plan is noncontributory and includes eligible Association and District employees. The “Projected Unit Credit” actuarial method is used for financial reporting purposes.
In addition to pension benefits, the Association provides certain health care and life insurance benefits for retired employees (other postretirement benefits) through a multidistrict sponsored retiree healthcare plan. Substantially all employees are eligible for those benefits when they reach early retirement age while working for the Association. Authoritative accounting guidance requires the accrual of the expected cost of providing these benefits to employees, their beneficiaries and covered dependents during the years the employees render service necessary to become eligible for benefits.
Since the foregoing plans are multiemployer, the Association does not apply the provisions of FASB guidance on employers’ accounting for defined benefit pension and other postretirement plans in its stand-alone financial statements. Rather, the effects of this guidance are reflected in the Annual Information Statement of the Farm Credit System.
Additional information may be found in Note 9 and in the Notes to the Annual Information Statement of the Farm Credit System.
Single Employer Defined Benefit Plan
The Association also sponsors a single employer defined benefit supplemental retirement plan for certain key employees. This plan is nonqualified; therefore, the associated liabilities are included in the Association’s Consolidated Balance Sheets in Other Liabilities.
Farm Credit of Central Florida, ACA
34 2022 Annual Report
The foregoing defined benefit plan is considered single employer, therefore the Association applies the provisions of FASB guidance on employers’ accounting for defined benefit pension and other postretirement plans in its standalone financial statements. See Note 9 for additional information.
I. Income Taxes: The Association evaluates tax positions taken in previous and current years according to FASB guidance. A tax position can result in a permanent reduction of income taxes payable, a deferral of income taxes otherwise currently payable to future years, or a change in the expected realizability of deferred tax assets. The term tax position also encompasses, but is not limited to, an entity’s status, including its status as a pass-through entity or tax-exempt entity.
The Association is generally subject to Federal and certain other income taxes. As previously described, the ACA holding company has two wholly-owned subsidiaries, a PCA and a FLCA. The FLCA subsidiary is exempt from federal and state income taxes as provided in the Farm Credit Act. The ACA holding company and the PCA subsidiary are subject to federal, state and certain other income taxes.
The Association is eligible to operate as a cooperative that qualifies for tax treatment under Subchapter T of the Internal Revenue Code. Accordingly, under specified conditions, the Association can exclude from taxable income amounts distributed as qualified patronage refunds in the form of cash, stock or allocated surplus. Provisions for income taxes are made only on those taxable earnings that will not be distributed as qualified patronage refunds. The Association distributes patronage on the basis of book income.
The Association accounts for income taxes under the asset and liability method, recognizing deferred tax assets and liabilities for the expected future tax consequences of the temporary differences between the carrying amounts and tax bases of assets and liabilities. Deferred tax assets and liabilities are measured using enacted tax rates expected to apply to taxable income in the years in which those temporary differences are expected to be realized or settled.
The Association records a valuation allowance at the balance sheet dates against that portion of the Association’s deferred tax assets that, based on management’s best estimates of future events and circumstances, more likely than not (a likelihood of more than 50 percent) will not be realized. The consideration of valuation allowances involves various estimates and assumptions as to future taxable earnings, including the effects of the expected patronage program, which reduces taxable earnings.
J. Due from AgFirst Farm Credit Bank: The Association records patronage refunds from the Bank and certain District Associations on an accrual basis.
K. Valuation Methodologies: FASB guidance defines fair value as the exchange price that would be received for an asset or paid to transfer a liability in an orderly transaction between market participants in the principal or most advantageous market for the asset or liability. This guidance also establishes a fair value hierarchy, which
requires an entity to maximize the use of observable inputs and minimize the use of unobservable inputs when measuring fair value. It prescribes three levels of inputs that may be used to measure fair value.
Level 1 inputs to the valuation methodology are unadjusted quoted prices for identical assets or liabilities in active markets.
Level 2 inputs to the valuation methodology include quoted prices for similar assets and liabilities in active markets; quoted prices in markets that are not active; and inputs that are observable, or can be corroborated, for substantially the full term of the asset or liability.
Level 3 inputs to the valuation methodology are unobservable and supported by little or no market activity. Valuation is determined using pricing models, discounted cash flow methodologies, or similar techniques, and could include significant management judgment or estimation. Level 3 assets and liabilities also could include instruments whose price has been adjusted based on dealer quoted pricing that is different than a third-party valuation or internal model pricing.
The Association may use the Bank, internal resources or third parties to obtain fair value prices. Quoted market prices are generally used when estimating fair values of any assets or liabilities for which observable, active markets exist.
A number of methodologies may be employed to value items for which an observable active market does not exist. Examples of these items include: impaired loans, other property owned, and certain derivatives, investment securities and other financial instruments. Inputs to these valuations can involve estimates and assumptions that require a substantial degree of judgment. Some of the assumptions used include, among others, discount rates, rates of return on assets, repayment rates, cash flows, default rates, costs of servicing, and liquidation values. The use of different assumptions could produce significantly different asset or liability values, which could have material positive or negative effects on results of operations.
Additional information may be found in Note 8.
L. Off-Balance-Sheet Credit Exposures: The credit risk associated with commitments to extend credit and letters of credit is essentially the same as that involved with extending loans to customers and is subject to normal credit policies. Collateral may be obtained based on management’s assessment of the customer’s creditworthiness.
Commitments to extend credit are agreements to lend to customers, generally having fixed expiration dates or other termination clauses that may require payment of a fee.
Letters of credit are commitments issued to guarantee the performance of a customer to a third party. These letters of credit are issued to facilitate commerce and typically result in the commitment being funded when the underlying transaction is consummated between the customer and third party.
Farm Credit of Central Florida, ACA
35 2022 Annual Report
M. Revenue Recognition: The Association generates income from multiple sources.
Financial Instruments
The largest source of revenue for the Association is interest income. Interest income is recognized on an accrual basis driven by nondiscretionary formulas based on written contracts, such as loan agreements or securities contracts. Credit-related fees, including letter of credit fees, finance charges and other fees are recognized in Noninterest Income when earned. Other types of noninterest revenues, such as service charges, professional services and broker fees, are accrued and recognized into income as services are provided and the amount of fees earned is reasonably determinable.
Contracts with Customers
The Association maintains contracts with customers to provide support services in various areas such as accounting, lending transactions, consulting, insurance, and information technology. As most of the contracts are to provide access to expertise or system capacity that the Association maintains, there are no material incremental costs to fulfill these contracts that should be capitalized. The Association also does not generally incur costs to obtain contracts. Revenue is recognized to reflect the transfer of goods and services to customers in an amount equal to the consideration the Association receives or expects to receive.
Gains and Losses from Nonfinancial Assets
Any gains or losses on sales of Premises and Equipment and OPO are included as part of Noninterest Income or Noninterest Expense. These gains and losses are recognized, and the nonfinancial asset is derecognized, when the Association has entered into a valid contract with a noncustomer and transferred control of the asset. If the criteria to meet the definition of a contract have not been met, the Association does not derecognize the nonfinancial asset and any consideration received is recognized as a liability. If the criteria for a contract are subsequently met, or if the consideration received is or becomes nonrefundable, a gain or loss may be recognized at that time.
N. Leases: A contract that conveys the right to control the use of an identified asset for a period of time in exchange for consideration is generally considered a lease.
Lessee
Contracts entered into are evaluated at inception to determine if they contain a lease. Assets and liabilities are recognized on the Consolidated Balance Sheets to reflect the rights and obligations created by any contracts that do. These contracts are then classified as either operating or finance leases.
In the course of normal operations, the Association may enter into leases for various business purposes. Generally, leases are for terms of three to five years and may include options to extend or terminate the arrangement. Any options are assessed individually to determine if it is reasonably certain they will be exercised.
Right-of-use (ROU) assets represent the right to use an underlying asset for the lease term, and lease liabilities
represent the obligation to make the payments arising from the lease. ROU assets and lease liabilities are initially recognized based on the present value of lease payments over the lease term. Lease expense for operating leases is recognized on a straight-line basis over the lease term. Lease expense for finance leases is recognized on a declining basis over the lease term.
ROU assets are included on the Consolidated Balance Sheets in Premises and Equipment for finance leases and Other Assets for operating leases. Lease liabilities are included in Other Liabilities on the Consolidated Balance Sheets. Leases with an initial term of 12 months or less are not recorded on the Consolidated Balance Sheets and lease expense is recognized over the lease term.
Lessor
The Association may act as lessor in certain contractual arrangements which relate to office space in an owned property and are considered operating leases. Generally, leases are for terms of three to five years and may include options to extend or terminate the arrangement.
Lease income is recognized on a straight-line basis over the lease term. Lease and nonlease components are accounted for separately in the Consolidated Statements of Comprehensive Income. Any initial direct costs are deferred and recognized as an expense over the lease term on the same basis as lease income. Any taxes assessed by a governmental authority are excluded from consideration as variable payments.
Lease receivables and income are included in Accounts Receivable on the Consolidated Balance Sheets and Other Noninterest Income in the Consolidated Statements of Comprehensive Income.
O. Accounting Standards Updates (ASUs): In June 2016, the FASB issued ASU 2016-13 Financial Instruments—Credit Losses (Topic 326): Measurement of Credit Losses on Financial Instruments. This Update, and subsequent clarifying guidance and amendments issued, is intended to improve financial reporting by requiring timelier recording of credit losses on financial instruments. It requires an organization to measure all expected credit losses for financial assets held at the reporting date through the life of the financial instrument. Financial institutions and other organizations will use forward-looking information to estimate their credit losses. Additionally, the ASU amends the accounting for credit losses on available-for-sale debt securities and purchased financial assets with credit deterioration. The ASU became effective on January 1, 2023. The Association adopted Topic 326 on January 1, 2023. The impact of adopting the new accounting standard was not material to the Association’s consolidated financial statements.
Note 3 — Loans and Allowance for Loan Losses
For a description of the Association’s accounting for loans, including impaired loans, and the allowance for loan losses, see Note 2 subsection B above.
Credit risk arises from the potential inability of an obligor to meet its repayment obligation which exists in outstanding
Farm Credit of Central Florida, ACA
36 2022 Annual Report
loans. The Association manages credit risk associated with lending activities through an assessment of the credit risk profile of an individual obligor. The Association sets its own underwriting standards and lending policies that provide direction to loan officers and are approved by the Board of Directors.
The credit risk management process begins with an analysis of the obligor’s credit history, repayment capacity and financial position. Repayment capacity focuses on the obligor’s ability to repay the obligation based on cash flows from operations or other sources of income, including non-farm income. Real estate mortgage loans must be secured by first liens on the real estate collateral. As required by FCA regulations, each institution that makes loans on a secured basis must have collateral evaluation policies and procedures.
The credit risk rating process for loans uses a two-dimensional structure, incorporating a 14-point probability of default scale (see further discussion in Note 2 subsection B above) and a separate scale addressing estimated percentage loss in the event of default. The loan rating structure incorporates borrower risk and transaction risk. Borrower risk is the risk of loss driven by factors intrinsic to the borrower. The transaction risk or facility risk is related to the structure of a credit (tenor, terms, and collateral).
The Association’s loan portfolio, which includes purchased interests in loans, has been segmented by the following loan types as defined by the FCA:
Real estate mortgage loans — loans made to full-time or part-time farmers secured by first lien real estate mortgages with maturities from five to thirty years. These loans may be made only in amounts up to 85 percent of the appraised value of the property taken as security or up to 97 percent of the appraised value if guaranteed by a federal, state, or other governmental agency. The actual percentage of loanto-appraised value when loans are made is generally lower than the statutory required percentage.
Production and intermediate-term loans — loans to fulltime or part-time farmers that are not real estate mortgage loans. These loans fund eligible financing needs including operating inputs (such as labor, feed, fertilizer, and repairs), livestock, living expenses, income taxes, machinery or equipment, farm buildings, and other business-related expenses. Production loans may be made on a secured or unsecured basis and are most often made for a period of
A summary of loans outstanding at period end follows:
time that matches the borrower’s normal production and marketing cycle, which is typically one year or less. Intermediate-term loans are made for a specific term, generally greater than one year and less than or equal to ten years.
Loans to cooperatives — loans for any cooperative purpose other than for communication, power, and water and waste disposal.
Processing and marketing loans — loans for operations to process or market the products produced by a farmer, rancher, or producer or harvester of aquatic products, or by a cooperative.
Farm-related business loans — loans to eligible borrowers that furnish certain farm-related business services to farmers or ranchers that are directly related to their agricultural production.
Rural residential real estate loans — loans made to individuals, who are not farmers, to purchase a singlefamily dwelling that will be the primary residence in open country, which may include a town or village that has a population of not more than 2,500 persons. In addition, the loan may be to remodel, improve, or repair a rural home, or to refinance existing debt. These loans are generally secured by a first lien on the property.
Communication loans — loans primarily to finance rural communication providers.
Power loans — loans primarily to finance electric generation, transmission and distribution systems serving rural areas.
Water and waste disposal loans — loans primarily to finance water and waste disposal systems serving rural areas.
International loans — primarily loans or credit enhancements to other banks to support the export of U.S. agricultural commodities or supplies. The federal government guarantees a substantial portion of these loans.
Lease receivables — the net investment for all finance leases such as direct financing leases, leveraged leases, and sales-type leases.
Other (including Mission Related) — additional investments in rural America approved by the FCA on a program or a case-by-case basis. Examples of such investments include partnerships with agricultural and rural community lenders, investments in rural economic development and infrastructure, and investments in obligations and mortgage securities that increase the availability of affordable housing in rural America.
Farm Credit of Central Florida, ACA
Real estate mortgage Production and intermediate-term Loans to cooperatives Processing and marketing Farm-related business Communication Power and water/waste disposal Rural residential real estate International Total loans $ $ 2022 491,531 174,627 8,574 86,916 31,173 8,661 1,443 16,420 6,440 825,785 December 31, 2021 $ 450,053 177,705 6,591 76,109 21,115 4,961 1,442 12,993 6,438 $ 757,407 $ $ 2020 389,241 148,613 8,865 74,678 6,241 14,446 –9,576 6,438 658,098 37 2022 Annual Report
A substantial portion of the Association’s lending activities is collateralized and the Association’s exposure to credit loss associated with lending activities is reduced accordingly.
The amount of collateral obtained, if deemed necessary upon extension of credit, is based on management’s credit evaluation of the borrower. Collateral held varies, but typically includes farmland and income-producing property, such as crops and livestock, as well as receivables. Long-term real estate loans are collateralized by the first liens on the underlying real property. Federal regulations state that long-term real estate loans are not to exceed 85 percent (97 percent if guaranteed by a government agency) of the property’s appraised value. However, a decline in a property’s market value subsequent to loan origination or advances, or other actions necessary to protect the financial interest of the Association in the collateral, may result in loan to value ratios in excess of the regulatory maximum
The Association may purchase or sell participation interests with other parties in order to diversify risk, manage loan volume, and comply with FCA regulations. The following tables present the principal balance of participation loans at periods ended:
Farm Credit of Central Florida, ACA
December 31, 2022 Within AgFirst District Within Farm Credit System Outside Farm Credit System Total Participations Purchased Participations Sold Participations Purchased Participations Sold Participations Purchased Participations Sold Participations Purchased Participations Sold Real estate mortgage $ 21,636 $ 82,545 $ 4,344 $ 21,702 $ – $ – $ 25,980 $ 104,247 Production and intermediate-term 34,722 70,753 5,762 5,123 – – 40,484 75,876 Loans to cooperatives 8,587 – – – – – 8,587 –Processing and marketing 52,023 61,367 2,889 34,072 – – 54,912 95,439 Farm-related business 685 5,537 371 – – – 1,056 5,537 Communication 8,687 – – – – – 8,687 –Power and water/waste disposal 1,446 – – – – – 1,446 –International 6,446 – – – – – 6,446 –Total $ 134,232 $ 220,202 $ 13,366 $ 60,897 $ – $ – $ 147,598 $ 281,099 December 31, 2021 Within AgFirst District Within Farm Credit System Outside Farm Credit System Total Participations Purchased Participations Sold Participations Purchased Participations Sold Participations Purchased Participations Sold Participations Purchased Participations Sold Real estate mortgage $ 24,579 $ 59,693 $ – $ 32,855 $ – $ – $ 24,579 $ 92,548 Production and intermediate-term 26,787 69,623 17,630 2,450 – – 44,417 72,073 Loans to cooperatives 6,613 – – – – – 6,613 –Processing and marketing 43,327 44,090 406 26,653 – – 43,733 70,743 Farm-related business 685 – 433 – – – 1,118 –Communication 4,995 – – – – – 4,995 –Power and water/waste disposal 1,446 – – – – – 1,446 –International 6,446 – – – – – 6,446 –Total $ 114,878 $ 173,406 $ 18,469 $ 61,958 $ – $ – $ 133,347 $ 235,364 December 31, 2020 Within AgFirst District Within Farm Credit System Outside Farm Credit System Total Participations Purchased Participations Sold Participations Purchased Participations Sold Participations Purchased Participations Sold Participations Purchased Participations Sold Real estate mortgage $ 30,183 $ 45,595 $ 4,000 $ 33,843 $ – $ – $ 34,183 $ 79,438 Production and intermediate-term 30,752 59,135 1,585 1,575 – – 32,337 60,710 Loans to cooperatives 8,890 – – – – – 8,890 –Processing and marketing 47,691 31,723 – 18,300 – – 47,691 50,023 Farm-related business 685 1,049 – – – – 685 1,049 Communication 14,483 – – – – – 14,483 –International 6,446 – – – – – 6,446 –Total $ 139,130 $ 137,502 $ 5,585 $ 53,718 $ – $ – $ 144,715 $ 191,220 38 2022 Annual Report
Farm Credit of Central Florida, ACA
The recorded investment in a receivable is the face amount increased or decreased by applicable accrued interest and unamortized premium, discount, finance charges, or acquisition costs and may also reflect a previous direct write-down of the investment.
The following table shows loans and related accrued interest classified under the FCA Uniform Loan Classification System as a percentage of total loans and related accrued interest receivable by loan type as of:
The following tables provide an aging analysis of past due loans and related accrued interest as of:
December 31, December 31, 2022 2021 2020 2022 2021 2020 Real estate mortgage: Acceptable 99.37% 99.75% 99.70% Communication: Acceptable 100.00% 100.00% 100.00% OAEM 0.54 0.08 0.15 OAEM – – –Substandard/doubtful/loss 0.09 0.17 0.15 Substandard/doubtful/loss – – –100.00% 100.00% 100.00% 100.00% 100.00% 100.00% Production and intermediate-term: Acceptable 92.97% 96.50% 95.12% Power and water/waste disposal: Acceptable 100.00% 100.00% –% OAEM 0.74 0.28 3.07 OAEM – – –Substandard/doubtful/loss 6.29 3.22 1.81 Substandard/doubtful/loss – – –100.00% 100.00% 100.00% 100.00% 100.00% –% Loans to cooperatives: Rural residential real estate: Acceptable 100.00% 100.00% 100.00% Acceptable 97.84% 98.19% 95.70% OAEM – – – OAEM 0.66 0.65 0.94 Substandard/doubtful/loss – – – Substandard/doubtful/loss 1.50 1.16 3.36 100.00% 100.00% 100.00% 100.00% 100.00% 100.00% Processing and marketing: International: Acceptable 100.00% 100.00% 100.00% Acceptable 100.00% 100.00% 100.00% OAEM – – – OAEM – – –Substandard/doubtful/loss – – – Substandard/doubtful/loss – – –100.00% 100.00% 100.00% 100.00% 100.00% 100.00% Farm-related business: Total loans: Acceptable 99.98% 100.00% 100.00% Acceptable 98.09% 99.00% 98.66% OAEM – – – OAEM 0.49 0.13 0.79 Substandard/doubtful/loss 0.02 – – Substandard/doubtful/loss 1.42 0.87 0.55 100.00% 100.00% 100.00% 100.00% 100.00% 100.00%
December 31, 2022 30 Through 89 Days Past Due 90 Days or More Past Due Total Past Due Not Past Due or Less Than 30 Days Past Due Total Loans Real estate mortgage $ 176 $ 1,778 $ 1,954 $ 492,439 $ 494,393 Production and intermediate-term 141 1,398 1,539 173,888 175,427 Loans to cooperatives – – – 8,595 8,595 Processing and marketing – – – 87,237 87,237 Farm-related business 8 – 8 31,269 31,277 Communication – – – 8,666 8,666 Power and water/waste disposal Rural residential real estate –326 –99 –425 1,451 16,060 1,451 16,485 International – – – 6,482 6,482 Total $ 651 $ 3,275 $ 3,926 $ 826,087 $ 830,013 December 31, 2021 30 Through 89 Days Past Due 90 Days or More Past Due Total Past Due Not Past Due or Less Than 30 Days Past Due Total Loans Real estate mortgage $ 360 $ 1,996 $ 2,356 $ 449,788 $ 452,144 Production and intermediate-term 189 1,504 1,693 176,500 178,193 Loans to cooperatives – – – 6,595 6,595 Processing and marketing – – – 76,263 76,263 Farm-related business – – – 21,176 21,176 Communication – – – 4,962 4,962 Power and water/waste disposal Rural residential real estate –168 –16 –184 1,442 12,858 1,442 13,042 International – – – 6,451 6,451 Total $ 717 $ 3,516 $ 4,233 $ 756,035 $ 760,268 39 2022 Annual Report
Nonperforming assets (including related accrued interest) and related credit quality statistics were as follows:
The following table presents information relating to impaired loans (including accrued interest) as defined in Note 2:
December 31, 2020 30 Through 89 Days Past Due 90 Days or More Past Due Total Past Due Not Past Due or Less Than 30 Days Past Due Total Loans Real estate mortgage $ – $ 504 $ 504 $ 390,769 $ 391,273 Production and intermediate-term 681 1,000 1,681 147,306 148,987 Loans to cooperatives – – – 8,869 8,869 Processing and marketing – – – 74,847 74,847 Farm-related business – – – 6,253 6,253 Communication – – – 14,447 14,447 Rural residential real estate 132 24 156 9,463 9,619 International – – – 6,451 6,451 Total $ 813 $ 1,528 $ 2,341 $ 658,405 $ 660,746
Farm Credit of Central Florida, ACA
December 31, 2022 2021 2020 Nonaccrual loans: Real estate mortgage $ 1,778 $ 2,510 $ 2,666 Production and intermediate-term 7,928 1,857 2,691 Farm-related business 8 – –Rural residential real estate 125 16 107 Total $ 9,839 $ 4,383 $ 5,464 Accruing restructured loans: Real estate mortgage $ 394 $ 708 $ 824 Production and intermediate-term 1,060 1,404 1,997 Rural residential real estate – 135 230 Total $ 1,454 $ 2,247 $ 3,051 Accruing loans 90 days or more past due: Total $ – $ – $ –Total nonperforming loans $ 11,293 $ 6,630 $ 8,515 Other property owned – – 227 Total nonperforming assets $ 11,293 $ 6,630 $ 8,742 Nonaccrual loans as a percentage of total loans 1.19% 0.58% 0.83% Nonperforming assets as a percentage of total loans and other property owned 1.37% 0.88% 1.33% Nonperforming assets as a percentage of capital 8.28% 5.21% 7.37%
December 31, 2022 2021 2020 Impaired nonaccrual loans: Current as to principal and interest $ 6,536 $ 678 $ 3,339 Past due 3,303 3,705 2,125 Total $ 9,839 $ 4,383 $ 5,464 Impaired accrual loans: Restructured $ 1,454 $ 2,247 $ 3,051 90 days or more past due – – –Total $ 1,454 $ 2,247 $ 3,051 Total impaired loans $ 11,293 $ 6,630 $ 8,515 Additional commitments to lend $ – $ – $ –40 2022 Annual Report
Farm Credit of Central Florida, ACA
The following tables present additional impaired loan information at period end. Unpaid principal balance represents the contractual principal balance of the loan.
616
December 31, 2022 Year Ended December 31, 2022 Unpaid Average Interest Income Recorded Principal Related Impaired Recognized on Impaired loans: Investment Balance Allowance Loans Impaired Loans With a related allowance for credit losses: Real estate mortgage $ 1,675 $ 1,920 $ 54 $ 932 $ 102 Production and intermediate-term 8,394 8,552 3,393 4,669 509 Farm-related business 8 8 10 4 –Rural residential real estate 83 83 23 46 5 Total $ 10,160 $ 10,563 $ 3,480 $ 5,651 $ With no related allowance for credit losses: Real estate mortgage $ 497 $ 495 $ – $ 276 $ 30 Production and intermediate-term 594 655 – 330 36 Farm-related business – – – – –Rural residential real estate 42 86 – 24 2 Total $ 1,133 $ 1,236 $ – $ 630 $ 68 Total impaired loans: Real estate mortgage $ 2,172 $ 2,415 $ 54 $ 1,208 $ 132 Production and intermediate-term 8,988 9,207 3,393 4,999 545 Farm-related business 8 8 10 4 –Rural residential real estate 125 169 23 70 7 Total $ 11,293 $ 11,799 $ 3,480 $ 6,281 $ 684 December 31, 2021 Year Ended December 31, 2021 Unpaid Average Interest Income Recorded Principal Related Impaired Recognized on Impaired loans: Investment Balance Allowance Loans Impaired Loans With a related allowance for credit losses: Real estate mortgage $ 1,590 $ 1,705 $ 53 $ 1,900 $ 136 Production and intermediate-term 2,938 2,513 930 3,511 251 Rural residential real estate 136 134 11 162 12 Total $ 4,664 $ 4,352 $ 994 $ 5,573 $ 399 With no related allowance for credit losses: Real estate mortgage $ 1,628 $ 1,858 $ – $ 1,946 $ 139 Production and intermediate-term 323 942 – 385 28 Rural residential real estate 15 58 – 18 1 Total $ 1,966 $ 2,858 $ – $ 2,349 $ 168 Total impaired loans: Real estate mortgage $ 3,218 $ 3,563 $ 53 $ 3,846 $ 275 Production and intermediate-term 3,261 3,455 930 3,896 279 Rural residential real estate 151 192 11 180 13 Total $ 6,630 $ 7,210 $ 994 $ 7,922 $ 567 December 31, 2020 Year Ended December 31, 2020 Unpaid Average Interest Income Recorded Principal Related Impaired Recognized on Impaired loans: Investment Balance Allowance Loans Impaired Loans With a related allowance for credit losses: Real estate mortgage $ 2,520 $ 2,721 $ 71 $ 3,644 $ 216 Production and intermediate-term 3,941 3,457 1,035 5,700 338 Rural residential real estate 230 229 – 332 20 Total $ 6,691 $ 6,407 $ 1,106 $ 9,676 $ 574 With no related allowance for credit losses: Real estate mortgage $ 970 $ 1,165 $ – $ 1,405 $ 84 Production and intermediate-term 747 1,490 – 1,079 64 Rural residential real estate 107 215 – 154 9 Total $ 1,824 $ 2,870 $ – $ 2,638 $ Total impaired loans: Real estate mortgage $ 3,490 $ 3,886 $ 71 $ 5,049 $ 300 Production and intermediate-term 4,688 4,947 1,035 6,779 402 Rural residential real estate 337 444 – 486 29 Total $ 8,515 $ 9,277 $ 1,106 $ 12,314 $ 41 2022 Annual Report 157 731
A summary of changes in the allowance for loan losses and period end recorded investment in loans is as follows:
* Includes the loan types: Loans to cooperatives, Processing and Marketing, and Farm-related business.
To mitigate risk of loan losses, the Association may enter into guarantee arrangements with certain GSEs, including the Federal Agricultural Mortgage Corporation (Farmer Mac), and state or federal agencies. These guarantees generally remain in place until the loans are paid in full or expire and give the Association the right to be reimbursed for losses incurred or to sell designated loans to the guarantor in the event of default (typically four months past due), subject to certain conditions. The guaranteed balance of designated loans under these agreements was $192,118, $129,596, and $113,974 at December 31, 2022, 2021, and 2020, respectively. Fees paid for such guarantee commitments totaled $503, $422, and $399 for 2022, 2021, and 2020, respectively. These amounts are classified as noninterest expense.
A restructuring of a debt constitutes a troubled debt restructuring (TDR) if the creditor for economic or legal reasons related to the debtor’s financial difficulties grants a concession to the debtor that it would not otherwise consider. There were no new TDRs that occurred during the periods presented.
Interest concessions may include interest forgiveness and interest deferment. Principal concessions may include principal forgiveness, principal deferment, and maturity extension. Other concessions may include additional compensation received which might be in the form of cash or other assets.
There were no TDRs that occurred during the previous twelve months and for which there was a subsequent payment default during periods presented. Payment default is defined as a payment that was thirty days or more past due.
Farm Credit of Central Florida, ACA
Real Estate Mortgage Production and Intermediateterm Agribusiness* Communication Power and Water/Waste Disposal Rural Residential Real Estate International Total Activity related to the allowance for credit losses: Balance at December 31, 2021 $ 1,033 $ 1,750 Charge-offs – (7) Recoveries 20 37 $ 257 ––$ 6 ––$ 2 ––$ 17 (1) 4 $ 2 ––$ 3,067 (8) 61 Provision for loan losses Balance at December 31, 2022 (929) $ 124 2,162 $ 3,942 17 $ 274 $ 1 7 $ –2 7 $ 27 $ –2 $ 1,258 4,378 Balance at December 31, 2020 Charge-offs Recoveries $ 1,195 –36 $ 1,775 (7) 75 $ 258 ––$ 20 ––$ –––$ 33 –20 $ 2 ––$ 3,283 (7) 131 Provision for loan losses Balance at December 31, 2021 (198) $ 1,033 (93) $ 1,750 (1) $ 257 $ (14) 6 $ 2 2 (36) $ 17 $ –2 $ (340) 3,067 Balance at December 31, 2019 Charge-offs Recoveries $ 1,468 –6 $ 1,390 (5) –$ 107 ––$ 19 ––$ 17 ––$ 110 (62) 17 $ 2 ––$ 3,113 (67) 23 Provision for loan losses Balance at December 31, 2020 (279) $ 1,195 390 $ 1,775 151 $ 258 1 $ 20 $ (17) –(32) $ 33 $ –2 $ 214 3,283 Allowance on loans evaluated for impairment: Individually $ 54 Collectively 70 Balance at December 31, 2022 $ 124 $ 3,393 549 $ 3,942 $ 10 264 $ 274 $ $ –7 7 $ $ –2 2 $ 23 4 $ 27 $ $ –2 2 $ $ 3,480 898 4,378 Individually Collectively Balance at December 31, 2021 $ 53 980 $ 1,033 $ 930 820 $ 1,750 $ –257 $ 257 $ $ –6 6 $ $ –2 2 $ 11 6 $ 17 $ $ –2 2 $ $ 994 2,073 3,067 Individually Collectively Balance at December 31, 2020 $ 71 1,124 $ 1,195 $ 1,035 740 $ 1,775 $ –258 $ 258 $ –20 $ 20 $ $ –––$ $ –33 33 $ $ –2 2 $ $ 1,106 2,177 3,283 Recorded investment in loans evaluated for impairment: Individually $ 2,172 $ 8,988 Collectively 492,221 166,439 Balance at December 31, 2022 $ 494,393 $ 175,427 $ 8 127,101 $ 127,109 $ –8,666 $ 8,666 $ –1,451 $ 1,451 $ 125 16,360 $ 16,485 $ –6,482 $ 6,482 $ $ 11,293 818,720 830,013 Individually Collectively Balance at December 31, 2021 $ 3,219 448,925 $ 452,144 $ 3,261 174,932 $ 178,193 $ –104,034 $ 104,034 $ –4,962 $ 4,962 $ –1,442 $ 1,442 $ 151 12,891 $ 13,042 $ –6,451 $ 6,451 $ $ 6,631 753,637 760,268 Individually Collectively Balance at December 31, 2020 $ 3,490 387,783 $ 391,273 $ 4,744 144,243 $ 148,987 $ –89,969 $ 89,969 $ –14,447 $ 14,447 $ $ –––$ $ 337 9,282 9,619 $ –6,451 $ 6,451 $ $ 8,571 652,175 660,746
42 2022 Annual Report
The following table provides information at each period end on outstanding loans restructured in troubled debt restructurings. These loans are included as impaired loans in the impaired loan table.
Note 4 — Investments
Investments in Debt Securities
The Association’s investments consist primarily of assetbacked securities (ABSs). These ABSs are issued through the Small Business Administration and are guaranteed by the full faith and credit of the United States government. They are held for managing short-term surplus funds and reducing interest rate risk. These securities meet the applicable FCA regulatory guidelines related to government agency guaranteed investments.
A summary of the amortized cost and fair value of investment securities held-to-maturity follows:
An investment is considered impaired if its fair value is less than its cost. The following tables show the fair value and gross unrealized losses for investments that were in a continuous unrealized loss position aggregated by investment category at each reporting period. A continuous unrealized loss position for an investment is measured from the date the impairment was first identified.
A summary of the contractual maturity, amortized cost and estimated fair value of investment securities held-to-maturity follows:
A portion of these investments has contractual maturities in excess of ten years. However, expected maturities for these types of securities can differ from contractual maturities because borrowers may have the right to prepay obligations with or without prepayment penalties.
Losses
ABSs $ 359 $ – $ 2,456 $ (55)
The recording of an impairment loss is predicated on: (1) whether or not management intends to sell the security, (2) whether it is more likely than not that management would be required to sell the security before recovering its costs, and (3) whether management expects to recover the security’s entire amortized cost basis (even if there is no intention to sell). If the Association intends to sell the security or it is more likely than not that it would be required to sell the security, the impairment loss equals the full difference between amortized cost and fair value of the security. When the Association does not intend to sell securities in an unrealized loss position and it is not more likely than not that it would be required to sell the securities, other-than-temporary impairment (OTTI) loss is separated into credit loss and non-credit loss. Credit loss is defined as the shortfall of the present value of the cash flows expected to be collected in relation to the amortized cost basis.
The Association performs periodic credit reviews, including OTTI analyses, on its investment securities portfolio. The objective is to quantify future possible loss of principal or interest due on securities in the portfolio.
Farm Credit of Central Florida, ACA
Total TDRs Nonaccrual TDRs December 31, December 31, 2022 2021 2020 2022 2021 2020 Real estate mortgage Production and intermediate-term Rural residential real estate $ 394 1,149 83 $ 708 1,506 135 $ 824 2,109 229 $ –89 83 $ –102 –$ –112 (1) Total loans $ 1,626 $ 2,349 $ 3,162 $ 172 $ 102 $ 111 Additional commitments to lend $ – $ – $ –
December 31, 2022 Gross Gross Amortized Unrealized Unrealized Fair Cost Gains Losses Value Yield ABSs $ 1,808 $ 4 $ (24) $ 1,788 6.22% December 31, 2021 Gross Gross Amortized Unrealized Unrealized Fair Cost Gains Losses Value Yield ABSs $ 2,748 $ 7 $ (35) $ 2,720 3.09% December 31, 2020 Gross Gross Amortized Unrealized Unrealized Fair Cost Gains Losses Value Yield ABSs $ 3,966 $ 13 $ (55) $ 3,924 2.92%
December 31, 2022 Weighted Amortized Fair Average Cost Value Yield In one year orless $ 4 $ 4 5.38% After one year through five years 23 22 6.02 After five years through ten years 66 848 5.42 After ten years 1,715 914 6.26 Total $ 1,808 $ 1,788 6.22%
December 31, 2022 Less than 12 Months 12 Months or Greater Fair Unrealized Fair Unrealized Value Losses Value Losses ABSs $ 298 $ (1) $ 930 $ (23) December 31, 2021 Less than 12 Months 12 Months or Greater Fair Unrealized Fair Unrealized Value Losses Value Losses ABSs $ 2 $ – $ 1,578 $ (35) December 31, 2020 Less than 12 Months 12 Months or Greater Fair Unrealized Fair Unrealized Value Losses Value
43 2022 Annual Report
The Association has not recognized any credit losses as any impairments were deemed temporary and resulted from noncredit related factors. The Association has the ability and intent to hold these temporarily impaired investments until a recovery of unrealized losses occurs, which may be at maturity, and at this time expects to collect the full principal amount and interest due on these securities, especially after considering credit enhancements.
Substantially all of these investments were in U.S. government agency securities and the Association expects these securities would not be settled at a price less than their amortized cost. All securities continue to perform at period end.
Equity Investments in Other Farm Credit Institutions
Equity investments in other Farm Credit System institutions are generally nonmarketable investments consisting of stock and participation certificates, allocated surplus, and reciprocal investments in other institutions regulated by the FCA. These investments are carried at cost and evaluated for impairment based on the ultimate recoverability of the par value rather than by recognizing temporary declines in value.
The Association is required to maintain ownership in the Bank in the form of Class B or Class C stock as determined by the Bank. The Bank may require additional capital contributions to maintain its capital requirements. The Association’s investment in the Bank totaled $10,005 for 2022, $5,983 for 2021 and $5,983 for 2020. The Association owned 2.62 percent of the issued stock and allocated retained earnings of the Bank as of December 31, 2022 net of any reciprocal investment. As of that date, the Bank’s assets totaled $42.1 billion and shareholders’ equity totaled $1.5 billion. The Bank’s earnings were $412 million for 2022. In addition, the Association had investments of $922 related to other Farm Credit institutions at December 31, 2022.
Note 5 — Premises and Equipment
Premises and equipment consists of the following:
funds based on specified factors or formulas relating primarily to credit quality and financial condition. At December 31, 2022, the Association’s notes payable were within the specified limitations.
The Association’s indebtedness to the Bank represents borrowings by the Association to fund its earning assets. This indebtedness is collateralized by a pledge of substantially all of the Association’s assets and the terms of the revolving lines of credit are governed by the GFA. Interest rates on both variable and fixed rate advances are generally established loan-by-loan based on the Bank’s marginal cost of funds, capital position, operating costs and return objectives. In the event of prepayment of any portion of a fixed rate advance, the Association may incur a prepayment penalty in accordance with the terms of the GFA and which will be included in interest expense. The interest rate is periodically adjusted by the Bank based upon agreement between the Bank and the Association.
The weighted average interest rates on the variable rate advances were 5.06 percent for LIBOR-based loans, 5.04 percent for Secured Overnight Financing Rate (SOFR)-based loans, and 5.24 percent for Prime-based loans, and the weighted average remaining maturities were 3.7 years, 5.1 years, and 4.7 years, respectively, at December 31, 2022. The weighted average interest rate on the fixed rate and adjustable rate mortgage (ARM) loans which are match funded by the Bank was 2.82 percent, and the weighted average remaining maturity was 13.6 years at December 31, 2022. The weighted average interest rate on all interest-bearing notes payable was 3.48 percent and the weighted average remaining maturity was 11.0 years at December 31, 2022. Variable rate and fixed rate notes payable represent approximately 14.62 percent and 85.38 percent, respectively, of total notes payable at December 31, 2022. The weighted average maturities described above are related to matched-funded loans. The Direct Note itself has an annual maturity as prescribed in the GFA.
Note 7 — Members’ Equity
A description of the Association’s capitalization requirements, protection mechanisms, regulatory capitalization requirements and restrictions, and equities are provided below:
Note 6 — Debt
Notes Payable to AgFirst Farm Credit Bank
Under the Farm Credit Act, the Association is obligated to borrow only from the Bank, unless the Bank approves borrowing from other funding sources. The borrowing relationship is established with the Bank through a General Financing Agreement (GFA). The GFA utilizes the Association’s credit and fiscal performance as criteria for establishing a line of credit on which the Association may draw funds. The GFA has a one year term which expires on December 31 and is renewable each year. The Association has no reason to believe the GFA will not be renewed upon expiration. The Bank, consistent with FCA regulations, has established limitations on the Association’s ability to borrow
A. Protected Borrower Equity: Protection of certain borrower equity is provided under the Farm Credit Act which requires the Association, when retiring protected borrower equity, to retire such equity at par or stated value regardless of its book value. Protected borrower equity includes capital stock, participation certificates and allocated equities which were outstanding as of January 6, 1988, or were issued or allocated prior to October 6, 1988. If an Association is unable to retire protected borrower equity at par value or stated value, amounts required to retire this equity would be obtained from the Insurance Fund.
B. Capital Stock and Participation Certificates: In accordance with the Farm Credit Act and the Association’s capitalization bylaws, each borrower is required to invest in Class C stock for agricultural loans, or participation certificates in the case of rural home and farm-related business loans, as a condition of borrowing. The initial borrower investment, through either purchase or transfer, must be in an amount equal to the lesser of $1 thousand or
Farm Credit of Central Florida, ACA
December 31, 2022 2021 2020 Land $ 658 $ 658 $ 658 Buildings and improvements 3,956 3,945 3,767 Furniture and equipment 1,647 1,647 1,760 6,261 6,250 6,185 Less: accumulated depreciation 1,833 1,449 1,249 Total $ 4,428 $ 4,801 $ 4,936
44 2022 Annual Report
two percent of the amount of the loan. The Board of Directors may increase the amount of investment if necessary to meet the Association’s capital needs. Loans designated for sale or sold into the Secondary Market on or after April 16, 1996 will have no voting stock or participation certificate purchase requirement if sold within 180 days following the date of designation.
The borrower acquires ownership of the capital stock or participation certificates at the time the loan is made, but usually does not make a cash investment. The aggregate par value is generally added to the principal amount of the related loan obligation. The Association retains a first lien on the stock or participation certificates owned by borrowers. Retirement of such equities will generally be at the lower of par or book value, and repayment of a loan does not automatically result in retirement of the corresponding stock or participation certificates.
C. Regulatory Capitalization Requirements and Restrictions: An FCA regulation empowers it to direct a transfer of funds or equities by one or more System institutions to another System institution under specified circumstances. The Association has not been called upon to initiate any transfers and is not aware of any proposed action under this regulation.
There are currently no prohibitions in place that would prevent the Association from retiring stock, distributing earnings, or paying dividends per the statutory and regulatory restrictions, and the Association has no reason to believe any such restrictions may apply in the future.
The capital regulations ensure that the System’s capital requirements are comparable to the Basel III framework and the standardized approach that the federal banking regulatory agencies have adopted. Regulatory ratios include common equity tier 1 (CET1) capital, tier 1 capital, and total capital risk-based ratios. The regulations also include a tier 1 leverage ratio which includes an unallocated retained earnings (URE) and URE equivalents (UREE) component. The permanent capital ratio (PCR) remains in effect.
The following sets forth the regulatory capital ratios:
The ratios are calculated using three-month average daily balances, in accordance with FCA regulations, as follows:
The CET1 capital ratio is the sum of statutory minimum purchased borrower stock, other required borrower stock held for a minimum of 7 years, allocated equities held for a minimum of 7 years or not subject to revolvement, unallocated retained earnings, and paid-in capital, less certain regulatory required deductions including the amount of investments in other System institutions, divided by average risk-adjusted assets.
The tier 1 capital ratio is CET1 capital plus noncumulative perpetual preferred stock, divided by average risk-adjusted assets.
The total capital ratio is tier 1 capital plus other required borrower stock held for a minimum of 5 years, subordinated debt and limited-life preferred stock greater than 5 years to maturity at issuance subject to certain limitations, and allowance for loan losses and reserve for unfunded commitments under certain limitations less certain investments in other System institutions under the corresponding deduction approach, divided by average risk-adjusted assets.
The permanent capital ratio is all at-risk borrower stock, any allocated excess stock, unallocated retained earnings, paid-in capital, subordinated debt and preferred stock subject to certain limitations, less certain investments in other System institutions, divided by PCR risk-adjusted assets.
The tier 1 leverage ratio is tier 1 capital, divided by average total assets less regulatory deductions to tier 1 capital.
The URE and UREE component of the tier 1 leverage ratio is unallocated retained earnings, paid-in capital, and allocated surplus not subject to revolvement less certain regulatory required deductions including the amount of allocated investments in other System institutions divided by average total assets less regulatory deductions to tier 1 capital.
* The Tier 1 Leverage Ratio must include a minimum of 1.50% of URE and URE Equivalents.
If the capital ratios fall below the minimum regulatory requirements, including the buffer amounts, capital distributions (equity redemptions, dividends, and patronage) and discretionary senior executive bonuses are restricted or prohibited without prior FCA approval.
D. Description of Equities: The Association is authorized to issue or have outstanding Classes A and D Preferred Stock, Classes A, B and C Common Stock, Classes B and C Participation Certificates and such other classes of equity as may be provided for in amendments to the bylaws in such amounts as may be necessary to conduct the Association’s business. All stock and participation
Farm Credit of Central Florida, ACA
Ratio Minimum Requirement Capital Conservation Buffer Minimum Requirement including Capital Conservation Buffer 2022 Capital Ratios as of December 31, 2021 2020 Risk-adjusted ratios: CET1 Capital 4.5% 2.5% 7.0% 17.82% 16.74% 17.87% Tier 1 Capital 6.0% 2.5% 8.5% 17.82% 16.74% 17.87% Total Capital 8.0% 2.5% 10.5% 18.26% 17.17% 18.40% Permanent Capital 7.0% 0.0% 7.0% 17.80% 16.81% 17.97% Non-risk-adjusted
Tier 1 Leverage* 4.0% 1.0% 5.0% 15.88% 16.32% 17.41% URE and UREE Leverage 1.5% 0.0% 1.5% 13.71% 14.34% 15.00%
ratios:
45 2022 Annual Report
certificates have a par or face value of five dollars ($5.00) per share.
The Association had the following shares outstanding at December 31, 2022:
Dividends
The Association may declare noncumulative dividends on its capital stock and participation certificates provided the dividend rate does not exceed 20 percent of the par value of the respective capital stock and participation certificates. Such dividends may be paid solely on Classes A and D Preferred Stock or on all classes of stock and participation certificates.
Protected common stock and participation certificates are retired at par or face value in the normal course of business. At-risk common stock and participation certificates are retired at the sole discretion of the Board at book value not to exceed par or face amounts, provided the minimum capital adequacy standards established by the Board are met.
Retained Earnings
The Association maintains an unallocated retained earnings account and an allocated retained earnings account. The minimum aggregate amount of these two accounts is determined by the Board. At the end of any fiscal year, if the retained earnings accounts otherwise would be less than the minimum amount determined by the Board as necessary to maintain adequate capital reserves to meet the commitments of the Association, the Association shall apply earnings for the year to the unallocated retained earnings account in such amounts as may be determined necessary by the Board. Unallocated retained earnings are maintained for each borrower to permit liquidation on a patronage basis.
The Association maintains an allocated retained earnings account consisting of earnings held and allocated to borrowers on a patronage basis. In the event of a net loss for any fiscal year, such allocated retained earnings account will be subject to full impairment in the order specified in the bylaws beginning with the most recent allocation.
The Association has a first lien and security interest on all retained earnings account allocations owned by any borrowers, and all distributions thereof, as additional collateral for their indebtedness to the Association. When the debt of a borrower is in default or is in the process of final liquidation by payment or otherwise, the Association, upon approval of the Board, may order any and all retained earnings account allocations owned by such borrower to be applied on the indebtedness.
Allocated equities shall be retired solely at the discretion of the Board, provided that minimum capital standards established by the FCA and the Board are met.
At December 31, 2022, allocated members’ equity consisted of $145 of qualified surplus, $15,530 of nonqualified allocated surplus and $2,152 of nonqualified retained surplus. Nonqualified distributions are tax deductible only when redeemed.
The rate of dividends paid on Class A Preferred Stock for any fiscal year may not be less than the rate of dividends paid on Classes A, B or C Common Stock or participation certificates for such year. The rate of dividends on Classes A, B and C Common Stock and participation certificates shall be at the same rate per share.
Dividends may not be declared if, after recording the liability, the Association would not meet its capital adequacy standards. No dividends were declared by the Association for any of the periods included in these Consolidated Financial Statements.
Patronage Distributions
Prior to the beginning of any fiscal year, the Board, by adoption of a resolution, may obligate the Association to distribute to borrowers on a patronage basis all or any portion of available net earnings for such fiscal year or for that and subsequent fiscal years. Patronage distributions are based on the proportion of the borrower’s interest to the amount of interest earned by the Association on its total loans unless another proportionate patronage basis is approved by the Board.
If the Association meets its capital adequacy standards after making the patronage distributions, the patronage distributions may be in cash, authorized stock of the Association, allocations of earnings retained in an allocated members’ equity account, or any one or more of such forms of distribution. Patronage distributions of the Association’s earnings may be paid on either a qualified or nonqualified basis, or a combination of both, as determined by the Board. A minimum of 20 percent of the total qualified patronage distribution to any borrower for any fiscal year shall always be paid in cash.
Transfer
Classes A and D Preferred, Classes A, B and C Common Stocks, and Classes B and C Participation Certificates may be transferred to persons or entities eligible to purchase or hold such equities.
Impairment
Any net losses recorded by the Association shall first be applied against unallocated members’ equity. To the extent that such losses would exceed unallocated members’ equity, such losses would be applied consistent with the Association’s bylaws and distributed pro rata to each share and/or unit outstanding in the class, in the following order:
a) First, Assistance Preferred Stock issued and outstanding (if any);
Farm Credit of Central Florida, ACA
Shares Outstanding Aggregate Class Protected Number Par Value C Common/Voting C Participation Certificates/Nonvoting Total Capital Stock and Participation Certificates No No 203,255 39,222 242,477 $ 1,016 196 $ 1,212
46 2022 Annual Report
b) Second, allocated surplus evidenced by nonqualified and Class C Participation Certificates, pro rata in written notices of allocation, in its entirety, with proportion to the number of shares or units of each such application to most recent allocation first and then in class of stock or participation certificate then issued and reverse order until all such allocated surplus has been outstanding, until an amount equal to the aggregate par exhausted; value or face amount of all such shares or units has been
c) Third, allocated surplus evidenced by qualified written distributed to such holders; notices of allocation, in its entirety, with application to
c) Third, to the holders of allocated surplus evidenced by most recent allocation first and then in reverse order qualified written notices of allocation, in the order of until all such allocated surplus has been exhausted; year of issuance and pro rata by year of issuance, until
d) Fourth, Class A Common and Class B Common Stock, the total amount of such allocated surplus has been Class C Common Stock, Class E Common Stock, Class distributed;
C Participation Certificates and Class B Participation
d) Fourth, to the holders of allocated surplus evidenced by Certificates issued and outstanding, pro rata until such nonqualified written notices of allocation, in the order of stock is fully impaired; year of issuance and pro rata by year of issuance, until
e) Fifth, Class A Preferred and Class D Preferred Stock the total amount of such allocated surplus has been issued and outstanding, if any. distributed;
e) Fifth, in so far as practicable, all unallocated surplus Liquidation issued after April 15, 1999, shall be distributed to Patrons of the Association from the period beginning In the event of liquidation or dissolution of the Association, April 15, 1999, through the date of liquidation, on a any assets of the Association remaining after payment or patronage basis; and retirement of all liabilities should be distributed to the
f) Sixth, any remaining assets of the Association after such holders of the outstanding stock and participation distributions shall be distributed ratably to the holders of certificates in the following order: all classes of stock and participation certificates in proportion to the number of shares or units of such class
a) First, to the holders of Class A Preferred and Class D of stock or participation certificates held by such holders. Preferred Stock until an amount equal to the aggregate par value of all shares of said stock then issued and All distributions to the holders of any class of stock outstanding has been distributed to such holders; and/or participation certificate holders shall be made pro
b) Second, to the holders of Class A Common Stock, Class rata in proportion to the number of shares or units of such B Common Stock, Class C Common Stock, Class E class of stock or participation certificates held by such Common Stock, and Class B Participation Certificates holders.
E. Accumulated Other Comprehensive Income (AOCI):
Farm Credit of Central Florida, ACA
Changes in Accumulated Other Comprehensive income by Component (a) For the Year Ended December 31, 2022 2021 2020 Employee Benefit Plans: Balance at beginning of period $ (631) $ (824) $ (664) Other comprehensive income before reclassifications 1,022 (20) (288) Amounts reclassified from AOCI 219 213 128 Net current period OCI 1,241 193 (160) Balance at end of period $ 610 $ (631) $ (824) Reclassifications Out of Accumulated Other Comprehensive Income (b) For the Year Ended December 31, 2022 2021 2020 Income Statement Line Item Defined Benefit Pension Plans: Periodic pension costs $ (219) $ (213) $ (128) See Note 9. Amounts reclassified $ (219) $ (213) $ (128) (a) Amounts in parentheses indicate debits to AOCI. (b) Amounts in parentheses indicate debits to profit/loss 47 2022 Annual Report
Note 8 — Fair Value Measurement
Fair value is defined as the exchange price that would be received for an asset or paid to transfer a liability in an orderly transaction between market participants in the principal or most advantageous market for the asset or liability. Accounting guidance also establishes a fair value hierarchy, with three levels of inputs that may be used to measure fair value. Refer to Note 2 for a more complete description of the three levels.
The following tables summarize assets measured at fair value at period end:
Valuation Techniques
Assets held in trust funds
Assets held in trust funds, related to deferred compensation plans, are classified as Level 1. The trust funds include investments in securities that are actively traded and have quoted net asset value prices that are directly observable in the marketplace.
Impaired loans
Fair values of impaired loans are estimated to be the carrying amount of the loan less specific reserves. Certain loans evaluated for impairment under FASB guidance have fair values based upon the underlying collateral, as the loans were collateral-dependent. Specific reserves were established for these loans when the value of the collateral, less estimated cost to sell, was less than the principal balance of the loan. The fair value measurement process uses independent appraisals and other market-based information, but in many cases it also requires significant input based on management's knowledge of and judgment about current market conditions, specific issues relating to the collateral and other matters.
Other property owned
For other property owned, the fair value is generally determined using formal appraisals of each individual property. These assets are held for sale. Costs to sell represent transaction costs and are not included as a component of the fair value of other property owned. If the process uses observable market-based information, the assets are classified as Level 2. If the process requires significant input based upon management’s knowledge of and judgment about current market conditions, specific issues relating to the property and other matters, the assets are classified as Level 3.
Note 9 — Employee Benefit Plans
The Association participates in three District sponsored qualified benefit plans. These plans include a multiemployer defined benefit pension plan, the AgFirst Farm Credit Retirement Plan, which is a final average pay plan (FAP Plan). In addition, the Association participates in a multiemployer defined benefit other postretirement benefits plan (OPEB Plan), the Farm Credit Benefits Alliance (FCBA) Retiree and Disabled Medical and Dental Plan, and the FCBA 401(k) Plan, a defined contribution 401(k) plan (401(k) Plan). The risks of participating in these multiemployer plans are different from single employer plans in the following aspects:
Farm Credit of Central Florida, ACA
December 31, 2022 Recurring assets Assets held in trust funds $ Fair Value Measurement Using Level 1 Level 2 945 $ – $ Level 3 – $ Total Fair Value 945 Nonrecurring assets Impaired loans Other property owned $ $ ––$ $ ––$ $ 6,680 –$ $ 6,680 –Recurring assets Assets held in trust funds $ December 31, 2021 Fair Value Measurement Using Level 1 Level 2 Level 3 816 $ – $ – $ Total Fair Value 816 Nonrecurring assets Impaired loans Other property owned $ $ ––$ $ ––$ $ 3,670 –$ $ 3,670 –Recurring assets Assets held in trust funds $ December 31, 2020 Fair Value Measurement Using Level 1 Level 2 Level 3 748 $ – $ – $ Total Fair Value 748 Nonrecurring assets Impaired loans Other property owned $ $ ––$ $ ––$ $ 5,585 227 $ $ 5,585 227
48 2022 Annual Report
1. Assets contributed to multiemployer plans by one employer may be used to provide benefits to employees of other participating employers.
2. If a participating employer stops contributing to the plan, the unfunded obligations of the plan may be borne by the remaining participating employers.
3. If the Association chooses to stop participating in some of its multiemployer plans, the Association may be required to contribute to eliminate the underfunded status of the plan.
The District’s multiemployer plans are not subject to ERISA and no Form 5500 is required. As such, the following information is neither available for nor applicable to the plans:
1. The Employer Identification Number (EIN) and threedigit Pension Plan Number.
2. The most recent Pension Protection Act (PPA) zone status. Among other factors, plans in the red zone are generally less than 65 percent funded, plans in the yellow zone are less than 80 percent funded, and plans in the green zone are at least 80 percent funded.
3. The "FIP/RP Status" indicating whether a financial improvement plan (FIP) or a rehabilitation plan (RP) is either pending or has been implemented.
4. The expiration date(s) of collective-bargaining agreement(s).
The FAP Plan covers employees hired prior to January 1, 2003 and includes other District employees that are not employees of the Association. It is accounted for as a multiemployer plan. The related net benefit plan obligations are not included in the Association’s Consolidated Balance Sheets but are included in the Combined Balance Sheets for the AgFirst District. FAP Plan expenses included in employee benefit costs on the Association’s Consolidated Statements of Comprehensive Income were $463 for 2022, $927 for 2021, and $692 for 2020. At December 31, 2022, 2021, and 2020, the total liability balance for the FAP Plan was $32,568, $39,135, and $114,449, respectively. The FAP Plan was 95.81 percent, 96.17 percent, and 89.63 percent funded to the projected benefit obligation as of December 31, 2022, 2021, and 2020, respectively.
In addition to providing pension benefits, the Association provides certain medical and dental benefits for eligible retired employees through the OPEB Plan. Substantially all of the Association employees may become eligible for the benefits if they reach early retirement age while working for the Association. Early retirement age is defined as a minimum of age 55 and 10 years of service. Employees hired after December 31, 2002, and employees who separate from service between age 50 and age 55, are required to pay the full cost of their retiree health insurance coverage. Employees who retire subsequent to December 1, 2007 are no longer provided retiree life insurance benefits. The OPEB Plan includes other Farm Credit System employees that are not employees of the Association or District and is accounted for as a multiemployer plan. The related net benefit plan obligations are not included in the Association’s Consolidated Balance Sheets but are included in the Combined Statement of Condition for the Farm Credit System. The OPEB Plan is unfunded with expenses paid as incurred. Postretirement benefits other than pensions included in employee benefit costs on the Association’s Consolidated Statements of Comprehensive Income were $241 for 2022, $199 for 2021, and $149 for 2020. The total AgFirst
District liability balance for the OPEB Plan presented in the Farm Credit System Combined Statement of Condition was $167,895, $209,599, and $219,990 at December 31, 2022, 2021, and 2020, respectively.
The Association also participates in the 401(k) Plan, which qualifies as a 401(k) plan as defined by the Internal Revenue Code. For employees hired on or prior to December 31, 2002, the Association contributes $0.50 for each $1.00 of the employee’s first 6.00 percent of contribution (based on total compensation) up to the maximum employer contribution of 3.00 percent of total compensation. For employees hired on or after January 1, 2003, the Association contributes $1.00 for each $1.00 of the employee’s first 6.00 percent of contribution up to the maximum employer contribution of 6.00 percent of total compensation. Employee deferrals are not to exceed the maximum deferral as determined and adjusted by the Internal Revenue Service. The 401(k) Plan costs are expensed as funded. Employer contributions to this plan included in salaries and employee benefit costs were $507, $459, and $450 for the years ended December 31, 2022, 2021, and 2020, respectively. Beginning in 2015, contributions include an additional 3.00 percent of eligible compensation for employees hired after December 31, 2002.
FASB guidance further requires the determination of the fair value of plan assets and recognition of actuarial gains and losses, prior service costs or credits, and transition assets or obligations as a component of AOCI. Under the guidance, these amounts are subsequently recognized as components of net periodic benefit costs over time. For 2022, 2021, and 2020, $1,241, $193, and $(160) has been recognized as a net credit, a net credit, and a net debit to AOCI to reflect these elements.
Additional information for the above may be found in the Notes to the Annual Information Statement of the Farm Credit System.
In addition to the multiemployer plans described above, the Association sponsors nonqualified supplemental retirement and 401(k) plans. The supplemental retirement plan is unfunded and had a projected benefit obligation of $1,002 and a net underfunded status of $1,002 at December 31, 2022. Assumptions used to determine the projected benefit obligation as of December 31, 2022 included a discount rate of 5.20 percent and a rate of compensation increase of 3.00 percent. The expenses of these nonqualified plans included in noninterest expenses were $328, $310, and $216 for 2022, 2021, and 2020, respectively.
Note 10 — Related Party Transactions
In the ordinary course of business, the Association enters into loan transactions with officers and directors of the Association, their immediate families and other organizations with which such persons may be associated. Such loans are subject to special approval requirements contained in the FCA regulations and are made on the same terms, including interest rates, amortization schedule, and collateral, as those prevailing at the time for comparable transactions with unaffiliated borrowers.
Total gross loans to such persons at December 31, 2022 amounted to $43,357. During 2022, $12,149 of new loans were made and repayments totaled $7,645. In the opinion of management, none of these loans outstanding at December 31, 2022 involved more than a normal risk of collectability.
Farm Credit of Central Florida, ACA
49 2022 Annual Report
Note 11 — Commitments and Contingencies
From time to time, legal actions are pending against the Association in which claims for money damages are asserted. On at least a quarterly basis, the Association assesses its liabilities and contingencies in connection with outstanding legal proceedings utilizing the latest information available. While the outcome of legal proceedings is inherently uncertain, on the basis of information presently available, management, after consultation with legal counsel, is of the opinion that the ultimate liability, if any, from these actions, would not be material in relation to the financial position of the Association. Because it is not probable that the Association will incur a loss or the loss is not estimable, no liability has been recorded for any claims that may be pending.
In the normal course of business, the Association may participate in financial instruments with off-balance-sheet risk to satisfy the financing needs of its borrowers. These financial instruments may include commitments to extend credit or letters of credit.
The instruments involve, to varying degrees, elements of credit risk in excess of the amount recognized in the financial statements. Commitments to extend credit are agreements to lend to a borrower as long as there is not a violation of any condition established in the contract. Commercial letters of credit are agreements to pay a beneficiary under conditions specified in the letter of credit. Commitments and letters of credit generally have fixed expiration dates or other termination clauses and may require payment of a fee.
Since many of these commitments are expected to expire without being drawn upon, the total commitments do not necessarily represent future cash requirements. However, these credit-related financial instruments have off-balance-sheet credit risk because their amounts are not reflected on the Consolidated Balance Sheets until funded or drawn upon. The credit risk associated with issuing commitments and letters of credit is substantially the same as that involved in extending loans to borrowers and management applies the same credit policies to these commitments. Upon fully funding a commitment, the credit risk amounts are equal to the contract amounts, assuming that borrowers fail completely to meet their obligations and the collateral or other security is of no value. The amount of collateral obtained, if deemed necessary upon extension of credit, is based on management’s credit evaluation of the borrower. At December 31, 2022, $122,624 of commitments to extend credit and $97 of commercial letters of credit were outstanding. There was no reserve for unfunded commitments included in the Consolidated Balance Sheets at December 31, 2022.
The Association also participates in standby letters of credit to satisfy the financing needs of its borrowers. These letters of credit are irrevocable agreements to guarantee payments of specified financial obligations. At December 31, 2022, standby letters of credit outstanding totaled $613 with expiration dates ranging from January 1, 2023 to August 19, 2027. The maximum potential amount of future payments that may be required under these guarantees was $613.
Note 12 — Income Taxes
At December 31, 2022, 2021 and 2020, the Association recorded $0, $35, and $75, respectively for provision or benefit for federal or state income taxes.
The provision (benefit) for income tax differs from the amount of income tax determined by applying the applicable U.S. statutory federal income tax rate to pretax income as follows:
Deferred tax assets and liabilities are comprised of the following at:
At December 31, 2022, deferred income taxes have not been provided by the Association on approximately $1.2 million of patronage refunds received from the Bank prior to January 1, 1993. Such refunds, distributed in the form of stock, are subject to tax only upon conversion to cash. The tax liability related to future conversions is not expected to be material.
The Association recorded a valuation allowance of $6,587, $6,334 and $6,386 as of December 31, 2022, 2021 and 2020, respectively. The Association will continue to evaluate the realizability of these deferred tax assets and adjust the valuation allowance accordingly.
At December 31, 2022 the Association has Federal loss carryforwards totaling approximately $21.9 million that expire in varying amounts beginning in 2026. Of this, $2 million of the net operating losses were generated post 2017 and can be carried forward indefinitely. The valuation allowance at December 31, 2022 was primarily related to federal loss carryforwards that, in the judgment of management, are more likely than not to expire before realized. In evaluating the Company’s ability to recover its deferred income tax assets, it considers all available evidence, both positive and negative, including operating results, ongoing tax planning and forecasts of future taxable income on a jurisdiction by jurisdiction basis.
There were no uncertain tax positions identified related to the current year and the Association has no unrecognized tax benefits at December 31, 2022 for which liabilities have been
Farm Credit of Central Florida, ACA
December 31, 2022 2021 2020 Federal tax at statutory rate $ 4,046 $ 4,450 $ 3,396 Effect of non-taxable FLCA subsidiary (2,128) (1,938) (1,379) Patronage distributions (2,131) (2,436) (1,995) Change in valuation allowance 212 (43) 50 Change in statutory rate – – –Other 1 2 3 Provision (benefit) for income taxes $ – $ 35 $ 75
December 31, 2022 2021 2020 Deferred income tax assets: Allowance for loan losses $ 1,019 $ 656 $ 674 Net operating loss – carryforward 5,540 5,637 5,687 Nonaccrual loan interest 84 93 76 Gross deferred tax assets 6,643 6,386 6,437 Less: valuation allowance (6,587) (6,334) (6,386) Gross deferred tax assets, net of valuation allowance 56 52 51 Deferred income tax liabilities: Loan origination fees (56) (52) (51) Gross deferred tax liability (56) (52) (51) Net deferred tax asset (liability) $ – $ – $ –
50 2022 Annual Report
established. The Association recognizes interest and penalties, if any, related to unrecognized tax benefits as a component of income tax expense.
The tax years that remain open for federal and major state income tax jurisdictions are 2019 and forward.
Note 13— Leases
Lessee
The Association leases certain assets, consisting primarily of real estate, transportation and office equipment, under standard industry terms. The contracts are assessed at inception to determine whether a contract is, or contains, a lease.
The components of lease costs were as follows:
Other information related to leases was as follows:
Lease term and discount rate for the periods ended were as follows:
Farm Credit of Central Florida, ACA
Year Ended December 31, 2022 2021 2020 Operating lease cost Variable lease cost (costs excluded from lease payments Sublease income $ 381 113 –$ 377 110 –$ 717 ––Lease costs $ 494 $ 487 $ 717
Operating cash flows from operating leases Right-of-use assets obtained in exchange for lease obligations: Operating leases $ $ Year Ended December 31, 2022 2021 409 $ 395 $ 38 $ 4 $ 2020 424 4,289
Cash paid for amounts included in the measurement of lease liabilities:
Weighted average remaining lease term in years: Operating leases Weighted average discount rate: Operating leases 2022 12.95 3.10% December 31, 2021 14.00 3.09% 2020 15.00 3.09% Maturities of lease liabilities as of period
2023 2024 2025 2026 2027 Thereafter Total lease payments Less: imputed interest Total lease liabilities Operating Leases December 31, 2022 $ 421 429 439 449 456 4,050 6,244 1,145 $ 5,099 51 2022 Annual Report
end were as follows:
Note 14 — Additional Financial Information
Quarterly Financial Information (Unaudited)
Note 15 — Subsequent Events
The Association determined that there were no subsequent events requiring disclosure through March 9, 2023, which was the date the financial statements were issued.
Farm Credit of Central Florida, ACA
2022 First Second Third Fourth Total Net interest income $ 4,372 $ 4,579 $ 4,847 $ 5,752 $ 19,550 Provision for (reversal of) allowance for loan losses Noninterest income (expense), net –(1,429) –(76) –(1,805) 1,258 4,283 1,258 973 Net income $ 2,943 $ 4,503 $ 3,042 $ 8,777 $ 19,265 2021 First Second Third Fourth Total Net interest income $ 3,866 $ 3,908 $ 4,064 $ 4,518 $ 16,356 Provision for (reversal of) allowance for loan losses (215) (160) 85 (50) (340) Noninterest income (expense), net (965) (115) (1,528) 7,070 4,462 Net income $ 3,116 $ 3,953 $ 2,451 $ 11,638 $ 21,158 2020 First Second Third Fourth Total Net interest income $ 3,805 $ 3,813 $ 3,849 $ 3,865 $ 15,332 Provision for (reversal of) allowance for loan losses – 124 90 – 214 Noninterest income (expense), net (1,398) (76) (1,825) 4,278 979 Net income $ 2,407 $ 3,613 $ 1,934 $ 8,143 $ 16,097
52 2022 Annual Report


PRSRT STD U.S. POSTAGE PAID 204 East Orange Street COLUMBIA SC Suite 200 PERMIT 1160 Lakeland,
33801
FL
10124
It isn’t the farm that makes the farmer, it’s the passion, hard work and persistence.
