/A FIDIC report
Has the world learnt anything in the past decade?
Corruption, its effects and the need to take action
State of the World
Foreword 2
Executive summary and recommendations 3

So, what does this mean? 5
Integrity and reducing corruption 6
The problem 7
Integrity and corruption and the UN Sustainable Development Goals 8
Corruption needs continued leadership to suppress it 9
Corruption is becoming more sophisticated 9
Corruption needs continued diligence to suppress it 9
Industry comment 12
Corruption and GDP per capita 14
Methodology for analysis 15
The outcome and conclusions 15
Industry comment 20
Corruption and industry (including construction), value-added per worker 22
Methodology for analysis 23
The outcome and conclusions 23
Industry comment 27
Corruption and FDI flows 29
Methodology for analysis 30
The outcome and conclusions 30
A simple model - considering and calculating the cost of corruption over time and the extent to which reducing corruption makes a difference depending on its ‘cost’ 34
The outcome and conclusions 34
Industry comment 35
The advantage of technological innovation in reducing corruption in architecture, engineering and construction industry ............................................................................................................... 35
Examples of MDB and IFI activities combatting corruption 38
Integrity is one of FIDIC’s core three principles 41
FIMS, FIDIC Code of Ethics and Model Code of Conduct for Consulting Firms 42
Maintaining integrity and reducing corruption 42
Appendix A - CPI and GDP per capita by year 44
CPI and GDP per capita by year (unrestricted) 45 CPI and GDP per capita by year (restricted intercept) 47
Appendix B - CPI and value-added by construction worker by year 49
CPI and value-added by construction worker by year (unrestricted) 50
CPI and value-added by construction worker by year (restricted intercept) 52
Appendix C – CPI and FDI flows by year (unrestricted) 54
Appendix D – GDP per capita and value-added loss between high and low corruption 57
Acknowledgments 62
About FIDIC 65
Recent FIDIC policy documents 66 Endnotes 68
/Contents
Foreword from the President and CEO
There is a growing need for countries to invest in both social and economic infrastructure at a sustainable level. As revealed by the first report in the relaunch of the FIDIC State of the World series in 2020, Time to $Tn-vest , the need for action on reducing the infrastructure gap to meet the sustainable development goals is a real issue and one that needs resolving now if we are to hit such targets. This gap is running at approximately $7 trillion a year.
Against the backdrop of the growing need for infrastructure investment and renewal, there are increasingly concerns that such investments are made in a sustainable way reducing GHG emissions, supporting biodiversity and limiting any impact on the environment.
Within this, the now historically high level of sovereign debt, the continued presence of corruption will continue to challenge our sector. This is an area where the wider consultancy, construction, finance, legal, institutions, member associations and FIDIC all have their role to play going forward.
Anthony Barry President, FIDIC

As with the previous reports in the State of the World series, this report continues with FIDIC’s determination and resolve to confront issues of significant importance to the sector and to the efficient and sustainable delivery of infrastructure. Corruption is most definitely one of these.
Corruption is and remains a global issue. The risks it poses to the sustainability and integrity of the companies and the sectors in which FIDIC members operate are real. The United Nations Convention Against Corruption (UNCAC) describes corruption as “…an insidious plague that has a wide range of corrosive effects on societies. It undermines democracy and the rule of law, leads to violations of human rights, distorts markets, erodes the quality of life and allows organised crime, terrorism and other threats to human security to flourish”. The UNCAC is ratified as the only legally binding universal anti-corruption instrument by 189ii of the 193 UN state parties, which means that any reference to the UNCAC is a reference to the resounding commitment that state parties have made to the content of the UNCAC.
Recognising and reporting corruption and corrupt conduct will facilitate its demise. It also brings with it the opportunity to reduce inefficiency and improve the value that is gained with money that is invested in good quality, sustainable infrastructure, helping to fill the significant funding gap that currently exists globally.
Dr Nelson Ogunshakin OBE Chief Executive Officer, FIDIC

The above action, however, is not enough. This report initiates a new phase of work to combat corruption following a change that was made to FIDIC’s statutes and by-laws. The change was made from promoting compliance with a code of ethics and integrity in business to combating and condemning bribery and corruption and promoting ethics, integrity and transparency in the industry.
To combat corruption, we need to continue to expose it and improving transparency and understanding is a key tool in this battle. This report explores not only the link between corruption and economic activity, but also activity at an industry level and even considers net foreign direct investment (FDI) flows. Consistent with its core value of integrity and corresponding long-standing commitment to integrity management via its publications and member associations, FIDIC is using this report to place in full view of the sector the effects of such behaviour and we will going forward adapt our tools, mechanisms and guidance to combat a persistent and an ever-evolving issue.
/2 /
/Executive summary and recommendations

As evidenced by international public law and the domestic laws made according to the public policy of nation states, corruption is not and should not be acceptable. This report outlines figures on its effects, considers new relationships between economic, industry and FDI flows and the perceptions of corruption. The report looks at data collected over the last decade across as many countries as possible and asks the question, how has the fight against corruption gone? Are we really combatting it?
The three metrics we consider against the Corruption Perceptions Index (CPI) are:
• GDP per capita, PPP (constant 2017 international $)
• Industry (including construction), value added per worker (constant 2015 US$)
• Foreign direct investment, net inflows (BoP, current US$)
A key aspect of the FIDIC value of integrity is transparency and the manner in which the data was analysed and presented is critical to the validity of the findings and recommendations in this report.
So, what do the results reveal?
1. Reducing corruption across the economy (GDP per capita) correlates with higher levels of GDP per capita.
2. Reducing corruption within the industry (based on the value added per worker) correlates with higher levels of economic activity.
3. Net FDI flows whilst having a positive correlation with corruption reduction the extent of the relationship was less than expected, but due to the scale of significant sums involved is thought likely to have a significant impact.
Looking at the change over the period using individual year plots it is shown that:
1. The relative cost of not reducing corruption over the past decade in GDP per capita is increasing but adjusting the model to represent a situation where 0 economic activity means there would be 0 corruption the pace of improvement slows significantly.
2. The relative cost of not reducing corruption over the past decade in industry value-added per worker is increasing but adjusting the model to represent a situation where 0 industry value-added means there would be 0 and corruption the pace of improvement again slows significantly.
3. The above suggests that the cost of not reducing corruption over time is currently greater a part of expectations and behaviour but may not be feeding through to reality by applying a few simple economic assumptions. As such, efforts to tackle corruption need to be increased significantly.
4. The relative cost of reducing corruption in FDI flows, whilst positive, appears to be linked more to economic cycles than providing a consistent trend of improvement.
/4
/
Executive summary and recommendations
So, what does this mean?
The report considers actions of various institutions including MDBs, IFIs, FIDIC and other industry participants and given their increasingly harder stances on reducing corruption, it does appear that the cost both across the wider economy and within the sector is increasing, thus putting pressure on those that undertake such practices.
The results do, however, also reveal that there is a long way to go. For example, if we consider a previous estimate of the cost of corruption - the UN using and commenting on WEF analysis – this suggests that there is a $2.6 trillion cost of corruption (5% of GDP).iii
This report relies on (rather than replaces) calculations by leading organisations regarding the current cost of corruption, although it does present a calculation which contends that the global community is not moving fast enough to mitigate and prevent corruption and to reduce and eliminate its related costs.
Using ILO data from the latest period on construction employmentiv and the industry cost (which includes construction per point improvement) calculated as part of the reports analysis across various countries, the difference in the cost of action of not reducing corruption by one point on the corruption perceptions index for each country is approximately $38bn
Consider then the latest CPI scores for 2021 and in a true drive to reduce corruption you raised all countries scores by ten, so no country was below 20 that is now worth $380bn in value-added lost in the industry (including construction) sector
So, the message is clear, the industry is moving in the right direction but nowhere near fast enough in light of the $7 trillion dollar-a-year challenge to achieve the SDGs and the net zero need.
Given the analysis in this report we make four key recommendations:
1Recommendation 1 – If the economic cost of not tackling corruption (or alternatively the benefit of combatting corruption) continues as outlined in this report, it will be important to monitor change and progress. As such, FIDIC will work with organisations such as Transparency International, MDBs etc through its Infrastructure Global platform to monitor and provide updates on the analysis this research has highlighted.
2Recommendation 2 – Given that corruption continues to evolve over time, FIDIC will ensure that its tools to help the sector reduce corruption continue to adapt. These tools will increasingly have to become more sophisticated to identify corruption in its many forms.
3Recommendation 3 – The importance of tackling corruption is recognised and communicated by FIDIC and its member organisations, yet, corrupt conduct still occurs and corruption still exists and FIDIC strongly urges its stakeholders to participate with FIDIC in the previous two recommendations so that each International Anti-Corruption Day can be used as a check-in point for those activities performed and successes and challenges experienced rather than an annual recognition that something needs to be done to identify, record, report, mitigate and prevent corrupt conduct and corruption.
Recommendation 4 – FIDIC will bring the topic of anti-corruption to the attention of global leaders. This may be done through its Global Leadership Forum. FIDIC will explore holding a dedicated annual Anti-Corruption Summit to bring key stakeholders together across the industry to discuss the latest developments and trends in the fight to combat corruption in the engineering, construction and infrastructure industry.
/5
/
Executive summary and recommendations
4
/Integrity and reducing corruption

Integrity and reducing corruption
The problem
The first problem that arises when talking about corruption is finding a suitable definition. The challenges faced by corruption analysts begin with how to define it. The problem lies in the fact that different people look at it from different points of views which results in different definitions. The most common international definitions are:
World Bank (WB): Corruption is “the abuse of public office for private gain”. This definition is very concise and does not directly point out the different forms of corruption and how it occurs.
United Nations Development Programme (UNDP): Corruption is “the misuse of public power, office or authority for private benefit through bribery, extortion, influence peddling, nepotism, fraud, speed money or embezzlement”.v
While the WB definition is considered concise, the UNPD definition is more comprehensive. The weakness in both definitions, however, is that they reduce corruption to the public sphere only.
Transparency International (TI): Corruption is “the abuse of entrusted power for private gain”. This definition overcomes this weakness in others by deleting the word ‘public’ associated with word ‘power’ which expands the meaning to include both public and private spheres.
The fact that the definition of TI builds on the WB definition makes it the most widely used. Most literature currently refers to these definitions when defining corruption because they are ‘short and clear’ and they include conclusively all aspects of corruption in both the public and private sectors.
To understand corruption and its causes and forms, it is important to understand the influencers and drivers within increasingly complex systems. These drivers are important to recognise, as various issues may or may not always be within the control or influence of all the parties throughout the lifecycle of a project.
To demonstrate this, consider the following categories and where the actual ability to influence, mitigate and minimise corruption exists.
Individuals – the primary influencers as actors in being the promoters or beneficiaries of corrupt conduct, being observers of corrupt conduct or being active in recording and reporting corrupt conduct.
Political – influencers include items such as institutional set-up, orientation of government, budget transparency, state or private capture and democracy/state levels.
Policy – influencers include corporate governance, transparency of procurement process, tax policies, anti-bribery and corruption policies, procurement approach, government regulation, conflict of interest regulation and strength of auditing and reporting standards.
Legal – influencers include property rights, intellectual property protection, efficiency of legal framework in challenging regulations, efficiency of legal framework in settling disputes, judicial independence, judicial stability and the prevalence of crime and legal sanctions.
Company – influencers include shareholder governance, staff training, company values, anti-bribery and corruption policies, compliance, auditing, whistle-blower policies, HR polices and risk assessment.
General public – influencers include public perceptions, freedom of the press, transparency, accessibility and accountability.
The following acts could be considered under the spectrum of corruption in different international instruments: Bribery, facilitation payment, abuse of power, conflict of interest, money laundering, nepotism, embezzlement, extortion, fraud and illicit enrichment.
One important feature that characterizes corruption is that it flourishes where a number of corrupt or potentially corrupt practices may coexist.
/7
/
Integrity and reducing corruption
FIDIC is of the view that a “growing awareness” of corruption will be an important driver to help to reduce it. Eliminating corruption, which by some estimates drains between $2tn and $5tn from the world’s economy each yearvi, would free up money which would go a long way towards closing the global infrastructure funding gap.vii
Integrity and corruption and the UN Sustainable Development Goals
Fighting to mitigate and prevent corruption and its importance should actively be owned and led by all industry participants as persons and organisations of integrity and ethics and recognised as part of the UN Sustainable Development Goal 16.
As can be seen from the targets in goal 16, reducing corruption and improving transparency and accountability is important in four of the targets.
Goal 16 - Promote peaceful and inclusive societies for sustainable development, provide access to justice for all and build effective, accountable and inclusive institutions at all levels.
• Target 16.1 - Significantly reduce all forms of violence and related death rates everywhere.
• Target 16.2 - End abuse, exploitation, trafficking and all forms of violence against and torture of children.
• Target 16.3 - Promote the rule of law at the national and international levels and ensure equal access to justice for all.
• Target 16.4 - By 2030, significantly reduce illicit financial and arms flows, strengthen the recovery and return of stolen assets and combat all forms of organised crime.
• Target 16.5 - Substantially reduce corruption and bribery in all their forms.
• Target 16.6 - Develop effective, accountable and transparent institutions at all levels.
• Target 16.7 - Ensure responsive, inclusive, participatory and representative decision-making at all levels.
• Target 16.8 - Broaden and strengthen the participation of developing countries in the institutions of global governance.
• Target 16.9 - By 2030, provide legal identity for all, including birth registration.
• Target 16.10 - Ensure public access to information and protect fundamental freedoms, in accordance with national legislation and international agreements.
• Target 16.a - Strengthen relevant national institutions, including through international cooperation, for building capacity at all levels, in particular in developing countries, to prevent violence and combat terrorism and crime.
• Target 16.b - Promote and enforce non-discriminatory laws and policies for sustainable development.
The above demonstrates that it is not only imperative that corruption is combatted but also that there has been international agreement that such behaviours need to change. The critical question is whether behaviours have improved and what is the continuing cost of corruption?
/8
/
Integrity and reducing corruption
Corruption needs continued leadership to suppress it
There are no individuals or groups immune from acts of corruption and it is only individuals and groups who can make decisions to be honest, ethical and moral in their conduct.
Understanding, training, commitment, decision-making skills and courage are all fundamental to avoiding corruption. There are many opportunities to embed training, identify conflicts of interest, compliance obligations and commitments in procurement processes to ensure the parties enter a project with an understanding of the position of the investors, banks and others regarding corruption.
It is also clear that there is a need for penalties and/or sanctions to deal with those who participate in corruption whether as a promoter or beneficiary. These may be statutory or contractual and need to be both organisational and individual.
Corruption is becoming more sophisticated
Recent years have seen an increase in the sophistication of corrupt activities. Anecdotally, these include individuals engaging in more complex, indirect and more covert transactions as well as the inappropriate use of technology to engage in corrupt conduct.
Technology has enabled both quicker and more complex and covert methods and routes through which to make corrupt payments or to engage in fraud for the benefit of corrupt individuals.
There are also many opportunities for individuals to structure investment and supply, consulting or construction contracts to enable the beneficiaries of corruption to covertly receive benefits arising from corrupt conduct and decision making. Complex corporate structuring and trusts may be used to hide or disguise the potential beneficiaries of corrupt conduct, the transfer of assets and the transactions involved.
Corruption needs continued diligence to suppress it
It is a threat that can take various forms and spread at different scales. Corrupt conduct is the cause of corruption which is a transnational phenomenon that affects all societies and economies, making international cooperation to prevent and control it essential.viii
Corruption remains an issue across the globe and generating tangible improvements appears to be slow. For example, a report by PwCix showed that economic crime has increased in all territories (regions) since 2016.
Whilst organisations continue to increase spending on combatting fraud, less than half of all organisations have performed targeted risk assessments in the last two years and just over half of the most disruptive frauds were detected by corporate controls.

/
/9
The aforementioned PwC report is not alone in its findings. The World Economic Forum (WEF) as part of the 2018 Global Competitiveness reportx found that the best and worst performers for incidence of corruption are New Zealand (best) and Yemen (worst).
Transparency International monitors and ranks over 180 countries for perceived levels of public sector corruption. The CPI assesses the degree to which public officials or politicians are believed to accept bribes or uses their position to gain a personal benefit. It is defined as follows:
The Corruption Perceptions Index - Each country’s score is a combination of at least three data sources drawn from 13 different corruption surveys and assessments. These data sources are collected by a variety of reputable institutions, including the World Bank and the World Economic Forum. A country’s score is the perceived level of public sector corruption on a scale of 0-100, where 0 means highly corrupt and 100 means very clean.xi
Their 2021 Corruption Perceptions Index (CPI) report provides some worrying conclusions and implications following the challenges of the past few years with Covid and the increasingly challenging economic conditions that are continuing into 2021 and 2022. The report summarises:
“Two years into the devastating Covid-19 pandemic, this year’s Corruption Perceptions Index (CPI) reveals that corruption levels have stagnated worldwide. Despite commitments on paper, 131 countries have made no significant progress against corruption over the last decade and this year 27 countries are at historic lows in their CPI score.1 Meanwhile, human rights and democracy across the world are under assault.”xii
As can be seen below, the resultant output of their index across the globe shows countries where perceptions of corruption are high in red and those that perform better are in yellow.

/10
/
Source: Transparency Internationalxiii
Integrity and reducing corruption
Interestingly, as part of their report they also highlight the close link between corruption and human rights abuses where higher levels of corruption, as measured by the CPI, are strongly associated with breaches of civil liberties.
Source: Transparency Internationalxiv
Such interactions are important, as anything that can further improve the drivers and understanding around corruption are important in the fight to reduce its presence. It is for this reason that this report will now explore interactions between metrics such as GDP per capita, value-added in industry (including the construction sector) and any relationship between corruption and FDI flows.
To do this we have taken the CPI scores from Transparency International, which are available on their website from 2012 to 2021 (From 1995 to 2011, the index ranked countries on a scale from ten to zero. From 2012 the index comprised of 100 points and now ranks countries on a scale from 100 to zero), and then plotted this over time against the aforementioned indices.
Finally, it is important to address an important question. The CPI is a perceptions index and therefore it could be argued that it is the perception of corruption, not corruption itself.
Whilst there is some validity to such measures not being actual counts of data, it is important to remember that expectation is an important part of most economic and political policy making.
Expectations theory is what drives interest rate, inflation and unemployment targets. The perception and expectation from individuals, groups and markets all feed into the eventual outcome of a policy or economic level. As such, this report is clear that it is reasonable to consider a perceptions index, even as a softer measure, as one which can provide a reasonable proxy for actual corruption levels.

/11
/ /11
Integrity and reducing corruption
/Industry comment
Stansbury and Neill Stansbury Co-founders and Directors Global Infrastructure Anti-Corruption Centre

FIDIC is to be applauded for its long-standing commitment to, and leadership of, the international fight against corruption. The newly published FIDIC Report “Corruption, its effects and the need to take action” adds to the overwhelming weight of international evidence that corruption is highly damaging to countries, organisations and the public, and that urgent and effective action must be taken to prevent it.
While the elimination of corruption, both national and internationally, requires widespread and co-ordinated action by all stakeholders, every individual engineer can make a significant contribution to this goal. Whether working in the public or private sectors, what steps can engineers take to prevent corruption?
• When acting in your personal capacity or as an employee:
o Before taking any action, consider whether there is a risk that the action could be corrupt.
o If in doubt, obtain further information, or ask for advice, before continuing with the action.
o Refuse to participate in any potentially corrupt action. The only exception to this would be if you have to participate because you fear for the safety of yourself or another.

/12
Catherine
o Report any suspected corruption to an appropriate person as soon as possible. If you fear for the safety of yourself or another in making a report, then do so anonymously.

• When acting as a leader or manager of an organisation:
o Refuse to allow your organisation or its personnel to particate in any corrupt action.
o Provide appropriate leadership so that the personnel under your management or control are aware of your strong commitment to anti-corruption and believe that you will fully support them in taking steps to prevent corruption.
o Ensure that the personnel under your management or control receive appropriate anti-corruption training and understand the important of preventing corruption.
o Ensure that the organisation or function has implemented reasonable measures to prevent corruption. Ideally, the whole organisation should implement a formal anti-corruption management system, such as FIDIC’s FIMS or ISO 37001.
The GIACC Resource Centre (www.giaccentre.org) provides, free of charge, online information, advice and tools designed to help organisations and individuals in the public and private sector understand, prevent and deal with corruption. These resources include:
• Analysis of what is corruption, why corruption occurs, how corruption occurs, why avoid corruption, liability for corruption, and the cost of corruption.
• Anti-corruption programmes for organisations, governments, funders, project owners, business associations / professional institutions, and projects.
• Anti-corruption training modules.
• Advice on how organisations, individuals, and the public can deal with corrupt situations.
/ /13
Industry comment
/Corruption and GDP per capita

Corruption and GDP per capita
Methodology for analysis
Firstly, why this report has chosen to consider GDP per capita against the CPI ranking series that was outlined in the previous chapter?
As can be seen from the definition below, the GDP per capita series we are using is published by the World Bank and has data across the measurement period.
GDP per capita, PPP (constant 2017 international $) - GDP per capita based on purchasing power parity (PPP). PPP GDP is gross domestic product converted to international dollars using purchasing power parity rates. An international dollar has the same purchasing power over GDP as the US dollar has in the United States. GDP at purchaser’s prices is the sum of gross value-added by all resident producers in the country plus any product taxes and minus any subsidies not included in the value of the products. It is calculated without making deductions for depreciation of fabricated assets or for depletion and degradation of natural resources. Data are in constant 2017 international dollars.xv
The rational for choosing the above series was because:
• GDP is a measure of economic activity.
• GDP per capita should reduce the effect of population size on the measure of economic activity.
• Constant international PPP was chosen to remove the effect of exchange rates on the levels of economic activity.
Where data was not available for one or either series, that data point was excluded from the analysis to not influence the results against a zero outcome.
The outcome and conclusions
The first analysis that was run considers the relationship and linear result of the two sets of data plotted over time. It should be noted that the linear relationships were not constrained by setting an intercept point and we will discuss this further soon.
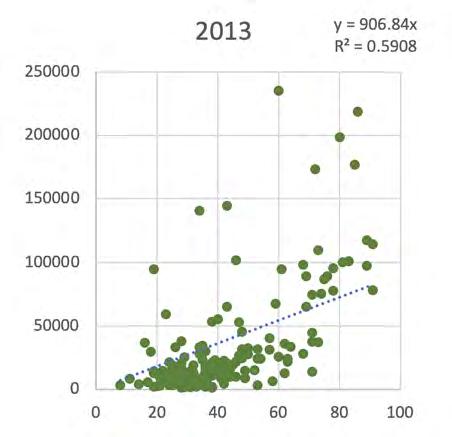
The individual yearly plots are provided in appendix A of this report over each annual period. These show that the slope of the relationship between lower corruption and higher GDP per capita has increased from an improvement in the corruption score by 1 (out of 100) in 2012 resulting in approximately $750 GDP per capita but has increased to approximately $916 by 2021. This does suggest that the incremental cost of not reducing corruption has increased over the past decade as can be seen in the chart below.What could potential disruption in the infrastructure sector look like?

/ /15
Corruption and GDP per capita
There is also another interesting inference in that not a single of the plots show an intercept which is not negative. This suggests that at a lower ranking, where the level of corruption is higher in theory, the data relationship infers there should be a negative cost to GDP per capita.

By looking at the result of the relationship between CPI and GDP per capita and PPP over the entire period to get the overarching trend. As can be seen from the chart below, the above trends of lower corruption being related to higher GDP per capita show that the intercept is negative.
The negative intercept in theory would suggest that there is a negative cost at higher levels of corruption for GDP per capita. It is, however, important to point out that there are no negative GDP per capita figures in the plot but that the change from one year’s GDP per capita to the next can be negative as an economy either experiences negative growth or alternatively a significant increase in population.
 Corruption and GDP Per capita – change in relationship/gradient over time (unrestricted intercept)
/ /16
Corruption and GDP per capita - unrestricted plot

The above, with an unconstrained intercept, does result in the question - is this the correct given what you would expect given behaviour, practicality and the data? So let us consider this question, not from a data and trend point of view, but from an understanding of why the model may need to be considered in a slightly more theoretical and practical manner. For example, considering a situation where we start from the premise that there is no activity - and so no economic gain and no value generated - what does this mean?
In theory there is no gain or loss because of corruption as no economic activity is generated and therefore, any incentive for such activity would not exist as it creates no benefit.
So, in this extreme case, this should result in no corruption. If, however, any activity is generated, a relationship between economic activity and corruption, be it whatever that relationship was, would now exist.
As such, this report makes the case that it is also important not only to consider the inference of what the data presents under the scenario where the model is unconstrained, but also under one where the relationship between corruption and GDP per capita at 0 also results in 0 in the other case. So, the intercept for the data plot should therefore be set to 0. The question is then, what does this do to the results?
/17
/
Corruption and GDP per capita
Corruption and GDP per capita

As previously stated, the first chart plots the change in the slope of the linear relationship over time both for the previous and now the restricted plot. It is important to note that the change or apparent cost of not reducing corruption become much flatter. Whilst it can be said there is still some improvement, it does suggest that the change is no longer occurring at the sort of pace within overall economic activity that one would expect to see if corruption was being dealt with proactively.
Corruption and GDP per capita – change in relationship/gradient over time (restricted intercept)

/
/18
So, how is the whole period affected if we make a similar change? If this is done, the result below shows that whilst the trend remains the same in terms of direction, the extent of the change is reduced from a one-point rise being valued at approximately $834 to approximately $521.
It should also, however, be noted that the R-squared value for the liner plot has improved which suggests a better fit for the data.
Corruption and GDP Per capita - Restricted plot

To summarise there is a relationship between higher levels of corruption and lower levels of GDP per capita. The question that the above raises is – is such a relationship also possible to detect within the infrastructure sector?
Given international data sets and the information available, a series from the World Bank has been identified which covers industry (including construction) value-added per worker (constant 2015 US$). Whilst not a perfect indicator for the construction sector, it does specifically include its activity and so is potentially a closer match than the overall level of economic activity.
/19
/
Corruption and GDP per capita
/Industry comment
Petter Matthews Executive Director Infrastructure Transparency Initiative (CoST)

FIDIC’s State of the World report makes a compelling case for acting more decisively on corruption and for doing it now. Its message could not be more timely or more urgent. That’s because a failure to act will undermine our efforts to meet the pressing global challenges that we face.
Fortunately, we are in a stronger position to tackle corruption than ever before. We understand the challenges better, the tools at our disposal are more effective and almost all governments and international agencies are committed to improving things. This doesn’t mean of course that we will succeed, but it does mean that succeeding is within our grasp.

As the report acknowledges, there has been some progress on tackling corruption in the last decade. This has been driven in part by the need to respond to global challenges, including the climate emergency, recovering from the pandemic, the threat of global recession and the fact that progress on meeting the Sustainable Development Goals has stalled.
More and better-quality infrastructure is an essential element of efforts to meet all of these challenges. The focus is often on mobilising new investment, but losses resulting from corruption, mismanagement and inefficiency are on average around 30%. This presents a significant opportunity, as reducing these losses could provide up to a third additional productive investment without having to mobilise additional investment.
/20
Industry comment
However, the most recent Corruption Perceptions Index suggests that globally, progress on tackling corruption has halted. As a headline summary that is bad enough, but the detail reveals that in many countries and not only the poor ones, but it also appears to be getting worse.
FIDIC has demonstrated that the economic costs of not tackling corruption are likely to rise. If, as seems likely, resource constraints have contributed to the lack of progress in the past, the lack of progress could be prolonged, particularly as the world may be edging toward a global recession in 2023. We have to find ways to do more with less and new technologies offer that potential.
InfraTech has been described as “the integration of material, machine, and digital technologies across the infrastructure life cycle”. It has enormous potential to deliver better connected, more efficient, green and resilient infrastructure and services. So far-reaching are its potential impacts, that in 2020, the G20 produced the Riyadh InfraTech Agenda. It is essential that anti-corruption efforts are fully integrated into this agenda.
The most efficient mechanisms to guard against corruption are those that involve the whole of society. Digital technologies are making this a reality. Data disclosure and analytic platforms are informing and empowering citizens, journalists and businesses and enabling them to exercise scrutiny and hold decision-makers to account. This is reducing the space for corruption to occur and providing incentives for decision-makers to act ethically.
In my own work with CoST, the Infrastructure Transparency Initiative, these approaches have saved hundreds of millions of dollars, produced the evidence needed to transform public institutions and to increase market competition. These technologies are efficient, effective and widely available at low cost.
CoST considers FIDIC an important ally in the fight against corruption. We fully endorse this State of the World report and call on all stakeholders to support the implementation of its recommendations.

/ /21

/Corruption and industry (including construction) value-added per worker
Corruption and industry (including construction) value-added per worker
Methodology for analysis
As can be seen below, in a similar way to GDP per capita, this report starts by considering the definition of the dataset we are using. The precise definition as outlined by the World bank is:
Industry (including construction), value added per worker (constant 2015 US$) - Value-added per worker is a measure of labour productivity—value-added per unit of input. Value added denotes the net output of a sector after adding up all outputs and subtracting intermediate inputs. Data are in constant 2015 US dollars. Industry corresponds to the International Standard Industrial Classification (ISIC) tabulation categories C-F (revision 3) or tabulation categories B-F (revision 4) and includes mining and quarrying (including oil production), manufacturing, construction, and public utilities (electricity, gas, and water).xvi
The rational for choosing the above series was because:
• The series is a closer proxy for the construction / infrastructure sector.
• Value-added per worker again should help to mitigate the effect of population size on the measure of economic activity.
• Constant international PPP was chosen to remove the effect of exchange rates on the levels of economic activity.
The outcome and conclusions
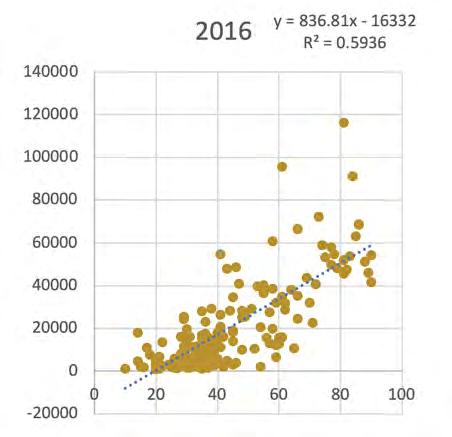
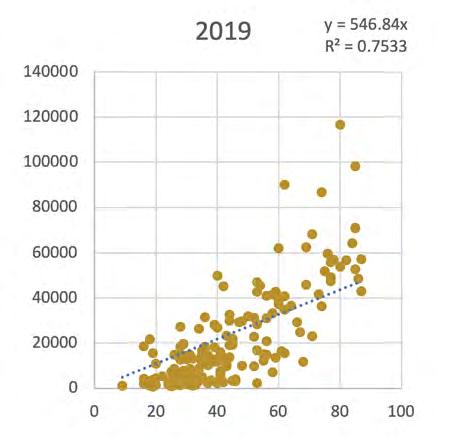
Once again, the individual year plots can be seen in Appendix B of this report. These plots suggest a relationship where, as corruption increases, the effect is that value-added per worker is lower and vice versa.
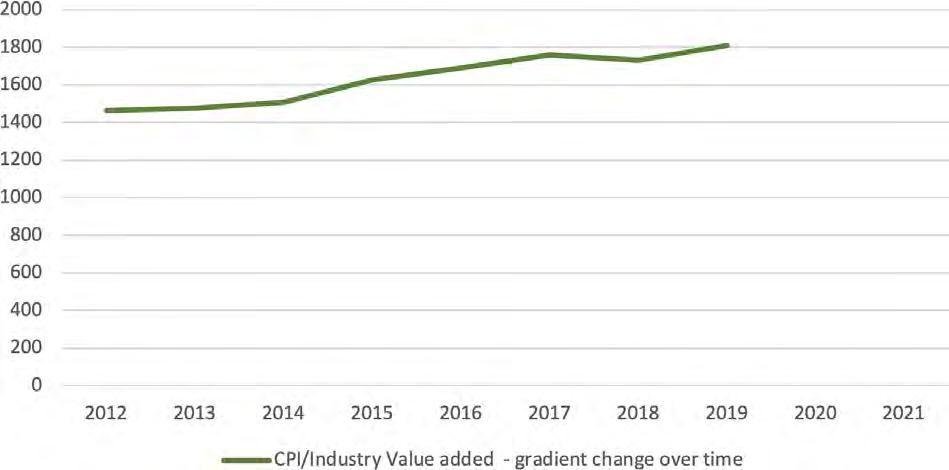
The plots from 2012 to 2019 again show a trend of the relationship becoming steeper with a one-point score improvement in reducing corruption (as the CPI score increases) in 2012 resulted in value-added of approximately $1,464 but by 2019 this had increased to approximately $1,808.
Corruption and industry (including construction), value-added per worker – change in relationship/gradient over time
Once again, if the results for the entire period (2012 to 2019) are plotted the result is that over the entire period a one-point improvement in CPI (reducing corruption) results in $1,628 of value-added in industry (including construction) per person.
/23
/
Corruption and industry (including construction) value-added per worker
Unfortunately, due to the base of the series (2015) as opposed to 2017, in the case of GDP per capita it is difficult to make inferences between overall economic activity and that of the construction sector itself.
The result, however, is consistent with the wider measure of GDP per capita and again suggests there is a negative implication for value-added at higher levels of corruption if the model is unrestricted (no intercept is set).

Corruption and value-added by construction worker – unrestricted plot
As with the GDP per capita analysis, the above needs to be considered in the light of its negative position possible.
If we consider a situation where we start from the premise there is no activity, and so there is value being added or generated, again, this suggests that in theory there is no gain or loss because of corruption, as no economic activity is generated. Therefore, any incentive for such activity would not exist as it creates no benefit.
So, in this extreme case, this should result in no corruption. If, however, any activity is generated a relationship between economic activity and corruption, be it whatever that relationship was, would now exist.
For this reason, FIDIC again runs a model where we have set the intercept at 0 and the outcome can be seen below. Again, the R-squared value has improved suggesting that the relationship reflects more of the data and again the strength of the relationship is reduced.
As previously stated, the first chart plots the change in the slope of the linear relationship over time both for the previously stated and now the restricted plot. It is important to note that the change or apparent cost of not reducing corruption becomes much flatter.
/24
/
Corruption and industry (including construction) value-added per worker

Corruption and industry (including construction), value-added per worker – change in relationship/gradient over time (restricted intercept)

Again, the results for the industry value-added (including construction) is again following the trend of the overall economic analysis.
As previously, again we ask how is the whole period affected if we make a similar change? This is shown in the next chart where the entire period is plotted between 2012 and 2019.
/ /25
Corruption and industry (including construction) value-added per worker
Therefore, both of the GDP per capita and value-added measures suggest there is the following relationship:
• As corruption increases (lower CPI score) the economic activity/value added per person is lower.
• As corruption decreases (higher CPI score) the economic activity/value added per person is higher.

The infrastructure sector, however, is an international market. Increasingly projects are being financed or funded across international borders. In the above set of analysis, this report purposefully tried to limit currency and population effects, but it is also important to consider what these are and this will be the focus of the next section.
The difficulty again is finding a data set which could provide some inferences but is also consistent enough internationally and covers sufficient countries to be able to undertake such analysis.
/26
Corruption and value-added by construction worker – unrestricted plot
/
/Industry comment
Lyndon White Practitioner/ Contracts Director ADR Dial Before You Dispute Limited


The FIDIC integrity management committee (IMC) is a standing working committee of FIDIC. Appointed by the FIDIC board, the IMC is composed of experienced industry participants as well as experts in the field of anti-corruption. The IMC’s primary functions are to create, sustain and lead initiatives for FIDIC to promote integrity and to raise awareness about identifying, mitigating and preventing corrupt conduct which causes corruption in the delivery and management of the world’s-built infrastructure.
This State of the World report contains data analytics, commentary and conclusions based upon global performance data covering the past few years. The IMC endorses the recommendations of the report and these recommendations identify forward-looking actions necessary to address and combat corruption.
The IMC considers that communication and education is a continuously evolving requirement and it is necessary for the effective mitigation of corruption, with the ultimate goal of preventing corruption.
/27
Notably, the IMC assists with combatting corrupt conduct through development and providing guidance through different platforms, including training, webinars and online media. The IMC encourages members of the built infrastructure community, including those who have witnessed corrupt conduct or who have experienced its damaging effects on reputation and cost, to talk about their experiences. This dialogue will promote transparency and ensure integrity prevails in the long run.
Through execution of an annual work plan, the IMC also participates in initiatives, including:
• Contributing to the drafting of anti-corruption wording in the FIDIC suite of contracts.
• Participating in global and local anti-corruption events including UNGASS.
• Interacting with multilateral development banks and non-governmental organisations to understand and to raise awareness of existing anti-corruption activities and tools that could be implemented.
• Development of industry-specific tools regarding integrity.
Furthermore, IMC members embed themselves into forums on topical matters to ensure that integrity is a topic which underpins discussions and activities in the built environment.
As you read this report, please ask yourself and your organisation can partner with the FIDIC IMC and likeminded individuals in the promotion of integrity. This may include, but is not limited to, activities that advocate integrity and fight against corruption in the global marketplace.

Industry
/ /28
comment
/Corruption and FDI flows

Corruption and FDI flows
Methodology for analysis
Once again, we have selected a World Bank data series as their datasets cover a wide number of countries and are the some of the closest to a standardised international measurement. Once again, for transparency and clarity, the definition of the dataset we are using is outlined below:
Foreign direct investment, net inflows (BoP, current US$) – Foreign direct investment refers to direct investment equity flows in the reporting economy. It is the sum of equity capital, reinvestment of earnings, and other capital. Direct investment is a category of cross-border investment associated with a resident in one economy having control or a significant degree of influence on the management of an enterprise that is resident in another economy. Ownership of 10% or more of the ordinary shares of voting stock is the criterion for determining the existence of a direct investment relationship. Data are in current US dollars.xvii
Given the above, it is important to explore the rationale for using this dataset:
• As the dataset is net flows it should account for the resultant cross-border outcome.
• The dataset is the sum of equity capital, reinvestment of earnings and other capital which, whilst having a broad potential for investment, some will ultimately end up in infrastructure. Also, if flows are significant, the resultant effect is likely to be more demand for infrastructure in the area into which the capital is flowing.
• The FDI flows by definition within the data set are for residents where they have a significant degree of control in another residency, so are more likely to be associated with significant flows of capital.
It should, however, also be highlighted that the above will not be a perfect indicator for investment purely within infrastructure and it will inevitably have some degree of inflationary and exchange rate influence within it due to the nature of the series.
As can be seen below if we conduct a similar unrestrained analysis on net FDI flows, it shows not only a weak association between corruption and net flows, but also that the R-squared value of the data is particularly low.
Unlike the previous series, this report has not constrained the model (0 intercept). The rationale behind this is that economic activity could still occur (and so corruption is possible) within a country despite no net trade flows.
The outcome and conclusions
To better understand the relationship, in Appendix C we performed a similar analysis but for separate annual periods and it is interesting to note that the performance of other periods does vary considerably more than the GDP and industry value-added series.
2012, 2013 and 2014 have similar outcomes in terms of the slope of the relationship as do 2015, 2017 and 2020 and likewise for 2018 and 2019. Some of the explanation for this could be down to general economic conditions with improvements out of the financial crisis in the first period and some degree of normality in the mid period and then the entry into Covid for the later period.
Looking at the chart on the next page, it is reasonable to highlight that there are three areas where outliers over the various years are affecting this relationship. These are numbered one to three.
/30
/
Corruption and FDI flows
GDP and FDI flows – Unrestricted plot

If we consider these areas, it could be argued that areas one and two (yellow) are distinct and could be considered outliers. Removing these from the results as shown below creates an improved R-squared, but it is fair to say the relationship between the CPI score and FDI net flows remains weak.

/ 1 2 3
/31
4
Then you could suggest that area 3 are also outliers (green) but unfortunately if this is removed as one would expect the slope of the relationship increases the R squared value actually falls.


/32
Corruption and FDI flows / 3 4 4
Finally, you could suggest that area 4 are also now outliers but as can be seen below this does further improve the R-squared value, suggesting a better fit with the data, but it also reduces the slope of the relationship between lower corruption and higher FDI flows.

At this stage of removal, it should rightly be questioned if it is reasonable to assume the result is still a fair reflection of the data. It is also important to note that the stepped approach taken in this report was done to demonstrate the difference such actions make, but also show potentially how the relationship changes.
So, what can we conclude from the stages and data as it has been analysed above?
• There is some relationship between FDI flows and corruption, with net FDI flows generally being higher in low corruption countries.
• Whilst net flows can be positive for a country, the extent to which flows occur depend on many factors and can be a political/economic decision.
• Whilst the relationship was not as strong as anticipated, the significant scale of the sums involved means even a small relationship results in significant loses.
• The relationship is, however, weak in terms of the amount of data that fits the linear relationship (R-squared value) unless you remove outliers.
• Having removed several stages of potential outliers, whilst the data fit improves, the relationship between corruption and net FDI gets weaker.
• Looking at the annual plots, unlike GDP per capita and value added in the industry (including construction), it is not as evident that the cost of corruption is increasing - ie: that the slope is increasing and so the benefit of reducing corruption is increasing.
Given all of the above results, this report next poses the question specifically for the industry – just what is the cost and implications of not reducing corruption?
/33
/
Corruption and FDI flows
Corruption and FDI flows
A simple model - considering and calculating the cost of corruption over time and the extent to which reducing corruption makes a difference depending on its ‘cost’
One of the advantages of the analysis above is by also looking at individual year periods across countries, you are able to consider the potential cost of corruption in the light of the failure to act to prevent it.
Let’s consider that countries across the world had performed at the highest rate of Industry (including construction) value-added as opposed to the lowest. So, if corruption had the highest cost of growth verses the minimum, what would the result be?
As can be seen below, the linear slopes of the analysis of the lowest and highest year have been taken and the difference calculated. These are from the unconstrained model, taking the best case for the cost of corruption being significant (and having changed the most) and thus demonstrating the extent of change that needs to occur to tackle the cost of corruption faster.
The outcome and conclusions
The results show that a single point improvement in reducing corruption under the high versus low periods is $344 per person for industry value-added including construction. This was chosen to try and focus into the industry, infrastructure and construction sector.
Low slope gradient High slope gradient High low slope difference Industry value-added (inc construction 1464.7 1808.9 344.2
As can be seen from Appendix D, using ILO data from the latest period on construction employmentxviii and the industry cost (which includes construction per point improvement) across the various countries where data is available, the difference in the cost of action of not reducing corruption by one point across each employee would be approximately $38bn across the countries listed.
Consider then the latest CPI scores for 2021 and in a true drive to reduce corruption you raised all countries scores by ten, so no country was below 20 that is now worth $380bn in value-added lost in the industry (including construction) sector.
You can easily see how even taking the different approach (which just considers the differential in corruption and not the totality of corruption within even the lower model, the cost of corruption if you were to raise all countries to a CPI score above 50, consider the cost of corruption and the cost of putting such activity right you would easily be hitting the $2.6tn cost of corruption per year (5% of GDP) mentioned by the UN using WEF data.xix
Our analysis, however, suggests that given the GDP per capita models were lower than the industry equivalent, the cost of this could be even higher. Whilst the simple approach that has been taken in this report is by no means definitive, it demonstrates the extreme cost of corruption, not only on economies and projects, but also on individuals across the globe.
/34
/
/Industry comment
Stifi Senior Consultant Fischer Consulting

Corruption in AEC industry
It is not a secret that corruption is widely spread in the AEC industry, a fact confirmed by all reports and indicators covering corruption as a phenomenon. For example, the Bribe Payers’ Index (BPI) published by Transparency International (TI), shows clearly that companies working in construction industry are most likely to pay bribes to get business contracts. The BPI 2011 ranked the public works contracts and construction with a score of 5.3 from 10 as the most corrupt sector of all economic sectors.xx

/35
Ahmed
The Advantage of Technological Innovation in Reducing Corruption in Architecture, Engineering and Construction (AEC) Industry
Source: Perceptions of foreign bribery by sectors – based on BPI 2011

How can technological innovations contribute to reduce corruption?
It becomes clear that technological innovation is changing the way of project delivery and the work methods and processes in our industry. Most companies and stakeholders aiming to apply technological innovation to reduce their operating costs, improve internal and external communication so that they increase their productivity.
It sounds good, but to reduce corruption, companies are challenged to take advantage of technological innovation to increase transparency and accountability and to enhance a person’s and organisation’s integrity, since the main three causes for corruption in construction are lack of transparency, lack of accountability and lack of integrity as shown in the following Ishikawa diagram.xxi
Source: Causes of corruption in Construction

/36
/
Industry comment
Examples of technological innovations in reducing corruption

Virtual Design and Construction: VDC is the use of integrated multidisciplinary performance models of design-construction projects. It helps in achieving improvement of reliability and visibility through accurate model-based quality take-offs and through 3D/4D visual models.xxii VDC can include budget monitoring model which increase accountability and transparency.
Building Information Modeling (BIM): Currently, AEC companies have the tendency to adopt BIM and use it in design, construction, and operation phases. It increases collaboration and commitment among team members. BIM has many advantages that can be used in combating corruption through its features, for example obtaining reliable quantity estimates, in increasing transparency which can help reduce the room for discretion.
Web Service & Web-Based Information System: They are software systems designed to support interaction and transfer of information among participants. Such software improves connectivity among key participants and provides the right information at the right moment. The web-based information systems can increase accountability and transparency among all team members.
IT and E-Procurement: This can reduce administrative and bureaucratic corruption, speed up process without facilitating payment and increase transparency and ensure genuine competition.
Tablets and mobiles on-site: The use of such tools support getting real time information and provides easier monitoring and controlling of the construction progress as well as reducing deviation from planned output.xxiii Such tools can also increase accountability and transparency among all team members.
On-site vision tracking and GPS support systems: These offer affective information about positioning of personnel as well as equipment and machines.xxiv So it can be used to identify anomalies and underperformance (detection in operations) the systems can increase accountability and transparency.
Knowledge sharing systems and Training platforms: Training on all organisational level remains the essential and effective tool to raise awareness about corruption and to enhance integrity.
The role of technological innovation in reducing corruption is of key importance and gives rise to the need for additional processes, models and tools to support preventing, detecting and reporting corruption risks.
Industry
/ /37
comment
/Examples of MDB and IFI activities combatting corruption

Examples of MDB and IFI activities combatting corruption
A recent report by RPC entitled MDBs & IFIs, The Unspoken Giants in the Global Fight Against Corruption,xxv found that there are currently an estimated 500 investigations globally into alleged fraud and corruption by companies and individuals backed by MDB financing.
Given that these organisations have collectively committed more than $300bn in lending since the start of the pandemic, fighting corruption has never been more important and is backed by the evidence earlier in this report that the cost of not reducing corruption is slowly increasing.
It should, however, also not be forgotten that the cost of corruption does not only occur in one way. We also need to consider the following:
• The loss in economic efficiency and value due to the corruption itself.
• The cost of identifying and monitoring corruption.
• The cost of investigating corruption.
• The cost of taking action or repairing the damage done by corruption.
The above demonstrates why the role the MDBs are taking in fighting corruption is also becoming more sophisticated. For example, the World Bank, as well as having its five key initiatives below, has partnered with companies such as Microsoft to combat corruption with artificial intelligence.
“Working with Microsoft’s Research group, we had the opportunity to see the power and potential of artificial intelligence to digest huge and diverse data sets to detect patterns that hint at the possibility of corrupt behaviour. This would allow us to see links in bidding patterns of the winning and losing bidders to numeric patterns under “Benford’s Law,” along with beneficial ownership information from around the globe. It can also allow us to better map networks of relations, locations, use of shell companies, offshore jurisdictions, and banking information of bidders to address potential risks before a contract is issued.”xxvi
The World Bank even provide examples such as in Brazil, where the bank helped develop an artificial intelligence system that identifies 225 red flags of potential fraud in public procurement processes and can help improve expenditures.xxvii It should, however, also be considered that public procurement processes are only part of the entire procurement process story and that the number of red-flags would likely be much higher if more data was available, integrable or comparable from both public and private sources.
The World Bank’s wider approach to controlling corruption needs to keep up with the times and their current approach is organised around five initiatives.xxviii
• Global norms and standards are essential in shaping policy and ensuring governments act.
• Corruption is often transactional but it can also be embedded in networks, tilting the playing field to the advantage of political elites and connected firms.
• Transparency has value. Access to information is a basic human right.
• Corruption comes in all forms, and these can vary systematically.
• The common definition of corruption considers “abuse of public office for private gain,” projects an image of a lone person doing wrong. In many cases they get help from bankers and lawyers and accountants, sometimes in offshore jurisdictions and financial centres in advanced economies. And what about the behaviour of the firms and individuals?
Similarly, as one would expect, other MDBs have similar policies in place. For example, the European Investment Bank (EIB) launched its most recent policy on 5 August 2021 entitled EIB Group Anti-Fraud Policy which makes it makes clear that:
“The EIB Group will not tolerate Prohibited Conduct (i.e., corruption, fraud, collusion, coercion, obstruction, theft at EIB Group premises, misuse of EIB Group resources or assets, money laundering and terrorist financing) in its activities or operations.”xxix
/39
/
Examples of MDB and IFI activities combatting corruption
Within this, the EIB have set up a Fraud Investigations Division of the Inspectorate General (IG/IN) is an independent office within the EIB Group. IG/IN was created to combat fraud, corruption and other ‘Pphibited Conduct’ affecting the EIB Group’s operations.
IG/IN aims to protect the EIB Group’s finances and reputation through six core activities:xxx
1. Assessment and, where necessary, investigations of allegations.
2. Policy work, such as advising on the wording of bank documentation and giving advice to colleagues throughout the bank on addressing fraud and corruption-related issues.
3. Proactive Integrity Reviews to identify actual fraud or potential vulnerabilities.

4. Fraud awareness training for all EIB Group staff.
5. Raising awareness of fraud and corruption-related issues in the public and private sectors.
6. Analysis and information gathering to support the above five activities.
As one would expect, if fraud or corruption is proven, the EIB has a number of sanctions, including various tools from suspension to remedies and referral to national authorities. These are listed below.
• Suspend disbursements.
• Seek repayment of the loan and loan reallocation.
• Refer all evidence to national authorities and other appropriate parties (e.g., for criminal investigation).
• Pursue other remedies as provided for in the finance contract.
• Require remedial measures be taken by the borrower.
• Settle with the entities that engaged in Prohibited Conduct.
As mentioned previously, the African Development Bank has a similar stance stating that:
• “The African Development Bank Group views corruption, fraud and other sanctionable practices as highly inimical to the achievement of its mandate. In order to spur sustainable economic development and social progress on the continent, AfDB endorses a multipronged approach to combating these harmful practices. Consequently, the Office of Integrity and Anti-Corruption (PIAC) uses proactive measures including risk assessments and sensitization programmes to deter sanctionable practices and prevent their occurrence in internal corporate procurement issues and operations financed by the Bank Group.”xxxi
/
/40/40
Examples of MDB and IFI activities combatting corruption

Like the EIB, the African Development Bank also has in place an independent Integrity and anti-corruption department to deal with issues that arise. The method in which it carries out its strategy is also similar:
• Proactive prevention through risk assessments, sensitisation programmes, due diligence and other activities.
• Mainstreaming integrity issues into Bank Group operations and activities.
• Providing technical support to regional member countries in integrity issues and enhancing accountability.
• Participation in international and regional integrity initiatives.
• Investigations, sanctions and other deterrence processes.
What the above does demonstrate is that over time the MDBs have focused on and have increasingly put in place practices which learn lessons from each other. This is not surprising as increasingly the MDBs and IFIs are co-financing and involved in blended financing and funding of projects. As such it makes sense if anti-corruption policies align and carry similar importance and lack of tolerance for corruption.
Integrity is one of
FIDIC’s
core three principles
FIDIC sees itself as the international voice of consulting engineers. One of its main goals in addition to the global representation is improving the reputation of consulting engineers. FIDIC’s main philosophy includes quality, integrity, and sustainability as basic principles.
FIDIC has been energetically promoting integrity within the industry for years. There is evidence to support the idea that a formal and systematic approach towards the management of integrity works better than sporadic efforts developed by individual companies, yet the idea has been slow to achieve success in the consulting industry. Combating corruption requires a concerted effort by all parties involved in projects - clients, contractors, government procurement groups and funding agencies alike - in helping to prevent and not just to punish. The industry cannot solve the problem without its partners.
/
/41
Examples of MDB and IFI activities combatting corruption
FIDIC uses the term “integrity management” deliberately. FIDIC advocates ethical integrity to fight corruption and an integrated management system as an approach to control and verify its performance in this regard. It begins with a firm’s commitment to a code of conduct on behalf of all of its staff and leadership which demonstrates this commitment in a clear and visible way. The CEO must lead in the formulation of the code of conduct and in the allocation of resources to the integrity management initiative. There should be no misunderstanding that top management demands compliance to integrity values and is prepared to take the necessary actions for achieving integrity.
FIDIC also has a dedicated integrity management committee (IMC) tasked with the development of policies, guidelines and processes aimed at better understanding and ‘managing’ risks of corruption. The IMC works with other international organisations to achieve this objective to ensure that there is only one standard used by the industry. The organisations that FIDIC works with include the World Federation of Engineering Organisations, Transparency International, Organisation for Economic Co-operation and Development, World Economic Forum, International Organisation for Standardisation, Confederation of International Contractors’ Associations and the United Nations. The IMC liaises with the international financing institutions for complementing and supporting their anti-corruption initiatives.
FIMS, FIDIC Code of Ethics and Model Code of Conduct for Consulting Firms
FIMS is structured to be used as a platform for a compliance system and the code of ethics contains principles of social responsibility, competence, integrity, impartiality, fairness to reduce, mitigate and strive to prevent corruption.
A corresponding model code of conduct extends these principles to include quality of service, objectivity and competition which, amongst other important things, requires that firms will not sponsor compensation designed to influence or secure consulting work, nor seek commissions from suppliers of equipment or services recommended to clients.
The above is linked to the FIDIC approach to the UN SDGs through systemic and documented processing described in the FIMS, the FIDIC Suite of Contracts and other FIDIC publications and promotions.
Maintaining integrity and reducing corruption
Engineering firms have many tools to help the global community reduce corruption. Many global engineering firms have integrity management systems in place and those that do not are well advised to do so – their survival depends on it.
FIDIC provides excellent guidance in this area via their “FIMS” publications. Eliminating corruption continues to be on FIDIC’s agenda as a priority. Integrity is one of FIDIC’s three core commitments, the others being sustainability and quality. In fact, reducing and aiming to ultimately eliminate corruption will help improve performance in these other two areas by establishing confidence in a systemic approach to recording and reporting corruption.
FIDIC believes that education is one of the key elements in preventing corruption. A person who is an aware of the causes and consequences of his corrupt conduct and the implications of living in a society could make the right decision and act in an action of integrity.
In addition to providing FIMS guidelines, we encourage decision-makers to use FIDIC Conditions of Contract for their projects. These documents represent the sound outputs of the efforts of a large diverse group of exceptionally qualified professionals. They are designed to be fair to all parties and to realistically allocate and apportion risk by considering which party has, or ought to have, the most control over a specific risk parameter. Of course, a good contract does not guarantee project success, but a poorly drafted and incorrectly used contract, especially one with unbalanced risks, dramatically increases the possibility of complicated disputes, protracted litigation and even corruption.
/42
/
/42/42
Examples of MDB and IFI activities combatting corruption
FIDIC actively engages entities involved in reducing or eliminating corruption including its member associations, owners/employers, government agencies, international funding institutions, the International Standards Organisation and non-governmental organisations like Transparency International. We often meet with them and offer them opportunities to participate as presenters at our conferences.
Through this activity, FIDIC has become acutely aware of how damaging corruption is and we are committed to work with everyone to eliminate it. Some specific recommendations we have to take to eliminate corruption are listed below.
1. Encouraging firms to avoid projects and contracts with severely unbalanced risk and compensation models.
2. Encouraging firms to implement a FIMS or FIMS compatible programme which includes compliance (following rules) and ethics (consistent with a culture encouraging correct behaviour).
3. Encouraging owners/employers to require firms working for them to have a FIMS or FIMS compatible programme in place.
4. Encouraging owners/employers and funding agencies to reward good behaviour (whitelisting) and react accordingly to mitigate, restrict or avoid bad behaviour (blacklisting).
5. Encouraging owners/employers and funding agencies to treat firms who self-report problems fairly in an effort to encourage firms who find themselves in such a situation to do so.

6. Encouraging firms to establish a zero-tolerance policy for corruption and monitor/enforce it from the top of the organisation.
7. Encouraging firms to establish robust mandatory training programmes.
8. Encouraging firms to establish reporting systems for all employees.
9. Encouraging firms to implement comprehensive risk management systems; and
This brings us neatly back to the UN theme of anti-corruption day for 2022 which is “Your right, your role: Say no to corruption.”xxxii FIDIC believes this report should help form an important part in reducing and highlighting the effects of corruption going forward.
/
/43
/Appendix A - CPI and GDP per capita by year

Appendix A - CPI and GDP per capita by year
CPI and GDP per capita by year (unrestricted)


/45
/
- CPI and GDP per capita by year

CPI and GDP per capita by year (unrestricted)


/46 Appendix
/
A
- CPI and GDP per capita by year

CPI and GDP per capita by year (restricted intercept)


/47 Appendix
/
A
- CPI and GDP per capita by year
CPI and GDP per capita by year (restricted intercept)


/48 Appendix
/
A
/Appendix B - CPI and value-added by construction worker by year

Appendix B - CPI and value-added by construction worker by year
CPI and value-added by construction worker by year (unrestricted)


/50
/
Appendix B - CPI and value-added by construction worker by year
CPI and value-added by construction worker by year (unrestricted)


/51
/
Appendix B - CPI and value-added by construction worker by year
CPI and value-added by construction worker by year (restricted intercept)


/52
/
Appendix B - CPI and value-added by construction worker by year
CPI and value-added by construction worker by year (restricted intercept)


/53
/
/Appendix C - CPI and FDI flows by year (unrestricted)

Appendix C - CPI and FDI flows by year (unrestricted)


/55
/
Appendix C - CPI and FDI flows by year (unrestricted)


/56
/
/Appendix D - GDP per capita and value-added loss between high and low corruption

Appendix D - GDP per capita and value-added loss between high and low corruption
Country Time Employment in 000s
Value added (high/low difference)
000s conversion Con Value add cost
Afghanistan 2021 917.832 344.2 917832 315917774
Angola 2014 220.259 344.2 220259 75813148
Albania 2019 89.067 344.2 89067 30656861
United Arab Emirates 2021 1290.335 344.2 1290335 444133307
Argentina 2021 1040.353 344.2 1040353 358089503
Armenia 2020 62.348 344.2 62348 21460182
Australia 2020 1171.002 344.2 1171002 403058888
Austria 2021 323.886 344.2 323886 111481561
Burundi 2020 51.518 344.2 51518 17732496
Belgium 2021 311.885 344.2 311885 107350817
Benin 2018 156.15 344.2 156150 53746830
Burkina Faso 2018 149.298 344.2 149298 51388372
Bangladesh 2017 3432.344 344.2 3432344 1181412805
Bulgaria 2021 267.881 344.2 267881 92204640
Bosnia and Herzegovina 2021 105.232 344.2 105232 36220854
Belarus 2021 375.052 344.2 375052 129092898
Belize 2019 11.38 344.2 11380 3916996
Bolivia 2021 451.205 344.2 451205 155304761
Brazil 2021 6950.833 344.2 6950833 2392476719
Barbados 2019 11.136 344.2 11136 3833011
Brunei Darussalam 2020 26.052 344.2 26052 8967098
Bhutan 2020 16.01 344.2 16010 5510642
Botswana 2020 52.099 344.2 52099 17932476
Switzerland 2021 339.241 344.2 339241 116766752
Chile 2021 749.795 344.2 749795 258079439
Côte d'Ivoire 2019 231.271 344.2 231271 79603478
Cameroon 2014 238.561 344.2 238561 82112696 Congo, Democratic Republic of the 2012 14.207 344.2 14207 4890049
Cook Islands 2019 0.413 344.2 413 142155
Colombia 2021 1496.704 344.2 1496704 515165517
Comoros 2014 14.937 344.2 14937 5141315
Cape Verde 2019 21.762 344.2 21762 7490480
Costa Rica 2021 123.974 344.2 123974 42671851
Cuba 2010 224.54 344.2 224540 77286668
Cayman Islands 2015 3.924 344.2 3924 1350641
Cyprus 2021 41.142 344.2 41142 14161076
Czechia 2021 413.481 344.2 413481 142320160
Germany 2021 2445.608 344.2 2445608 841778274
Denmark 2021 194.63 344.2 194630 66991646
Dominican Republic 2021 391.164 344.2 391164 134638649
Algeria 2017 1846.508 344.2 1846508 635568054
Ecuador 2021 466.918 344.2 466918 160713176
/58
/
Appendix D - GDP per capita and value-added loss between high and low corruption
Country Time Employment in 000s
Value added (high/low difference)
000s conversion Con Value add cost
Egypt 2020 3517.877 344.2 3517877 1210853263
Spain 2021 1291.633 344.2 1291633 444580079
Estonia 2021 57.167 344.2 57167 19676881
Ethiopia 2021 738.087 344.2 738087 254049545
Finland 2021 189.077 344.2 189077 65080303
Fiji 2016 25.15 344.2 25150 8656630
France 2021 1775.892 344.2 1775892 611262026
Micronesia, Federated States of 2014 0.904 344.2 904 311157
United Kingdom 2019 2355.944 344.2 2355944 810915925
Georgia 2020 85.384 344.2 85384 29389173
Ghana 2017 500.203 344.2 500203 172169873
Gambia 2018 34.329 344.2 34329 11816042
Guinea-Bissau 2018 1.466 344.2 1466 504597
Greece 2021 141.772 344.2 141772 48797922
Guatemala 2019 484.856 344.2 484856 166887435
Guyana 2019 18.847 344.2 18847 6487137
Honduras 2020 217.254 344.2 217254 74778827
Croatia 2021 127.91 344.2 127910 44026622
Hungary 2021 375.979 344.2 375979 129411972
Isle of Man 2016 3.48 344.2 3480 1197816
Ireland 2021 137.735 344.2 137735 47408387
Iran, Islamic Republic of 2020 3223.655 344.2 3223655 1109582051
Iraq 2021 1403.43 344.2 1403430 483060606
Iceland 2021 15.62 344.2 15620 5376404
Israel 2020 197.4 344.2 197400 67945080
Italy 2021 1430.804 344.2 1430804 492482737
Jordan 2020 172.739 344.2 172739 59456764
Japan 2020 4920 344.2 4920000 1693464000
Kenya 2019 1292.689 344.2 1292689 444943554
Kyrgyzstan 2020 287.676 344.2 287676 99018079
Cambodia 2019 785.21 344.2 785210 270269282
Kiribati 2019 0.662 344.2 662 227860
Korea, Republic of 2021 2090.387 344.2 2090387 719511205
Kosovo 2020 38.868 344.2 38868 13378366
Lao People's Democratic Republic 2017 82.992 344.2 82992 28565846
Lebanon 2019 140.795 344.2 140795 48461639
Liberia 2017 8.884 344.2 8884 3057873
Saint Lucia 2021 6.86 344.2 6860 2361212
Sri Lanka 2019 641.488 344.2 641488 220800170
Lesotho 2019 46.329 344.2 46329 15946442
Lithuania 2021 101.472 344.2 101472 34926662
Luxembourg 2021 15.752 344.2 15752 5421838
/59
/
Appendix D - GDP per capita and value-added loss between high and low corruption
Country Time Employment in 000s
Value added (high/low difference)
000s conversion Con Value add cost
Latvia 2021 72.3 344.2 72300 24885660
Moldova, Republic of 2021 65.143 344.2 65143 22422221
Madagascar 2015 161.722 344.2 161722 55664712
Maldives 2019 5.178 344.2 5178 1782268
Mexico 2021 4386.815 344.2 4386815 1509941723
Marshall Islands 2019 1.15 344.2 1150 395830
North Macedonia 2021 54.38 344.2 54380 18717596
Mali 2020 119.936 344.2 119936 41281971
Malta 2021 17.304 344.2 17304 5956037
Myanmar 2020 1205.535 344.2 1205535 414945147
Montenegro 2020 18.334 344.2 18334 6310563
Mongolia 2021 82.164 344.2 82164 28280849
Mozambique 2015 294.35 344.2 294350 101315270
Mauritius 2019 55.315 344.2 55315 19039423
Malaysia 2020 1173.4 344.2 1173400 403884280
Niger 2017 53.638 344.2 53638 18462200
Nigeria 2019 1393.045 344.2 1393045 479486089
Netherlands 2021 396.62 344.2 396620 136516604
Norway 2021 230.98 344.2 230980 79503316
Nepal 2017 977.615 344.2 977615 336495083
Nauru 2013 0.115 344.2 115 39583
Oman 2021 423.249 344.2 423249 145682306
Pakistan 2021 5905.994 344.2 5905994 2032843135
Panama 2021 143.002 344.2 143002 49221288
Philippines 2020 3699.562 344.2 3699562 1273389240
Palau 2014 0.373 344.2 373 128387
Poland 2021 1332.582 344.2 1332582 458674724
Portugal 2021 305.43 344.2 305430 105129006
Occupied Palestinian Territory 2021 194.258 344.2 194258 66863604
Réunion 2012 16.149 344.2 16149 5558486
Romania 2021 763.818 344.2 763818 262906156
Russian Federation 2021 4906.587 344.2 4906587 1688847245
Rwanda 2021 364.826 344.2 364826 125573109
Senegal 2019 294.58 344.2 294580 101394436
Singapore 2021 24.61 344.2 24610 8470762
Solomon Islands 2013 9.461 344.2 9461 3256476
Sierra Leone 2018 92.15 344.2 92150 31718030
El Salvador 2021 213.669 344.2 213669 73544870
Somalia 2019 30.082 344.2 30082 10354224
Serbia 2021 91.479 344.2 91479 31487072
Suriname 2016 15.634 344.2 15634 5381223
Slovakia 2021 731.916 344.2 731916 251925487
/60
/
Appendix D - GDP per capita and value-added loss between high and low corruption
Country Time Employment in 000s
Value added (high/low difference)
000s conversion Con Value add cost
Slovenia 2021 52.511 344.2 52511 18074286
Sweden 2021 349.174 344.2 349174 120185691
Eswatini 2016 20.04 344.2 20040 6897768
Seychelles 2020 2.352 344.2 2352 809558
Chad 2018 64.206 344.2 64206 22099705
Togo 2017 67.971 344.2 67971 23395618
Thailand 2020 2232.422 344.2 2232422 768399652
Timor-Leste 2016 344.2 0 0
Tonga 2018 2.426 344.2 2426 835029
Trinidad and Tobago 2021 7.326 344.2 7326 2521609
Tunisia 2014 358.432 344.2 358432 123372294
Türkiye 2021 1777.464 344.2 1777464 611803109
Tuvalu 2016 0.176 344.2 176 60579
Tanzania, United Republic of 2020 598.91 344.2 598910 206144822
Uganda 2017 337.277 344.2 337277 116090743
Uruguay 2021 111.81 344.2 111810 38485002
United States 2021 11743.302 344.2 11743302 4042044548
Uzbekistan 2019 1324.596 344.2 1324596 455925943
Viet Nam 2021 4538.942 344.2 4538942 1562303836
Vanuatu 2019 3.3 344.2 3300 1135860
Samoa 2017 2.948 344.2 2948 1014702
Zambia 2020 160.762 344.2 160762 55334280
Zimbabwe 2019 104.145 344.2 104145 35846709 37,831,551,035 Approx 38bn
/61
/
/Acknowledgments

/Acknowledgments
FIDIC in the production of the State of the World series would like to thank the following groups and individuals for their contributions to this publication.
The FIDIC board
As with all documents and research produced by FIDIC, the board plays a vital role in ensuring that quality, integrity and direction of such publications and as such we thank the board members for their contribution to this publication.
The secretariat
FIDIC is only possible because of the hard work of its staff team and this report would like to recognise the efforts of the individuals within the FIDIC secretariat that made this report possible. The FIDIC board will continue to support and endorse the actions of the secretariat to deliver for its members and the wider infrastructure sector.
Reviewers
FIDIC’s research is important and covers a global stage so that research is peer reviewed by several independent individuals and a selected board member to help ensure its quality. FIDIC would therefore like to take this opportunity to thank:
• Matthew Oakley, Director, WPI Economics.
• Anthony Barry, President, FIDIC.
• Peter Guthrie, Professor, Cambridge University.
Contributors
FIDIC’s reports do not only focus on FIDIC’s objectives but by their nature are a culmination of industries’ expertise and professionalism as such there are always contributors to FIDICs reports and in this one, we wish to recognise the following:
• Nelson Ogunshakin, CEO, FIDIC.
• Natalie Muir, General Manager - Water and Environment, Cardno.
• Richard Stump, Vice President, RS&H.
• Julianna Fox, Chief Ethics and Compliance Officer, WSP.
• Lyndon White, Practitioner/Contracts Director, ADR Dial Before You Dispute Limited.
• Ahmed Stifi, Senior Consultant, Fischer Consulting.
• Petter Matthews, Executive Director CoST and Engineers Against Poverty.
• Catherine Stansbury, Co-founder and Director, Global Infrastructure Anti-Corruption Centre.
• Neill Stansbury, Co-founder and Director, Global Infrastructure Anti-Corruption Centre. We would also like to thank all the FIDIC member associations that generously contributed to this report.
FIDIC’s partners
FIDICs State of the World programme is supported by various partners across its editions. We would in particular like to thank:
• UN Environment Programme
• The Sustainable Infrastructure Partnership.
/63
Thanking our member association partners


Finally, but by no means least, FIDIC is a product of its member associations without which FIDIC would not exist. Whilst all member associations can be found on the FIDIC website, in this and future State of the World reports we have engaged with FIDIC member associations on the detail of our work and we would like to thank the following member associations for their support for our research.


/64
/Acknowledgments
FIDIC, the International Federation of Consulting Engineers, is the global representative body for national associations of consulting engineers and represents over one million engineering professionals and 40,000 firms in more than 100 countries worldwide.
Founded in 1913, FIDIC is charged with promoting and implementing the consulting engineering industry’s strategic goals on behalf of its member associations and to disseminate information and resources of interest to its members. Today, FIDIC membership covers over 100 countries of the world.

FIDIC, in the furtherance of its goals, publishes international standard forms of contracts for works and for clients, consultants, sub-consultants, joint ventures and representatives, together with related materials such as standard pre-qualification forms.
FIDIC also publishes business practice documents such as policy statements, position papers, guidelines, training manuals and training resource kits in the areas of management systems (quality management, risk management, business integrity management, environment management, sustainability) and business processes (consultant selection, quality-based selection, tendering, procurement, insurance, liability, technology transfer, capacity building).
FIDIC organises the annual FIDIC International Infrastructure Conference and an extensive Programmeme of seminars, capacity building workshops and training courses.
FIDIC 2020-2024 priorities
Lead the consulting and engineering industry visibly and effectively:
• Being the industry’s credible global voice
• Providing the nexus for all stakeholders
• Facilitating improvement and growth in business
• Addressing global challenges
All of the above is for the benefit of society, FIDIC members and their member firms.
About FIDIC / /65
State of the World Series - Digital disruption and the evolution of the infrastructure sector
This report explores the pace of this technological change and shows that not only is the pace of change significant, but that many of the technology companies we use today for day-to-day activities in the grand scheme of time are actually very young and company longevity is continuing to decline. This suggests that not only is the pace of change faster, but the companies and people we deal with today may not be the ones we are dealing with in ten years’ time. We also discuss the role of technology as a potential disrupter to industries changing their business model as a result of shifts in technology, data and/or how a combination of how customers/ clients and the sector can access and use such information. It is then also important to look at the role of technology as an innovator and as something which drives real changes and improvements. What does it mean in terms of big data, artificial intelligence, customer lead data and more devolvement of smart devices?

Click here to download
State of the World Series - Net Zero - What Next?
Net Zero. It could be argued that we have only just begun, but such ambitions were set decades ago. Yes, to hit a target you first have to create one and to reach that target you have to gain acceptance, political support, industry support and then delivery through all related activity. FIDIC, as the global voice of engineering and infrastructure, asks not only what is next but we also provide the next global target. This target not only helps to achieve our current trajectory but also sets the kind of ambitions the engineering sector and humanity should be proud to achieve. We go beyond Net Zero and ask “what next?” Find out more about what comes next after Net Zero by attending the launch of “Net Zero... so, what next?”, the fifth report in the FIDIC State of the World series.
Click here to download
State of the World Series - Building sustainable communities in a post-Covid world


The world is gradually learning what it means to be sustainable as we march towards achieving the 2030 UN Sustainable Development Goals and approach net zero, but should we simply be adapting our current way of living or thinking about a new way of life? The Covid pandemic has demonstrated that remote working is not just the digital dream of IT professionals and visionaries, but is and can be real life. Do we need cities? Is urbanisation going to continue? Alternatively, should we be looking at the airline industry and the ‘hub and spoke’ model as the future for communities where most activity can happen locally in a more sustainable way via serviced offices, with only occasional visits to major hubs? The world is changing and this State of the World report asks: “are we changing quick enough to match the way communities want to live not only tomorrow, but today?”
Click here to download
/66
/
Recent FIDIC policy documents
Tackling the global water crisis - State of the World 2020-2021
Water, it falls from the sky, runs in our rivers, fills our lakes, waters our crops and flows through our infrastructure, yet it is more than a monetary product. Yes, having explored the value of water in our second State of the World report, we explore the flip side of this equation. The environment we live in, the pollution that has historically occurred and minimising such pollution in the future, is becoming more important day by day. The SDGs make this clear, but how can industry stand up and lead the way.
Click here to download
Establishing the value of water - State of the World 2020-2021

Water is vital to so many aspects of life, but investment into the infrastructure, environmental mitigations and resilience aspects of this sector for the wellbeing of humans, the environment, food production, energy etc are not sufficient.
This State of the world report therefore asks a very important question what the value of water is, is it valued incorrectly, how this will change and will this finally drive the investment required to meet the SDGs.
Click here to download
Time to Tn-vest - State of the World 2020-2021
FIDIC as part of this report makes three recommendations for creating investment certainty, to create an SDG capital envelope and to reinvigorate efforts to truly shift to holistic and sustainable investment. These will help industry to move the industry forward and generate positive momentum.


It is therefore Time to Take The Trillion Task seriously, yes one T for every trillion that is estimated to be needed as a minimum to meet the SDG requirements. It is Time to Tn-vest
Click here to download
/67
FIDIC
/
Recent
policy documents
International Federation of Consulting Engineers (FIDIC)
World Trade Center II, Geneva Airport P.O. Box 311 CH-1215 Geneva 15 - Switzerland
Tel. +41 22 568 0500
Secretariat author/editor: Graham Pontin - Head of Economic and Strategic Policy, FIDIC.
Email: fidic@fidic.org Website: www.fidic.org Disclaimer
This document was produced by FIDIC and is provided for informative purposes only. The contents of this document are general in nature and therefore should not be applied to the specific circumstances of individuals. Whilst we undertake every effort to ensure that the information within this document is complete and up to date, it should not be relied upon as the basis for investment, commercial, professional, or legal decisions.
FIDIC accepts no liability in respect to any direct, implied, statutory and/or consequential loss arising from the use of this document or its contents. No part of this report may be copied either in whole or in part without the express permission of FIDIC in writing.
Endnotes
[i] FIDIC, Time to $Tn-vest, accessed 3/11/2022 (click here)
[ii] United Nations Convention against Corruption, accessed 15/11/2022 (click here)
[iii] United Nations, Global Cost of Corruption at Least 5 Per Cent of World Gross Domestic Product, Secretary-General Tells Security Council, Citing World Economic Forum Data, accessed 26/10/2022 (click here)
[iv] ILO, Construction employment data, accessed 25/10/2022 (click here)
[v] UNDP, Anti-Corruption, accessed 15/11/2022 (click here)
[vi] United Nations, Global Cost of Corruption at Least 5 Per Cent of World Gross Domestic Product, Secretary-General Tells Security Council, Citing World Economic Forum Data, 10 September 2018, accessed 5 November 2020 <https://www.un.org/press/en/2018/sc13493.doc.htm>; Reuters, IMF: Global corruption costs trillions in bribes, lost growth, 12 May 2016, accessed 5 November 2020, <https://www.reuters.com/article/us-imf-corruption-idUSKCN0Y22B7>
[vii] World Economic Forum, The world is facing a $15 trillion infrastructure gap by 2040. Here’s how to bridge it, 11 April 2019, accessed 5 November 2020 <https://www.weforum.org/agenda/2019/04/infrastructuregap-heres-how-to-solve-it/>
[viii] United Nations Convention Against Corruption 2004, Preamble <https://www.unodc.org/unodc/en/ treaties/CAC/>
[ix] PwC, Global Economic Crime and Fraud survey, (click here 2018) (click here 2016)
[x] WEF, The Global Competitiveness Report 2018, Table 1.1 (click here)
[xi] Transparency.org, Corruption Perceptions Index, accessed 19/10/2022 (click here)
[xii] Transparency.org, Corruption Perceptions Index 2021, accessed 19/10/2022 (click here)
[xiii] Transparency.org, Corruption Perceptions Index 2021, accessed 19/10/2022 (click here)
[xiv] Transparency.org, Corruption Perceptions Index 2021, accessed 19/10/2022 (click here)
[xv] World Bank, GDP per capita, PPP (constant 2017 international $), accessed 19/10/2022 (click here)
[xvi] World Bank, Industry (including construction), value added per worker (constant 2015 US$), accessed 19/10/2022 (click here)
[xvii] World Bank, Foreign direct investment, net inflows (BoP, current US$), accessed 19/10/2022 (click here)
[xviii] ILO, Construction employment data, accessed 25/10/2022 (click here)
/68
[xix] United Nations, Global Cost of Corruption at Least 5 Per Cent of World Gross Domestic Product, Secretary-General Tells Security Council, Citing World Economic Forum Data, accessed 26/10/2022 (click here)
[xx] Transparency International (2011) “Bribe Payers Index 2011 - Report” Transparency International (TI), Berlin, Germany.
[xxi] Stifi, A.; Gehbauer, F. and Gentes, S. (2017) “Lean Anti-Corruption Toolkit” Lean and Computing in Construction LC3 Congress, Heraklion, Greece.
[xxii] Kunz, J. and Fischer, M. (2012) “Virtual Design and Construction: Themes, Case Studies and Implementation Suggestions” Center for Integrated Facility Engineering (CIFE); Working Paper 097, Stanford University, UK.
[xxiii] Nakagawa, Y. (2006) “Real Time Performance Information System Using Mobile Phones” International Group for Lean Construction Conference IGLC 14, Santiago, Chile.
[xxiv] Moser, L. and Santos, A. (2003) “Applying Visual Management on Mobile Cell Manufacturing: A Case Study on Drywall Technology” International Group for Lean Construction Conference IGLC 11, Virginia, USA.
[xxv] RPC, MDBs & IFIs: The Unspoken Giants in the Global Fight Against Corruption, accessed 1/11/2022 (click here)
[xxvi] World Bank blogs, Can artificial intelligence stop corruption in its tracks?, Accessed 1/11/2022 (click here)
[xxvii] World Bank, combatting corruption, accessed 1/11/2022 (click here)
[xxviii] World Bank, Corruption has modernized, so should anticorruption initiatives, Accessed 1/11/2022 (click here)
[xxix] EIB, EIB Group Anti-Fraud Policy, accessed on 1/11/202 (click here)

[xxx] EIB, combatting fraud and corruption in EIB’s operations, accessed 1/11/2022 (click here)
[xxxi] African Development Bank, Integrity and Anti-Corruption, accessed 1/11/2022 (click here)
[xxxii] UN, Your right, your role: Say no to corruption, accessed 15/11/2022 (click here)
/69