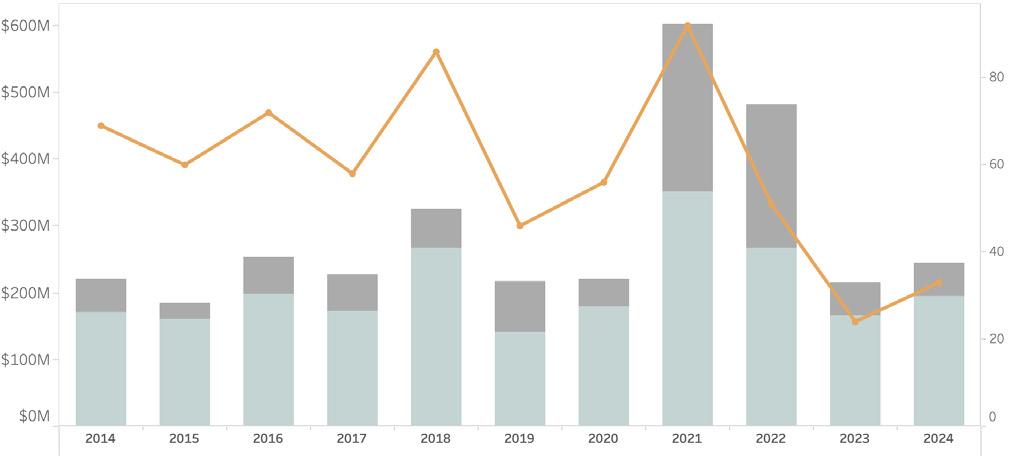
After historically low activity in March, the Nantucket real estate market rebounded in April to close 19 transactions totaling $50M. This is notably higher than the nine transactions that measured $38M in March but well below the five-year average of 34 transactions totaling $122M. April transactions brought year-to-date figures to 61 property sales amounting to $245M, a 0 percent change in the number of units sold during this time in 2023, but an increase of 13 percent in total dollar volume. New contract volume also showed a significant improvement during April with 23 new purchase contracts. Interestingly, price changes also doubled, suggesting current pricing isn’t aligning with buyers. On the inventory front, there were 180 properties publicly listed by the end of April, an increase of 55 percent from this time one year ago and perhaps why we are seeing an increase in price adjustments. Here are Fisher’s April Market Insights…
KEY MARKET METRICS
NANTUCKET REAL ESTATE ACTIVITY THROUGH APRIL 2014 - 2024
MONTHLY SALES HIGHLIGHTS


(508) 228–4407 21 MAIN STREET, NANTUCKET, MASSACHUSETTS 1
ESTATE
Market Insights BY JEN ALLEN NANTUCKET REAL
FISHER’S
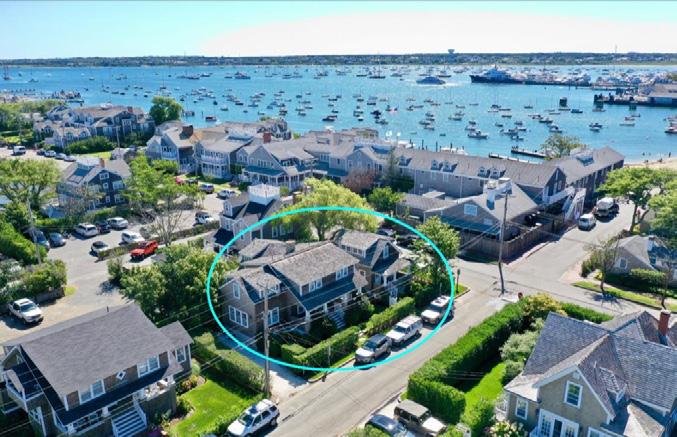
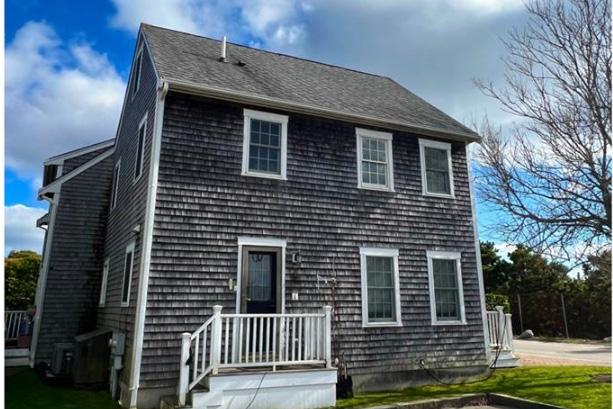
$4,950,000 1 WALSH STREET MARKETED FOR [68 Days] $1,425,000 42-44 CENTER STREET #2 MARKETED FOR [4 Days] $900,000 1A PARK CIRCLE MARKETED FOR [125 Days] HIGHEST RESIDENTIAL SALE HIGHEST COMMERCIAL SALE
APRIL ‘24 REVIEW
ALL PROPERTY TYPES 2024 2023 % CHANGE YOY 5-YEAR AVG. Transactions 61 61 0% r 110 Dollar Volume ($ in 000s) $244,502 $215,525 13% d $328,156 Months on Market 2.3 2.8 -18% f 4.8 Sale Price to Last Ask 96% 98% -2 f 5% Active Listings 180 116 55% d 160 Projected Absorption 7.4 3.6 107% d 5.0 New Monthly Contracts 23 15 53% d 28
LOWEST HOME SALE Dollar Volume # of Transactions
Dollar Volume per Quarter Q2YTD Q1 # of Transactions
Market Insights BY
JEN ALLEN
SINGLE FAMILY HOME SALES
RESETTING TO A NEW NORMAL
• For the last few years, we’ve witnessed a depletion of inventory amidst record sales volume. This trend appears to be changing on both fronts with transaction activity on the decline and inventory levels on the rise. Inventory levels for all property types increased 55 percent from this time last year and were at their highest levels since 2020.
• As of April 30, 2024, there were just 180 properties listed for sale including residential (149), commercial (5) and vacant land (26) listings. The total months’ supply, or how long it would take to sell all listings based on trailing 12-month sales, measured slightly higher than seven months, nearly four months higher than at this time last year due both to slower transaction activity and this rise in inventory.
• For residential properties, every price point saw an increase in inventory from 2023 aside from properties listed for sale between $5 million and $6 million. The price points which saw the biggest year-over-year increases were properties priced between $1 million and $3 million and $7 million to $10 million.
CONTRACT ACTIVITY

• It appears the market may be settling back down to a far more moderated level of activity after the 2021 & 2022 heights, recently even falling below pre2020 levels. Through April 30th, 2024, there were 50 single-family homes sales, two more than during the same period one year ago but 62 percent lower than the same period in 2021 and 40 percent lower than in 2022. For the five-year period between 2015-2019, the average number of homes sold during this period was 74.
• While overall transaction volume for single-family homes was down from 2021 & 2022, the average home sale price continued to rise early in 2024. Through April 30, the average home sale value was $4.21 million, 21 percent higher than the five-year average of $3.45 million. This is partially due to the number of higher end sales that occurred in the first four months of this year compared to previous years, but also the continued impact of strong demand (particularly in certain price points) versus historically limited supply.
PROPERTY INVENTORY
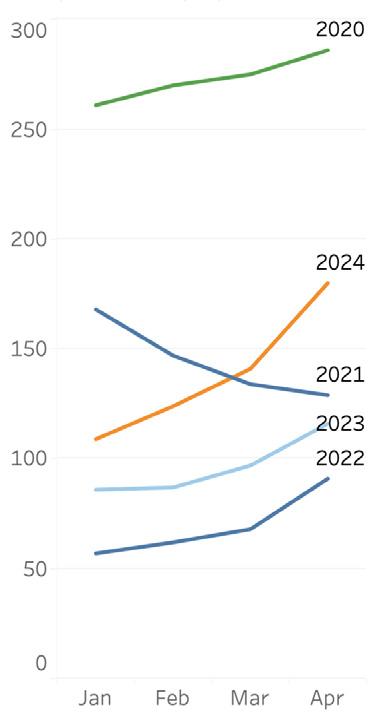
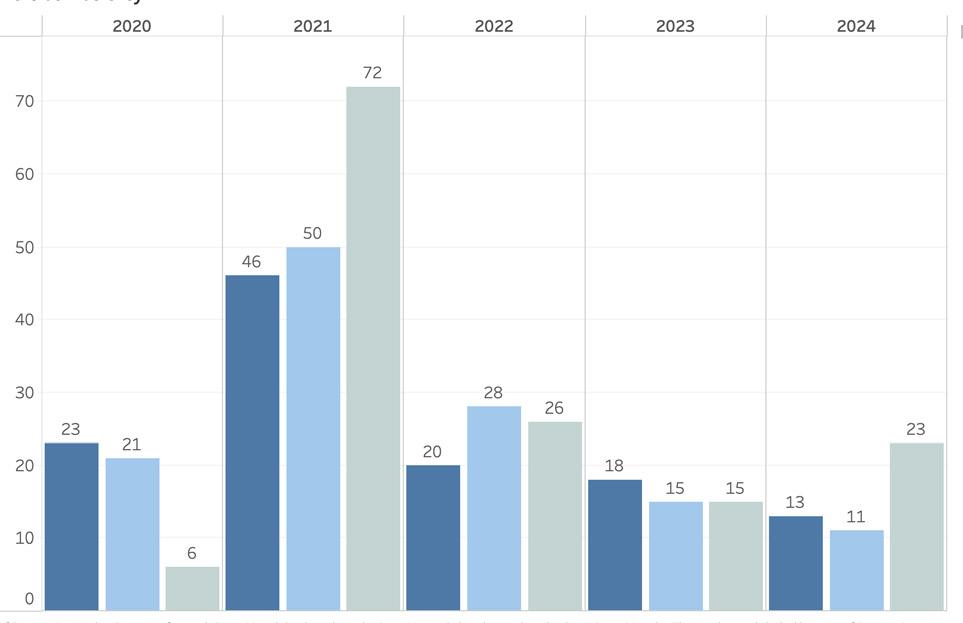
• During the month of April, there were 23 new purchase contracts recorded. This is double the number we saw in March ’24 and healthily above the 15 we saw in April ’23. It’s clearly well below the peak of 72 contracts in April of 2021 and still below the pre-pandemic pace of 35 when there was significantly more inventory.
• Of the contracts that were publicly recorded during April, the majority were for properties last listed between $1 million and $3 million (which tracks with previous years’ activity) while one contract was executed for a property listed above $10 million (slightly lower than the five-year average).
• During the 30-day period ending April 30, 2024, there were 18 price reductions compared to seven price reductions at this time last year. The average price reduction (from original list price) was 10 percent, which is on par with the averages we usually see in price reduction activity. We’ll see whether these price reductions spur sales activity amidst what we expect to be a continued rise in inventory ahead of the summer season.
(508) 228–4407 21 MAIN STREET, NANTUCKET, MASSACHUSETTS 2 2
FISHER’S
2024 2023 % Change 5 Year Avg. Transactions 50 48 4% d 73 Total Sales Dollar Volume $206,215,000 $177,830,500 16% d $249,501,382 Avg. Selling Price $4,208,469 $3,704,802 14% d $3,458,597 Median Selling Price $3,252,500 $2,600,000 25% d $2,527,250 Avg. Months on Market 2.4 3.0 -20% f 5.3 Avg. Price as % of Last Ask 96% 96% 0 r 95% Avg. Price as % of Original Ask 91% 93% -2 f 91% Avg. Price as % of Assessed Value 137% 147% -10 f 143%
THE RISE
(ALL TYPES) INVENTORY LEVELS ON
ACTIVITY UP FROM 1Q24 # of Records 2020 2021 2022 2023 2024 Inventory Year: # of Contracts February April March
PURCHASE


