Market Insights BY
KEY MARKET METRICS
JEN ALLEN
NANTUCKET REAL ESTATE ACTIVITY
MONTHLY SALES HIGHLIGHTS

(508) 228–4407 21 MAIN STREET, NANTUCKET, MASSACHUSETTS 1
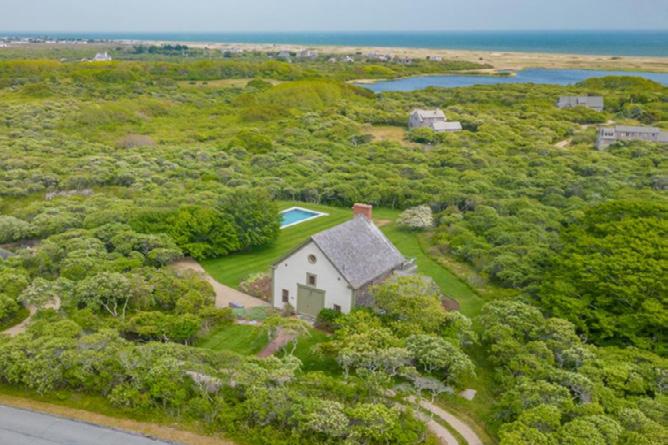
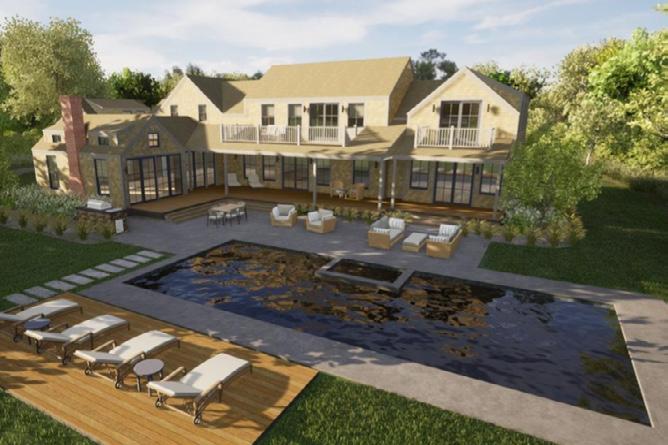
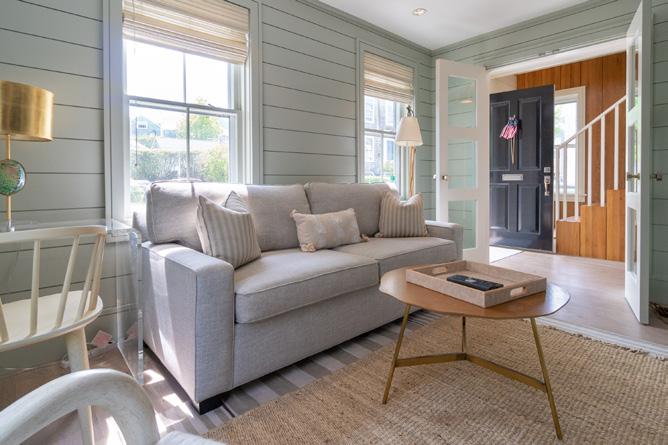
$9,300,000 2B LONGWOOD DRIVE MARKETED FOR [91 Days] $3,725,000 42B UNION STREET SOLD FOR $2.4M IN 2020 $6,200,500 42 CHUCK HOLLOW ROAD SOLD $210K OVER ASKING PRICE HIGHEST SALE RESIDENTIAL RESALE
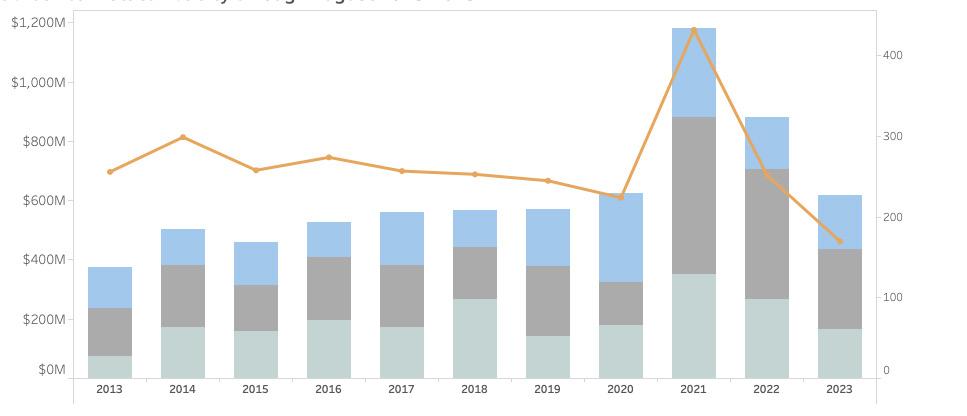
ALL PROPERTY TYPES 2023 2022 % CHANGE YOY 5-YEAR AVG. Transactions 170 252 -33% f 281 Dollar Volume ($ in 000s) $615,534 $866,948 -29% f $761,787 Months on Market 3 2.8 7% d 5.6 Sale Price to Last Ask 97% 97% 0 r 95% Active Listings 165 160 3% d 319 Projected Absorption 5 3.5 36% d 9.6 New Monthly Contracts 52 43 21% d 81 Dollar Volume # of Transactions
THROUGH AUGUST 2013 - 2023
OVER-ASK SALE Dollar Volume per Quarter Q2 Q1 # of Transactions Q3 YTD
Market Insights BY JEN ALLEN
RESIDENTIAL SALES ACTIVITY
• Single-family home sales (excluding condos, co-ops & 40B or covenant properties) totaled 122 transactions through August, down from 159 sales one year ago and 177 sales for the five-year average. Cumulative dollar volume declined by 26 percent and measuring just over $500 million. For comparison, in 2021, the market already surpassed $1.1 billion by this point in the year but the five-year average for the period is $605 million.
• The average home sale price continued to climb above $4 million while the median home sale value dropped below to the $3.195 million from 2022 to $2.825 million at the end of August. This can largely be attributed to the price point of available inventory for sale and less to do with the fact that home prices are declining, though we are keeping an eye on resales to ensure we have a pulse on pricing. The three resales that took place during August suggest a wide range of annualized returns, ranging from 9 percent to 22 percent. One reflects a positive resale within 12 months, indicating prices are still increasing in most cases.
RESIDENTIAL SALES ANALYSIS BY PRICE POINT
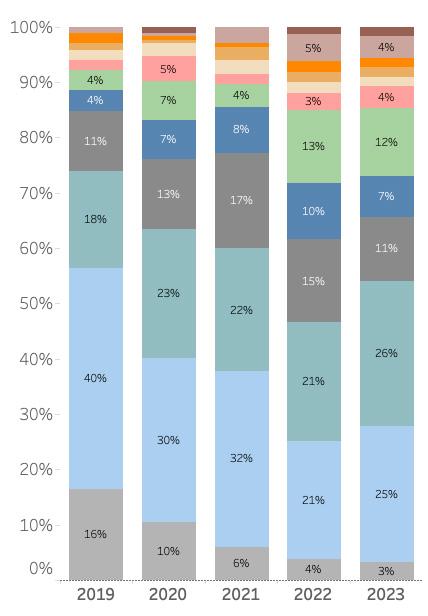
• In reviewing residential sales activity by price point through August, the percentage of sales by million-dollar segment is very similar to 2022. Interestingly, the most significant increase in transaction activity as a percentage of total activity was for single-family home sales between $1 million and $2 million, which rose a combined eight percentage points from one year ago. Sales between $3 million and $4 million were down the most significantly of the price points, while sales between $10 million and $20 million were down modestly with just three fewer transactions so far this year (but a potentially big contributor to aggregate dollar volume).
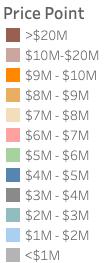
• In looking at 2023 as compared to the five-year average, it’s no surprise that the biggest decline is on the sub-$1 million price point which stood at just three percent in 2023 but was eight percent for the five-year average. The biggest increase took place between $5 million and $6 million, which represented 12 percent of market activity YTD, compared to seven percent over the last five years.
PROPERTY INVENTORY & PRICE REDUCTIONS

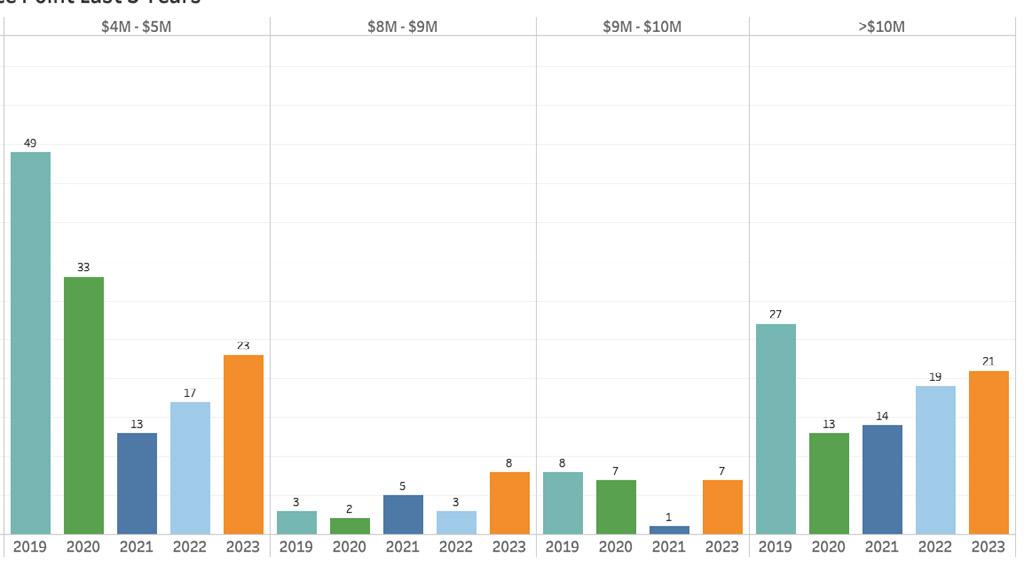
• As of August 31, 2023, there were 165 properties (residential, land & commercial) listed for sale and the total months’ supply (how long it would take to sell all listings based on trailing 12-month sales) measured five months. Naturally, the number of listed properties by price point is lower in nearly every price point. However, the number of properties between $4 million to $5 saw the most notably YOY growth and the number of listings has nearly doubled from two years ago. Listings between $8 million to $10 million also showed a distinct increase. (See chart: we include $3 million to $4 million to show the profile of most price points since 2019).
• As summer waned, the number of price changes increased, though not quite as significantly as this time last year. Through the 31 days ending August 31, 20223, there were price adjustments to 25 properties, a 39 percent decrease from the same period last year. The average price discount from the original list price was approximately 11 percent. The price adjustments spanned nearly every price point and were effective for nearly onethird of the properties as evidenced by pending contracts.
(508) 228–4407 21 MAIN STREET, NANTUCKET, MASSACHUSETTS 2 2
2023 2022 % Change 5 Year Avg. Transactions 122 159 -23% f 177 Total Sales Dollar Volume $505,009,081 $681,849,740 -26% f $605,562,092 Avg. Selling Price $4,139,419 $4,288,363 -3% f $3,480,443 Median Selling Price $2,825,000 $3,195,000 -12% f $2,536,250 Avg. Months on Market 3.0 2.9 5% d 4.9 Avg. Price as % of Last Ask 97% 97% 0 r 95% Avg. Price as % of Original Ask 94% 97% -2 f 92% Avg. Price as % of Assessed Value 174% 186% -12 f 154%
LIMITED INVENTORY IMPACTED VOLUME & PRICING
PRICE
HELD STEADY
SALES BY
POINT
INVENTORY INCREASED IN CERTAIN PRICE POINTS 2019 2020 2021 2022 2023
PROPERTY
