We’ve officially closed the books on the first half of the year and, thus far, June was the best transaction month with 20 property transfers totaling $126 million. It was also the first month of the year to officially surpass the $100 million mark, something that was far more common in recent years. June transactions included another mega high-end sale with the $24 million sale of 42 Shimmo Pond Road. While not the highest property sale on record for 2024, it marks the second transaction above $20 million, which is on par with the average for this price point over the last five years. All told, the first half of the year tallied 102 real estate transactions totaling $443 million, a respective decline of 12 percent but a rise of 2 percent from the same figures one year ago. The month of July typically marks the annual peak of property inventory for our local market so we will see if the 221 properties on the market grows from here or starts to dwindle as transaction activity picks up. Here are Fisher’s June Market Insights…
KEY MARKET METRICS
NANTUCKET REAL ESTATE ACTIVITY THROUGH JUNE 2014 - 2024
MONTHLY SALES HIGHLIGHTS
Market Insights BY
JEN ALLEN
RESIDENTIAL SALES ACTIVITY
• In a market with pockets of constrained inventory, there are numerous buyers chasing properties with similar characteristics. Which is why, despite a healthy rise in property inventory, and elevated interest rates, we are still seeing several properties per month trade at full asking price or above. In June alone, nearly a quarter of all transactions traded at 100 percent or more of the asking price, while many others were within five percent of the asking price. However, the average sale price to the original asking price declined as compared to last year reflecting some mispricing or shifting values across the market where demand may be waning.
• As has been the case the last three years, purchase contracts have limited contingencies and often solely include an inspection period. We are not seeing many financing contingencies being accepted by sellers, even if buyers still plan to seek a mortgage prior to closing. For properties that have been marketed longer than a few months, the seller’s appetite to accept contingencies typically increases. So is the case as we approach the off-season, where it’s not quite as critical as tying up the property during the peak of summer.
PROPERTY INVENTORY & PRICE REDUCTIONS
• First half single-family home sales (excluding condos, co-ops & 40B or covenant properties) totaled 81 transactions, down just four percent year-over-year but over 30 percent as compared to the five-year average of 118 home sales. Despite the modest decline in transactions, aggregate dollar volume increased ten percent from 2023 and measured $385 million.
• Given the continued rise in total dollar volume, it’s not surprising to see yet another year of growth in the average home sale value, which is now approaching $5 million. As of June 30th, the average home sale value of $4.8 million reflected the doubling of transactions between $4 million to $5 million from 2023, and the tripling of sales between $10 million and $20 million. The median home sale value also saw a significant increase, rising 29 percent from one year ago to $3.55 million.
• Even though residential home inventory rose 62 percent from 2023, supply in particular price points and certain areas remained constrained relative to buyer demand. This is resulting in some instances where full-price or above full-price offers are occurring all the while other price points and areas are seeing multiple price reductions on properties to engage buyers.
CONTRACT ACTIVITY
TIGHT CONTRACTS REMAIN AMIDST INCREASING PRICE REDUCTIONS
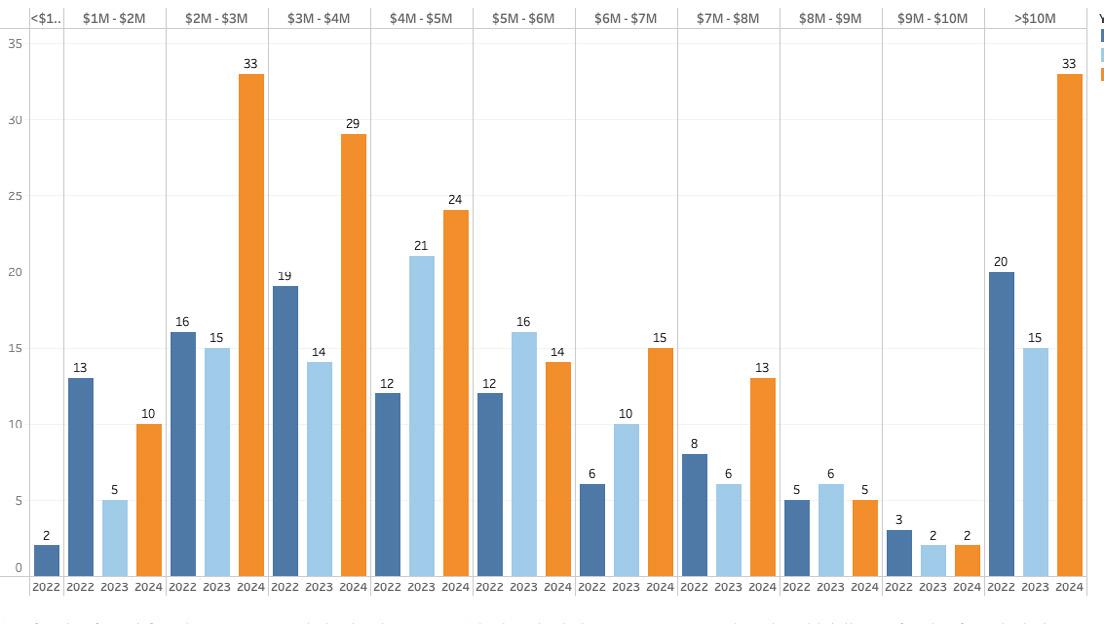
• As of June 30, 2024, there were 221 properties (residential, land & commercial) listed for sale, an increase of 91 percent from one year ago. The total months’ supply (how long it would take to sell all listings based on trailing 12-month sales) measured nearly 10 months. As we reported last month, the number of listed properties by price point is higher in nearly every price point. However, the number of properties listed between $2 million to $3 million saw the most notable YOY growth and the number of listings has doubled from two years ago. Listings above $10 million also showed a distinct increase rising to 33 listings from 15 listings at this time last year.
• As previously mentioned, certain areas of the island and certain price points are still experiencing overwhelming demand while others seem to be very quiet. Through the 30 days ending June 30, 2024, there were price adjustments to 38 properties, far more than the 14 price adjustments we saw during the same period last year. The average price discount from the original list price was approximately 12 percent. The price adjustments spanned nearly every price point and there didn’t seem to be any discernible trend by area.


