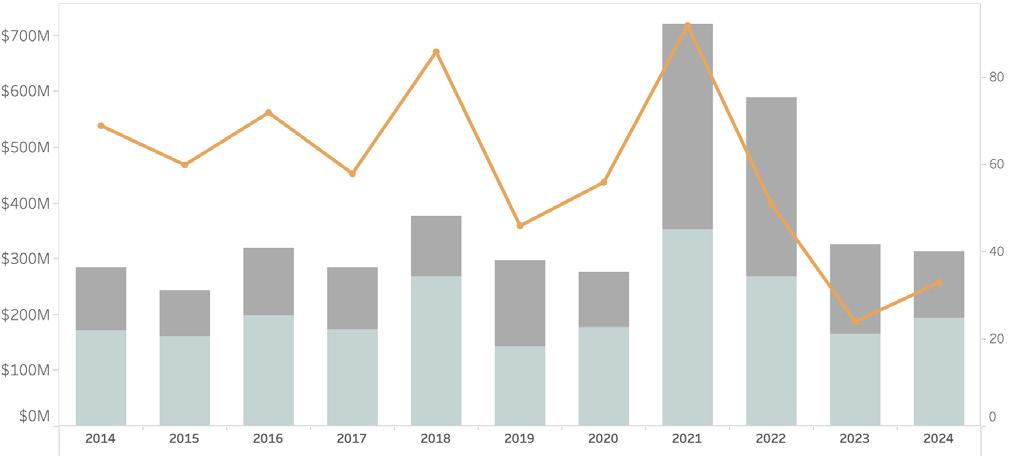
One year ago, we were writing about a $100 million sales month and multiple properties that traded for more than the last listing price. Activity has been notably different this year and May of 2024 was the first time in three years we didn’t see $100 million in transaction activity for the 31-day period. May 2024 transactions totaled $68.4 million through just 20 transactions, a decline of 38 percent and 37 percent respectively for the same month in 2023. These transactions brought year-to-date figures just over $300 million through 81 property sales, a decline of only 13 percent for transaction volume and four percent for dollar volume as compared to one year ago. On a cumulative basis, year-to-year activity is thus far relatively steady. It’s the look back to the anomaly of the 2021-2023 market and the five-year average that is stark. Here are Fisher’s May Market Insights…
KEY MARKET METRICS
NANTUCKET
SALES HIGHLIGHTS
Market Insights BY
JEN ALLEN
RESIDENTIAL SALES ACTIVITY
• In reviewing residential sales activity by price point, the most significant increase in transaction activity as a percentage of total activity was for singlefamily home sales between $4 million and $5 million, which rose 12 percentage points from one year ago. Sales between $3 million and $4 million increased to 14 percent of total transaction volume, while sales between $1 million and $2 million fell by 12 percentage points from one year ago. Most other price points were very similar to 2023.
• As compared to the five-year average, the biggest shift in price point in 2024 was home sales between $1 million to $2 million, which showed a decline of 13 percent. Home sales between $4 million to $5 million increased nine percentage points, while home sales above $10 million rose to six percent of total transaction activity from three percent over the average of the last five years.
PROPERTY INVENTORY BY PRICE POINT
• As compared to 2023, single-family home sales (excluding condos, co-ops & 40B/covenant properties) fell 11 percent through May 31, 2024, and were down 33 percent from the five-year average.
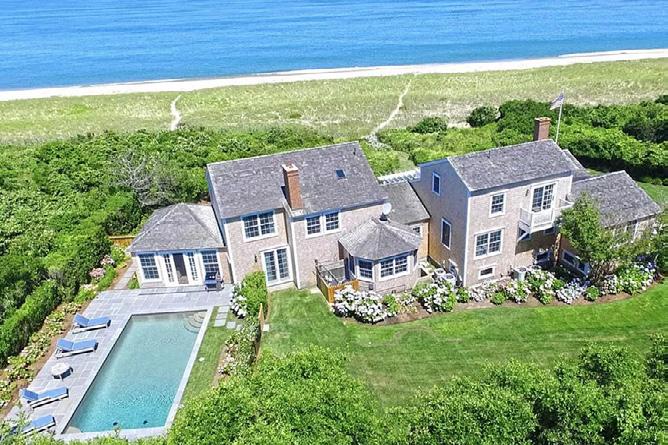
• May transactions ranged from the $1.495 million sale of a five-bedroom property on Cynthia Lane to the $10.7 million resale of a waterfront property in Squam (noted above). The latter marks the fourth highest sale of the year, a similar profile to the $10M+ sales that were on the books by this time last year. The annualized return on this sale reflected six percent since the properties last noted sale in 2020.
• Despite the relative slowdown in transaction activity and the increase in inventory, the average home sale price increased 12 percent from one year ago, while the median increased 31 percent. And both metrics were handsomely above the five-year average. This is largely due to the distribution of available home inventory which led to a decline of 49 percent in sales below $2 million.
RESIDENTIAL SALES ANALYSIS BY PRICE POINT
RISE IN $4 MILLION TO $5 MILLION HOME SALES
Number of Records
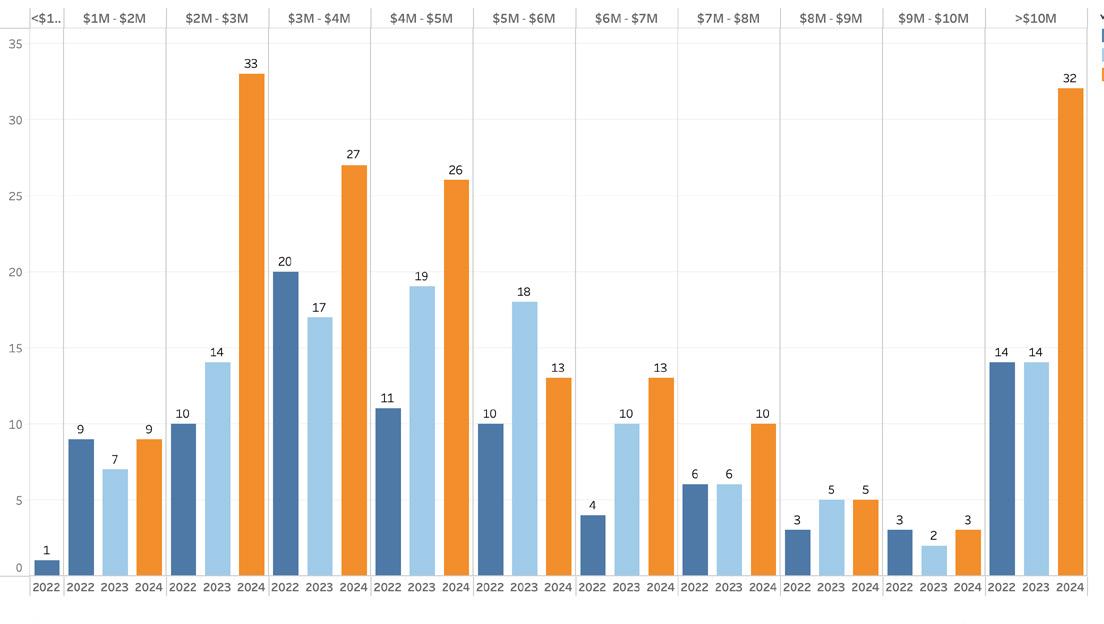
• As of May 31, 2024, there were 211 properties (residential, land & commercial) listed for sale and the total months’ supply (how long it would take to sell all listings based on trailing 12-month sales) measured nine months. This projected supply is double what it was just one year ago thanks to both a decline in sales volume and a rise in inventory.
• As compared to last year, the number of listed properties is significantly higher in many price points, most notably for homes last listed between $2 million to $3 million and above $10 million so it will be interesting to see how the summer market plays out with regard to activity in these price points and any price concessions.
