FISHER’S REVIEW

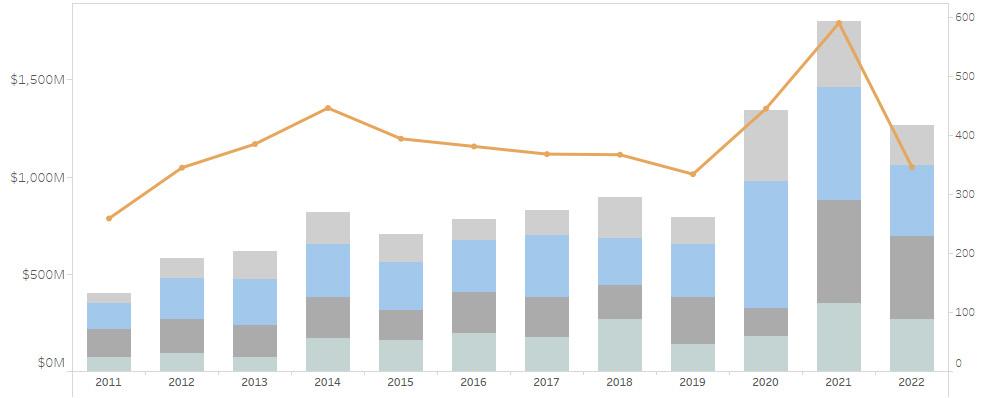
Thanks to solid activity in the upper end of the market in October, Nantucket real estate saw its highest monthly dollar volume so far this year. Monthly sales included 51 transactions totaling $207 million, slightly higher than the previous high-water market of $202 million set back in April. On a cumulative basis for the 10 months ending October 31, 2022, there were 346 property transfers totaling $1.27 billion, a decline of 41 percent and 30 percent from 2021 but a 61 percent and four percent respective increase from 2019 figures. Though singlefamily home sales were the lowest they’ve been since 2011, the value of the units sold, particularly at the high-end, contributed handsomely to year-to-date totals. In fact, the 2022 market could well approach 2020 dollar volume. Here are Fisher’s October Market Insights…


KEY MARKET STATISTICS
Transactions 346 590 -41% f 416 Dollar Volume ($ in 000s) $1,267,884 $1,802,997 -30% f $1,219,457 Avg. Months on Market 2.4 4.3 -44% f 5.1 Sale Price to Last Ask Price 97% 96% 1 d 95% Active Listings (Oct) 124 114 9% d 273 Months Supply of Inventory 3.0 1.8 73% d 8.3 New Contracts (Oct) 39 56 -30% f 112
TYPES FY 2022 FY 2021 % CHANGE
(508) 228–4407 21 MAIN STREET, NANTUCKET, MASSACHUSETTS ALL PROPERTY
YOY 5-YEAR AVG.
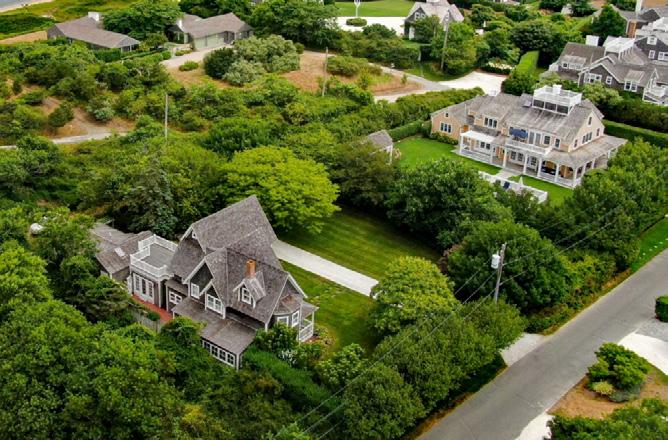
$33,000,000 63 & 63.5 HULBERT AVENUE PRIVATELY MARKETED $8,000,000 7 SHERBURNE TURNPIKE (LOT 6) PRIVATELY MARKETED $1,625,000 18 BEACHGRASS ROAD MARKETED FOR [243 Days] 1 OCT 22 Market Insights
JEN
BY
ALLEN NANTUCKET REAL ESTATE
HIGHEST RESIDENTIAL SALE HIGHEST LAND SALE
NANTUCKET
ACTIVITY
Dollar Volume # of Transactions LONGEST MARKETED PROPERTY ©2022 FISHER REAL ESTATE MONTHLY SALES HIGHLIGHTS Dollar Volume per Quarter Q2 Q1 Q4 YTD # of Transactions Q3
REAL ESTATE
THROUGH OCTOBER 2011–22
NANTUCKET REAL ESTATE
Market Insights
BY JEN ALLEN
RESIDENTIAL
SALES ANALYSIS
REDUCED OVERALL VOLUME BUT VIBRANT HIGH END
2022 2021 % Change 5-Year Avg (2018-22)
Total Transactions 224 389 -42% f 292
Total Sales Dollar Volume $992,454,762 $1,402,068,612 -29% f $984,113,326
Avg. Selling Price $4,430,602 $3,604,289 23% d $3,359,272
Median Selling Price $3,317,500 $2,800,000 18% d $2,478,500
Avg. Months on Market 2.5 3.8 -35% f 5.1
Avg. Price as % of Last Ask 97% 96% 1 d 95%
Avg. Price as % of Original Ask 96% 94% 2 d 92%
Avg. Price as % of Assessed Value 193% 158% 35d 149%
• Single-family home sales (excluding condos, co-ops & covenant properties) during the month of October measured 36 transactions totaling $267 million. Although this represents a 39 percent and 38 percent respective decline from October 2021 figures, the dollar volume remains among the highest posted during this monthly period thanks to a handful of high-end transactions. This activity brought the year-to-date total to 224 single-family home sales totaling $992 million through October 31, 2022. This represents the lowest number of homes sold since 2011, largely on account of continued low inventory levels. As a point of reference, the dollar volume for the 199 homes sold through the same period in 2011 was $326 million.
• With eight sales between $5 million and $10 million and two sales above $10 million, October transactions contributed to what continues to be an epic period for high end property sales on the island (see more information in the next section). As a result, the average home sale price saw another substantial rise, increasing 23 percent from 2021 to $4.4 million. The median home sale value jumped 19 percent to $3.3 million. This represents a respective 30 percent and 34 percent increase in these metrics over the five-year average.
• October property sales were notable not just for high-end transactions but also for a continued, rapid decline in marketing times. On average, properties that sold in October were marketed for 51 days, nearly two months faster than one year ago and slightly faster than the yearto-date average of 114 days. The speed at which properties transacted resulted in reduced negotiability from one year ago. Homes traded for an average of 97 percent of their last list price and 96 percent of the original price, a rise of one and two percent respectively.
NANTUCKET PROPERTY INVENTORY
SLIGHT INCREASE IN AVAILABLE INVENTORY
HIGH-END RESIDENTIAL SALES ANALYSIS

HIGH-END SALES RIVAL 2020 & 2021 ACTIVITY
$5M–$10M >$10M Transactions
2012 14 $98,300,000 2 $29,800,000
2013 8 $58,766,300 6 $80,029,000
2014 16 $98,887,500 5 $66,137,500
2015 11 $73,648,875 6 $82,000,000
2016 18 $123,185,502 7 $90,525,000
2017 23 $158,752,750 8 $101,290,000
2018 29 $186,472,000 8 $107,640,000
2019 24 $160,585,000 2 $30,670,000
2020 55 $351,427,175 10 $175,372,500
2021 49 $338,084,150 18 $260,040,000
2022 48 $312,165,611 16 $260,175,000
• Despite overall home sale transaction volume declines that were severely reduced from 2020 & 2021 levels, the 2022 high-end of the market continued to hold strong. Monthly sales were led by the second highest property sale of the year, the $33 million waterfront sale of 63 & 63.5 Hulbert Avenue. There was also a $10.45 million sale on Cliff Road, as well as 11 additional sales between $5 million and $10 million (two of which were land sales but are mentioned as they will most certainly be developed into residences).
• As of October 31, 2022, there were 48 property transactions between $5 million and $10 million, nearly identical to the volume from 2021 but substantially above the historic activity prior to 2020. The ultra-high-end segment, or sales above $10 million, saw 16 transactions, down two sales from 2021 but six higher than in 2020. These sales contributed $572 million to aggregate sales volume, roughly 45 percent of year-to-date dollar volume.
• Even with this solid transaction activity, inventory levels at the upper end of the market are higher than in 2021 in some price points. This is true for properties listed between $6 million and $8 million, and properties listed for more than $10 million. Some of this new inventory stems from speculative development properties in the mid-island area (i.e. the newly created Maple Lane subdivision). Overall, however, even at the upper end of the market, inventory levels are well below pre-pandemic figures.
CONTRACT ACTIVITY
NEW PURCHASE ACTIVITY TRAILED 2019 LEVELS

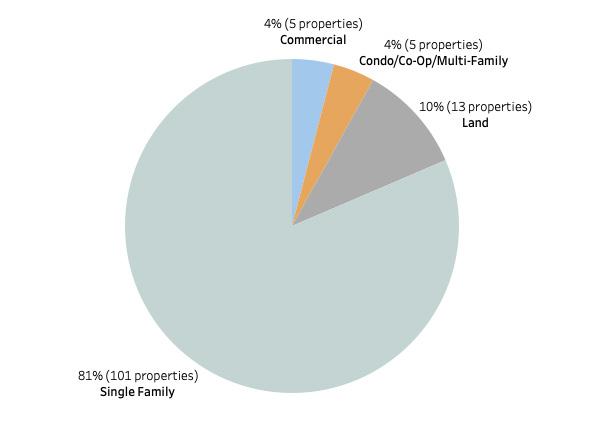
• Although property inventory remained at historic lows, there was a slight increase from 2021 levels. As of October 31, 2022, there were just 124 properties listed for sale including residential, commercial, and vacant land listings. This represents a whopping 10 more properties than were listed at this time last year, so the increase is incredibly modest. The total months’ supply, or how long it would take to sell all listings based on trailing 12-month sales, measured three months for residential properties, less than one month for vacant land and three months for commercial properties.
• As previously mentioned, nearly every price point had markedly less inventory than one year ago. Aside from the slight increases in inventory in certain higher end price points, properties listed between $2 million to $3 million also saw a very small increase. The price points that have seen the most substantial declines since 2019 levels were in the $2 million to $4 million range.
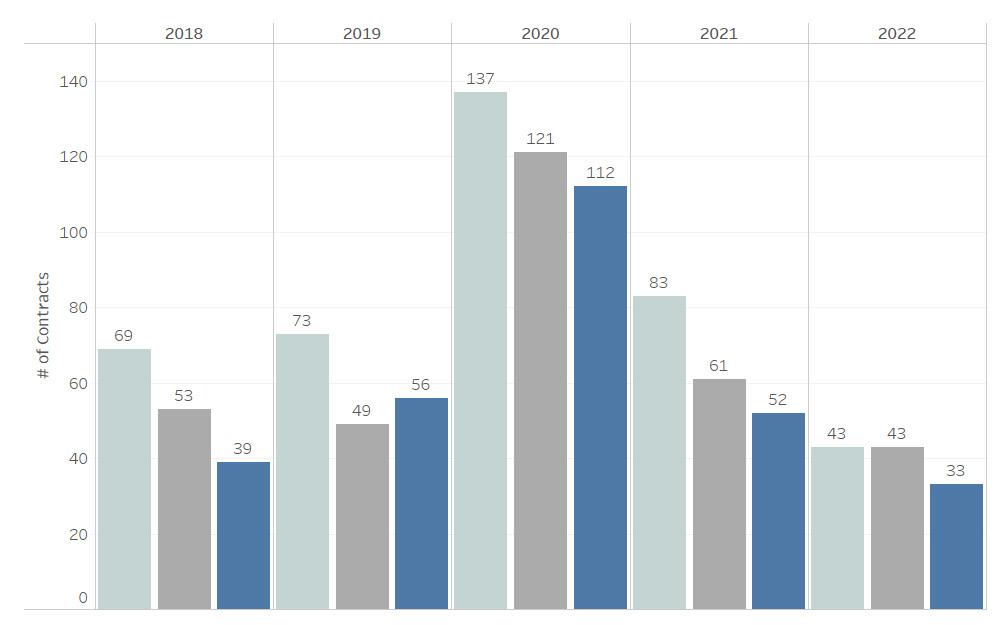
• Whether it was due to limited inventory, stock market volatility, rising interest rates, or some combination of these factors, monthly contract activity was well off prior year’s volumes. Recorded contracts (Offers to Purchase and Purchase & Sale Contracts excluding duplicates) for the monthly period ending October 31, 2022, totaled just 33 properties, down from the 52 reported one year ago and down from 112 contracts in October 2020. (Preliminary data shows this rebounded in November 2022).
• Most of the contracts booked in October, 46 percent, were for properties last priced between $1 million and $2 million, notably higher than the 21 percent for this segment in 2021. New contracts for properties listed between $2 million to $3 million declined by nearly 10 percent from one year ago, while sales above $5 million continued to show solid activity as we approach year’s end.
• Considering preliminary November sales data shows $170 million in recorded sales, and accounting for the December sales pipeline, the Nantucket market will definitely surpass $1.5 billion but will likely fall short of the $1.85 billion from 2020 and certainly the $2.3 billion from 2021.
MASSACHUSETTS 2 2
(508) 228–4407 21 MAIN STREET, NANTUCKET,
OCT 22
Total Sales Volume Transactions Total Sales Volume
August October September
Market Insights
BY JEN ALLEN
RESIDENTIAL SALES ANALYSIS
REDUCED OVERALL VOLUME BUT VIBRANT HIGH END
2022 2021 % Change 5-Year Avg (2018-22)
Total Transactions 224 389 -42% f 292
Total Sales Dollar Volume $992,454,762 $1,402,068,612 -29% f $984,113,326
Avg. Selling Price $4,430,602 $3,604,289 23% d $3,359,272
Median Selling Price $3,317,500 $2,800,000 18% d $2,478,500
Avg. Months on Market 2.5 3.8 -35% f 5.1
Avg. Price as % of Last Ask 97% 96% 1 d 95%
Avg. Price as % of Original Ask 96% 94% 2 d 92%
Avg. Price as % of Assessed Value 193% 158% 35d 149%
• Single-family home sales (excluding condos, co-ops & covenant properties) during the month of October measured 36 transactions totaling $267 million. Although this represents a 39 percent and 38 percent respective decline from October 2021 figures, the dollar volume remains among the highest posted during this monthly period thanks to a handful of high-end transactions. This activity brought the year-to-date total to 224 single-family home sales totaling $992 million through October 31, 2022. This represents the lowest number of homes sold since 2011, largely on account of continued low inventory levels. As a point of reference, the dollar volume for the 199 homes sold through the same period in 2011 was $326 million.
• With eight sales between $5 million and $10 million and two sales above $10 million, October transactions contributed to what continues to be an epic period for high end property sales on the island (see more information in the next section). As a result, the average home sale price saw another substantial rise, increasing 23 percent from 2021 to $4.4 million. The median home sale value jumped 19 percent to $3.3 million. This represents a respective 30 percent and 34 percent increase in these metrics over the five-year average.
• October property sales were notable not just for high-end transactions but also for a continued, rapid decline in marketing times. On average, properties that sold in October were marketed for 51 days, nearly two months faster than one year ago and slightly faster than the year-to-date average of 114 days. The speed at which properties transacted resulted in reduced negotiability from one year ago. Homes traded for an average of 97 percent of their last list price and 96 percent of the original price, a rise of one and two percent respectively.
OCT 22 (508) 228–4407 21 MAIN STREET, NANTUCKET, MASSACHUSETTS 3
NANTUCKET REAL ESTATE
Market Insights
HIGH-END RESIDENTIAL SALES ANALYSIS
HIGH-END SALES RIVAL 2020 & 2021 ACTIVITY
$5M–$10M
Transactions
Total Sales Volume
>$10M
Transactions
BY JEN ALLEN
Total Sales Volume
2012 14 $98,300,000 2 $29,800,000 2013 8 $58,766,300 6 $80,029,000 2014 16 $98,887,500 5 $66,137,500 2015 11 $73,648,875 6 $82,000,000 2016 18 $123,185,502 7 $90,525,000 2017 23 $158,752,750 8 $101,290,000 2018 29 $186,472,000 8 $107,640,000 2019 24 $160,585,000 2 $30,670,000 2020 55 $351,427,175 10 $175,372,500 2021 49 $338,084,150 18 $260,040,000 2022 48 $312,165,611 16 $260,175,000
• Despite overall home sale transaction volume declines that were severely reduced from 2020 & 2021 levels, the 2022 high-end of the market continued to hold strong. Monthly sales were led by the second highest property sale of the year, the $33 million waterfront sale of 63 & 63.5 Hulbert Avenue. There was also a $10.45 million sale on Cliff Road, as well as 11 additional sales between $5 million and $10 million (two of which were land sales but are mentioned as they will most certainly be developed into residences).
• As of October 31, 2022, there were 48 property transactions between $5 million and $10 million, nearly identical to the volume from 2021 but substantially above the historic activity prior to 2020. The ultra-high-end segment, or sales above $10 million, saw 16 transactions, down two sales from 2021 but six higher than in 2020. These sales contributed $572 million to aggregate sales volume, roughly 45 percent of year-to-date dollar volume.
• Even with this solid transaction activity, inventory levels at the upper end of the market are higher than in 2021 in some price points. This is true for properties listed between $6 million and $8 million, and properties listed for more than $10 million. Some of this new inventory stems from speculative development properties in the mid-island area (i.e. the newly created Maple Lane subdivision). Overall, however, even at the upper end of the market, inventory levels are well below pre-pandemic figures.
NANTUCKET
OCT 22 (508) 228–4407 21 MAIN STREET, NANTUCKET, MASSACHUSETTS 4
REAL ESTATE
Market Insights
NANTUCKET PROPERTY INVENTORY
SLIGHT INCREASE IN AVAILABLE INVENTORY
BY JEN ALLEN
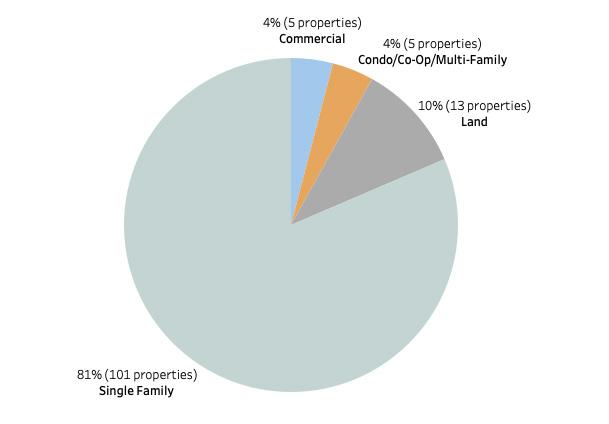
• Although property inventory remained at historic lows, there was a slight increase from 2021 levels. As of October 31, 2022, there were just 124 properties listed for sale including residential, commercial, and vacant land listings. This represents a whopping 10 more properties than were listed at this time last year, so the increase is incredibly modest. The total months’ supply, or how long it would take to sell all listings based on trailing 12-month sales, measured three months for residential properties, less than one month for vacant land and three months for commercial properties.
• As previously mentioned, nearly every price point had markedly less inventory than one year ago. Aside from the slight increases in inventory in certain higher end price points, properties listed between $2 million to $3 million also saw a very small increase. The price points that have seen the most substantial declines since 2019 levels were in the $2 million to $4 million range.
(508) 228–4407 21 MAIN STREET, NANTUCKET, MASSACHUSETTS 5
NANTUCKET REAL ESTATE OCT 22
Market Insights
CONTRACT ACTIVITY
NEW PURCHASE ACTIVITY TRAILED 2019 LEVELS
 BY JEN ALLEN
• Whether it was due to limited inventory, stock market volatility, rising interest rates, or some combination of these factors, monthly contract activity was well off prior year’s volumes. Recorded contracts (Offers to Purchase and Purchase & Sale Contracts excluding duplicates) for the monthly period ending October 31, 2022, totaled just 33 properties, down from the 52 reported one year ago and down from 112 contracts in October 2020. (Preliminary data shows this rebounded in November 2022).
• Most of the contracts booked in October, 46 percent, were for properties last priced between $1 million and $2 million, notably higher than the 21 percent for this segment in 2021. New contracts for properties listed between $2 million to $3 million declined by nearly 10 percent from one year ago, while sales above $5 million continued to show solid activity as we approach year’s end.
• Considering preliminary November sales data shows $170 million in recorded sales, and accounting for the December sales pipeline, the Nantucket market will definitely surpass $1.5 billion but will likely fall short of the $1.85 billion from 2020 and certainly the $2.3 billion from 2021.
(508) 228–4407 21 MAIN STREET, NANTUCKET, MASSACHUSETTS 6
NANTUCKET REAL ESTATE OCT 22
August October September


 BY JEN ALLEN