City of Doral


Industrial Market
According to Cushman & Wakefield’s 4Q 2016 MarketBeat, the industrial market ended the fourth quarter with strong improvement in key statistics. The overall vacancy rate was 4.3 percent, down 170 BPS from last year.
16
Submarket Total Buildings Inventory (SF) YTD Investor Sales Activity Overall Vacancy Rate YTD Overall Net Absorption (SF) Under Construction (SF) YTD Construction Completions (SF) Overall Weighted Average Net Rent (MF) Overall Weighted Average Net Rent (OS) Overall Weighted Average Net Rent (W/D) Airport West 759 45,763,121 2,239,133 4.0% 1,313,151 1,762,183 944,466 $5.95 $13.51 $8.15 Airport North/Medley 424 31,402,066 389,126 2.8% 118,987 720,622 65,820 $4.41 $12.13 $7.80 North Central Dade 435 28,703,509 585,845 4.9% (110,688) - - $7.92 $9.03 $6.55 Northeast Dade 30 1,233,032 68,460 0.3% 14,480 - - $0.00 $12.50 $13.50 Northwest Dade 1 243,296 - 50.0% 0 1,135,835 - $0.00 $0.00 $6.45 Miami Lakes 36 1,976,626 541,684 11.5% 41,513 - 82,000 $0.00 $7.45 $7.33 Hialeah 259 8,055,202 221,494 2.1% (41,300) - 486,592 $6.50 $0.00 $4.25 Airport East/Downtown 594 26,509,551 949,967 6.5% 394,228 602,000 175,000 $6.69 $25.25 $9.84 South Dade 201 7,854,243 346,206 2.7% 466,508 - - $15.00 $8.22 $8.63 MIAMI-DADE TOTALS 2,739 151,740,646 5,341,917 4.3% 2,196,879 4,220,640 1,626,819 $6.65 $12.44 $8.01 *Rental rates reflect asking $psf/year MF = Manufacturing OS = Office Service/Flex W/D = Warehouse/Distribution Source: Cushman & Wakefield, MarketBeat, Industrial Report, 4Q 2016.
Key expansions by current tenants and firms new to the market drove occupancies at existing buildings and were the forces behind the surge in new construction. Direct asking triple net rents closed at $9.28 per square foot on tightening vacancies and a number of new Class A projects that came to market with above market rents.
According to Cushman & Wakefield, there were two significant changes in Miami-Dade’s industrial market in 2017. First, the creation of a new submarket called Northwest Dade encompassing the cluster of new development north of Okeechobee Road along the Florida Turnpike. The second development was the accelerated transformation of the Wynwood section of the Airport East/Downtown submarket. Conversions of dated industrial space into retail storefronts or mixed use projects in that area has not only pushed asking rates up but also led to a surge in investment sales.
Leasing activity year-to-date totaled over 6.8 million square feet (SF) with the majority of space leased in three submarkets: Northwest Dade, Airport West, and North Central Dade. Warehouse/distribution accounted for almost all of the leasing activity as well as being 60.0 percent of the 4.2 million SF in total space currently under construction. At year end, close to 27.0 percent of all space under construction was in the Northwest Dade submarket.
Investors’ sustained interest with industrial product in Miami-Dade has been due to the increasing levels of trade and growing consumer market. There was 5.7 million SF sold in 2016 with 93.0 percent of sales in investment properties. New ownership was one factor, together with a tight market, that pushed rental rates up aggressively during the year.
Miami-Dade’s industrial market demonstrated strength in underlying drivers and positive advancement in several key statistics. Projected job growth, further consumer demand and continued trade will underpin the market’s industrial inventory through 2017. Even with the introduction of new inventory, Cushman & Wakefield anticipates improvement with asking rents as space from new construction hits the market and provides tenants with more options in a tight market.
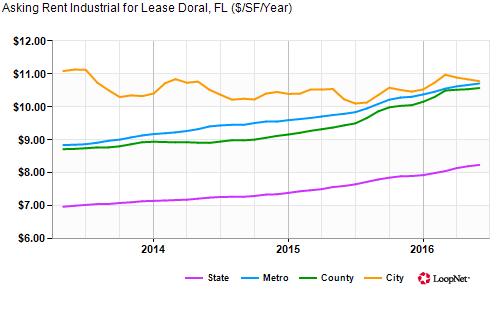
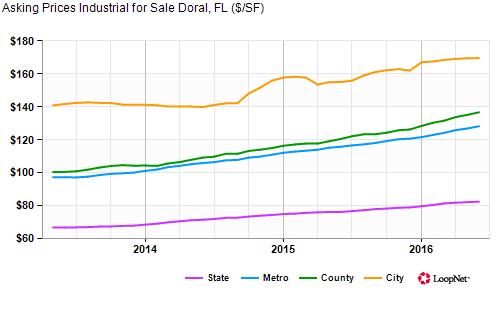
According to LoopNet, early 2017 Doral market trends data showed an increase of 0.7 percent in the median asking price per sq. ft. for industrial properties compared to the prior 3 months, with an increase of 9.4 percent compared to last year's prices. Countywide, asking prices for industrial properties are 3.9 percent higher at $137 per sq. ft. compared to the current median price of $170 per sq. ft. for industrial properties in the City of Doral.


Economic Analysis Competitive Assessment 17

City of Doral 18
Housing Inventory

According to 2015 ACS estimates, there are 18,674 total housing units in the City of Doral, of which, 80.5 percent are occupied (15,038 units). The City’s high vacancy rate (19.5 percent/3,636 units) is largely due to the significant amount of “seasonal” vacancies (1,779 units). The City’s housing supply is largely comprised of single-family detached and attached structures (56.4 percent/10,522 units). Multi-family structures of 20+ units comprise 21.4 percent/3,987 units of the City’s total housing inventory. The composition of the City’s housing inventory is substantially different from Miami-Dade County where 40.6 percent of the structures are single-family detached and 30.6 percent in multi-family structure of 20+ units.
According to 2015 ACS estimates, only 51.4 percent (7,729 units) of Doral’s occupied housing units are owner-occupied and an estimated 48.6 percent (7,309 units) are renter-occupied. The percentage of owner-occupied housing in Doral is slightly lower than Miami-Dade County (53.8 percent)
Economic Analysis Competitive Assessment 19
Doral Miami-Dade County Total Housing Units 18,674 998,833 # % # % 1-unit, detached 5,058 27.1% 405,953 40.6% 1-unit, attached 5,464 29.3% 98,377 9.8% 2 units 86 0.5% 20,666 2.1% 3 or 4 units 505 2.7% 35,242 3.5% 5 to 9 units 1,417 7.6% 51,791 5.2% 10 to 19 units 2,105 11.3% 67,651 6.8% 20 or more units 3,987 21.4% 305,520 30.6% Mobile home 52 0.3% 13,144 1.3% Boat, RV, van, etc. - 0.0% 489 0.0% Housing Occupancy # % # % Occupied housing units 15,038 842,153 Owner-occupied 7,729 51.4% 452,826 53.8% Renter-occupied 7,309 48.6% 389,327 46.2% Vacant housing units 3,636 156,680 Homeowner vacancy estimates 206 5.7% 11,408 7.3% Sold, Not Occupied 111 3.1% 5,879 3.8% Rental vacancy estimates 546 15.0% 29,723 19.0% Rented Not Occupied 386 10.6% 7,177 4.6% Vacancy for seasonal, recreational, or occasional use 1,779 48.9% 71,573 45.7% Other 608 16.7% 30,920 19.7%
Housing Inventory, Doral and Miami-Dade County, 2015
2011-2015 American Community Survey 5-year Estimates
Source:
U.S. Census Bureau,
Housing Values and Demand
A basic premise of all housing markets is there should exist a spectrum of housing choices and opportunities for local residents. This axiom establishes that housing choice and needs differ in most communities due to a variety of factors, including employment mix, household income, population age, proximity of employment and mere preference. Local housing and labor markets are inextricably linked to one another. Industries are best served by local housing markets that provide choices and opportunities for both current and future workers.
The “value” of owner-occupied housing units is an important determinant of housing accessibility and affordability. Housing values have fluctuated significantly in many housing markets during the past decade due initially to the 2004-2006 “housing bubble” and then followed by the subsequent economic collapse and recession. However, recent trends in the housing market show steady increases in the value of both owner and rental housing in the City of Doral.
According to 2015 ACS estimates, the median value of owner-occupied housing units in the City of Doral is $310,700 compared to $203,300 in Miami-Dade County. The City’s median gross rent is $1,751 compared to $1,112 in Miami-Dade County. The values of owner-occupied units in the City of Doral are reflective of when the units were constructed. The median value of units constructed since 2010 is $615,900, which is nearly double the City’s median value. Likewise, the median gross rent of units constructed since 2000 and 2010 are significantly higher than the City’s overall median gross rent.
According to 3Q/2016 Zillow market reporting, the median home value in the City of Doral is $325,800, which is nearly 5 percent higher than 2015 ACS estimates. Zillow estimates that Doral home values have gone up 3.7 percent over the past year and predicts they will rise 0.5 percent within the next year. The median list price per square foot in Doral is $222, which is higher than the Miami-Fort Lauderdale Metro median of $205. The median price of homes currently listed for sale in the City of Doral is $398,000. According to Zillow, the median rent price in Doral is $2,200, which is higher than the Miami-Fort Lauderdale Metro median of $1,900. The City’s housing market is generally healthy with only 0.1 percent of homes with negative equity (0.1 percent U.S. Average, September 30, 2016) and 0.0 percent delinquent on mortgage (0.0 percent U S Average, September 30, 2016).
City of Doral 20
Housing Units by Tenure and Value, Doral and Miami-Dade County, 2015 Doral Miami-Dade County # % # % Owner-occupied housing units 7,729 452,826 Less than $50,000 216 2.8% 20,647 4.6% $50,000 to $99,999 175 2.3% 58,056 12.8% $100,000 to $149,999 428 5.5% 69,255 15.3% $150,000 to $199,999 759 9.8% 74,669 16.5% $200,000 to $299,999 2,090 27.0% 100,800 22.3% $300,000 to $499,999 2,820 36.5% 75950 16.8% $500,000 to $999.999 1,127 14.6% 36,371 8.0% $1,000,000 or more 114 1.5% 17,078 3.8% Occupied units paying rent* 7,060 375,359 Less than $200 0 0.0% 7,644 2.0% $200 to $299 15 0.2% 11,908 3.2% $300 to $499 16 0.2% 12,695 3.4% $500 to $749 62 0.9% 37,609 10.0% $750 to $999 98 1.4% 80,844 21.5% $1,000 to $1,999 4,805 68.1% 195,993 52.2% $2,000 to $2,999 1,830 25.9% 23,333 6.2% $3,000 or more 234 3.3% 5,333 1.4%
Source: U.S. Census Bureau, 2011-2015 ACS 5-year Estimates
Housing affordability is generally defined as the capacity of households to consume housing services and, specifically, the relationship between household incomes, and prevailing housing prices and rents. The standard most frequently used by various units of government is that households should spend no more than 30 percent of their income on housing costs. This is the standard definition for housing programs administered by the Department of Housing and Urban Development (HUD) and most state housing agencies. Owner and renter households paying in excess of 30 percent of their income on housing costs are considered “cost burdened.” Households spending in excess of 50 percent of their income on housing are considered “extremely cost-burdened”.
Currently, the percentage of cost-burdened renter households in the City of Doral is comparable to MiamiDade County, but Doral has a higher percentage of cost-burdened owner households. According to 2015 ACS estimates, 57.0 percent of renters in Doral are cost burdened (greater than 30 percent of household income on housing costs) and 27.5 percent are severely cost-burdened (greater than 50 percent of
Economic Analysis Competitive Assessment 21
Housing Values, Doral and Miami-Dade
Doral Miami-Dade County Median Housing Value (dollars) $310,700 $203,300 Median Gross Rent (dollars) $1,751 $1,112 Median Value by Year Structure Built Built 2014 or later - $468,500 Built 2010 to 2013 $615,900 $299,700 Built 2000 to 2009 $322,200 $249,100 Built 1990 to 1999 $341,800 $232,800 Built 1980 to 1989 $241,200 $180,500 Built 1970 to 1979 $192,400 $171,600 Built 1960 to 1969 $155,900 $198,600 Built 1950 to 1959 $239,200 $188,700 Built 1940 to 1949 - $212,900 Built 1939 or earlier - $298,100 Gross Rent by Year Structure Built Built 2014 or later - $1,406 Built 2010 to 2013 $1,826 $1,238 Built 2000 to 2009 $1,822 $1,496 Built 1990 to 1999 $1,753 $1,236 Built 1980 to 1989 $1,481 $1,166 Built 1970 to 1979 $1,299 $1,067 Built 1960 to 1969 $1,158 $1,036 Built 1950 to 1959 - $997 Built 1940 to 1949 - $936 Built 1939 or earlier - $909 Source: U.S. Census Bureau, 2011-2015 American Community Survey 5-year Estimates
Median
County, 2015
household income on housing costs). Additionally, an estimated 34.1 percent of the City’s owner households are cost burdened and 18.5 percent are severely cost-burdened.
The following section provides a housing affordability analysis using 2015 ACS estimates of median household income and owner/rent values for the City of Doral. Affordability calculations were performed for each household income category ranging from “extremely low” (less than 30 percent of median household income (MHI)) to “middle” (101-120 percent of MHI). For owner units, affordability of home purchase was calculated at the standard 2.5:1 median home value-to-median household income ratio. For renter units, affordability was calculated using the greater than 30 percent of household income/housing cost standard.
The housing affordability analysis for owner units in the City of Doral shows significant gaps in all household income categories below 120 percent of the City’s median income. A housing affordability analysis for renter units found significant affordability gaps at all household income categories below 80 percent of the City’s median household income.
City of Doral 22
Cost-Burden Housing Characteristics, Doral and Miami-Dade County, 2015 Doral Miami-Dade County Cost Burdened Renter Households Total Renter Occupied Households 7,309 389,327 Total renter occupied housing units that pay 30% or more of their household income on rent 4,169 57.0% 240,575 61.8% Total renter occupied housing units that pay 50% or more of their household income on rent 2,011 27.5% 135,591 34.8% Cost Burdened Owner Households Total Owner Occupied Households** 7,729 452,826 Total owner occupied housing units that pay 30% or more of their household income on mortgage payments 2,638 34.1% 147,379 32.5% Total owner occupied housing units that pay 50% or more of their household income on mortgage payments 1,429 18.5% 74,201 16.4% Source: U.S. Census Bureau, 2011-2015 American Community Survey 5-year Estimates
Miami-Dade County – Renter Affordability, 2015 Median Household Income (MHI) Median Gross Rent Household Income Categories Income Affordable Rent Gap/ Surplus $43,129 $1,112 Extremely Low-Income (0-30% of MHI) $12,939 $323 $789 Very Low-Income (31-50% of MHI) $21,565 $539 $573 Low-Income (51-80% of MHI) $34,503 $863 $249 Moderate-Income (81-100% of MHI) $43,129 $1,078 $34 Middle-Income (101-120% of MHI) $51,755 $1,294 $182 Source: U.S. Census Bureau, 2011-2015 American Community Survey 5-year Estimates
Housing and Transportation Affordability (H&T) Index
The Housing and Transportation Affordability Index (H+T Index) developed by the Center for Neighborhood Technology (CNT) offers an expanded view of affordability, one that combines housing and transportation costs and sets the benchmark at no more than 45 percent of household income. According to CNT’s 2016 estimates, the H&T Index for the City of Doral is 77 percent compared to 62 percent for Miami-Dade County. The H&T Index for the City of Doral is composed 53 percent by housing costs and 24 percent by transportation costs.
Economic Analysis Competitive Assessment 23
Miami-Dade County – Owner Affordability, 2015 Median Household Income (MHI) Median Owner Occupied Value Household Income Categories Income Affordable Home Purchase Price Gap/ Surplus $43,129 $203,300 Extremely Low-Income (0-30% of MHI) $12,939 $32,347 $170,953 Very Low-Income (31-50% of MHI) $21,565 $53,911 $149,389 Low-Income (51-80% of MHI) $34,503 $86,258 $117,042 Moderate-Income (81-100% of MHI) $43,129 $107,823 $95,478 Middle-Income (101-120% of MHI) $51,755 $129,387 $73,913 Source: U.S. Census Bureau, 2011-2015 American Community Survey 5-year Estimates City of Doral-Owner Affordability Median Household Income (MHI) Median Owner Occupied Value Household Income Categories Income Affordable Home Purchase Price Gap/ Surplus $72,933 $310,700 Extremely Low-Income (0-30% of MHI) $21,880 $54,700 $256,000 Very Low-Income (31-50% of MHI) $36,467 $91,166 $219,534 Low-Income (51-80% of MHI) $58,346 $145,866 $164,834 Moderate-Income (81-100% of MHI) $72,933 $182,333 $128,368 Middle-Income (101-120% of MHI) $87,520 $218,799 $91,901 Source: U.S. Census Bureau, 2011-2015 American Community Survey 5-year Estimates City of Doral –Renter Affordability Median Household Income (MHI) Median Gross Rent Household Income Categories Income Affordable Rent Gap/ Surplus $72,933 $1,751 Extremely Low-Income (0-30% of MHI) $21,880 $547 $1,204 Very Low-Income (31-50% of MHI) $36,467 $912 $839 Low-Income (51-80% of MHI) $58,346 $1,459 $292 Moderate-Income (81-100% of MHI) $72,933 $1,823 $72 Middle-Income (101-120% of MHI) $87,520 $2,188 $437 Source: U.S. Census Bureau, 2011-2015 American Community Survey 5-year Estimates
Doral’s
The City of Doral is one of the County’s most important and significant sub-economies. Although Doral’s population of 51,382 represents only 1.9 percent of the County’s total population, its employment base is a full 7.3 percent of the County’s total jobs base. Miami-Dade County’s total employment grew from 979,025 to 1,057,123 from 2002 to 2014. The County’s net jobs increase of over 78,000 represents an eight percent increase over the period. Doral added 13,535 new jobs to its economy from 2002 to 2014, growing from 64,077 to 77,612 total jobs With a growth rate over 21 percent from 2002 to 2014, Doral’s employment grew over 2.6 times faster than the County, making it one of Miami-Dade County’s fastest growing sub-economies over the last decade. In fact, the growth of Doral’s total employment 13,535 jobs since 2002 represents over 17 percent of all new net jobs created in the County during the same period.


Despite Doral’s more diversified economic base, its economy remains susceptible to similar swings in employment as the rest of the regional economy. Miami-Dade County experienced a 7.2 percent job loss from its employment peak in in 2007 to its employment low point in 2008. The County economy rebounded from the 2008 through 2014 recession trough, growing jobs back 14.3 percent.
The recession took an additional year to impact Doral unlike the remainder of the County, the City continued to grow its jobs base through 2008, peaking at 74,565 jobs. Doral experienced a slower, yet deeper pattern of job loss during the recession, losing 8.2 percent of employment through 2009, and shedding an additional 0.4 percent of its jobs base through 2010. Since bottoming out in 2010, Doral has increased its total employment by 13.9 percent through 2014, to its now record high number of jobs. Again, Doral’s employment growth has played a significant role in driving total employment in the County. The 9,472 net jobs added in Doral from 2010 to 2014 represent nearly 8 percent of all net job growth in the County.
City of Doral 24
Economic Analysis Competitive Assessment 25 0 15,000 30,000 45,000 60,000 75,000 2002 2003 2004 2005 2006 2007 2008 2009 2010 2011 2012 2013 2014 City of Doral Total Employment City of Doral Total Employment 850,000 900,000 950,000 1,000,000 1,050,000 1,100,000 2002 2003 2004 2005 2006 2007 2008 2009 2010 2011 2012 2013 2014
Employment Miami-Dade County Total Employment
MDC Total
The City of Doral’s economy differs significantly from the rest of the County as it evolved as a regional transshipment and trade hub. In 2002, the top six industries by employment, representing 69.5 percent of all jobs in the city were Wholesale Trade, Transportation and Warehousing, Retail Trade, Information, and Accommodation and Food Services. By contrast, the top six industries by employment in the county in 2002, representing 56.3 percent of all employment, were Health Care and Social Assistance, Retail Trade, Educational Services, Accommodation and Food Services, Administration & Support, Waste Management and Remediation, and Wholesale Trade.
Since 2002, Doral’s economy has been marked by two distinct shifts in its industrial composition From 2002 to its peak 2008 pre-recession employment level, Doral’s jobs base grew by 16.4 percent. Its largest growing industries, accounting for more than 84 percent of all job growth during the period, were Wholesale Trade (5,305 jobs), Health Care and Social Assistance (1,289 jobs), Professional, Scientific, and Technical Services (1,082 jobs), Retail Trade (984 jobs), Administration & Support, Waste Management and Remediation (959 jobs), and Construction (895 jobs).

Since 2010, the City’s post-recession low point, the City has undergone a significant shift in its leading growth industries, most notably marked by losses in Educational Services (32.2 percent job losses), Manufacturing (28.3 percent job losses), Information (15.8 percent job losses), and Wholesale Trade (3.3 percent job losses) Employment growth since 2010 has been led by Accommodation and Food Services (2,442 jobs added), and Transportation and Warehousing (2,196 jobs added). High-wage industries also fueled the City’s recovery, including Professional, Scientific, and Technical Services (1,916 jobs added), Administration & Support, Waste Management and Remediation (1,267 jobs added), Real Estate and Rental and Leasing (995 jobs added), and Management of Companies and Enterprises (329 jobs added).
The city’s industry structure has evolved differently from the County in four respects:
• Doral’s recovery from the depth of the recession has been much more robust than the rest of the County, with employment growing at double the rate of the County’s recovery from its employment low point 16.4 percent versus 8 percent growth for the County;
• Doral’s leading industries by employment are Wholesale Trade and Transportation, while the County’s leading industries are Healthcare, Retail Trade, and Accommodation and Food Services;
• Doral’s industry structure has historically been more concentrated than the County, and has only become more so. Doral’s six largest industries currently employ 75.2 percent of all jobs, while the County’s top six industries employ 59.7 percent of all workers. Additionally, Doral’s top ten employers carry only 31.7 percent of jobs in the Doral economy, but account for over 72 percent of all establishment sales revenue; and
• Both Doral and the County have experienced a significant loss of manufacturing jobs, losing over 34 and 37 percent of manufacturing employment since 2002.
City of Doral 26
Doral: Top Industries by Number of Establishments
Economic Analysis Competitive Assessment 27
NAICS Industry Sector Number of Establishments Total Employees Total Sales 44-45 - Retail Trade 980 9,867 $2,514,718,000 42 - Wholesale Trade 908 17,344 $42,681,698,000 54 - Professional, Scientific, and Technical Services 797 9,276 $1,278,153,000 48-49 - Transportation and Warehousing 661 8,924 $1,145,510,000 62 - Health Care and Social Assistance 405 3,238 $334,321,000 81 - Other Services (except Public Administration) 356 2,387 $125,741,000 31-33 - Manufacturing 337 8,275 1,961,514,000 53 - Real Estate and Rental and Leasing 301 3,508 $796,165,000 52 - Finance and Insurance 290 2,636 $727,132,000 72 - Accommodation and Food Services 278 6,310 $496,724,000 23 - Construction 264 2,727 $487,473,000 56 – Admin. and Support and Waste Management and Remediation Services 243 5,886 $15,946,684,000 51 - Information 197 8,209 $779,816,000 61 - Educational Services 86 1,829 $11,892,000 71 - Arts, Entertainment, and Recreation 80 626 $54,397,000 92 - Public Administration 79 10,24111- Agriculture, Forestry, Fishing and Hunting 15 587 $53,108,000 55 - Management of Companies and Enterprises 12 92 $55,657,000 21 - Mining, Quarrying, and Oil and Gas Extraction 11 57 $8,486,000 22 - Utilities 1 25 $17,268,000 Unclassified 500 169Total 6,801 102,213 $69,476,457,000 Source: InfoUSA, 216; Data analyzed by the FIU Metropolitan Center.
City of Doral 28 City of Doral: Top 30 Industry Sub-Sectors by Employment NAICS Industry Sub-Sector Establishments Employees Sales 9211 Executive, Legislative, and Other General Government Support 55 9,5994885 Freight Transportation Arrangement 354 6,408 $561,339,000 5151 Radio and Television Broadcasting 15 4,841 $148,393,000 4247 Petroleum and Petroleum Products Merchant Wholesalers 3 4,718 $30,407,377,000 5413 Architectural, Engineering, and Related Services 111 4,436 $700,271,000 5615 Travel Arrangement and Reservation Services 46 3,905 $15,761,707,000 7225 Restaurants and Other Eating Places 227 3,140 $162,555,000 7211 Traveler Accommodation 32 2,957 $323,384,000 4234 Professional and Commercial Equipment and Supplies Merchant Wholesalers 98 2,749 $2,996,038,000 3152 Cut and Sew Apparel Manufacturing 5 2,744 $868,843,000 4239 Miscellaneous Durable Goods Merchant Wholesalers 338 2,742 $2,587,977,000 4238 Machinery, Equipment, and Supplies Merchant Wholesalers 113 2,034 $1,542,590,000 5416 Management, Scientific, and Technical Consulting Services 246 1,908 $151,209,000 5111 Newspaper, Periodical, Book, and Directory Publishers 16 1,895 $23,149,000 5312 Offices of Real Estate Agents and Brokers 166 1,547 $206,641,000 4236 Household Appliances and Electrical and Electronic Goods Merchant Wholesalers 80 1,456 $1,894,789,000 6111 Elementary and Secondary Schools 28 1,4195323 General Rental Centers 8 1,155 $398,439,000 4249 Miscellaneous Nondurable Goods Merchant Wholesalers 62 1,076 $665,622,000 2382 Building Equipment Contractors 70 1,069 $123,637,000 5242 Agencies, Brokerages, and Other Insurance Related Activities 110 1,063 $175,865,000 3344 Semiconductor and Other Electronic Component Manufacturing 13 1,031 $88,225,000 4431 Electronics and Appliance Stores 167 1,013 $240,133,000 4521 Department Stores 10 960 $203,928,000 4411 Automobile Dealers 63 953 $452,056,000 5616 Investigation and Security Services 42 844 $56,697,000 4244 Grocery and Related Product Merchant Wholesalers 48 782 $1,051,639,000 5418 Advertising, Public Relations, and Related Services 96 714 $150,522,000 6216 Home Health Care Services 39 710 $56,448,000 5419 Other Professional, Scientific, and Technical Services 62 678 $65,950,000 Total, Top 30 Sub-Sectors 2,723 70,546 $62,065,423,000 Total, City of Doral 6,801 102,235 $69,482,379,000 Percent of Total 40.0% 69.0% 89.3% Source: InfoUSA, 2016; Data analyzed by the FIU Metropolitan Center
Economic Analysis Competitive Assessment 29 City of Doral: Top 10 Individual Establishments by Employment Name NAICS Industry Sub-Sector Employment Sales Dade County Police Dept. 9211 Executive, Legislative, and Other General Government Support 5,300World Fuel Svc Corp 4247 Petroleum and Petroleum Products Merchant Wholesalers 4,700 $30,379,700,000 Univision Network 5151 Radio and television broadcasting 4,219 $5,000,000 Carnival Corp 5615 Travel arrangement and reservation services 3,500 $15,714,000,000 DHL Global Forwarding 4885 Freight transportation arrangement 3,446Atkins 5413 Architectural, engineering, and related services 3,300 $552,338,000 Perry Ellis Intl Inc. 3152 Cut and Sew Apparel Manufacturing 2,700 $864,806,000 Intcomex Inc. 4234 Professional and Commercial Equipment and Supplies Merchant Wholesalers 1,971 $2,426,527,000 Miami Herald Media Co 5111 Newspaper, periodical, book, and directory publishers 1,765Trump National Doral Miami 7211 Traveler accommodation 1,500 $162,604,000 Total 32,401 $50,104,975,000 Percent of Total Doral Employment 31.7% 72.1% Source: InfoUSA, 2016; Data analyzed by the FIU Metropolitan Center
Using current (2016) data from InfoUSA, which represents a more complete count of all establishments and establishment types than the U.S. Census, the City is home to 6,802 establishments employing 102,235 workers with 2016 total sales revenues estimated at over $69.4 Billion. This total volume of sales revenue, concentrated in such a small geographic area, represents $679,634 per worker, or over $1 35 million per resident, and as such is one of South Florida’s, and the State’s, most productive local economies.
Miami-Dade County has one of the highest percentages of small businesses in the nation. The City of Doral has a smaller percentage of establishments employing less than 20 employees (83.2 percent) than the County (over 87 percent). However, small businesses play a crucial role in the City’s economic stability, job creation, and industry diversification. Doral has a high proportion of business establishments earning more than $1 million in annual sales. 2,720, or 40 percent of all business establishments earn more than $1 million in sales annually.
The Doral economy is characterized by a large number of single location establishments, with 6,152, or 90 percent of all establishments in the City. This is typical of communities across the region; however, Doral is differentiated significantly by its concentration of 28 headquarters locations, many of which are global leaders in their respective industries. The scale and diversity of its leading companies makes Doral a nationally significant small city economy with considerable global reach. Notable headquarter locations include:


• World Fuel Svc Corp
• Carnival Corp
• DHL Global Forwarding
• Perry Ellis Intl Inc.
• Kelly Tractor Co
• Roca Tile Group
• Sea Freight Agencies Inc.
• Pas Cargo USA Inc.
• US Century Bank
City of Doral 30
Establishment Size Distribution Employee Size Establishments Percentage 1 to 4 3,378 49.7% 5 to 9 1,589 23.4% 10 to 19 689 10.1% 20 to 49 398 5.9% 50 to 99 107 1.6% 100 to 249 80 1.2% 250 to 499 19 0.3% 500 to 999 7 0.1% 1,000 to 4,999 10 0.1% 5,000 to ,9999 1 0.0% 10,000+ 1 0.0% Unknown 523 7.7% Total 6,802 100.0% Source: InfoUSA 2016 Establishment Distribution by Sales Volume Sales Volume Establishments Percentage Less than $500,000 1,804 26.5% $500,000 - 1 Million 1,435 21.1% $1 - 2.5 Million 1,224 18.0% $2.5 - 5 Million 767 11.3% $5 - 10 Million 379 5.6% $10 - 20 Million 214 3.1% $20 - 50 Million 102 1.5% $50 - 100 Million 16 0.2% $100 - 500 Million 11 0.2% $500 mil. - $1 bil. 4 0.1% Over $1 Billion 3 0.0% Undisclosed 843 12.4% Total 6,802 100.0% Source: InfoUSA 2016
Resident Labor Force, Earnings, and Local Compensation Rates
According to 2015 ACS estimates, 66.5 percent (25,094 workers) of the City of Doral’s population age 16 and over are in the labor force, down from 63.3 percent in 2010. The City’s current (September 2016) unemployment rate is 7.7 percent compared to 5.6 percent for Miami-Dade County. Doral’s approximately 23,000 workers are employed overwhelmingly in private, for-profit companies (73.2 percent). However, the City’s percentage of self-employed workers, at 16.1 percent, is both higher than the rest of the County, and significantly greater than the U.S. average (9.6 percent).
The City’s employed population 16 years and older is primarily employed in management, business, science and art occupations (45.2 percent), followed by sales and office occupations (36.4 percent). According to the U.S. Census, “occupation” describes the kind of work a person does on the job. The highest median earnings are in management, business, science and art occupations ($56,308), and the lowest are in service occupations ($18,083). The median earnings for sales and office occupations are $36,178. The percentage of the City’s population in management, business, science, and arts occupations is significantly higher than Miami-Dade County (31.5 percent).
Doral’s residents are among the most educated and highest paid in the County. Driven by the high percentage of residents employed in high-skilled occupations, the median wage for residents of Doral, at $41,104 far exceeds the County median wage of $27,142. In fact, median wages for Doral residents are significantly higher in 23 of 35 occupational categories than those for the rest of the county.
Despite high current wages relative to the county, wage growth across industries for Doral residents has been a mixed bag. From 2007 to 2015, median wages for residents in only 14 of 24 industries increased, with some industries seeing significant (30 percent or more) declines. However, despite sluggish wage gains or losses for Doral residents in some sectors, median wages for Doral residents in every industry category were higher than those of the county. Mean wage by industry for Doral residents averaged 132 percent higher than median industry wages across the county.
Compensation Paid by Doral Employers
The most recent detailed data for payroll and compensation at the City level for Doral is from the 2012 Economic Census. In the last economic census, average annual payroll per employee paid by establishments located in Doral reached $48,703, while average annual pay per worker across the remainder of the County reached $45,330. Although workers who live in Doral earn far beyond their occupational and industry counterparts in the rest of the county, businesses in Doral pay only slightly better 7 percent greater on average than business in similar industries in the remainder of the county. In only 9 of 17 industries do businesses in Doral pay more than establishments in the same industries elsewhere in the County.
Economic Analysis Competitive Assessment 31
City of Doral 32 Industry Employment of Residents, City of Doral, 2015 Total Employee of private company workers Self-employed in own incorporated business workers Private notfor-profit wage and salary workers Local, state, and federal governme nt workers Self-employed in own not incorporated business workers and unpaid family workers Civilian employed population 16 years and over 23,546 73.2% 9.6% 3.6% 7.1% 6.5% Agriculture, forestry, fishing and hunting, and mining 44 100.0% 0.0% 0.0% 0.0% 0.0% Construction 692 53.0% 27.3% 0.0% 5.6% 14.0% Manufacturing 1,360 96.0% 4.0% 0.0% 0.0% 0.0% Wholesale trade 3,386 77.6% 17.2% 1.8% 0.0% 3.5% Retail trade 2,417 86.2% 7.7% 0.0% 0.0% 6.1% Transportation and warehousing, and utilities 2,045 83.8% 3.3% 0.8% 4.5% 7.7% Information 1,134 89.6% 2.9% 4.3% 1.0% 2.2% Finance and insurance, and real estate and rental and leasing 2,570 73.0% 10.8% 0.0% 2.6% 13.5% Professional, scientific, and management, and administrative and waste management services 3,408 75.7% 14.6% 1.2% 0.4% 8.1% Educational services, and health care and social assistance 3,043 57.2% 3.6% 15.2% 19.9% 4.1% Arts, entertainment, and recreation, and accommodation and food services 1,884 79.3% 11.2% 5.3% 0.0% 4.2% Other services, except public administration 729 52.9% 7.8% 16.7% 0.0% 22.5% Public administration 834 0.0% 0.0% 0.0% 100.0% 0.0% Source: U.S. Census Bureau, 2011-2015 American Community Survey 5-year Estimates
Economic Analysis Competitive Assessment 33 Industry
Total Employee of private company workers Selfemployed in own incorporated business workers Private not-forprofit wage and salary workers Local, state, and federal government workers Self-employed in own not incorporated business workers and unpaid family workers Civilian employed population 16 years and over 1,204,871 70.5% 6.2% 5.2% 10.2% 7.9% Agriculture, forestry, fishing and hunting, and mining 9,107 79.2% 9.9% 1.7% 0.3% 8.9% Construction 82,433 61.2% 12.6% 0.8% 2.0% 23.3% Manufacturing 57,348 90.6% 4.4% 2.0% 0.4% 2.7% Wholesale trade 50,789 83.4% 10.9% 1.4% 0.1% 4.2% Retail trade 153,347 89.9% 4.1% 1.6% 0.5% 3.8% Transportation and warehousing, and utilities 86,589 73.3% 5.3% 1.2% 14.1% 6.1% Information 25,678 87.8% 4.2% 2.0% 2.8% 3.1% Finance and insurance, and real estate and rental and leasing 88,376 80.7% 8.9% 2.7% 1.1% 6.7% Professional, scientific, and management, and administrative and waste management services 154,113 72.5% 11.8% 1.9% 2.0% 11.8% Educational services, and health care and social assistance 242,726 55.1% 2.9% 15.6% 23.4% 2.9% Arts, entertainment, and recreation, and accommodation and food services 135,547 89.3% 3.1% 2.1% 2.4% 3.2% Other services, except public administration 75,437 48.1% 7.8% 12.7% 0.3% 31.2% Public administration 43,381 0.0% 0.0% 0.0% 100.0% 0.0% Source: U.S. Census Bureau, 2011-2015 American Community Survey 5-year Estimates
Employment of Residents, Miami-Dade County, 2015
City of Doral
34 Population, Households & Occupations Doral Miami-Dade County Total Population 16+ 51,382 2,639,042 Total Households 15,038 842,153 Poverty Rate Percent Percent Families & people whose income in the past 12 months is below the poverty level 12,272 12.0% 572,388 16.9% Percentage in Labor Force Total Population 16+ 37,753 2,152,396 Population in Labor Force 25,094 66.5% 1,339,979 62.3% Employed Population 23,546 62.4% 1,204,871 56.0% Occupations Total Civilian employed population 16+ 23,546 1,204,871 Management, business, science, and arts occupations 10,643 45.2% 379,186 31.5% Service occupations 2,415 10.3% 252,896 21.0% Sales and office occupations 8,569 36.4% 339,358 28.2% Natural resources, construction, and maintenance occupations 865 3.7% 109,989 9.1% Production, transportation, and material moving occupations 1,054 4.5% 123,442 10.2% Commute to Work Workers 16 years and over 23,446 1,150,052 Car, truck, or van drove alone 19,631 83.7% 910,339 79.2% Car, truck, or van carpooled 2,040 8.7% 109,178 9.5% Public transportation (excluding taxicab) 200 0.9% 64,597 5.6% Walked 136 0.6% 26,506 2.3% Other means 130 0.6% 22,495 2.0% Worked at home 1,309 5.6% 51,366 4.5% Source: U.S. Census Bureau, 2011-2015 American Community Survey 5-year Estimates Occupation and Median Earnings Doral, Florida Miami-Dade County, Florida Total Median earnings (dollars) Total Median earnings (dollars) Civilian employed population 16 years and over 23,546 $41,104 1,204,871 $27,142 Management, business, science, and arts occupations 10,643 $55,285 379,186 $47,141 Service occupations 2,415 $16,961 252,896 $17,670 Sales and office occupations 8,569 $35,977 339,358 $25,577 Natural resources, construction, and maintenance occupations 865 $41,264 109,989 $24,856 Production, transportation, and material moving occupations 1,054 $29,688 123,442 $22,473 Source: U.S. Census Bureau, 2011-2015 American Community Survey 5-year Estimates

Competitive Assessment 35 Median
Doral MiamiDade Ratio 2007 2008 2009 2010 2011 2012 2013 2014 2015 07-15 2015 Total 44,971 45,841 46,019 44,339 41,786 42,114 42,754 49,487 49,543 10.2% 33,916 146% Construction 40,214 53,370 45,230 42,208 42,362 42,277 43,154 43,558 47,171 17.3% 28,743 164% Manufacturing 56,800 84,353 65,136 60,617 67,002 69,104 79,784 71,178 62,326 9.7% 31,784 196% Wholesale trade 46,799 40,689 46,679 54,529 44,044 43,275 42,438 50,150 47,739 2.0% 37,632 127% Retail trade 34,455 29,006 46,421 28,241 33,005 32,895 37,427 50,997 45,391 31.7% 27,651 164% Transportation and Warehousing and Utilities 57,248 56,739 51,900 42,271 35,867 35,839 51,233 46,692 58,176 1.6% 38,006 153% Transportation and warehousing 51,060 55,466 44,819 40,691 34,369 34,715 46,911 46,457 57,951 13.5% 36,453 159% Utilities 106,245 101,590 75,709 67,636 69,428 71,339 69,908 71,220 70,36233.8% 54,154 130% Information 66,130 79,040 78,316 79,243 80,481 71,712 53,124 73,292 63,750 -3.6% 48,053 133% Finance and insurance, and real estate and rental and leasing: 37,185 43,816 38,207 40,211 42,986 42,595 43,471 45,282 45,726 23.0% 43,373 105% Finance and insurance 46,624 49,371 45,087 40,572 44,142 44,462 49,277 49,964 55,132 18.2% 48,951 113% Real estate and rental and leasing 34,861 35,293 34,004 34,978 32,428 37,068 36,395 37,825 37,530 7.7% 36,616 102% Professional, scientific, and management, and administrative and waste management services: 56,720 58,288 46,783 52,763 45,247 52,508 45,996 52,978 50,35411.2% 37,275 135% Professional, scientific, and technical services 63,740 68,714 49,469 54,963 48,631 53,971 52,674 57,186 52,67917.4% 52,164 101% Management of companies and enterprises 74,808 75,027 75,033 - - - - - - 56,204 Administrative and support and waste management services 44,876 39,814 39,164 29,864 28,673 27,883 26,907 35,087 29,53434.2% 25,294 117% Educational services, and health care and social assistance: 41,097 42,581 40,534 42,481 39,478 37,432 32,458 46,487 50,018 21.7% 38,237 131% Educational services 45,097 41,574 42,073 41,450 35,155 24,765 26,708 36,705 43,482 -3.6% 42,054 103% Health care and social assistance 40,100 43,757 38,771 43,914 43,987 41,983 38,068 57,697 51,237 27.8% 35,212 146% Arts, entertainment, and recreation, and accommodations and food services 34,523 33,062 31,922 25,264 28,246 26,143 21,415 26,901 30,63311.3% 23,336 131% Arts, entertainment, and recreation 24,704 23,174 16,418 16,279 38,114 38,622 21,196 40,519 40,861 65.4% 31,126 131% Accommodation and food services 36,523 34,224 33,692 25,294 26,858 23,249 21,513 23,085 25,84729.2% 22,175 117% Other services except public administration 21,210 19,780 34,099 24,349 22,342 22,768 21,126 24,474 26,518 25.0% 23,506 113% Public administration 69,830 68,897 71,216 66,410 69,922 61,968 63,032 57,686 59,64614.6% 51,642 115% Source: U.S. Census, American Community Survey, 2007-2015.
Economic Analysis
Earnings By Industry
According to 2011-2015 ACS estimates, the median household income in the City of Doral is $72,933 compared to Miami-Dade County ($43,129). The City’s median family income of $75,607 is also significantly higher than the County ($49,609). Median household incomes in the City vary significantly between owners and renters. The median household income of owner-occupied units in the City is $87,186 compared to $58,429 for renters. Additionally, the proportion of households in Doral earning $50,000 or more (65 percent) far exceeds the rest of the County, at 44 percent. Despite the recovery of jobs since 2010, Doral’s median household income, adjusted for inflation, has declined by 3.2 percent since 2010.


City of Doral 36
Household Income Doral Miami-Dade County Poverty Rate: People whose income in the past 12 months is below the poverty level 12,272 12.0% 572,388 16.9% Households 15,038 842,153 Household Income Less than $10,000 888 5.90% 88,872 10.60% $10,000 to $14,999 322 2.10% 57,039 6.80% $15,000 to $24,999 1,169 7.80% 112,112 13.30% $25,000 to $34,999 1,053 7.00% 93,136 11.10% $35,000 to $49,999 1,815 12.10% 118,667 14.10% $50,000 to $74,999 2,587 17.20% 135,436 16.10% $75,000 to $99,999 2,242 14.90% 82,744 9.80% $100,000 to $149,999 2,844 18.90% 83,383 9.90% $150,000 to $199,999 1,088 7.20% 30,989 3.70% $200,000 or more 1,030 6.80% 39,775 4.70% Median household income (dollars) 72,933 X 43,129 X Mean household income (dollars) 87,398 X 67,497 X Source:
U.S. Census Bureau, 2011-2015 American Community Survey 5-year Estimates
Based on income, occupations, payroll data, and a U.S. Census Longitudinal Employer-Household Dynamics analysis, the City of Doral’s residents are among the most highly educated and compensated in the County. Doral’s economy employs (depending upon the data utilized) between 73,000 and 102,000 workers. However, the vast majority of its up to 23,000 employed residents work elsewhere in the County.
The following table shows the inflow versus outflow of residents and workers from outside Doral, using a Longitudinal Employer-Household Dynamics analysis, based on census data. Only 4,473 residents, or 24.1 percent, work in Doral. An estimated 93.9 percent of the City’s jobs base is filled by workers who live outside Doral. The detailed analysis of where workers are coming from, and where Doral residents work indicates a distribution in all directions across the County. This work pattern has five major implications:
• This work pattern creates traffic congestion issues, as the City’s in-bound rush hour traffic is compounded by a significant outflow of workers leaving the City. Each day, over 72,000 workers enter the City, and at the same time, over 14,000 residents leave the City for work outside Doral;

• Given the high earnings and incomes of Doral residents versus the compensation levels paid by establishments in Doral, it is safe to assume that a high percentage of the working residents leaving Doral each day are in high-skill, high-pay occupations and industries. This daily exit of skilled workers is a lost opportunity in terms of lost tax base that would otherwise be captured in Doral, as well as lost daily secondary and tertiary spending that would otherwise accrue to businesses in Doral;
• On the other hand, having highly skilled, well-paid residents represents opportunities for new business development. The opportunity to hire skilled workers close to home can be a potent business attraction and incentive for companies seeking to locate or grow in Doral. The strength of Doral’s labor force should be utilized as an important marketing and business development tool;
• This analysis suggests that growing employment and work opportunities close to home for Doral’s resident workforce could be an important traffic congestion mitigation strategy. Workshifting, or moving employment closer to home, could be effective, simple, and immediate strategies to improve quality of life and reduce traffic. The development of satellite and shared office space close to where workers live is a growing strategy used by businesses across a range of industries;
• Skilled labor creates new businesses and become entrepreneurs at much higher rate than lower wage, low skilled workers. Growing new employment through entrepreneurial support and incentives aimed at Doral’s resident labor force would also seem to be an immediate near term opportunity.


Economic Analysis Competitive Assessment 37
City of Doral 38 Inflow/Outflow Report - Doral 2014 Count Share Selection Area Labor Market Size (Primary Jobs) Employed in the Selection Area 73,908 100.0% Living in the Selection Area 18,594 25.2% Net Job Inflow (+) or Outflow (-) 55,314In-Area Labor Force Efficiency (Primary Jobs) Living in the Selection Area 18,594 100.0% Living and Employed in the Selection Area 4,473 24.1% Living in the Selection Area but Employed Outside 14,121 75.9% In-Area Employment Efficiency (Primary Jobs) Employed in the Selection Area 73,908 100.0% Employed and Living in the Selection Area 4,473 6.1% Employed in the Selection Area but Living Outside 69,435 93.9% Outflow Job Characteristics (Primary Jobs) External Jobs Filled by Residents 14,121 100.0% Workers Aged 29 or younger 2,696 19.1% Workers Aged 30 to 54 8,898 63.0% Workers Aged 55 or older 2,527 17.9% Workers Earning $1,250 per month or less 2,278 16.1% Workers Earning $1,251 to $3,333 per month 4,887 34.6% Workers Earning More than $3,333 per month 6,956 49.3% Workers in the "Goods Producing" Industry Class 1,034 7.3% Workers in the "Trade, Transportation, and Utilities" Industry Class 4,618 32.7% Workers in the "All Other Services" Industry Class 8,469 60.0% Inflow Job Characteristics (Primary Jobs) Internal Jobs Filled by Outside Workers 69,435 100.0% Workers Aged 29 or younger 13,897 20.0% Workers Aged 30 to 54 41,057 59.1% Workers Aged 55 or older 14,481 20.9% Workers Earning $1,250 per month or less 11,472 16.5% Workers Earning $1,251 to $3,333 per month 31,052 44.7% Workers Earning More than $3,333 per month 26,911 38.8% Workers in the "Goods Producing" Industry Class 4,006 5.8% Workers in the "Trade, Transportation, and Utilities" Industry Class 34,394 49.5% Workers in the "All Other Services" Industry Class 31,035 44.7% Interior Flow Job Characteristics (Primary Jobs) Internal Jobs Filled by Residents 4,473 100.0% Workers Aged 29 or younger 723 16.2% Workers Aged 30 to 54 2,920 65.3% Workers Aged 55 or older 830 18.6% Workers Earning $1,250 per month or less 653 14.6% Workers Earning $1,251 to $3,333 per month 1,663 37.2% Workers Earning More than $3,333 per month 2,157 48.2% Workers in the "Goods Producing" Industry Class 197 4.4% Workers in the "Trade, Transportation, and Utilities" Industry Class 2,340 52.3% Workers in the "All Other Services" Industry Class 1,936 43.3% Source: U.S. Census Bureau, OnTheMap Application and LEHD Origin-Destination Employment Statistics (Beginning of Quarter Employment, 2nd Quarter of 2002-2014). Latest data available as of 02/07/2017.
Home Destination Report, 2014
Where Doral Residents are Employed, 2014
Source: U.S. Census Bureau, OnTheMap Application and LEHD OriginDestination Employment Statistics (Beginning of Quarter Employment, 2nd Quarter of 2002-2014). Latest data available as of 02/07/2017.
Economic Analysis Competitive Assessment 39
Where Non-Resident Workers Live Count Share Total All Jobs 77,612 100.0% Miami city, FL 7,908 10.2% Hialeah city, FL 5,724 7.4% Doral city, FL 4,678 6.0% Fountainebleau CDP, FL 2,945 3.8% Tamiami CDP, FL 2,385 3.1% Pembroke Pines city, FL 2,303 3.0% Kendall CDP, FL 1,939 2.5% Kendale Lakes CDP, FL 1,930 2.5% Miramar city, FL 1,872 2.4% The Hammocks CDP, FL 1,544 2.0% All Other Locations 44,384 57.2%
Count Share Employed Doral Residents 19,621 100.0% Doral city, FL 4,678 23.8% Miami city, FL 2,868 14.6% Coral Gables city, FL 740 3.8% Hialeah city, FL 623 3.2% Miami Beach city, FL 465 2.4% Kendall CDP, FL 450 2.3% Medley town, FL 401 2.0% Fort Lauderdale city, FL 267 1.4% Miami Lakes town, FL 248 1.3% Pembroke Pines city, FL 245 1.2% All Other Locations 8,636 44.0%
The Advanced Industries Sector in Doral
A third measure of Doral’s economic strengths, opportunities, and growth potential incorporates an analysis of its businesses included in the Advanced Industries Sector. The Brookings Institution, among others, has developed the concept and extensive analysis of what it has termed the U.S. Advanced Industries Sector. Brookings has identified 50 industries across manufacturing, energy, and services that may be critical in the development of regional economies. The analysis has sparked broad thinking regarding the development of these key sectors as an important way to improve American global economic competitiveness, lead the nation’s economic revitalization, build on regional economic strengths, create new employment post-recession, and provide acutely needed high-skill, high paying employment opportunities.
According to Brookings, the Advanced Industries Sector includes important regional core industries that concentrate in, and drive many of the nation’s best performing regional economies. The Sector is composed of 50 industries identified at the 4-digit NAICS level, and includes manufacturing industries, chemicals, pharmaceuticals, advanced metals, industrial machinery, medical equipment manufacture, energy development and distribution, software design, data processing and hosting, and medical and diagnostic labs. Industries in the Advanced Industries Sector have five important characteristics:
• Each of the industries in the sector has high relative levels of technology development and research and development spending, well above averages for the rest of the economy. The Advanced Industries Sector both drives and relies on constant innovation, technology advances, and new service business models to expand and grow;
• As a sector, the Advanced Industries employ 12.3 million workers nationally, or 9 percent of total employment. However, the sector produces $2.7 trillion in value added annually, or 17 percent of U.S. gross domestic product;
• The Advanced Industries Sector employs 80 percent of the nations’ engineers, funds 90 percent of private sector R&D, and accounts for 85 percent of all U.S. patents and 60 percent of U.S. exports. The Sector and its component industries are crucial foundations of extensive supply chains and third party employment in a wide range of support industries outside the sector;
• Output and employment growth of the Advanced Industries Sector has been far greater than the economy as a whole. From 1980 to 2013, advanced industry output expanded at a rate of 5.4 percent annually - 30 percent faster than the rest of the US economy. Since 2010, the sector has added nearly one million jobs. Employment growth and economic output of the Sector has been 1.9 and 2.3 times higher than their respective national averages since 2010;
• The Sector provides high-skilled and high-wage employment. Workers in advanced industries generate over $210,000 in annual value added per worker compared with $101,000 for workers outside the Sector. Workers within the Sector, unlike the remainder of the U.S. economy, are experiencing rapidly rising wages. The average advanced industries worker earned $90,000 in total compensation in 2013, twice as much as workers outside of the sector. Absolute earnings
City of Doral 40
in advanced industries grew by 63 percent from 1975 to 2013, compared with a 17 percent increase outside the sector.
The City of Doral has a high proportion of business firms and establishments in the Advanced Industries Sector. The City is home to 775 establishments and firms within the Advanced Industries Sector. These business locations employ 11,727 workers, or just over 11 percent of the City’s employment base, and generate over $2 billion in local sales, and more globally. Given that Advanced Industries employment represents 9 percent of U.S. employment, and only 3 percent of the state’s total employment, the City of Doral has a growing potential as a leading, high-concentration Florida location for the Advanced Industry Sector.
Economic Analysis Competitive Assessment 41
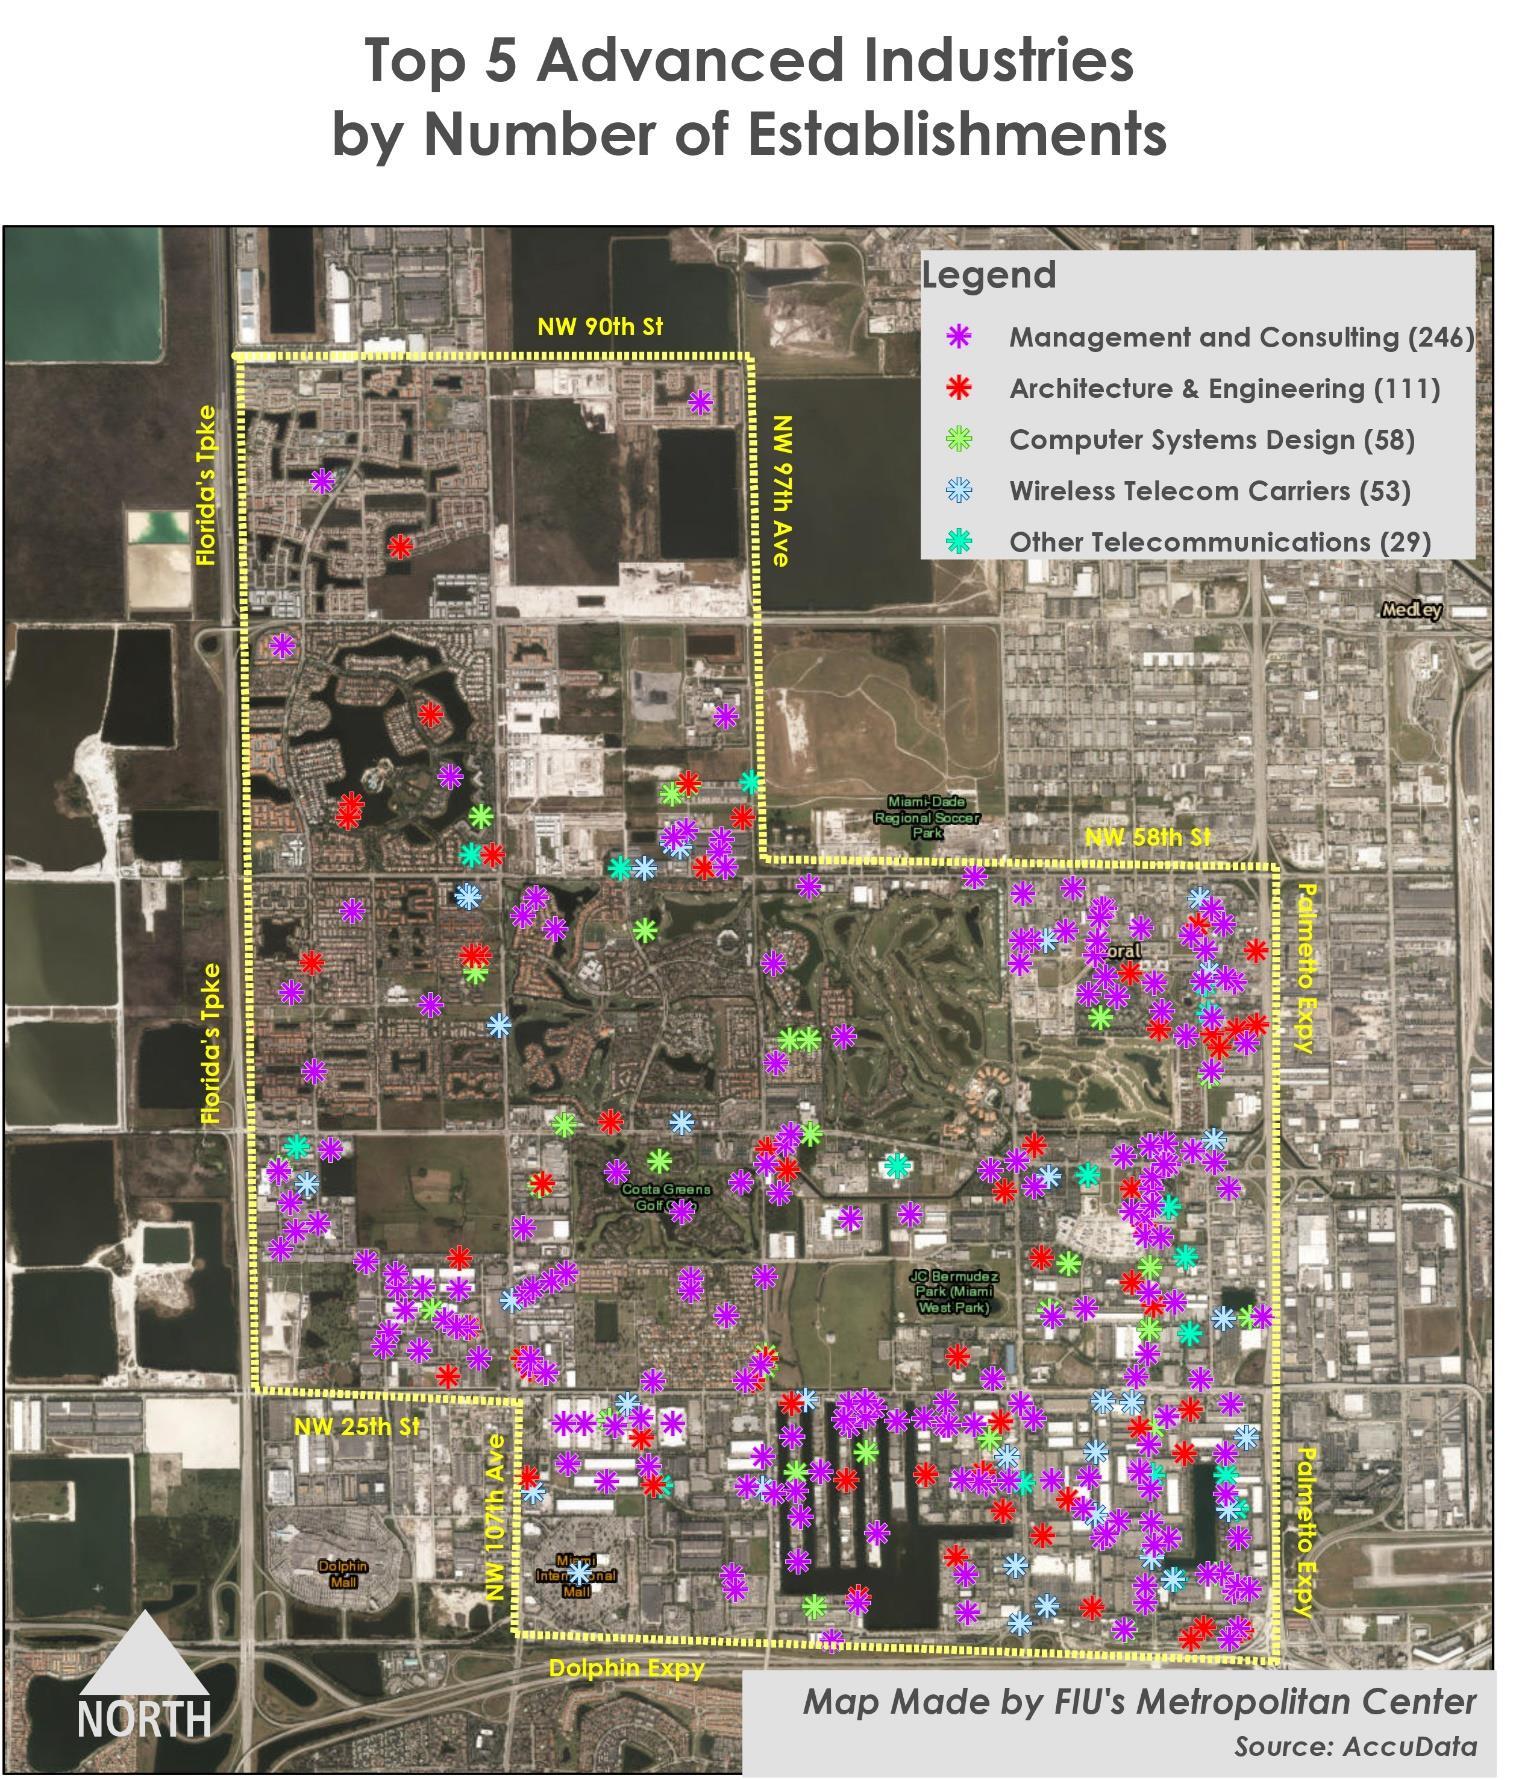
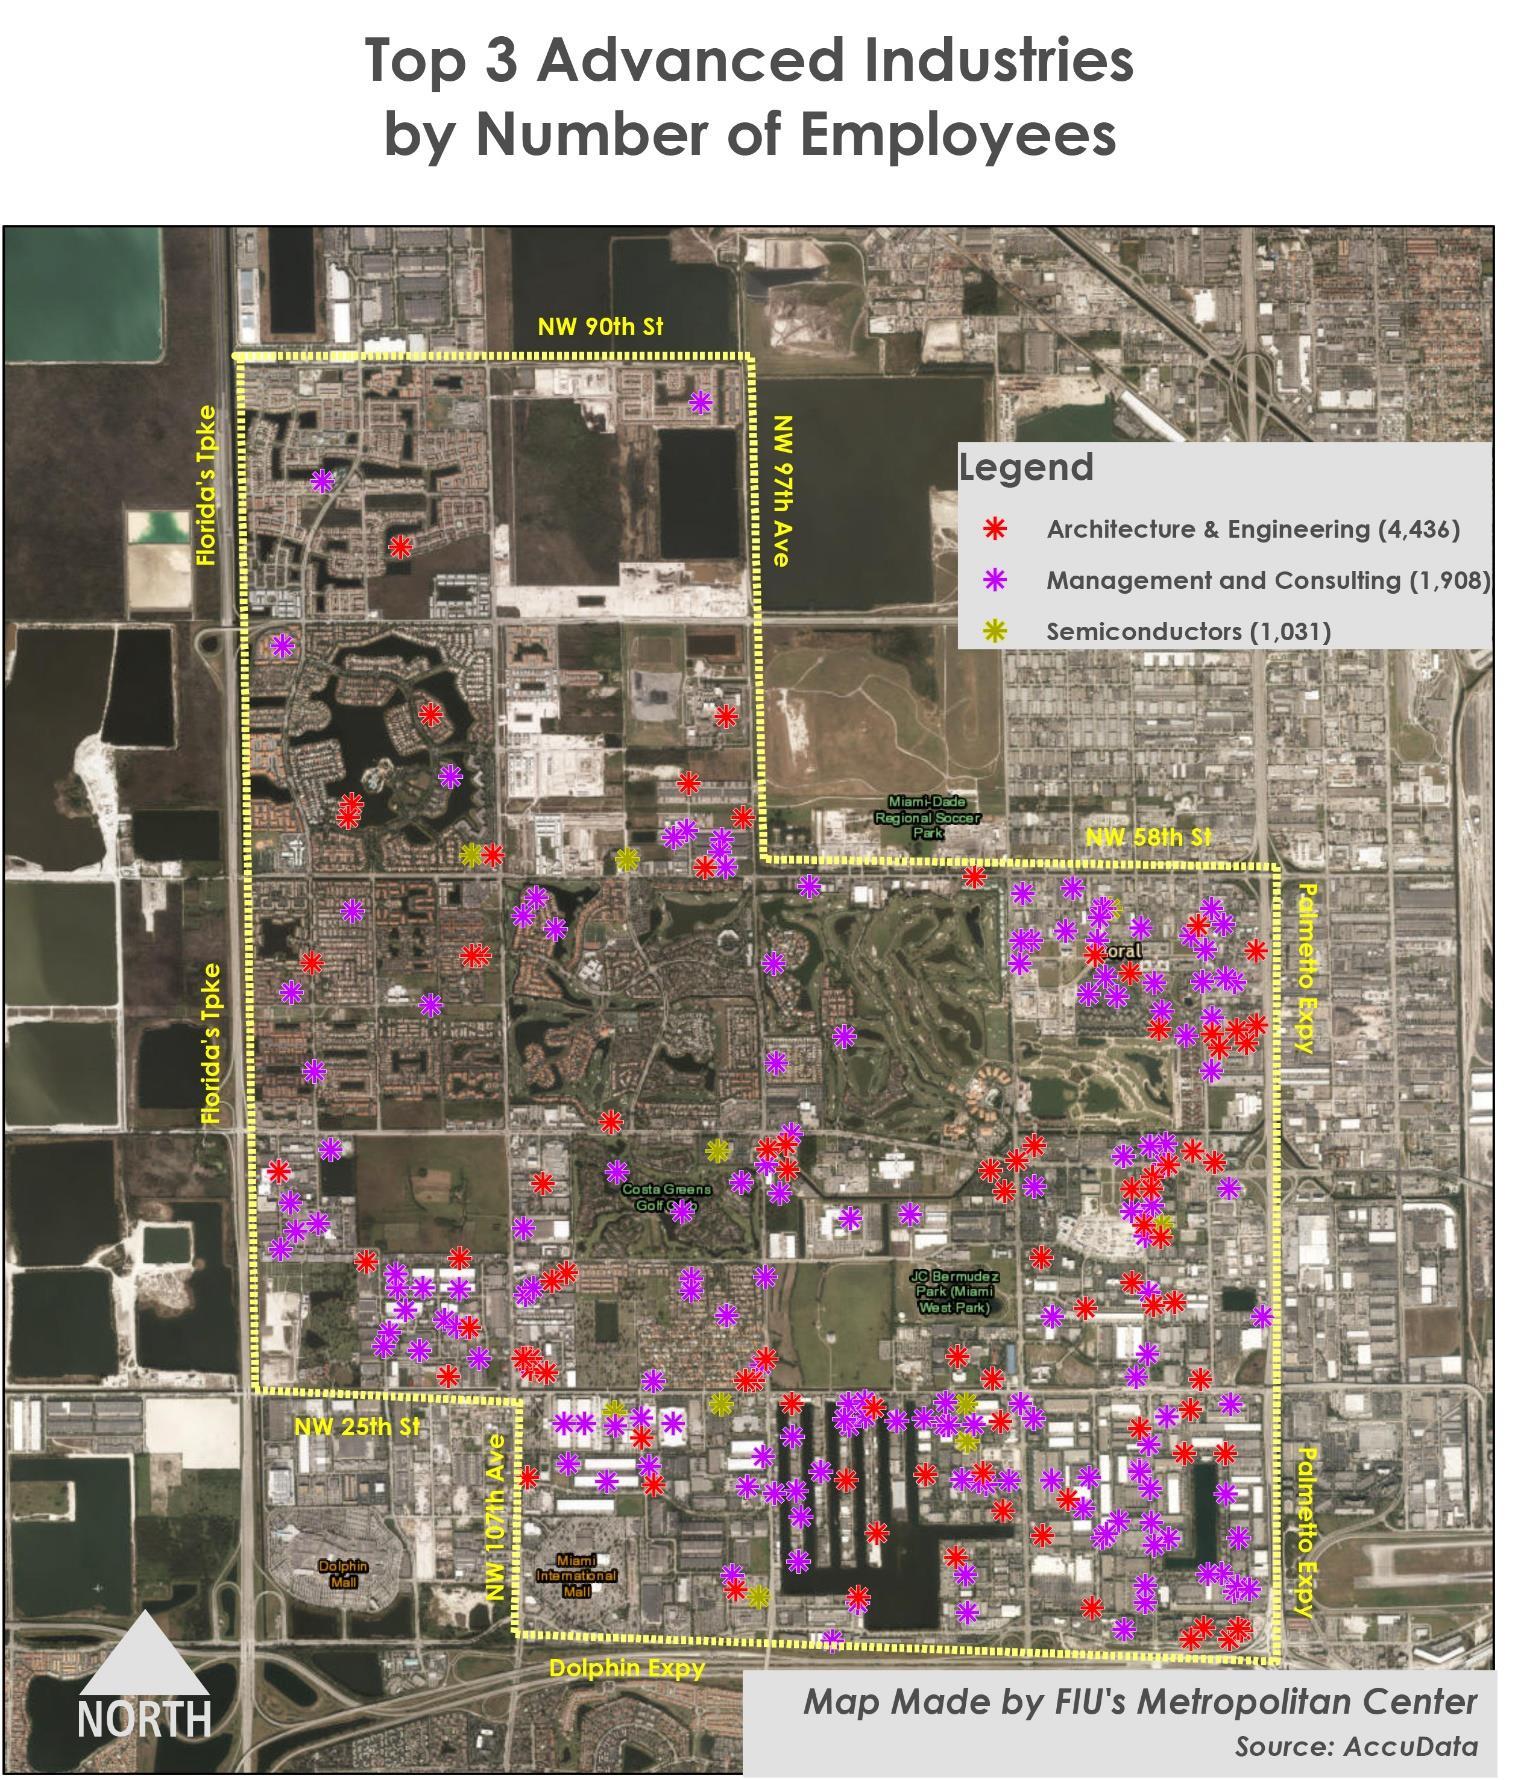
42 Advanced Industry Employment in Doral Industry NAICS Establishments Employment Sales Services Architecture & Engineering 5413 111 4,436 $700,271,000 Management Consulting 5416 246 1,908 $151,209,000 Computer Systems Design 5415 58 427 $59,461,000 Other Telecommunications 5179 29 336 $133,722,000 Data Processing & Hosting 5182 11 269 $43,669,000 Software Products 5112 26 238 $77,649,000 Wireless Telecom Carriers 5172 53 212 $181,153,000 Web Search and Internet Publishing 5191 11 114 $10,353,000 R&D Services 5417 17 110Metal Ore Mining 2122 - -Satellite Telecommunications 5174 - -Medical & Diagnostic Laboratories 6215 13 90 $14,983,000 Cable & Other Programming 5152 6 88 $87,107,000 581 8,228 1,459,577,000 Manufacturing Semiconductors 3344 13 1,031 $88,225,000 Precision Instruments 3345 20 645 $58,176,000 Computer Equipment 3341 15 297 $87,622,000 General Purpose Machinery 3339 15 222 $33,572,000 Medical Equipment & Supplies 3391 15 190 $29,278,000 Jewelry, Sporting Goods 3399 24 157 $21,423,000 Aircraft Products & Parts 3364 6 152 $40,391,000 Pesticides & Fertilizers 3253 1 4Magnetic & Optical Media 3346 1 5 $520,000 Stone & Mineral Products 3279 6 33 $3,756,000 Commercial & Service Machinery 3333 11 112 $14,043,000 Engine & Power Equipment 3336 2 8 $1,688,000 Ships & Boats 3366 - -Railroad Rolling Stock 3365 - -Iron & Steel Products 3311 - -Foundries 3315 - -Electrical Lighting Equipment 3351 - -Aluminum Products 3313 - -Clay & Refractory Products 3271 6 55 $3,617,000 Communications Equipment 3342 7 75 $15,452,000 Petroleum & Coal Products 3241 4 69 $101,206,000 Agri., Constr., Mining Machinery 3331 7 59 $19,778,000 Basic Chemicals 3251 3 59 $34,003,000 Audio & Video Equipment 3343 2 28 $16,220,000 Electrical Equipment 3353 4 42 $7,078,000 Motor Vehicle Parts 3363 6 41 $6,421,000 Motor Vehicles 3361 2 40 $22,162,000 Misc. Chemicals 3259 1 24 $5,247,000 Misc. Transportation Equipment 3369 3 24 $3,785,000 Motor Vehicle Body & Trailers 3362 2 20 $2,386,000 Pharmaceuticals 3254 4 19 $10,715,000 Misc. Electrical Equipment 3359 4 19 $4,793,000 Household Appliances 3352 3 19 $2,086,000 Industrial Machinery 3332 2 10 $1,033,000 Resins & Synthetic Rubbers 3252 2 9Iron & Steel Products 3311 - -191 3,468 $634,676,000 Energy Oil & Gas Extraction 2111 2 6Power Generation & Supply 2211 1 25Advanced Industries totals 775 11,727 2,094,253,000 Doral Totals 6,802 102,235 $69,482,379,000 % Advanced Industries 11% 11% 3%
City of Doral
Brookings Institute; InfoUSA 2016. Analysis
Metropolitan Center
Source: The
performed by the FIU
Economic Analysis Competitive Assessment 43 Advanced Industries Location and Clusters
City of Doral 44
Economic Analysis Competitive Assessment 45 City of Doral: Top 20 Advanced Industry Sectors by Establishments Industry NAICS Establishments Employment Sales Management Consulting 5416 246 1,908 $151,209,000 Architecture & Engineering 5413 111 4,436 $700,271,000 Computer Systems Design 5415 58 427 $59,461,000 Wireless Telecom Carriers 5172 53 212 $181,153,000 Other Telecommunications 5179 29 336 $133,722,000 Software Products 5112 26 238 $77,649,000 Jewelry, Sporting Goods 3399 24 157 $21,423,000 Precision Instruments 3345 21 646 $58,422,000 Medical Equipment & Supplies 3391 15 190 $29,278,000 R&D Services 5417 17 110Computer Equipment 3341 15 297 $87,622,000 General Purpose Machinery 3339 15 222 $33,572,000 Semiconductors 3344 13 1,031 $88,225,000 Commercial & Service Machinery 3333 11 112 $14,043,000 Data Processing & Hosting 5182 11 269 $43,669,000 Web Search and Internet Publishing 5191 11 114 $10,353,000 Medical & Diagnostic Laboratories 6215 13 90 $14,983,000 Communications Equipment 3342 7 75 $15,452,000 Cable & Other Programming 5152 6 88 $87,107,000 Aircraft Products & Parts 3364 6 152 $40,391,000 Total 708 11,110 $1,848,005,000 Source: InfoUSA 2016. Analysis performed by the FIU Metropolitan Center City of Doral: Top 20 Advanced Industry Sectors by Employment Industry NAICS Establishments Employment Sales Architecture & Engineering 5413 111 4,436 $700,271,000 Management Consulting 5416 246 1,908 $151,209,000 Semiconductors 3344 13 1,031 $88,225,000 Precision Instruments 3345 21 646 $58,422,000 Computer Systems Design 5415 58 427 $59,461,000 Computer Equipment 3341 15 297 $87,622,000 Data Processing & Hosting 5182 11 269 $43,669,000 Other Telecommunications 5179 29 336 $133,722,000 Software Products 5112 26 238 $77,649,000 General Purpose Machinery 3339 15 222 $33,572,000 Wireless Telecom Carriers 5172 53 212 $181,153,000 Medical Equipment & Supplies 3391 15 190 $29,278,000 Aircraft Products & Parts 3364 6 152 $40,391,000 Jewelry, Sporting Goods 3399 24 157 $21,423,000 Commercial & Service Machinery 3333 11 112 $14,043,000 Web Search and Internet Publishing 5191 11 114 $10,353,000 Cable & Other Programming 5152 6 88 $87,107,000 Communications Equipment 3342 7 75 $15,452,000 Medical & Diagnostic Laboratories 6215 13 90 $14,983,000 Basic Chemicals 3251 3 59 $34,003,000 Total 694 11,059 $1,882,008,000 Source: InfoUSA 2016. Analysis performed by the FIU Metropolitan Center
Industry Cluster Analysis
The Industry Cluster Analysis brings together all of the elements of economic structure and dynamics analysis. Targeting economic development resources on priority industries and industry clusters is a traditional means of strategically allocating resources and effort to support those industries where public and private investment can have the biggest impact on future economic growth. Targeting policy and programs means building on existing local strengths identifying and applying resources on industries with proven capabilities, infrastructure, and assets on which to grow. Focusing policy, programs and resources on a small set of critical industries has many advantages:
• Identifying and targeting industries with the greatest local economic impact and probabilities for growth increases the effectiveness of local policy and program initiatives, ensuring that scarce dollars are invested in industries and industry clusters that will have the most significant impact on the rest of the local economy;
• Targeted, cluster-based strategies can improve local economic performance by addressing the common needs of local businesses, and further improve the effectiveness of local policy;
• Developing efficient and effective economic development policy is especially critical in the current political climate, as local governments will be dealing with considerably lower levels of state and federal funding support for the foreseeable future;
• Cluster strategies permit the integration and targeting of resources in ways that are consistent with the multiple goals of economic development programs: business recruitment, retention, expansion and new-business creation;
• Creating a local cluster framework as part of a local economic development strategic plan can help mobilize highly committed employers, foster collaboration by bringing together participants from targeted industries and help implement the actions identified in the collaborative process. Job creation and new entrepreneurial innovations are more likely to flourish in such a collaborative environment;
• Proper targeting of resources and programs will result in faster economic growth than scattershot efforts, or programs trying to build entirely new industries where they did not exist before; and
• A carefully targeted program and policy builds on established local industry experience, expertise, and talent, which is a critical component in creating a successful entrepreneurial ecosystem. Rates of successful new business start-up, survival and growth rates are considerably higher for new businesses supplying the needs of existing, established, strong local industry sectors.
In developing the City’s Priority Target Industries, the Center completed a detailed industry cluster analysis, to identify the industries in Doral that are 1) driving current and future economic growth in the City, and 2) have the greatest multiplier, or “ripple” effect on the rest of the local economy. The key terms in this analysis are as follows:
City of Doral 46
Industry Cluster:
An Industry Cluster is a regional concentration of related industries in a particular location. Clusters consist of companies, suppliers, and service providers that provide inputs to each other, or rely on each other for growth. Clusters also can include government agencies and other institutions that provide specialized training and education, information, research, and technical support to thee related businesses Clusters are a central component of economic competitiveness they bring together technology, information, specialized talent, competing companies, academic institution, and other linkages and organizations in close proximity to yield better market information, pools of specialized talent, and faster deployment of new knowledge. Improving the performance of clusters, not just individual companies, is a central feature of leading economic development policy.
Traded vs. Local Cluster:
A Traded Cluster is an industry cluster that serves or sells primarily to markets beyond the local economy being studied, in this case, groups of industries that sell to and serve other businesses and customers outside Doral, the County and the rest of the United States. Traded clusters drive economic growth they bring cash flows, resources and information back from outside the local economy, adding to the local economic pie, rather than merely recirculating money, goods and services. Local Clusters, on the other hand, are composed of industries and businesses that serve the local consumer and business clientele. For their growth, local clusters typically rely on increased local spending by customers, buyers and businesses, which means these clusters do not drive local economic expansion, but react to it.
Location Quotient:
A Location Quotient is a simple statistical tool to measure whether given industries in a local economy represent a higher proportion (percentage) of employment than either the state or U.S. economy. An industry with a high location quotient is usually indicative of local expertise and competitive advantages that help an industry outperform competitors in other local economies. An employment location quotient is calculated by dividing the percentage of local employment in an industry by the percentage of employment of the state or U.S. economy in that industry. A location quotient above “1” indicates that the local industry has a higher concentration locally than the larger economy it is compared with, probably driven by favorable local competitive factors. Location quotients can also be derived for wages and income in the same way.
Doral, like other local economies, is driven by its Traded Industry Clusters. In fact, its largest 26 industry clusters, out of 88 total industry clusters with employment, account for 51 percent of all the City’s business establishments, 61 percent of employment and 93 percent of all business sales revenue.
Based on cluster size, concentration (location quotient), and employment growth, Doral’s industry clusters can be classified into three groups: 1) Strong-Advancing clusters, or those that have a high location quotient and are growing employment locally and nationally, 2) Strong-Declining clusters, or those that have high location quotient, but declining employment locally and nationally, and 3) WeakAdvancing clusters those that have a low location quotient but growing employment. Each of the City’s largest industry clusters and their component industries, listed by cluster status and size, are shown in the following tables.

Economic Analysis Competitive Assessment 47
City of Doral, Largest Traded Industry Clusters
City of Doral 48
Industry Cluster Establishments Employees Sales Revenue Distribution and Electronic Commerce 852 16,906 $42,144,266,000 Business Services 832 9,786 $1,350,741,000 Transportation and Logistics 541 7,997 $1,026,555,000 Hospitality and Tourism 186 7,560 $16,181,413,000 Local Entertainment and Media 15 4,841 $148,393,000 Marketing, Design, and Publishing 154 2,883 $200,520,000 Apparel 9 2,870 $878,242,000 Information Technology and Analytical Instruments 70 1,721 $285,312,000 Financial Services 173 1,490 $460,554,000 Insurance Services 117 1,146 $266,578,000 Aerospace Vehicles and Defense 27 798 $98,813,000 Communications Equipment and Services 99 730 $422,227,000 Education and Knowledge Creation 100 637 $11,892,000 Construction Products and Services 50 486 $176,762,000 Performing Arts 42 422 $36,504,000 Metalworking Technology 22 404 $52,956,000 Printing Services 33 379 $51,196,000 Downstream Chemical Products 11 259 $158,954,000 Food Processing and Manufacturing 20 241 $92,206,000 Water Transportation 25 193 $42,687,000 Medical Devices 15 190 $29,278,000 Downstream Metal Products 11 177 $20,085,000 Paper and Packaging 11 175 $37,922,000 Jewelry and Precious Metals 24 157 $21,423,000 Automotive 13 125 $34,754,000 Video Production and Distribution 17 113 $44,833,000 Total 3,469 62,686 64,275,066,000 City of Doral Totals 6,802 102,235 69,482,379,000 Top 30 Clusters, Percent of City Total 51% 61% 93% Source: InfoUSA 2016. Analysis performed by the FIU Metropolitan Center


Economic Analysis Competitive Assessment 49 City of Doral: High Location Quotient, Growing Industry Clusters Industry Cluster Firms Employees Sales Revenue Local LQ (vs. US) County Emp. Growth 2012 - 2016 US Emp. Growth 2012-2016 Avg. Annual Wage (County) Wage LQ Cluster Status (LQ-Growth) Advanced Industry? Distribution and Electronic Commerce 852 16,906 $42,144,266,000 3.61 0.9% 8.8%StrongAdvancing 4247 Petroleum and Petroleum Products Merchant Wholesalers 3 4,718 $30,407,377,000 69.41 -2.1% 0.5% 83,574 1.634234 Professional and Commercial Equipment and Supplies Merchant Wholesalers 98 2,749 $2,996,038,000 6.23 -3.1% -0.5% 91,539 1.784239 Miscellaneous Durable Goods Merchant Wholesalers 338 2,742 $2,587,977,000 13.10 5.5% -3.1% 49,005 0.954238 Machinery, Equipment, and Supplies Merchant Wholesalers 113 2,034 $1,542,590,000 4.33 -0.1% 1.0% 60,162 1.174236 Household Appliances and Electrical and Electronic Goods Merchant Wholesalers 80 1,456 $1,894,789,000 6.23 0.5% 4.0% 70,783 1.384249 Miscellaneous Nondurable Goods Merchant Wholesalers 62 1,076 $665,622,000 4.76 -1.6% -1.1% 47,225 0.924244 Grocery and Related Product Merchant Wholesalers 48 782 $1,051,639,000 1.45 15.1% 5.5% 55,331 1.084248 Beer, Wine, and Distilled Alcoholic Beverage Merchant Wholesalers 3 491 $16,271,000 3.54 -10.6% 10.7% 111,963 2.184931 Warehousing and Storage 17 161 $19,414,000 0.22 19.8% 43.8% 49,681 0.975324 Commercial and Industrial Machinery and Equipment Rental and Leasing 5 136 $47,993,000 1.34 28.2% 8.7% 64,172 1.254242 Drugs and Druggists' Sundries Merchant Wholesalers 18 128 $326,141,000 0.87 11.6% 8.4% 66,662 1.304541 Electronic Shopping and Mail-Order Houses 12 110 $84,221,000 0.38 -14.1% 33.7% 53,891 1.054251 Wholesale Electronic Markets and Agents and Brokers 16 106 $210,599,000 0.16 -17.8% 1.4% 65,900 1.284243 Apparel, Piece Goods, and Notions Merchant Wholesalers 13 80 $110,471,000 0.75 -3.7% 2.7% 54,882 1.074232 Furniture and Home Furnishing Merchant Wholesalers 12 51 $51,355,000 0.66 35.7% 11.8% 45,371 0.884241 Paper and Paper Product Merchant Wholesalers 8 49 $65,183,000 0.57 -10.9% 0.5% 67,531 1.324235 Metal and Mineral (except Petroleum) Merchant Wholesalers 3 20 $36,146,000 0.23 16.8% -0.6% 69,523 1.354246 Chemical and Allied Products Merchant Wholesalers 3 17 $30,440,000 0.19 -6.2% 1.4% 61,619 1.20 -
City of Doral

City of Doral: High Location Quotient, Growing Industry Clusters continued…
50
Industry Cluster Firms Employees Sales Revenue Local LQ (vs. US) County Emp. Growth 2012 - 2016 US Emp. Growth 2012-2016 Avg. Annual Wage (County) Wage LQ Cluster Status (LQ-Growth) Advanced Industry? Transportation and Logistics 541 7,997 $1,026,555,000 4.44 14.0% 8.2%StrongAdvancing 4885 Freight Transportation Arrangement 354 6,408 $561,339,000 42.33 4.6% 13.1% 51,128 1.004811 Scheduled Air Transportation 59 470 $284,454,000 1.51 20.5% 5.0% 79,617 1.554841 General Freight Trucking 34 356 $44,624,000 0.50 17.0% 7.0% 45,013 0.884842 Specialized Freight Trucking 43 298 $65,717,000 0.95 37.3% 5.7% 43,458 0.854881 Support Activities for Air Transportation 28 270 $45,260,000 1.53 13.5% 15.8% 42,693 0.834882 Support Activities for Rail Transportation 17 171 $22,913,000 7.40 19.5%4884 Support Activities for Road Transportation 4 21 $1,888,000 0.25 -45.2% 12.7% 35,436 0.694889 Other Support Activities for Transportation 2 3 $360,000 0.12 60.7% 13.9% 33,176 0.65Hospitality and Tourism 186 7,560 $16,181,413,000 2.60 11.4% 9.6%StrongAdvancing 5615 Travel Arrangement and Reservation Services 46 3,905 $15,761,707,000 25.18 14.4% 12.5% 41,164 0.807211 Traveler Accommodation 32 2,957 $323,384,000 2.18 14.8% 7.3% 35,350 0.694539 Other Miscellaneous Store Retailers 43 219 $43,611,000 0.94 11.3% 13.8% 33,512 0.657139 Other Amusement and Recreation Industries 29 167 $14,334,000 0.18 26.1% 14.6% 24,688 0.484872 Scenic and Sightseeing Transportation, Water 2 106 $12,388,000 11.65 49.0% 9.5% 36,994 0.725322 Consumer Goods Rental 22 98 $20,720,000 0.90 -22.0% -5.8% 36,387 0.717213 Rooming and Boarding Houses 3 74 $1,859,000 7.93 -35.0% -17.3% 24,913 0.497112 Spectator Sports 4 13 $3,212,000 0.16 -28.0% 5.0% 209,150 4.084879 Scenic and Sightseeing Transportation, Other 1 2 $198,000 0.93 18.3% 26,553 0.52Local Entertainment and Media 15 4,841 $148,393,000 31.09 7.1% 2.0%StrongAdvancing 5151 Radio and Television Broadcasting 15 4,841 $148,393,000 31.09 7.1% 2.0% 91,254 1.78Marketing, Design, and Publishing 154 2,883 $200,520,000 2.90 8.5% 5.8%StrongAdvancing 5111 Newspaper, Periodical, Book, and Directory Publishers 16 1,895 $23,149,000 7.34 -21.4% -18.2% 77,212 1.505418 Advertising, Public Relations, and Related Services 96 714 $150,522,000 2.06 17.5% 11.0% 71,115 1.395414 Specialized Design Services 31 160 $16,496,000 1.61 14.7% 14.7% 51,549 1.005191 Other Information Services 11 114 $10,353,000 0.40 13.2% 29.0% 93,904 1.83 - Y
City of Doral: High Location Quotient, Growing Industry Clusters continued
51
Economic Analysis Competitive Assessment
Industry Cluster Firms Employees Sales Revenue Local LQ (vs. US) County Emp. Growth 2012 - 2016 US Emp. Growth 2012-2016 Avg. Annual Wage (County) Wage LQ Cluster Status (LQ-Growth) Advanced Industry? Apparel 9 2,870 $878,242,000 22.77 5.6% -9.4%StrongAdvancing 3152 Cut and Sew Apparel Manufacturing 5 2,744 $868,843,000 38.15 2.4% -15.8% 36,257 0.713159 Apparel Accessories and Other Apparel Manufacturing 1 106 $6,561,000 12.08 27.3% -1.2% 27,473 0.543149 Other Textile Product Mills 3 20 $2,838,000 0.44 2.4% 1.1% 36,039 0.70Information Technology and Analytical Instruments 70 1,721 $285,312,000 2.16 39.5% 5.7%StrongAdvancing 3344 Semiconductor and Other Electronic Component Manufacturing 13 1,031 $88,225,000 4.01 -45.8% -4.3% 30,620 0.60 - Y 3341 Computer and Peripheral Equipment Manufacturing 15 297 $87,622,000 2.58 215.6% 2.3% 60,315 1.18 - Y 5112 Software Publishers 26 238 $77,649,000 0.93 116.8% 25.2% 88,954 1.73 - Y 3333 Commercial and Service Industry Machinery Manufacturing 11 112 $14,043,000 1.76 -19.3% 0.5% 43,177 0.84 - Y 3343 Audio and Video Equipment Manufacturing 2 28 $16,220,000 2.03 -5.0% 35,596 0.69 - Y 3332 Industrial Machinery Manufacturing 2 10 $1,033,000 0.13 61.4% 5.8% 44,176 0.86 - Y 3346 Manufacturing and Reproducing Magnetic and Optical Media 1 5 $520,000 0.48 67.2% -26.6% 81,404 1.59 - Y Performing Arts 42 422 $36,504,000 1.69 30.1% 18.2%StrongAdvancing 7115 Independent Artists, Writers, and Performers 16 338 $27,247,000 8.53 -3.5% 4.6% 62,584 1.227113 Promoters of Performing Arts, Sports, and Similar Events 12 40 $5,715,000 0.40 79.6% 33.5% 49,436 0.967111 Performing Arts Companies 10 27 $2,206,000 0.30 -18.7% 6.4% 41,648 0.817114 Agents and Managers for Artists, Athletes, Entertainers, and Other Public Figures 4 17 $1,336,000 0.80 32.1% 44.2% 71,457 1.39Printing Services 33 379 $51,196,000 1.19 15.3% -2.8%StrongAdvancing 3231 Printing and Related Support Activities 33 379 $51,196,000 1.19 15.3% -2.8% 40,211 0.78Water Transportation 25 193 $42,687,000 2.20 139.5% -1.7%StrongAdvancing 4832 Inland Water Transportation 17 154 $34,304,000 8.48 0.4% 4883 Support Activities for Water Transportation 8 39 $8,383,000 0.56 139.5% -2.3% 41,308 0.80 Source: InfoUSA 2016. Analysis performed by the FIU Metropolitan Center
City of Doral 52 City of Doral: High Location Quotient, Declining Employment Industry Clusters Industry Cluster Firms Employees Sales Revenue Local LQ (vs. US) County Emp. Growth 2012 - 2016 US Emp. Growth 2012-2016 Avg. Annual Wage (County) Wage LQ Cluster Status (LQ-Growth) Advanced Industry? Aerospace Vehicles and Defense 27 798 $98,813,000 1.28 -5.1% -2.5% StrongDeclining 3345 Navigational, Measuring, Electromedical, and Control Instruments Manufacturing 21 646 $58,422,000 2.31 -2.2% -0.8% 85,688 1.67 Y 3364 Aerospace Product and Parts Manufacturing 6 152 $40,391,000 0.44 -10.1% -3.8% 55,934 1.09 Y Communications Equipment and Services 99 730 $422,227,000 2.18 -4.0% -18.0%StrongDeclining 5179 Other Telecommunications 29 336 $133,722,000 6.02 7.8% -28.1% 91,033 1.77 - Y 5172 Wireless Telecommunications Carriers (except Satellite) 53 212 $181,153,000 2.47 -37.3% -23.1% 100,038 1.95 - Y 5152 Cable and Other Subscription Programming 6 88 $87,107,000 2.22 2.9% -25.1% 132,007 2.57 - Y 3342 Communications Equipment Manufacturing 7 75 $15,452,000 1.24 32.0% -20.8% 62,677 1.22 - Y 3359 Other Electrical Equipment and Component Manufacturing 4 19 $4,793,000 0.20 39.8% 3.5% 44,799 0.87 - Y Education and Knowledge Creation 100 637 $11,892,000 1.25 -7.5% 10.6%StrongDeclining 6116 Other Schools and Instruction 31 201 $8,073,000 0.68 -6.9% 17.7% 30,001 0.586117 Educational Support Services 11 53 $2,442,000 0.44 9.6% 17.0% 75,694 1.476115 Technical and Trade Schools 7 46 $1,377,000 0.48 -16.7% -11.9% 48,132 0.94 -
Economic Analysis Competitive Assessment 53 City of Doral: Low Location Quotient,
Clusters Industry Cluster Firms Employees Sales Revenue Local LQ (vs. US) County Emp. Growth 2012 - 2016 US Emp. Growth 2012-2016 Avg. Annual Wage (County) Wage LQ Cluster Status (LQ-Growth) Advanced Industry? Business Services 832 9,786 $1,350,741,000 0.88 17.7% 11.0%WeakAdvancing 5413 Architectural, Engineering, and Related Services 111 4,436 $700,271,000 4.23 29.7% 5.3% 72,025 1.40 - Y 5416 Management, Scientific, and Technical Consulting Services 246 1,908 $151,209,000 1.92 17.2% 18.2% 77,086 1.50 - Y 5419 Other Professional, Scientific, and Technical Services 62 678 $65,950,000 1.35 15.5% 10.9% 52,151 1.025411 Legal Services 98 520 $94,491,000 0.64 4.3% -0.1% 101,025 1.975619 Other Support Services 63 460 $45,683,000 2.10 50.2% 4.5% 31,954 0.625415 Computer Systems Design and Related Services 58 427 $59,461,000 0.30 32.9% 20.1% 92,960 1.81 - Y 5412 Accounting, Tax Preparation, Bookkeeping, and Payroll Services 77 316 $38,267,000 0.45 9.9% 8.1% 71,803 1.405182 Data Processing, Hosting, and Related Services 11 269 $43,669,000 1.22 -17.5% 17.9% 87,581 1.71 - Y 5614 Business Support Services 18 258 $29,453,000 0.39 37.9% 9.3% 34,736 0.685613 Employment Services 32 138 $13,957,000 0.05 25.3% 11.1% 30,860 0.605321 Automotive Equipment Rental and Leasing 22 118 $40,978,000 0.80 -4.5% 18.5% 42,254 0.824859 Other Transit and Ground Passenger Transportation 11 114 $7,447,000 1.53 -2.1% 13.4% 34,043 0.665511 Management of Companies and Enterprises 12 92 $55,657,000 0.06 20.7% 11.0% 122,813 2.394853 Taxi and Limousine Service 10 49 $2,755,000 0.86 16.6% 6.0% 28,800 0.565331 Lessors of Nonfinancial Intangible Assets (except Copyrighted Works) 1 3 $1,493,000 0.18 1.7% -2.7% 84,564 1.65Financial Services 173 1,490 $460,554,000 0.59 3.4% 2.5%WeakAdvancing 5221 Depository Credit Intermediation 55 564 $130,475,000 0.47 -4.5% -2.2% 78,955 1.545239 Other Financial Investment Activities 67 480 $110,197,000 1.43 0.0% 28.8% 137,065 2.675222 No depository Credit Intermediation 42 369 $176,425,000 0.82 20.0% 4.3% 96,490 1.885223 Activities Related to Credit Intermediation 4 57 $26,285,000 0.26 24.7% 7.5% 96,286 1.885231 Securities and Commodity Contracts Intermediation and Brokerage 2 9 $4,812,000 0.03 7.5% 1.7% 230,800 4.505232 Securities and Commodity Exchanges 2 8 $9,166,000 2.28 -30.5%5259 Other Investment Pools and Funds 1 3 $3,194,000 0.68 -49.2% -84.4% 58,498 1.14 -
Growing Employment Industry
City of Doral
City of Doral: Low Location Quotient, Growing Employment Industry Clusters continued…
54
Industry Cluster Firms Employees Sales Revenue Local LQ (vs. US) County Emp. Growth 2012 - 2016 US Emp. Growth 2012-2016 Avg. Annual Wage (County) Wage LQ Cluster Status (LQ-Growth) Advanced Industry? Insurance Services 117 1,146 $266,578,000 0.69 18.9% 10.3%WeakAdvancing 5242 Agencies, Brokerages, and Other Insurance Related Activities 110 1,063 $175,865,000 1.34 29.7% 21.6% 67,278 1.315241 Insurance Carriers 7 83 $90,713,000 0.10 10.1% 1.6% 88,746 1.73Construction Products and Services 50 486 $176,762,000 0.33 29.4% 9.5%WeakAdvancing 2362 Nonresidential Building Construction 23 110 $35,299,000 0.20 62.3% 15.8% 67,381 1.313273 Cement and Concrete Product Manufacturing 2 83 $8,071,000 0.62 19.6% 14.3% 54,322 1.063329 Other Fabricated Metal Product Manufacturing 3 79 $9,882,000 0.41 2.3% -1.4% 39,214 0.763241 Petroleum and Coal Products Manufacturing 4 69 $101,206,000 0.88 -12.5% -0.6% 62,918 1.23 - Y 2379 Other Heavy and Civil Engineering Construction 7 46 $5,305,000 0.61 -6.9% 5.9% 55,863 1.092371 Utility System Construction 3 43 $10,755,000 0.13 45.1% 11.5% 59,010 1.153279 Other Nonmetallic Mineral Product Manufacturing 6 33 $3,756,000 0.60 28.2% 13.2% 40,273 0.78 - Y 3324 Boiler, Tank, and Shipping Container Manufacturing 2 23 $2,488,000 0.36 32.7% -7.2% 39,505 0.77Metalworking Technology 22 404 $52,956,000 0.62 39.5% -1.9%WeakAdvancing 3339 Other General Purpose Machinery Manufacturing 15 222 $33,572,000 1.22 21.6% 0.4% 46,599 0.91 - Y 3327 Machine Shops; Turned Product; and Screw, Nut, and Bolt Manufacturing 5 121 $12,243,000 0.49 13.2% -4.2% 42,606 0.833328 Coating, Engraving, Heat Treating, and Allied Activities 1 32 $3,760,000 0.33 57.0% -1.4% 43,060 0.843335 Metalworking Machinery Manufacturing 1 29 $3,381,000 0.23 -0.8% 29,452 0.57Downstream Chemical Products 11 259 $158,954,000 0.91 2.1% 2.2%WeakAdvancing 3255 Paint, Coating, and Adhesive Manufacturing 3 104 $99,843,000 2.37 36.9% 4.9% 47,259 0.923256 Soap, Cleaning Compound, and Toilet Preparation Manufacturing 4 72 $19,861,000 0.95 18.8% 3.8% 39,084 0.763251 Basic Chemical Manufacturing 3 59 $34,003,000 0.56 3.1% - Y 3259 Other Chemical Product and Preparation Manufacturing 1 24 $5,247,000 0.41 45.4% -3.2% 51,460 1.00 - Y
City of Doral: Low Location Quotient, Growing Employment Industry Clusters continued…
Economic Analysis Competitive Assessment 55
Industry Cluster Firms Employees Sales Revenue Local LQ (vs. US) County Emp. Growth 2012 - 2016 US Emp. Growth 2012-2016 Avg. Annual Wage (County) Wage LQ Cluster Status (LQ-Growth) Advanced Industry? Food Processing and Manufacturing 20 241 $92,206,000 0.35 35.4% 16.2%WeakAdvancing 3118 Bakeries and Tortilla Manufacturing 8 86 $2,816,000 0.39 33.0% 10.3% 30,938 0.603119 Other Food Manufacturing 5 77 $31,781,000 0.51 14.9% 21.2% 41,426 0.813115 Dairy Product Manufacturing 1 40 $36,781,000 0.40 4.9% 5.9% 39,306 0.773121 Beverage Manufacturing 5 35 $18,267,000 0.21 99.8% 34.4% 55,241 1.083112 Grain and Oilseed Milling 1 3 $2,561,000 0.07 -0.4%Medical Devices 15 190 $29,278,000 0.87 0.3% 0.0%WeakAdvancing 3391 Medical Equipment and Supplies Manufacturing 15 190 $29,278,000 0.87 0.3% 0.0% 58,978 1.15 - Y Downstream Metal Products 11 177 $20,085,000 0.58 24.2% 6.0%WeakAdvancing 3323 Architectural and Structural Metals Manufacturing 7 115 $13,969,000 0.44 29.6% 6.9% 39,249 0.763325 Hardware Manufacturing 2 40 $4,773,000 2.26 7.4%3322 Cutlery and Hand tool Manufacturing 2 22 $1,343,000 0.81 -80.6% -3.4% 29,539 0.58Paper and Packaging 11 175 $37,922,000 0.67 28.1% -2.6%WeakAdvancing 3222 Converted Paper Product Manufacturing 10 155 $29,205,000 0.81 24.8% -0.6% 50,609 0.993221 Pulp, Paper, and Paperboard Mills 1 20 $8,717,000 0.28 -7.9% 50,753 0.99Jewelry and Precious Metals 24 157 $21,423,000 0.78 39.3% 3.9%WeakAdvancing 3399 Other Miscellaneous Manufacturing 24 157 $21,423,000 0.78 39.3% 3.9% 49,078 0.96 - Y Automotive 13 125 $34,754,000 0.18 17.2% 18.0%WeakAdvancing 3363 Motor Vehicle Parts Manufacturing 6 41 $6,421,000 0.10 -5.3% 18.0% 68,346 1.33 - Y 3361 Motor Vehicle Manufacturing 2 40 $22,162,000 0.26 21.4% - Y 3369 Other Transportation Equipment Manufacturing 3 24 $3,785,000 1.00 4.4% 49,148 0.96 - Y 3362 Motor Vehicle Body and Trailer Manufacturing 2 20 $2,386,000 0.18 18.6% 17.0% 39,344 0.77 - Y Video Production and Distribution 17 113 $44,833,000 0.37 17.8% 14.5%WeakAdvancing 5121 Motion Picture and Video Industries 17 113 $44,833,000 0.37 17.8% 14.5% 65,280 1.27 -
Selecting priority, target industry clusters and industries those in which investments and support will yield the greatest likelihood of success and economic reward depends on a variety of factors. They include:
• Total size, by local employment (in Doral): Developing policy that helps retain and grow the City’s largest employment industry clusters is fundamental to employment growth, ensures string multipliers of invested dollars, and helps stabilize the economy in times of transition;
• Economic concentration, as measured by location quotient, which indicates that a local cluster is outperforming similar clusters in other economies: High LQ, or Strong local industries are strong public investment bets;
• Local and U S growth rates: Recent growth performance at the local and national level indicates that the cluster is growing without the need for large outside investment, and is being driven by other market forces;
• Wage performance: Targeting clusters, or cluster component industries with high wages relative to other industries, or above regional, also increases the overall return on public investment — clusters and industries with higher than average wages deliver greater economic multipliers, increase local spending faster, and generally are more stable, flexible and nimble in periods of economic downturn. Industries with higher wages and skills also produce higher rates of entrepreneurs who start their own ventures; and

• Advanced Industries concentration: Clusters with a high proportion of advanced industries indicate they have higher embedded levels of skills, educational requirements, wages, intellectual property, and for the most part outperform the rest of the economy.
Based on a balanced consideration of these factors, the Center recommends the following clusters, with a particular focus on the high wage and advanced industry segments in each, as the City’s strategic priority target industries. Based on our analysis, directing program, resources, support at these clusters and industries will:
• Deliver the largest potential economic impact across the rest of the Doral economy;
• Ensure the best use of scarce public resources; and
• Provide the best range of new employment and income mobility opportunities for Doral residents.
City of Doral 56
CityofDoral:StrategicPriorityTargetIndustryClusters


57
Economic Analysis Competitive Assessment
IndustryCluster&TargetSub-Industries Firms Employees SalesRevenue LocalLQ(vs. US) County Employment Growth 2012-2016 USEmployment Growth 2012-2016 Average AnnualWage (County) WageLQ ClusterStatus (LQ-Growth) Advanced Indiustry? DistributionandElectronicCommerce 852 16,906 $42,144,266,000 3.61 0.9% 8.8% - Strong-Advancing 4234 ProfessionalandCommercialEquipmentandSuppliesMerchantWholesalers 98 2,749 $2,996,038,000 6.23 -3.1% -0.5% 91,539 1.784239 MiscellaneousDurableGoodsMerchantWholesalers 338 2,742 $2,587,977,000 13.10 5.5% -3.1% 49,005 0.954238 Machinery,Equipment,andSuppliesMerchantWholesalers 113 2,034 $1,542,590,000 4.33 -0.1% 1.0% 60,162 1.174236 HouseholdAppliancesandElectricalandElectronicGoodsMerchantWholesalers 80 1,456 $1,894,789,000 6.23 0.5% 4.0% 70,783 1.38TransportationandLogistics 541 7,997 $1,026,555,000 4.44 14.0% 8.2% - Strong-Advancing 4885 Freight TransportationArrangement 354 6,408 $561,339,000 42.33 4.6% 13.1% 51,128 1.004811 ScheduledAirTransportation 59 470 $284,454,000 1.51 20.5% 5.0% 79,617 1.554882 SupportActivitiesforRailTransportation 17 171 $22,913,000 7.40 19.5%HospitalityandTourism 186 7,560 $16,181,413,000 2.60 11.4% 9.6% - Strong-Advancing 5615 TravelArrangementandReservationServices 46 3,905 $15,761,707,000 25.18 14.4% 12.5% 41,164 0.80LocalEntertainmentandMedia 15 4,841 $148,393,000 31.09 7.1% 2.0% - Strong-Advancing 5151 RadioandTelevision Broadcasting 15 4,841 $148,393,000 31.09 7.1% 2.0% 91,254 1.78Marketing,Design,andPublishing 154 2,883 $200,520,000 2.90 8.5% 5.8% - Strong-Advancing 5418 Advertising,PublicRelations,andRelatedServices 96 714 $150,522,000 2.06 17.5% 11.0% 71,115 1.395414 SpecializedDesignServices 31 160 $16,496,000 1.61 14.7% 14.7% 51,549 1.00Apparel 9 2,870 $878,242,000 22.77 5.6% -9.4% - Strong-Advancing 3152 CutandSewApparel Manufacturing 5 2,744 $868,843,000 38.15 2.4% -15.8% 36,257 0.71InformationTechnologyandAnalyticalInstruments 70 1,721 $285,312,000 2.16 39.5% 5.7% - Strong-Advancing 3344 SemiconductorandOtherElectronicComponentManufacturing 13 1,031 $88,225,000 4.01 -45.8% -4.3% 30,620 0.60 - Y 3341 ComputerandPeripheralEquipmentManufacturing 15 297 $87,622,000 2.58 215.6% 2.3% 60,315 1.18 - Y 5112 SoftwarePublishers 26 238 $77,649,000 0.93 116.8% 25.2% 88,954 1.73 - Y PerformingArts 42 422 $36,504,000 1.69 30.1% 18.2% - Strong-Advancing 7115 IndependentArtists,Writers,and Performers 16 338 $27,247,000 8.53 -3.5% 4.6% 62,584 1.22AerospaceVehiclesandDefense 27 798 $98,813,000 1.28 -5.1% -2.5% Strong-Declining 3345 Navigational,Measuring,Electromedical,andControlInstrumentsManufacturing 21 646 $58,422,000 2.31 -2.2% -0.8% 85,688 1.67 Y EducationandKnowledgeCreation 100 637 $11,892,000 1.25 -7.5% 10.6% - Strong-Declining 6117 EducationalSupportServices 11 53 $2,442,000 0.44 9.6% 17.0% 75,694 1.476115 TechnicalandTradeSchools 7 46 $1,377,000 0.48 -16.7% -11.9% 48,132 0.94BusinessServices 832 9,786 $1,350,741,000 0.88 17.7% 11.0% - Weak-Advancing 5413 Architectural,Engineering,andRelated Services 111 4,436 $700,271,000 4.23 29.7% 5.3% 72,025 1.40 - Y 5416 Management,Scientific,andTechnicalConsulting Services 246 1,908 $151,209,000 1.92 17.2% 18.2% 77,086 1.50 - Y 5182 DataProcessing,Hosting,andRelated Services 11 269 $43,669,000 1.22 -17.5% 17.9% 87,581 1.71 - Y FinancialServices 173 1,490 $460,554,000 0.59 3.4% 2.5% - Weak-Advancing 5239 OtherFinancialInvestment Activities 67 480 $110,197,000 1.43 0.0% 28.8% 137,065 2.67InsuranceServices 117 1,146 $266,578,000 0.69 18.9% 10.3% - Weak-Advancing 5242 Agencies,Brokerages,andOtherInsuranceRelated Activities 110 1,063 $175,865,000 1.34 29.7% 21.6% 67,278 1.31MedicalDevices 15 190 $29,278,000 0.87 0.3% 0.0% - Weak-Advancing 3391 MedicalEquipmentandSupplies Manufacturing 15 190 $29,278,000 0.87 0.3% 0.0% 58,978 1.15 - Y VideoProductionandDistribution 17 113 $44,833,000 0.37 17.8% 14.5% - Weak-Advancing 5121 MotionPictureandVideo Industries 17 113 $44,833,000 0.37 17.8% 14.5% 65,280 1.27 -

City of Doral 58 City of Doral: Priority Target Industry Clusters Indsutry Cluster & Target Sub-Industries Manufacturing Firms Employees Services Firms Employees Information Technology and Analytical Instruments 70 1,721 Business Services 832 9,786 3344 Semiconductor and Other Electronic Component Manufacturing 13 1,031 5413 Architectural, Engineering, and Related Services 111 4,436 3341 Computer and Peripheral Equipment Manufacturing 15 297 5416 Management, Scientific, and Technical Consulting Services 246 1,908 5112 Software Publishers 26 238 5182 Data Processing, Hosting, and Related Services 11 269 Apparel 9 2,870 Financial Services 173 1,490 3152 Cut and Sew Apparel Manufacturing 5 2,744 5239 Other Financial Investment Activities 67 480 Aerospace Vehicles and Defense 27 798 Insurance Services 117 1,146 3345 Navigational, Measuring, Electromedical, and Control Instruments Manufacturing 21 646 5242 Agencies, Brokerages, and Other Insurance Related Activities 110 1,063 Medical Devices 15 190 Hospitality and Tourism 186 7,560 3391 Medical Equipment and Supplies Manufacturing 15 190 5615 Travel Arrangement and Reservation Services 46 3,905 Distribution & Transportation Firms Employees Information, Design, Media Firms Employees Distribution and Electronic Commerce 852 16,906 Local Entertainment and Media 15 4,841 4234 Professional and Commercial Equipment and Supplies Merchant Wholesalers 98 2,749 5151 Radio and Television Broadcasting 15 4,841 4239 Miscellaneous Durable Goods Merchant Wholesalers 338 2,742 4238 Machinery, Equipment, and Supplies Merchant Wholesalers 113 2,034 Marketing, Design, and Publishing 154 2,883 4236 Household Appliances and Electrical and Electronic Goods Merchant Wholesalers 80 1,456 5418 Advertising, Public Relations, and Related Services 96 714 5414 Specialized Design Services 31 160 Transportation and Logistics 541 7,997 Performing Arts 42 422 4885 Freight Transportation Arrangement 354 6,408 7115 Independent Artists, Writers, and Performers 16 338 4811 Scheduled Air Transportation 59 470 4882 Support Activities for Rail Transportation 17 171 Education and Knowledge Creation 100 637 6117 Educational Support Services 11 53 6115 Technical and Trade Schools 7 46 Video Production and Distribution 17 113 5121 Motion Picture and Video Industries 17 113
Traffic and Transportation
The time and cost of congestion, increased commute times, and lost productivity due to travel delays are tangible economic concerns for today’s employers, and play an increasingly important role in business location and expansion decisions. According to 2015 ACS estimates, 83.7 percent of the City of Doral’s employed population 16+ years of age commute to work each day by truck, car, van and drive alone compared to 79.2 in Miami-Dade County, as a whole. An estimated 8.7 percent of the City’s workers carpool and 0.9 percent use public transportation. The mean travel time to work (one-way) is 26.4 minutes which is slightly less than the County (29.9 minutes).
According to the Florida Department of Transportation (FDOT), all of the City’s main east-west roadways NW 58th St., NW 36th St., NW 25th St., and NW 12th St. are congested at rush hour, operating at Level of Service (LOS) D or worse. Mean travel time to work for Doral residents, at 26.4 minutes, is less than the County average of 29 minutes, but note that almost 42 percent of Doral residents travel 30 minutes or more to work.

Doral is in many ways a victim of its own success. This study has noted that the significant mismatch between worker inflow and resident worker outflow, in addition to increasing truck traffic, is driving Doral’s congestion problems Doral’s transportation issues are a function of land use, employment location, and limited roadway capacity. Doral’s wildly successful economic growth has created traffic congestion problems that, if not addressed, may grind the City’s transportation to a halt, and threaten its future economic growth. Failure to significantly reduce increasing traffic congestion will also threaten the quality of life it offers to its residents.
The mismatch between Doral’s workforce and employment opportunities has resulted in a significant daily commute trip flow entering and leaving Doral: an estimated 73,000 non-resident workers stream into Doral every day and about 15,000 Doral residents commute to other places. This huge demand has been a significant contributor to the congestion problems in and around Doral.
If the current trend continues, traffic gridlock will get much worse in the future. According to the Southeast Regional Planning Model (SERPM), by the year 2040 about 29,000 Doral workers would need to leave Doral for job opportunities with another 76,700 non-resident workers commuting into Doral every day (see table below).
Economic Analysis Competitive Assessment 59
Doral Census LEHD 2014 ACS 2015 Model Year 2040 Households 15,038 27,193 Residents 51,382 80,161 Employment 77,612 103,836 Resident workers 19,621 23,446 37,270 Inside Doral 4,678 7,620 8,160 Outside Doral 14,943 15,826 29,110 Non-resident workers 72,934 76,710
Much of the regional focus on alleviating commuter transportation congestion has focused on building new road and rail capacity serving East-West travel. However, a significant portion of Doral’s commuter traffic is generated by workers who live to the north and south of Doral. The following table and maps shows the top cities where Doral residents work and where Doral workers live.
Source: Southeast Regional Planning Model 2040 output.
60
City of Doral
Where Doral Residents Work Doral 8,160 22% Miami 5,560 15% MIA 4,320 12% Hialeah 2,970 8% Miami Beach 2,240 6% Medley 1,270 3% Sweetwater 1,240 3% Coral Gables 950 3% Kendall 930 2% Miami Lakes 750 2% University Park 680 2% Hialeah Gardens 510 1% All Other Locations 7,690 21% Total 37,270 100% Where Doral Workers Live Miami 12,750 15% Hialeah 8,300 10% Doral 8,160 10% Fountainebleau 4,470 5% Tamiami 3,530 4% Miami Beach 3,210 4% Kendall 3,140 4% Kendale Lakes 2,630 3% Miami Gardens 2,060 2% Westchester 1,660 2% The Hammocks 1,640 2% Sweetwater 1,620 2% All Other Locations 31,700 37% Total 84870 100%
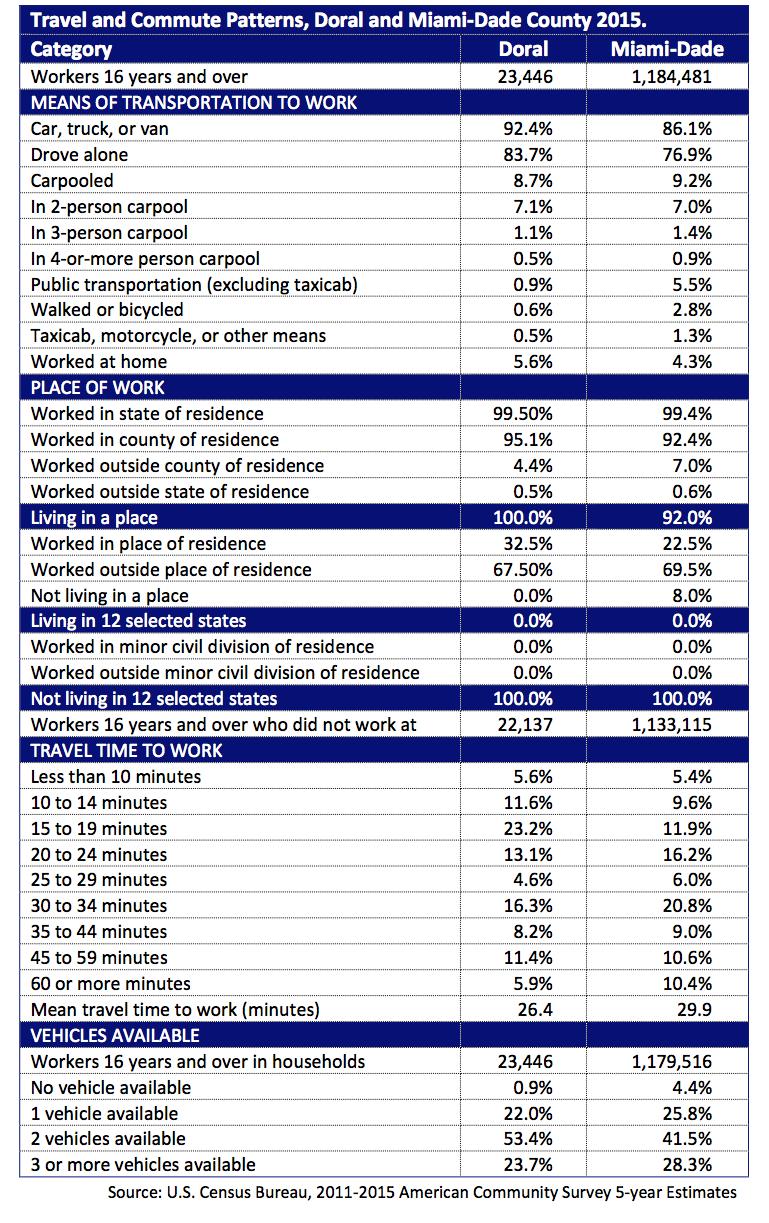
Economic Analysis Competitive Assessment 61
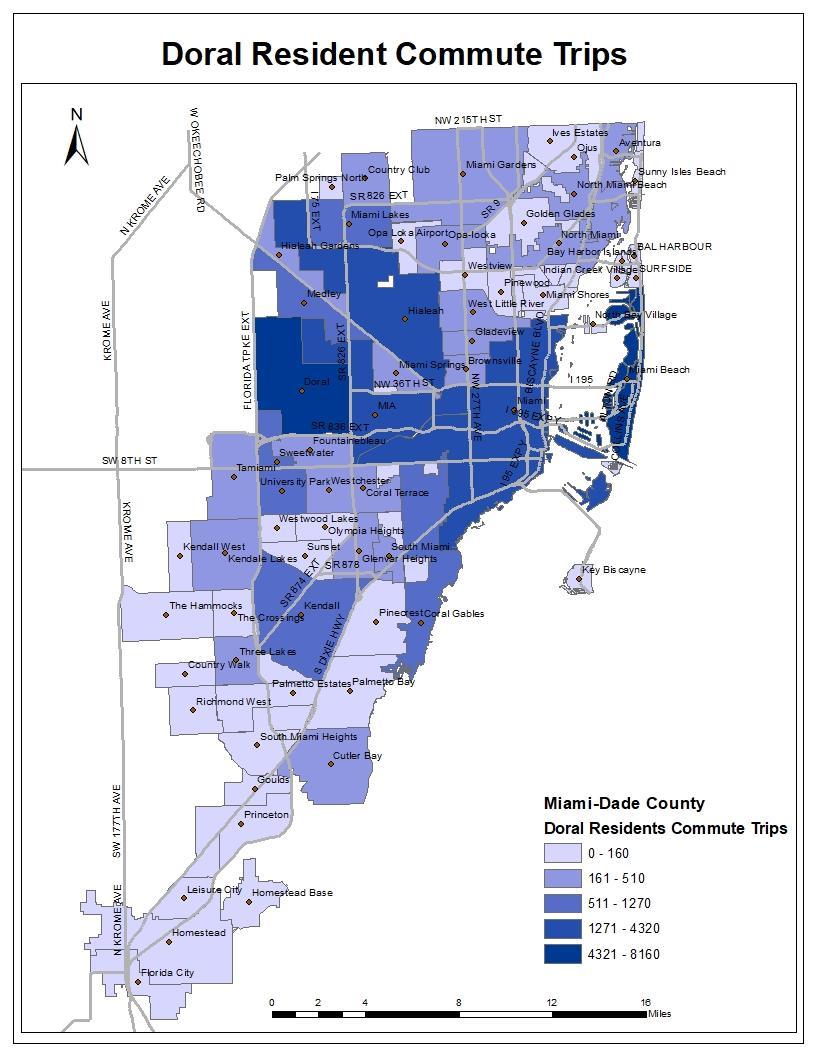
City of Doral 62
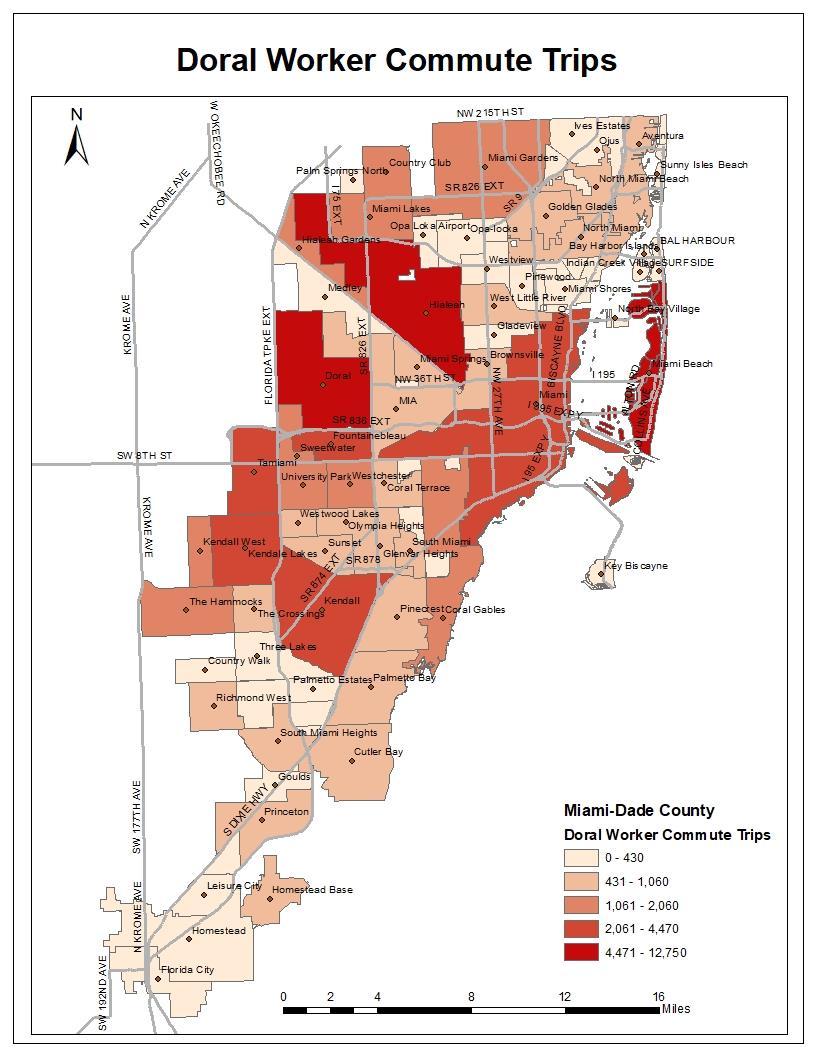
Economic Analysis Competitive Assessment 63
City of Doral
The City’s update to the Transportation Element of the City’s Comprehensive Plan proposes the addition of new road lanes. Unfortunately, Doral has almost no space for new road lanes and will find large-scale transportation infrastructure investments challenging to finance with reduced transportation funding from the state and federal governments. Notably, the update to the City’s Transportation Element found:
Increasing multimodal capacity has been the goal of the City to achieve a balance in the community. Notably, a 5% modal shift towards alternative modes will reduce most of the need for roadway widening on all but one roadway segment in 2025 projects, and a 30% modal shift will reduce the need to widen 80% of the projected roadways requiring additional capacity.
In this environment, traditional transportation solutions stressing the building of additional capacity — either road or mass transit may not be possible in the near or mid-term. Doral will need to consider more creative alternatives aimed at reducing the number of daily trips and the number of vehicles on the road, including land use strategies, new technology, ride-sharing, housing, and disciplined job development strategies to solve its transportation issues.
64
Doral’s Evolving Economy: What are the New Sources of Growth?
The City of Doral has the platform for sustained jobs growth an advanced industry sector mix, highly educated and skilled resident workforce, and skilled local leadership. Yet its future growth is not guaranteed. Doral has grown based on the availability of land, its key central location, transportation access, proximity to major regional assets and employers, and supportive government services (including taxes), growth, and development policy. Over the next two decades, however, the patterns, structure, and types of new economic growth and job creation in the City will change significantly.
The most significant local limits to growth are the City’s shrinking inventory of undeveloped land. Like the rest of the County, Doral is approaching full build-out of its commercial and industrial land area, and even less vacant land is available for new residential development.
Only 205 acres of vacant industrial/commercial zoned property remains in the City of Doral, the bulk of which is contained in the 175-acre Buck-Lemon property fronting NW 141st Street (the fate of the 162acre former SouthCom property on NW 25th Street is unknown at the time of this writing). If developed entirely as industrial or office parks, the City’s vacant acreage inventory could provide at most between 17,000 and 32,000 new jobs, a 17 to 32 percent increase in Doral’s jobs base. In addition, the City’s planned annexations will add built-out land with established industry and office uses.
This means that the age of large jobs producing projects, or large-scale re-locations is over and will occur infrequently. Small business growth has traditionally been extremely important in Doral an estimated 83.2 percent of the entire City’s employment is in businesses employing less than 20 people. Doral’s future growth will be driven by:
• The expansion of existing, small businesses employing less than 50 people;
• Existing businesses improving competitiveness through investments in new technology, productivity, and more skilled labor;
• Growth through acquisition of existing businesses;
• New small business creation and entrepreneurship; and
• The conversion and/or demolition of outdated existing buildings to new uses.
• The study team is aware of the City’s annexation applications. However, in the context of the challenges created by the City’s economic dynamics, choices relative to the development of the City’s now precious remaining land inventory must be made with extreme care in order not to exacerbate problems which may damage the quality of life that has made Doral such a popular destination for residents and businesses.
• Future development policy, discussed in detail in the Policy report to follow, must be careful to consider different objectives, especially the quality of development, and more importantly, the relationship and balance between job creating development uses and the City’s inventory of residential units.
In addition, local economic competitiveness is being redefined in light of key structural problems in metropolitan economies across the United States Across the nation, community leaders are developing
Economic Analysis Competitive Assessment 65
new thinking, strategies, and programs to address the pressing issues of stagnant income growth for households in the lower 75 percent of incomes, continuing differences in regional employment opportunity, a growing income gap between households at the top, middle, and bottom of the income spectrum, slowing upward income mobility and persistent poverty in almost all urban areas.
Simple, traditional measures of the quantity of jobs created is not enough. Increasingly, local economies that successfully compete in the global economy will be defined by the following common characteristics:
• Balanced, diverse economies with more stable employment that better resist business cycle swings;
• A local labor force with the skills and brainpower to support globally competitive businesses, and obtain higher-wage, high-skilled employment opportunities;
• Rising household incomes across the income spectrum, and reduced income disparity between the top and bottom of the income ladder;
• Efficiently allocating resources to stimulate new economic growth;
• Growing strong local innovation, entrepreneurship and business development networks to convert brainpower into wealth through innovation and entrepreneurship, and support innovation and adoption of new technology, even in traditional industries, to improve business competitiveness and performance;
• Supporting broader access to business ownership, as a way to both grow new jobs, and grow family wealth. Owning a business is one of the best ways to grow family wealth and provide employment opportunities for the community, but is still out of reach for too many families.
• Developing quality, connected places that have a high quality of life and that are connected to the rest of the world, and
• Strong civic collaboration leaders who are able to collaborate and partner with businesses and other governments both large and small.
The study team is aware of the City’s annexation applications. However, in the context of the major problem issues created by the City’s economic dynamics, choices relative to the development of the City’s now precious remaining land inventory must be made with extreme care in order not to exacerbate problems which may damage the quality of life that has made Doral such a popular destination for residents and businesses.
Future development policy, which will be discussed in detail in the Strategic Policy Recommendations Report to follow, must be careful to consider different objectives, especially the quality of development, and more importantly, the relationship and balance between job creating development uses and the City’s inventory of residential units. In essence, the City’s future development planning, policy, and decision making needs to consider economic development regulation and housing policy simultaneously and of equal importance.
City of Doral 66