


Update 2 - 2 - 2017 Liberty City Economic Analysis and Opportunities Report The Sou th Florida Housing Studies Consortium
© Florida International University Metropolitan Center
All rights reserved.
NO PART OF THE REPOR T MAY BE REPRODUCED IN ANY FORM, WITHOUT PERMISSION I N WRITING FROM THE FLORIDA INTERNATIONAL UNIVER SITY METROPOLITAN CENTER AND FLORIDA INTERNATIONAL U NIVERSITY.

The Liberty City Economic Analysis and Opportunities Report is the product of the South Florida Housing Studies Consortium, a Florida International University and University of Miami Partnership.
The Florida International University Metropolitan Center is Florida’s leading urban policy think tank and solutions center. Established in 1997, the Center provides economic development, strategic planning, community revitalization, and performance improvement services to public, private and non-profit organizations in South Florida. Its staff and senior researchers are leaders in their respective fields, and bring extensive research, practical, and professional experience to each project. The Center’s research has catalyzed major policy initiatives and projects in housing, economic redevelopment, transportation, social services, and health services throughout South Florida.

The University of Miami Office of Civic and Community Engagement is a university-wide office that fosters collaboration by engaging the university's academic resources in the enrichment of civic and community life. Through our Focus on Affordable Housing initiative and our collaborations with several university and community partners, we have developed a number of innovative programs such as training for emerging leaders in affordable housing; MAP Miami Affordability Project, an on-line interactive map of housing-related data; and public programs featuring national and local experts on housing and community development.

The Liberty City Economic Analysis and Opportunities Report was developed by:
Principal Investigator


Edward Murray, Ph.D., AICP Associate Director, FIU Metropolitan Center
Contributing Author
Kevin T. Greiner, MUP, JD
Senior
Fellow, FIU Metropolitan Center
FIU Metropolitan Center Contributing Researchers
Maria Ilcheva, Ph.D., Senior Research Associate
Daniela Waltersdorfer, Graduate Research Assistant
UM Office of Civic and Community Engagement Contributing Researchers
Robin Bachin, Ph.D., Assistant Provost
Jorge Damian de la Paz, Program Manager
Table of Contents Executive Summary i Introduction 1 Purpose 1 Why is This Report Important? 1 Recognizing Economic Opportunities for Liberty City 2 Report Elements 2 Key Findings: The Regional Growth Context 4 The Sources of Regional Population Growth 4 Regional Employment Growth 4 A Region Driven by Small Businesses 7 A National Leader in Entrepreneurial Activity 7 A Blossoming Incubator and Accelerator Ecosystem 7 Key Real Estate Market Performance Factors 12 Regional Economic Challenges 16 Key Findings: Liberty City .................................................................................................................... 19 The Liberty City Market Area 19 A Major Economic Sub-Region 20 Labor Supply 20 Liberty City Business Dynamics 29 Employment Density and Job Location: The Jobs Mismatch Opportunity 38 Strategic Location and Connectivity 40 Economic Assets within the Market Area 41 Housing 43 Land Use, Redevelopment Potential and Zoning 50 Business Development Incentives 58 Identity and Brand Recognition 59 Rethinking Liberty City: Opportunities and Challenges 60 Key Strengths and Opportunities 60 Redevelopment and Job Growth Challenges 61 Economic Development Opportunity Strategies 64 Strategy 1: 64 Connect the Resident Labor Force with Existing Businesses in Liberty City 64 Strategy 2: Connect Liberty City Businesses to Regional Industry Growth Sectors 65 Strategy 3: Re-Tool Local Business Development Incentives 66 Strategy 4: Build an Accelerator Ecosystem for Liberty City 67 Strategy 5: 67 Expand Local Business Technical Assistance 67 Strategy 6: Amend Miami-Dade County and Miami 21 Zoning Codes to Support Redevelopment 68 Strategy 7: Sponsor a Catalytic Signature Development Project 69 Strategy 8: Implement a Development Land Bank Program 69 Strategy 9: Aggressively Market Liberty City’s Strengths and Opportunities 69 Strategy 10: Create or Assign an Agency to Lead Economic Development in Liberty City 70 Appendix 1: State & Local Business Development Incentives 71
Executive Summary
The Liberty City Economic Analysis and Opportunities Report provides a competitive assessment that identifies the economic strengths (local assets), challenges (obstacles) and opportunities in Liberty City. The report will enable Miami-Dade County Public Housing & Community Development (PHCD) and local businesses and residents of Liberty City to make informed decisions regarding its development and growth potential.
The study’s aim is to position Liberty City's businesses and residents to expand local economic assets while connecting to and competing in the regional economy The report identifies those industry sectors that can enhance the potential for economic growth and opportunity in Liberty City, including the ability to attract, generate and retain economic investment.
The central conclusion of the Study Team’s research is that although Liberty City is one of the County's poorest neighborhoods, it has significant competitive advantages, strengths, and opportunities on which to build a local economy that expands opportunities for its residents. Its many economic strengths include:

n Liberty City is competitively situated within an extremely important economic subregion. Liberty City has a current population of 49,981 residents and 15,614 households. Were Liberty City its own City, it would be the County’s 7th largest of its 34 municipalities. The population of its Market Area is currently 517,572 persons. If the Market Area was its own city, it would be Florida’s 2nd, and the Nation’s 34th largest city bigger than Sacramento, Kansas City, the City of Atlanta, Miami, Oakland, New Orleans, Cleveland, Tampa, and almost twice the size of Orlando. Despite declining incomes, Liberty City and its Market Area represent significantly large purchasing power catchment areas. Aggregate household income in Liberty City in 2014 was over $543 Million, while the Market area represents one of the County’s largest purchasing power communities. Aggregate household income in the Liberty City Market Area is over $6.4 Billion;
n Numerous redevelopment projects emerging within and in nearby neighborhoods. The most significant redevelopment Liberty Square Rising is a 1,572 unit, $307 Million-plus development that will replace older public housing and add 815 garden-style units, priced for those in need of workforce and affordable housing, including seniors and youths aging out of foster care;
n Liberty City is also well-positioned to tap into the broad base of entrepreneurial activity occurring in the surrounding Trade Area. Growing entrepreneurial activity is found in most industry sectors, including professional and technical industries involving high-tech advanced manufacturing;
n Contrasted to the earning and incomes of its residents, Liberty City is a surprisingly diverse, dynamic, and growing business destination within Miami-Dade County. In fact, its industry composition, growth dynamics, performance, occupational mix and business community may be its single strongest asset and opportunity for broader redevelopment;
i
n Liberty City’s business economy is driven by small, locally owned businesses over 87 percent of all businesses in Liberty City employ less than 20 people, and 1,504 are single locations, as opposed to branch, franchise establishment locations. However, Liberty City’s business community also has tremendous regional market reach. The total annual sales of all business establishments located in Liberty City who report their annual sales is over $12 billion. Its businesses are selling to an extended regional, and in some cases, national market of consumers and clients; and
n Liberty City is one of the few communities in Miami-County where jobs within its boundaries outnumber its employed residents Liberty City’s over 16 employed population numbers 15,059, while the employers within its boundaries provide 18,526 jobs. Significantly, an inflow and outflow analysis of jobs versus residents in Liberty City found only 3.6 of all working age residents who live in Liberty City work there, while over 95 percent of the jobs in Liberty City are taken by workers who live outside Liberty City. Clearly, Liberty City does not want for jobs, but the reverse its residents need to be better prepared to take the large variety of jobs created in its vibrant business community.
The study’s economic analysis found clear opportunities for Liberty’s City’s businesses and residents to expand local economic assets and connect to the larger economy. Given Liberty City’s opportunities, strengths, and challenges, economic redevelopment of the community should be targeted at achieving five objectives:
n Increase the skills and education of local residents to assume and transition into higher paying jobs and compete for valuable employment already present in Liberty City;
n Liberty City can benefit significantly in the short term by growing the businesses it already has. Incentives, investment and business support is best directed at existing small local businesses;
n Build employment and asset wealth by aggressively supporting the formation of new start-up businesses by local entrepreneurs;
n Implement strategically targeted, incremental physical investments to stimulate redevelopment and physical improvements in highest need locations in the community; and
n Drive neighborhood business growth through strategic public-private initiatives and partnerships that can help leverage and influence larger market forces and strengthen their local and regional competitiveness.
In order to accomplish the above objectives, the following are specific economic development “opportunity” strategies that should be implemented in Liberty City in the near term.
Strategy 1: Connect Resident Workers with Existing Businesses in Liberty City
Connecting Liberty City’s working residents with job opportunities in Liberty City’s existing businesses might be its most potent immediate employment and income strategy . As such, a targeted job training program matching training with Liberty City business needs is recommended.
ii
Strategy 2: Connect Liberty City Businesses to Regional Industry Growth Sectors
Research has found that inner cities experience faster employment growth when they have strong connections with regional clusters. The analysis found that businesses in Liberty City and its Market Area are already selling to an extended regional market of consumers and clients. Liberty City, given its location, land availability, and strong small business community, is an ideal location for the creation and expansion of businesses within targeted industry sectors including building & construction, healthcare, culture & entertainment, financial & real estate, professional services, electronics, biomedical supplies & labs, and consumer goods manufacturing.
Recommended cluster-based development investment strategies include: 1) Supporting business development in Liberty City by connecting local businesses with regional clusters; 2) Identify the human capital and employment skills that are needed by businesses and organizations in both Libert y City and regional clusters; and 3) Connect cluster industry entrepreneurial ecosystems to small and minority owned-businesses in Liberty City.
Strategy 3: Re-Tool Local Business Development Incentives
Supporting wealth creation and job opportunities within Liberty City requires continued and expanded support for neighborhood businesses. Job creation and business investment incentives are also a critical competitive advantage. As we have noted, however, businesses in Liberty City, and many small businesses that might consider a location in Liberty City are eligible for few, if any, economic development incentive programs.
A package of economic development incentives aimed at Liberty City’s specific needs, is recommended, including 1) Revising the County’s existing Urban Jobs Tax Credit Program; 2) Reestablishing a local (County) Enterprise Zone program; 3) Small-scale Seed Grants for community led small-scale neighborhood economic development and revitalization projects; 4) Establishing Business Opportunity Districts with automatic property tax, job creation and other incentives; 5) Providing Financial Assistance for Demolition Costs; and 6) providing Public-Private Financing Tools including low cost loans, interest buy-downs, and Florida New Markets Tax Credits.
Strategy 4: Build an Accelerator Ecosystem for Liberty City
Liberty City has proven to be a desirable business location. North Central Miami-Dade is also home to significant local entrepreneurial talent with the potential to create a myriad of new and expanding business opportunities in Liberty City. However, entrepreneurs choosing to invest in distressed neighborhoods face challenges including securing early stage funding, connecting to markets, connecting to investors, and securing appropriate office and/or manufacturing space.
The study recommends establishing a network of business accelerators focused on serving local entrepreneurs and social impact entrepreneurs. Even three small well run accelerators could serve up to 96 businesses per year, creating up to 360 new jobs per year. Additionally, accelerators are most effective when privately owned and operated. Though developing a small network of accelerators may require an initial seed investment or subsidy, the continued costs of operation would be a completely private expense.
iii
Strategy 5: Expand Local Business Technical Assistance
Growing Liberty City’s existing businesses is the fastest way to grow new jobs in the community. However, expanding market share, making new capital investm ents, or moving into new markets can be a daunting, risky, or difficult proposition. Small businesses benefit from technical support when making critical expansion decisions.
The study recommends aggressively expanding the scope and quality of business technical support services in Liberty City. The region has a number of qualified non-profit business development service providers who affordably focus on stabilizing and growing small businesses with modest revenues in distressed neighborhoods.
Strategy 6: Amend Miami-Dade County and Miami 21 Zoning Codes to Support Redevelopment
The existing zoning regulatory scheme applying to Liberty City is inconsistent, fractioned, and includes uses which hamper the near and long term development of higher wage, higher skilled businesses along its commercial corridors and industrial areas. The study recommends the following targeted changes to both the County and City of Miami zoning codes in Liberty City aimed at providing a consistent zoning framework, increasing commercial development, especially office development, by increasing density and height limits at crucial commercial nodes, and eliminating inconsistent uses that depress values and limit commercial and office development
Strategy 7: Sponsor a Catalytic Signature Development Project
Directing the development of a signature, high -impact development project on an underutilized parcel or property can have catalytic effects on nearby properties and districts, provide community benefits, and stimulate further economic development A properly conceived development project can jump-start significant new development in the community. The study recommends sponsoring a signature, high visibility, high impact development project creating high-wage jobs for local residents.
Strategy 8: Implement a Development Land Bank Program
Land banks are public or community-owned entities created for a single purpose: to acquire, manage, maintain, and repurpose vacant, abandoned, and foreclosed properties. They can simply acquire property on behalf of a local municipality, or act as a full-fledged property developer. Generally, land banks acquire or receive of tax-foreclosed property, and provide a property inventory for long-term community development. Successful land bank programs revitalize blighted neighborhoods by directing reinvestment to support their long-term community vision. The study team recommends formation of a Community Land Bank program operated by the County or a designated third party development agency.
Strategy 9: Aggressively Market Liberty City’s Strengths and Opportunities
Aggressively marketing Liberty City through a multi-pronged, multi-media marketing program to businesses, entrepreneurs, investors, developers and site selectors can spur new investm ent and help connect Liberty City business with regional markets. The elements of the marketing program should include 1) a WEB site; 2) a digital marketing package with all basic information needed to consider expanding, growing, or relocating a business in Liberty City; 3) a Direct Marketing Program; and 4)
iv
In-Person Presentations and Regular Communications to professional development, business and realty groups.
Strategy 10: Create or Assign an Agency to Lead Economic Development in Liberty City
Implementing the economic development program recommended herein will require a dedicated agency with staff and resources to raise, coordinate and direct investment in Liberty City. The study team recommends either 1) designating an existing non-profit agency, or 2) creating a new agency to lead redevelopment programs in Liberty City. The development agency could be a new or existing CRA, Community Development Corporation, or non-profit community development agency with the required staffing and resources to carry out the economic development plan. Ideally, the agency should be a community-led partnership to finalize and carry out the strategy, ensuring that the benefits of increased economic activity flow to those most disconnected from the regional economy
v
Introduction
Purpose
Ultimately, the purpose of local economic development is to build community capacity to improve its economic future and the quality of life for all. The ability of communities to improve the quality of life, create new economic opportunities and fight poverty depends on understanding the forces of economic growth and then acting strategically to maximize their competitive advantages and strengths.
The Liberty City Economic Analysis and Opportunities Report provides a competitive assessment that identifies the strengths (local assets), challenges (obstacles) and opportunities in Liberty City. The report will enable Miami-Dade County Public Housing & Community Development (PHCD) and local businesses and residents of Liberty City to make informed decisions regarding the local economy and its development and growth potentials.
To create thriving commercial areas, successful neighborhood businesses and equitable access to quality jobs, the study’s aim is to position Liberty City‘s businesses and residents to connect to and compete in the larger regional economy. As such, the following report identifies those industry sectors that can enhance the potential for economic growth and opportunity in Liberty City, including the ability to attract, generate and retain economic investment.
Why is This Report Important?
There is substantial evidence, both nationally and locally, that the health and vitality of neighborhoods and the growth of local and regional economies can be mutually supportive. County and regional economic growth can substantially impact the vitality of neighborhood businesses and residents, while economically vibrant neighborhoods can significantly impact the growth of the larger local economy. The revitalization of the Wynwood neighborhood is a prime case study example here in Miami. Neighborhoods, in fact, are the building blocks of the broader local economy for the following reasons:
Neighborhoods are Home to the Vast Majority of Small Businesses and Workforce
In Miami-Dade County, 81 percent of business establishments have under 10 employees and 66 percent under 5 employees. The small businesses which serve as the engine of Miami-Dade’s economy are concentrated along the neighborhood commercial corridors that crisscross the County. Further, the neighborhoods are home to the County’s workforce. Neighborhoods generally house over 90 percent of the local workforce. Therefore, neighborhood revitalization can have a direct positive benefit for businesses and workers where they already reside.
1
Neighborhoods are Home to Key County Business Assets
Neighborhoods are typically home to most of a county’s important business assets such as hospitals and medical facilities, transit hubs, educational facilities, parks, community centers and other amenities. As such, neighborhood economic development should also be viewed as a critical business investment.
Neighborhoods Can Best Fulfill Niche Market Demands
The greatest strength of neighborhoods are its people and their rich history and cultural diversity. As such, neighborhoods are home to entrepreneurial activity that is organic and authentic and meets the demands of local residents.
Recognizing Economic Opportunities for Liberty City
Liberty City is situated in the heart of Miami-Dade County with an abundance of opportunities to connect to the larger economy of the region through highway and rail access. Liberty City is connected to Interstate I-95 at two intersections (NW 79th and NW 62nd Streets) and with regional transit via the Amtrak/Tri-Rail Station located on NW 79th Street. Local bus routes also crisscross the neighborhood. The primary commercial corridors running through Liberty City are NW 7th Avenue and NW 79th Street. Secondary commercial corridors include Martin Luther King Boulevard (NW 62nd Street) and NW 54th Street.
Liberty City has long been considered the heart of Miami-Dade County's largest African-American community. It is also one of the County's poorest neighborhoods, yet it has significant assets and numerous redevelopment projects emerging within and in nearby neighborhoods. The most significant redevelopment Liberty Square Rising is a 1,572 unit, $307 Million-plus development that will replace older public housing and add 815 garden-style units, priced for those in need of workforce and affordable housing, including seniors and youths aging out of foster care. Currently, Liberty City is well-positioned to tap into the broad base of entrepreneurial activity occurring in the surrounding Trade Area. Growing entrepreneurial activity is found in most industry sectors, including professional and technical industries involving high-tech advance manufacturing. Liberty City is also well-positioned to attract local food retailers including ethnic restaurants, brewpubs and tap houses which are becoming popular “niche” retail strategies in South Florida. The NW 7th Avenue and NW 79th Street Commercial Corridors could be excellent locations for mixed-use development combining retail, office and food services.
Report Elements
The Liberty City Economic Analysis and Opportunities Report consists of the following elements:
Demographic and Economic Analysis
The Demographic and Economic Analysis element provides an accurate demographic and household representation of the Liberty City including both existing and projected demographics and important shifts. This is particularly important in a dynamic market such as Miami-Dade County where population and household growth is undergoing rapid change. The approach is to fully calculate
2
demographic shifts, changing market demands and the impacts on business and real estate development activity.
Business and Industry Dynamics Analysis
The Business and Industry Analysis element identifies potential economic drivers that can potentially attract private investment, stimulate job creation, and expand the tax base and economic opportunities for Liberty City’s businesses and residents. A competitive assessment focuses on the existing businesses and assets of Liberty city and the larger trade area. The competitive assessment identifies the economic advantages of key commercial corridors and industrial lands, local demand conditions derived from the population base, and future economic opportunities based on the presence of growing and sustainable businesses and industrial sectors.
Economic Development Opportunity Assessment
The Economic Development Opportunities Assessment incorporates the above analytical findings. The Assessment includes recommended strategies and programs focused on stimulating business investment and job creation. The assessment focuses on the following economic opportunity areas:
n Small business creation based on Liberty City’s economic development potential and competitive advantages;
n Business cluster strategies for Liberty City’s most promising target industries, occupations, and new business formation opportunities;
n Specific strategies to grow and diversify Liberty City’s economy and expand business opportunities and investment by connecting new and existing businesses with growing industry sectors and businesses in Miami-Dade County and South Florida;
n Identifying and articulating the specific needs of target businesses and industry clusters to structure the County’s direction of resources, programs and incentives.
3
Key Findings: The Regional Growth Context
Liberty City’s future will play out in the context of a variety of regional and national development trends. The key trends affecting Liberty City are as follows.
The Sources of Regional Population Growth
Miami-Dade County’s population growth is characterized by two distinct recent growth phases. The County’s total population grew 18.2 percent from 2000 to 2014, averaging 1.7 percent increase per year. However, the County grew 5.9 percent from 2000 to 2007, but population growth accelerated after the last recession, growing 11 percent from 2008 to 2014.
Additionally, until 2010 the County’s population growth was driven by natural population change (net births and deaths), accounting for 60 percent of all population growth, with net migration accounting for 40 percent of population growth. From 2011 to 2015, the sources of population growth have reversed. Net migration now accounts for 58.7 percent of the County’s population growth, and natural increase the remainder.
In fact, Miami-Dade’s population growth has been driven by international in-migration. From 2011 to 2015, the County gained over 165,000 new residents from foreign countries, while at the same time losing over 79,000 residents to domestic out-migration. Only two other metropolitan areas share this same population growth dynamic: New York and Los Angeles. The County’s forecasted population growth, once expected to slow into the next decade, has in fact accelerated each year since 2008.
Countywide, household size has increased: the average size of renter households has increased from 2.6 to 2.9 persons, and households in owner occupied units from 3 to 3.3 persons over the same period.
Regional Employment Growth
Employment Growth
Miami-Dade has grown into an internationally competitive center for financial services, a wide array of trade related services and exports, real estate development, and a gateway for talent and investment from Latin America and the world. Since the post-recession low, the County economy has added 139,700 jobs. As of the close of 2015, Miami-Dade’s employed workforce of over 1.135 Million is the largest in its history.
4
Total Non -Farm Employment
Miami- Dade County Annual Average Employment Totals
2.2. Employment Growth Forecasts
The Beacon Council’s One Community One Goal, completed by Avalanche Consulting, is the most comprehensive examination of sector, industry and cluster growth trends conducted in the County over the last decade. One Community One Goal examined the relative size and growth of 30 industry clusters (industries at the 4 digit, NAICS level). According to Avalanche and EMSI, the fastest growing industry clusters and their rates of projected job growth in Miami-Dade from 2010 to 2020 are:
n Research (64.5 percent)
n Software / IT (26.0 percent)
n Agribusiness & Food (14.2 percent)
n Automotive (22.6 percent)
n Back Office (22.3 percent)
n Building & Construction (17.2 percent)
n Energy (15.3 percent)
n Healthcare (14.2 percent)
n Non-Profits (13.5 percent)
n Private Education (13.4 percent)
n Culture & Entertainment (11.3 percent)
5
900,000 950,000 1,000,000 1,050,000 1,100,000 1,150,000 1999 2000 2001 2002 2003 2004 2005 2006 2007 2008 2009 2010 2011 2012 2013 2014 2015 Source: US
Dept. of Labor, Bureau of Labor Statistics
n Financial & Real Estate (10.4 percent)
n Professional Services (10.2 percent)
n Electronics (10.0 percent)
n Biomedical Supplies & Labs (6.7 percent)
n Consumer Goods Manufacturing (6.2 percent)
n Transportation & Logistics (4.9 percent)
Avalanche has forecasted the 18 fastest growing clusters will add over 107,000 new jobs in MiamiDade over the next ten years. In addition, since publication of One Community One Goal, International Trade has shown continuing growth, with the value of total trade moving through the County’s airports and seaport growing each year since 2011. The deep dredging of the Port of Miami, combined with the widening of the Panama Canal, will dramatically increase shipping capacity and traffic through the Port. The employment impact is expected to create 33,000 jobs in the region in a range of occupations and industries, including Warehousing, Transport, and Trade Finance.
Dr. Richard Florida offers a different, yet complementary perspective on the relative strengths, weaknesses and economic opportunities in the Miami-Dade metro area in his recently published study Miami’s Great Inflection: Toward Shared Prosperity As A Creative and Inclusive Global City Focusing on both the region’s relative concentration and prospects growth of key occupational clusters, he notes that seven major occupational groups, including legal, healthcare, businesses and financial operations, and arts, design, and media , represent the region’s key talent strengths, and its best prospects for new employment opportunities in the near term.
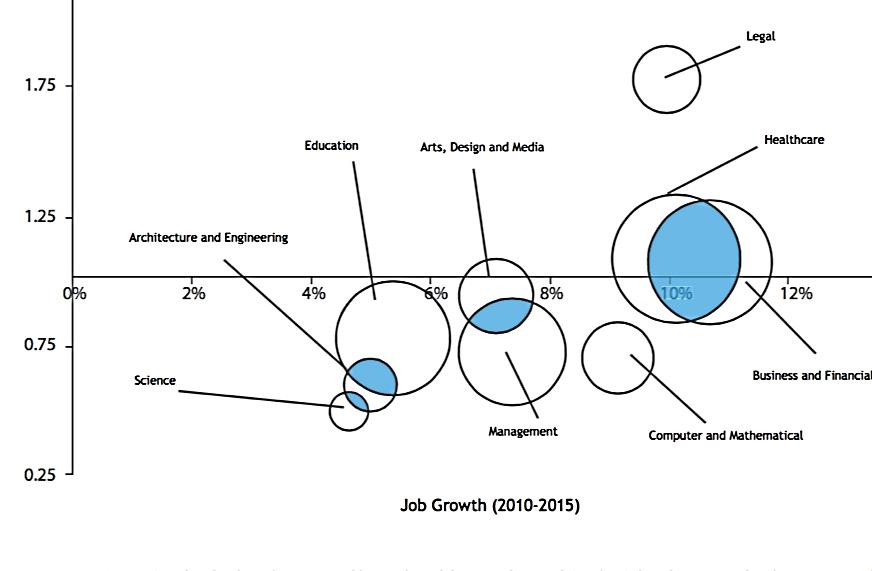
Source: Miami’s Great Inflection: Toward Shared Prosperity as a Creative and Inclusive Global City. The FIU -Miami Creative City Initiative
6
A Region Driven by Small Businesses
Miami-Dade County’s economy is driven by its especially high proportion of small businesses. Over 90 percent of all business establishments with payroll in the County employ less than 20 people. Miami-Dade’s self-employment rate is nearly twice the national average. Combined with single proprietor establishments (self-employed businesses establishments with only one principal), establishments employing less than 20 represent over 98 percent of all businesses, employing over 50 percent of the County’s workers.
Since the 2008 recovery, both establishments employing less than 20 and single proprietor establishments have grown by 17 percent, while establishments employing more than 20 have grown by only 7.3 percent.
A National Leader in Entrepreneurial Activity
Over the last decade, Miami has consistently ranked as one of the top five metro areas with the highest rates of entrepreneurial activity. According to the 2015 Kaufmann Index of Entrepreneurial Activity, the Miami metro area (Miami-Dade, Broward and Palm Beach Counties), is the second highest ranked metro for entrepreneurial start-ups. Miami ranks as the highest metro in the country in terms of the number of entrepreneurs as a percentage of the population (247.6 out of every 10,000). Surprisingly, 73.9 percent of all entrepreneurs are employed at the time of new business creation, meaning that they are predominately creating new businesses in response to opportunity, and not out of necessity.
Unfortunately, although Miami has one of the highest rates of entrepreneurial creation in the nation, its start-ups have exceedingly low growth and survival rates. The Kauffman Foundation’s 2016 Growth Entrepreneurship Index ranks the Miami metro second last of the largest 40 metro areas in terms of the growth rate, or ability to scale, of its new start-ups.
A Blossoming Incubator and Accelerator Ecosystem
Incubators and Accelerators
Precise data on business incubators and accelerators operating in the U.S. is challenging, due to how accelerators and incubators self-identify, and the rapid growth of accelerators from 2008 through 2012. Business incubators have a long history the first recognized business incubator opened in 1959 in Batavia, New York. According to the National Business Incubation Association, as of October 2012, there were over 1,250 incubators in the United States, and over 7,000 incubation programs in operation around the world.
Y Combinator, the first formally recognized business accelerator, was founded in 2005 in Cambridge, Massachusetts. Accelerators have since grown to over 200 in 2015. Seed-DB, an on-line business accelerator analytics database, lists 235 accelerator programs worldwide. [Seed -DB.com, 2016]
Incubators and accelerators are not the same. Although they may provide some of the same services to client enterprises, incubators typically provide reduced rent working space for 1 to 3 years, based on the needs of the client enterprise, and consulting and business development services that clients
7
may or may not pay for. Incubators range widely in size, averaging 22 client firms in residence at any time. [U.S. EDA, 2011]
Incubators are predominately non-profit entities. According to a study by the U.S. Economic Development Administration with the National Business Incubation Association (NBIA), 25 percent of incubators are sponsored by academic institutions, 19 percent by economic development organizations, (22 percent), by government entities, and only 4 percent are sponsored by for-profit entities. Access to incubators is mostly non-competitive the incubator accepts rent from its resident client firms.
Accelerators require competitive applications from enterprises, and accept a take a group of client businesses (a “class”) through a specific and tightly defined, shorter duration program, at the end of which client firms “graduate” with a pitch event to investors. Class size averages 8 to 10 businesses and the average program length is 3 to 6 months.
Most accelerators are privately owned, although public and non-profit accelerators are growing. Unlike incubators, accelerator clients are usually paid a seed investment for which the accelerator receives equity. Average seed investment in U.S. accelerators is $22,000
Incubators and accelerators work with firms at either one or all of the early stages of business development and funding. They both also can have a sector and/or geographic focus, or support enterprise development across sectors or locations. Incubators and accelerators provide a mixed basket of services, including:
n Enterprise Pipeline and Selection: a competitive selection process and evaluation for applicant enterprises (typically accelerators only);
n Expert mentorship;
n Financial support including direct investment funding and /or grants;
n Access to potential investors;
n Infrastructure support (office space, shared back-office services);
n Marketing and brand development;
n Access to an established network of partners and customers (Accelerator Networks), sometimes through formal partnership agreements with impact investors, commercial investors, foundations, governments, and universities;
n Business skills development;
n Technology training and assistance; and
n Post program support, including business performance metrics and evaluation for incubator graduates. Services can last between one and six months post-graduation, up to the life of the graduating enterprise.
Incubators earn revenue from rents, in-kind contributions, and on-going public support. Accelerators earn income through a variety of vehicles, including entrepreneur fees, consulting contracts, returns from Investment, “success fees” from Investment, and philanthropic and grant support.
Incubators and accelerators provide three primary business development functions:
8
n Bloomberg estimates that 80 percent of all businesses fail in the first 18 months, and 55 percent of all businesses fail within five years. By providing support services, mentoring, and education, incubators and accelerators exist to help improve the odds of success for startups, as well as their business longevity;
n Incubators and accelerators are designed to speed up the funding cycle and growth rates of their client companies, helping them achieve significant funding and staffing faster than they would if left on their own;
n By combining services and infrastructure in one location, they both are designed to deliver services that obtained separately, are difficult and costly for young businesses; and
n Incubators and accelerators help build a more efficient venture capital and business investment market. Well run operations network with hundreds of potential investors, providing efficiency for both companies seeking investors and investors seeking opportunities.
The Miami-Dade Accelerator Ecosystem
The growth of Miami-Dade’s incubator and accelerator ecosystem has been a leading bright spot on the County’s economic landscape and one of its real success stories since the recession. The County’s incubator and accelerator ecosystem was virtually non-existent in 2008 – 2009. Miami-Dade’s incubator and accelerator market is small in size compared to other regions on a per capita basis Gainesville has one of the highest per capita incubator/accelerator per capita rates in the nation . However, the County’s rapidly growing cohort of accelerators is distinguished by its depth and breadth. Accelerators of note that have established in Miami-Dade County include:
n Venture Hive
n Rokk3r Labs
n Project Li!
n TECKpert
n The LaunchPad
n Startup Miami
Miami-Dade’s emerging accelerator industry, combined with its economic relationships with Latin America, has attracted the attention of major accelerator industry establishments. The area’s largest accelerator projects include:
n StartupBootcamp is Europe’s largest accelerator owner and operator, with locations across Europe. StartupBootcamp selected Miami as its first U.S. location in 2014;
n Endeavor is a global non-profit accelerator operator now supporting over 1,500 entrepreneurs in Latin America, Africa, the Middle East, Southeast Asia, and the U.S. According to Endeavor, its global accelerator network has created more than 500,000 high-value jobs and in 2014, generated $7.7 Billion in investment. Endeavor Miami is its Miami flagship;
n The Miami-Dade College IDEA Center houses the CREATE Accelerator, supporting student entrepreneurs, includes co-working spaces and attracted a leading Advisory Board;
9
n The University of Miami, in a public-private partnership, has developed the University of Miami Life Science and Technology Park (UMLST), located in the University of Miami's Health District in Overtown, the second largest Health District in the USA. The UMLST has already landed world-class research institutions, and medical technology tenants; and
n The Cambridge Innovation Center (CIC), founded in 1999, is one of the nation’s most established incubator/accelerators. Companies originally based at CIC have raised over $1.8 Billion in venture capital. CIC chose Miami as its second expansion location, is opening a new center in the UMLST that will house as many as 500 tech startup companies. The Miami CIC location is expected to open in Fall 2016.
Growing in parallel with the accelerator/incubators, Miami-Dade County is now home to a wide range of support organizations that market, promote, support, and network accelerators, investors and entrepreneurs. eMerge Americas, founded locally, is the largest regional innovation support organization, and hosts regular tech conferences attended by investors from around the world. Launchcode, a St. Louis non-profit, opened in Miami in 2014 and provides sector, technology and company-specific training courses for individuals seeking employment in Miami’s tech economy.
Like the County’s broader incubator and accelerator ecosystem, Miami-Dade’s emerging group of social enterprise and social impact incubator/accelerators has grown quickly, including home-grown organizations and branch locations of established national accelerator entities. Miami-Dade’s social enterprise and social impact accelerators of note include:
n Radical Partners: launched in 2012, Radical has helped grow more than fifteen social-impact organizations, and has coached more than 45 social entrepreneurs.
n AT&T Aspire works with for profit and non-profit organizations focused on social impact. The AT&T Aspire Accelerator Program has recently opened applications for companies working in the educational technology sector. Solutions for students at risk of dropping out of school will receive special consideration. Aspire Accelerator is part of AT&T’s $350 million commitment to empower students to reach their full potential, and includes a 6 month accelerator program with $100,000 investment.
n Babson College Women Innovating Now Lab , or WIN Lab, assists women entrepreneurs launch successful businesses. Its accelerator program includes training sessions, mentoring, networking with investors and co-working space.
n The Center for Social Change is a collaboration of Charity Deposits Corp., Charity Services Centers and the Center for Social Change, formed to support social entrepreneurs and nonprofits.
n Ashoka South Florida is not a formal accelerator, but a global support network that connects social entrepreneurs, investors, and professionals to support and leverage their social impact efforts.
Growing in parallel with the accelerator/incubators, the County is now home to a wide range of support organizations that market, promote, support, and network accelerators, investors and entrepreneurs. eMerge Americas, founded locally, is the largest regional innovation support organization, and hosts regular tech conferences attended by investors from around the world. Launchcode, a St. Louis non-profit, opened in Miami in 2014 and provides sector, technology and company-specific training courses for individuals seeking employment in Miami’s tech economy.
10
Lastly, Miami-Dade’s largest foundations have played a critical leadership role in the growth of its incubator/accelerator ecosystem, providing seed funding to accelerators, support organizations, conferences, and promotional event. The Knight Foundation has been deeply involved in funding nearly every significant accelerator-related development since 2008. It took an early leadership role in development of the sector, and has been instrumental in its formation and growth.
The payoff resulting from the growth of Miami-Dade’s accelerator/incubator ecosystem has been substantial. While performance data regarding specific companies graduating from Miami-Dade’s accelerators in incomplete, the bigger picture numbers are impressive. Miami-Dade’s accelerator programs regularly draw innovators and entrepreneurs from around the nation and Latin America. More importantly, according to an analysis by Endeavor Miami, South Florida accounts for more than 50 percent of Florida’s venture capital investment deals, with approximately $6.9 Billion inves ted between 2009 and 2014 across 1,100 deals.
Incubator and Accelerator Performance
Interest from start-up clients and investors, as well as the growth in the number of incubators and accelerators, has never been greater. According to the National Business Incubation Association (NBIA), “in 2011 alone, North American incubators assisted about 49,000 start-up companies that provided full-time employment for nearly 200,000 workers and generated annual revenue of almost $15 billion.” [NBIA, 2012] Also, according to the NBIA, incubators generate $30 dollars in local tax revenue for every $1 of public investment. According to Seed-DB.com, accelerators worldwide accelerated 5,693 companies, attracting almost $13 Billion in funding.
Additionally, according to the NBIA, Business incubators reduce the risk of small business failures. NBIA member incubators reported that 87 percent of all firms that have graduated from their incubators are still in business five years later, versus a survival rate for non-incubated businesses at 44 percent. A recent Cambridge University study indicated that accelerators increase business survivorship rates by 10-to-15 percent, and preliminary research at Emory University indicates that business enterprises in accelerators have faster revenue growth and more employees than nonaccelerated business enterprises.
Yet despite the broad interest, the precise impacts on individual businesses and enterprises is inconclusive, largely due to the lack of academic research on the performance of businesses that graduate from accelerators and incubators, versus those that don’t. Researchers including the Kauffman Foundation, Hallen, Bingham, and Cohen (2014), Winston-Smith and Hannigan (2015), and the Brookings Institute could not find significant evidence that industry-wide, businesses graduating from incubators and accelerators outperformed non-incubated or non-accelerated businesses in terms of funding, growth, or survival.
However, there is evidence that individual high-performing incubators and accelerators do improve the performance of their client firms. Further, a growing body of research indicates that the presence of incubators and accelerators, especially as they grow in number within a region, has a significant positive impact on the regional economy, including: 1) attracting early stage funding for businesses,
2) bringing additional new investors to a community, 3) increasing overall venture capital investment,
4) stimulating regional employment and job creation, 5) increasing entrepreneurial activity and new business formation rates, and 6) providing immediate employment opportunities within the incubators and accelerators. Lastly, the NBIA claims that 84 percent of companies that graduate from incubators stay in their communities. [NBIA, 2006]
11
Key Real Estate Market Performance Factors
Miami-Dade County’s real estate markets have rebounded since 2009 following the region’s employment growth. In each major real estate sector, County markets have returned to varying levels of expansion and increasing value. The key regional and national real estate market trends that will have the most impact on Liberty City and surrounding areas include the following:
County-Wide Land Availability
Across all sectors, the availability of land will drive pricing and location of new development. MiamiDade County is largely built-out. Only 11,012 acres inside the Urban Development Boundary, and 2,083 acres inside the County’s Urban Infill Area are privately owned vacant land. Of the vacant acreage remaining in the County, parcels larger than 4-5 acres are at a premium.
The growing shortage of large undeveloped parcels is resulting in all real estate development sectors shifting to infill “urban” strategies with higher densities, designs, and smaller building footprints. County-wide, the development community is assessing and executing infill development strategies on smaller vacant properties, and those with underutilized or undervalued buildings. Miami-Dade County, as well as leaders in regional market intelligence, have noted that the County has a particular shortage of readily available land suitable for manufacturing, assembly, R&D, back office, and distribution uses.
Regional Housing Market
As reported in several recent FIU Metropolitan Center housing studies, the post-bubble housing market in Miami-Dade County and South Florida is far more complex than what existed during the height of the residential boom. The Center’s research concluded that increasing levels of affordability for existing single-family homes and condominiums after the collapse of the housing bubble had not improved overall housing affordability for existing owners and renters alike.
Workers and families in Miami-Dade County face a housing affordability quadruple effect: 1) housing prices in Miami-Dade have risen much faster than competing regions, 2) real incomes continue to decline, and job opportunities for higher paying occupations are less than they were before 2008, 3) loss of equity due to the crash of the real estate market and 4) due to Miami’s high demand for vacation properties, second homes, and investment properties, local residents compete in an international market for local housing units.
Since the trough of the 2008 recession, Miami-Dade has experienced strong real estate recovery residential real estate has experienced record sales volume each of the last four years (2012-2015) and rising median prices. According the Miami Association of Realtors analysis of Multiple Listing Service (MLS) Data, sales of existing single-family homes in the County have increased each year from 2008 through 2015, culminating in a new record number of single-family home sales in 2013, 2014, and 2015. Total condominium sales increased in the four years since 2008 before declining slightly since 2013. The median sale price for existing homes in the County has increased in 55 of the 56 months preceding January 2016. Significantly, 65.7 percent of all condominium closings and 37.1 percent of all single-family home closings were cash sales.
According to the U.S. Census Bureau, Miami-Dade County’s average rent continues to increase the average apartment rent has increased from $1,515 in 2009 to $2,501 in 2015, a 65 percent increase. Additionally, owner-occupied housing units in Miami-Dade County have decreased by 5.1 percent (24,709 units) since 2009, while renter-occupied units have increased by 8.8 percent (30,319
12
units) since 2009. Owner-occupied housing units with a mortgage in Miami-Dade County have decreased by 11.6 percent (40,181 units) since 2009. The largest loss of owner-occupied units was among owners in the $50,000 to $74,999 income range.
Miami-Dade’s housing market dynamics are problematic for households at the lower to middleincome ranges. The renewed escalation in housing prices, combined with shrinking household earnings, have resulted in Miami-Dade households paying an increasing share of their income for housing. The U.S. Department of Housing and Urban Development (HUD) considers a household “cost-burdened” if it pays more than 30 percent of its total income on housing costs. In 2014, over 61 percent of renter households, and over 42 percent of owner households in Miami-Dade County are cost-burdened, making it the third least affordable housing marke t in the nation. Severely costburdened renter households - those paying more than 50 percent of income on housing - have increased by 11.6 percent in Miami-Dade (12,845 renters) since 2009.
According to the Miami Association of Realtors, the median sale price of non-distressed single-family homes has risen to $312,750. The current median sale price represents a 6.2:1 single-family median sale price-to-median household income ratio, which is the highest since the height of the housing bubble.
If household transportation costs are considered in conjunction with housing costs, Miami -Dade County is quickly becoming one of the most unaffordable markets in the United States. According to the Center for Neighborhood Technology Housing & Transportation Cost (H&T Index), the average percentage of household income spent on housing and transportation for all households in the County, regardless of income, is 62 percent of annual income. In fact, over 85 percent of all households pay more than 45 percent of their income on housing and transportation, one of the highest ratios in the U.S. [Center for Neighborhood Technology 2016]
Rising housing unaffordability has broad impacts across the economy. It can have devastating impacts on households at the low end of the income spectrum, but in Miami-Dade, it is also sharply impacting workers in high-wage occupations, and increasingly, new workers just entering the labor force. Escalating rent prices fueled by the rental housing shortage are significantly impacting Mia mi-Dade’s working families and households a preponderance of workers earn salaries and wages in service sector occupations, including retail trade, leisure and hospitality, and educational and health services. While housing affordability is a growing concern for service sector workers, it has also limited the choices for young professionals in creative and cultural occupations. A recent Metropolitan Center study found that workers in computer systems designers, life science workers, educators and artists, who are often saddled with significant debt from student loans, are forced to live away from the more expensive employment centers in the downtown areas or have moved to other more affordable locations outside of Miami-Dade and South Florida.
Office Market
The office sector was the hardest hit commercial real estate sector by the recession, and has been the slowest to recover. Slow and now flat, overall employment growth has hampered office space recovery even with the addition of new jobs to the regional economy, according to CBRE Econometric Advisors, office employment has declined for the last five years.
Low prices, low vacancy rates, and no new inventory of Class C space would seem to be a real opportunity for Liberty City. However, four significan t trends will continue to impact Office demand in the County. U.S. companies are restructuring, consolidating and re-engineering their business practices, finding ways to shrink and share office space, including:
13
n Outsourcing non-core functions, such as IT, accounting, human resources, marketing and legal to lower cost providers;
n Shrinking the amount of square footage per employee. According to the CoreNet Global Corporate Real Estate 2020 survey, square feet per employee in the office sector shrank from 225 square feet in 2010 to 176 in 2012, and is projected to reach 151 or less in 2017;
n Corporations are placing talent closer to their customers and away from the central office. Telecommuting is not only a way to save on office space, but is ranked by 46 percent of corporate leaders in a recent Deloitte survey as second only to compensation as the best way to attract talent, and has also been made easier by communication technologies such as Skype and GoToMeeting. Between 1997 and 2010, there was a 35 percent increase in the number of people working from home (13.4 million people now work at least one day per week from home);
n Leading corporations are using more informal office space, moving satellite offices into neighborhoods, and using shared office space in main offices. PricewaterhouseCoopers has a desk reservation system. CBRE is moving to an unassigned workplace environment called CBRE Workplace 360
Retail Market
The Miami-Dade County retail market has shown improvement and growing strength since 2010
According to Deutsche Bank’s RREEF Global Real Estate Research Group, although e -commerce accounts for a relatively small share of total retail sales, it is capturing a significant share of sales in commodity items. E-commerce sales are pervasive excluding auto-related purchases (which don’t sell on-line) e-commerce grew 53.0 percent from 2007 to 2012, seven times the overall retail sales growth rate.
According to Deutsche Bank, the growing shift to online shopping has significant real estate implications. The amount of e-commerce retail sales in 2012 ($157 B), would equal between 350 million and 500 million square feet of leased retail space based on sales volumes, about a third of the vacant retail space in US shopping centers and retail districts. E-Commerce is diverting a rapidly growing percentage of shoppers away from physical stores, and the industry away from bricks-andmortar sales locations and development. The effects on the retail market include:
n Fewer and Smaller Stores, and a business focus on productivity (sales per square foot) over growth. Commodity retailers, especially big-boxes, will be especially vulnerable to online sales loss, and shopping centers not anchored by stores with items that can’t be sold easily online (grocery stores, etc.) will also be hard hit with shrinking sales;
n Portfolio Rationalization through store elimination: chains are rapidly closing significant portions of their physical store locations, including Abercrombie & Fitch, the Gap, Best Buy, and Radio Shack. E-Commerce has all but killed the physical bookstore already;
14
n Many chains are closing underperforming stores, selectively opening new stores, and pushing more sales online. Best Buy is perhaps the most illustrative, if extreme example: closing 50 full-line stores (generally 40,000 square feet+) at the same time they are testing new, smaller “connected” prototypes and opening 100 new 1,000square-foot Best Buy Mobile stores that focus on smartphones and tablets. Their goal is a 20 percent reduction in floor space;
n The Urban Strategy, or moving stores closer to urban consumers, with smaller footprints. Walmart is rolling out its Walmart Express format at just 15,000 square feet, compared to its normal prototype of close to 200,000 square feet. Similarly, Target developed a new CityTarget format, sized at 60,000 to 100,000 square feet, compared to over 130,000 for its typical suburban stores. Other brands are following suit Office Depot is downsizing its warehouse stores to 15,000 – 18,000 sf, and is developing a smaller 5,000 sf prototype ideally for urban areas. The same for Officemax from 23,000 down to 2,000 square feet, and Staples, from 18,000 down to 10,000 square feet;
n Flagship Stores in high-end and high rent locations, designed to market the brand, often at boutique scale size, and;
n Multi-Brand Stores, bringing multiple brands under one roof. The Gap and Toys R Us are both adopting prototypes in which their multiple flags (e.g., Banana Republic, Baby Gap and Old Navy for the Gap) in order to encourage cross shopping across their brands and reduce restocking costs and rent for the combined flags. Another strategy is the “store-within-a-store” format in which one retailer co-locates within others.
The Miami Market is seeing each of these trends play out, with chain retailers developing stores in highly urban locations, on smaller footprints, and in interesting vertical mixed -use configurations.
Lastly, new Walmart stores on the fringe of the CRA Market area will affect retail mix and potential competitiveness of new retail development of all kinds within the CRA. New Walmart stores of varying sizes are being developed in Midtown Miami, Hialeah Gardens, and at NW 79th Street and 32nd Ave.
Industrial and Flex Space Market
Marcus-Millchap ranked the Miami market as the fourth best performer of all large city industrial markets based on growing sales volume, rents, and strong demand (absorption). Key trends affecting the size and location of new buildings and demand in the industrial sector include 1) increases in same day delivery service for E-Commerce sellers, 2) continuous growth of 24-hour fulfillment, shipping and delivery, and 3) continuous growth in Latin American and Brazilian consumer markets and trade.
As the major trade gateway to South America, growth in the industrial sector has been driven by rapidly expanding South American trade volume and increasing intermodal shipping activity. The widening of the Panama Canal and dredging of the Port of Miami will increase the demand for warehouse and shipping facilities in the County, but also increase demand for back office, and support space, but not necessarily at the Port, where land is at a premium.
15
Access to Commercial Capital & Credit
Access to equity and debt financing was one of the worst casualties of the recession, hurting all segments of the economy. In South Florida, easy access to credit fueled the real estate run-up and business expansion from 2000 to 2007.
Post-recession, financing business expansion, development and redevelopment has undergone significant change. Equity investment in projects has become more difficult to obtain, and debt finance providers require significantly higher equity to debt ratios (as much as 50 percent) stronger credit ratings, and higher levels of personal and corporate guarantees. The rebound of investment financing has been slow during the recovery, particularly for small businesses, and has been extremely dependent upon historically low, federally subsidized, interest rates.
Direct Foreign Investment in Miami
Direct foreign investment in Miami-Dade has been a bright spot throughout the recession, supporting the growth of trade, trade services, finance, and real estate during the worst portions of the recession, and continues to grow since 2011.
Although the total amounts have not been formally quantified, indicators of the increasing levels of direct foreign investment in Miami-Dade include 1) the high proportion of first, condominium sales, and more recently, single-family homes, to foreign buyers 78 percent of all home sales in the Miami metro region are now in cash, 2) notable large-scale development projects, including the University of Miami Life Science & Technology Park, and 3) the large-scale entry of foreign institutional investors into the commercial real estate market, purchasing major office and commercial real estate portfolios across South Florida, and 4) foreign demand for residential properties, which has both consumed postrecession inventories and driven up home prices.
Rapid Speculation in Nearby Neighborhoods
Speculative real estate acquisition and development has driven up prices in neighborhoods including Wynwood, the Design District and Little Haiti. Rapid development of new high-end retail and residential development is forcing existing retail, assembly, design, product development, restaurants, arts businesses and artists out of these areas, which could be an opportunity for Liberty City.
Regional Economic Challenges
As noted in the Metropolitan Center’s recently published Miami-Dade Prosperity Initiative Feasibility Study, the County faces numerous economic challenges. Miami-Dade County is part of the 8th largest Metropolitan Area and is the 7th most populous county in the U.S. Its economy has grown into an international center of trade, finance, design, architecture and culture, and is the United States’ most important gateway to South America. The County has been a destination for families from the United States and abroad seeking a better future, and for many families, it became a home in which the American dream became reality. In Miami-Dade County, broad-based economic opportunity and prosperity have historically been hallmarks of the local economy, but that may not be the case today.
The Prosperity Initiative Study concluded that M iami-Dade County’s post-recession economy is significantly different in structure, performance, and competitive position than it was during the 2000 to 2007 economic expansion. Prior to 2007 Miami-Dade’s economy was characterized by growing opportunity, economic mobility and shrinking income inequality. In nearly every economic indicator
16
studied in the report, the County was significantly improving, growing, and gaining ground on its regional competitors prior to 2007. After 2008 that is no longer the case In the post-recession period nearly every economic indicator studied not only reversed direction for those at the bottom of the County’s income structure, but also slowed for households across the income spectrum.
Driven by the loss of higher paying jo bs, employment gains driven by lower wage jobs, and a host of rising economic barriers, a growing number of Miami-Dade residents are experiencing declining economic opportunity, mobility, and equity. The County faces a growing prosperity gap , both in terms of the difference in economic condition and opportunity between income groups, and the differences in economic structure and performance between the County and regions providing greater widespread prosperity. Specific findings detailing the County’s econ omic structure and its growing prosperity gap include:
n Despite recent employment gains, barriers to expanded prosperity, economic mobility and opportunity have been growing, rather than easing, during the post 2008 recovery;
n Evidence that Miami-Dade County’s economy is becoming less competitive. Despite Miami-Dade’s considerable assets, including its global tourism industry, transportation infrastructure (MIA, Port of Miami), and cultural diversity, it is underperforming. The local economy is struggling to increase its productivity relative to the rest of the nation;
n Declining real median income since 2000, accelerated real income decline since 2008, and income declines across every income segment in the County from 2000 to 2014. Only the County’s top 5 percent of all households gained income from 2008 to 2014;
n Incomes in all income quintiles that are lower than their respective national averages;
n Growing concentration of total income in the County’s top two income quintiles, and growing income inequality significantly above the national average;
n A countywide poverty rate, at 19.8 percent, that is 33 percent higher than the national poverty rate;
n Highly cyclical of job loss and recovery that erase significant household wealth, including homeownership equity;
n Low rates of vertical income mobility and declining horizontal job mobility;
n Rapidly rising regional housing and transportation costs;
n Based on productivity and occupation and wage data, an economy creating a preponderance of lower wage jobs, and only slowly creating jobs in leading highwage sectors;
n Persistent geographic poverty, unemployment and income inequality even in times of rapid economic expansion, a number of communities have not, and are not, participating in the economic growth of the region; and
n The lack of a coordinated local community development infrastructure.
The study also highlights three overarching conclusions regarding declining prosperity in the County. First, the impacts and barriers to expanded prosperity in Miami-Dade are not limited to affecting the
17
County’s lowest income earners, but are increasingly impacting workers, households and families across its income and occupational spectrum.
Second, failing to address the County’s prosperity gap could also present a sustained, growing drag on the broader regional economy, including stunting new business and job creation, hurting young workers and talent, even in high-skill occupations, and limiting the County’s plans to diversify and strengthen its economic structure.
Third, we have demonstrated in considerable detail that programs to expand prosperity are a sound economic investment: the research team’s overarching finding is that expanding prosperity through wider access, preparation and opportunity for higher wage employment to the County’s lowest income households would not only improve living conditions for the households impacted by such programs, but provide potentially dramatic economic impact for the broader County economy, benefitting other County residents across nearly all income ranges and occupations.
18
Key Findings: Liberty City
The Liberty City Market Area
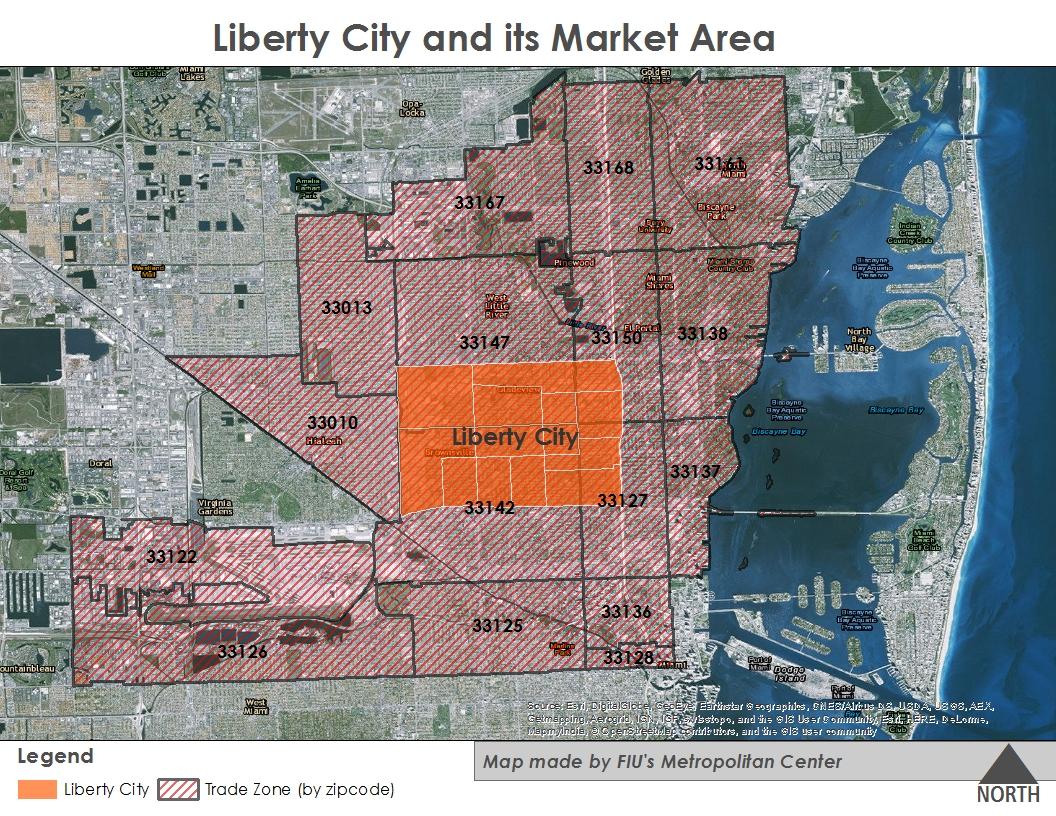
The Liberty City economy operates within, and interacts closely with its broader Market Area. For purposes of the study, the Liberty City Market Area is defined as the area within a roughly 22-minute drive from the Center of Liberty City to its northern edge, and a 25-minute drive to the western edge of the Market area. For purpose of data consistency, the market area is composed of 16 zip codes, as shown on the map below.
19
Liberty(City Liberty(City(Trade(Area Liberty(City(Market(Area
The Liberty City Ma rket Area
A Major Economic Sub-Region
According to 2014 US Census, American Community Survey (ACS) estimates, Liberty City has a current population of 49,981 residents and 15,614 households. Were Liberty City its own City, it would be the County’s 7th largest of its 34 municipalities.
Liberty City is the heart of an extremely important economic sub-region. Although the population of the market area grew slower than the County as a whole from 2011 to 2015 (4.1 percent versus the County’s 11 percent), its population is currently 517,572 persons. If the Market Area was its own city, it would be Florida’s 2nd, and the Nation’s 34th largest city bigger than Sacramento, Kansas City, the City of Atlanta, Miami, Oakland, New Orleans, Cleveland, Tampa, and almost twice the size of Orlando.
Despite declining incomes, Liberty City and its Market Area represent significantly large purchasing power catchment areas. Aggregate household income in Liberty City in 2014 was over $543 Million, while the Market area represents one of the County’s largest purchasing power communities. Aggregate household income in the Liberty City Market Area is over $6.4 Billion.
Labor Supply Demographics
The population of Liberty City grew more slowly than the rest of the County from 2010 to 2014. Its 2 percent increase in total population is less than 1/3 that of the growth rate of the County for the same period. The Liberty City Market Area grew by 3.0 percent for the same period.
Liberty City’s population is significantly younger than Miami-Dade County, as a whole, with 32.8 percent of residents under 19 years and of age and younger compared to 23.7 percent in the County. In addition, the key working age segment of Liberty City’s population ages 25 to 59, grew 11 percent from 2010 to 2014, growing to 44 percent of its total population.
Liberty City is a racially diverse community. According to the 2014 American Community Survey, the County’s racial composition is 17 percent African American, 65 percent Hispanic/Latino, and 15 percent White. In Liberty City, African Americans comprise 78 percent, Hispanics/Latinos 20 percent, and Whites 1 percent of its population. Liberty City’s Hispanic/Latino and White population have grown by 12 percent and 56 percent, respectively, since 2010.
20
Liberty City Population
Source: U.S. Census ACS 2014 5-year estimates; Table created by FIU Metropolitan Center.
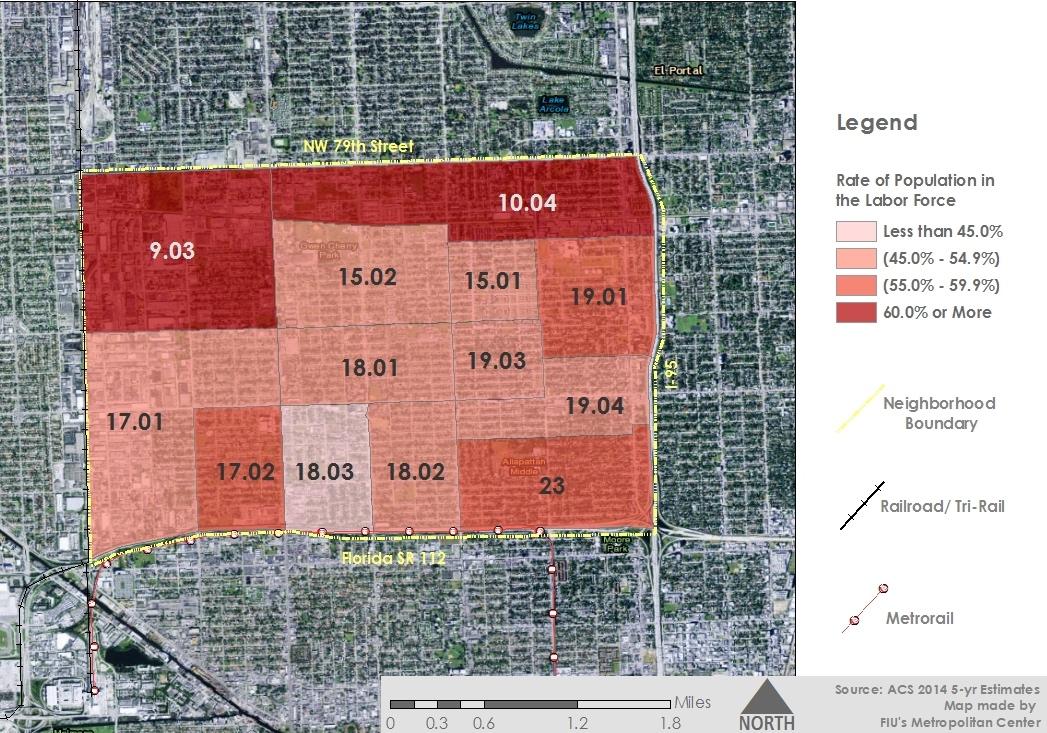
Resident Employment
According to 2014 ACS estimates, 20,066 persons in Liberty City are in its labor force, and of those 15,059 workers age 16 and over were employed, representing a 75 percent labor participation rate. The residents of Liberty City are employed across a diverse industry spread. An estimated 63 percent of its employed residents are predominately employed in four industries: 1) educational services, and health care and social assistance (23.9 percent), 2) arts, entertainment, and recreation, and accommodation and food services (15.7 percent), 3) retail trade (12.7 percent), and 4) professional, scientific, and management, and administrative and waste management services (10.7 percent).
21
Total Population 49,981 Age Under 5 years 4,543 9.1% 5 to 19 years 11,857 23.7% 20 to 34 10,292 20.6% 35 to 54 years 12,475 25.0% 55 and over 10,814 21.6% 18 and over 35,247 70.5% 65 and over 5,513 11.0%
22 Liberty City
Labor Force: Occupational Employment Across Industries Management, business, science, and arts occupations Service occupations Sales and office occupations Natural resources, construction, and maintenance occupations Production, transportation, and material moving occupations Total Agriculture, forestry, fishing and hunting, and mining-15 14 29 0.2% Construction 5265 944 20 1,081 7.2% Manufacturing 118 41 45 17 341 562 3.7% Wholesale trade 11 38 156166 371 2.5% Retail trade 145 274 1,257240 1,916 12.7% Transportation and warehousing, and utilities 94 39 307 115 561 1,116 7.4% Information 666227 155 1.0% Finance and insurance, and real estate and rental and leasing 82 106 182 8 21 399 2.6% Professional, scientific, and management, and administrative and waste management services 246 689 321 44 309 1,609 10.7% Educational services, and health care and social assistance 1,064 1,813 496 68 159 3,599 23.9% Arts, entertainment, and recreation, and accommodation and food services 181 1,490 635 19 33 2,358 15.7% Other services, except public administration 45 698 47 48 149 987 6.6% Public administration 209 338 259 70 4 880 5.8% Civilian employed population 16 years and over 2,311 5,526 3,832 1,348 2,042 15,059 15.3% 36.7% 25.4% 8.9% 13.6% Occupations I n d s u t r i e s
Resident
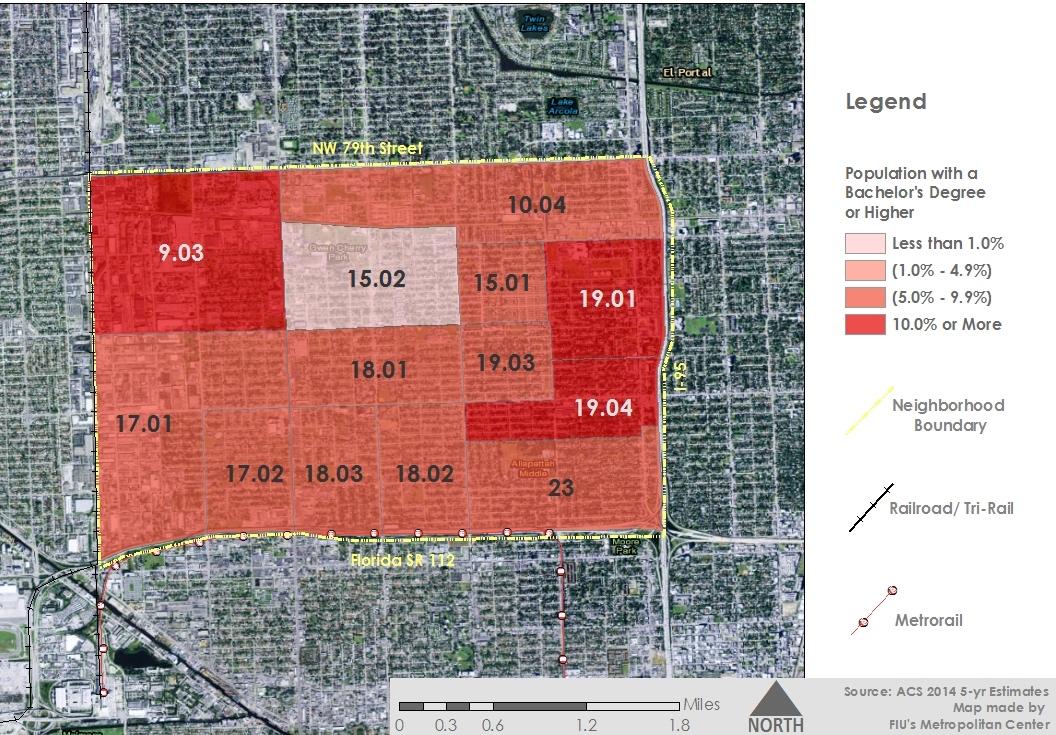
Educational Attainment
According to 2014 ACS estimates, educational attainment in Liberty City is significantly lower than Miami-Dade County, particularly with respect to populations with a high school diploma and a bachelor’s degree or higher. 42.6 percent of Liberty City’s residents age 25 years and over have a high school diploma or equivalency. An estimated 29.7 percent have some college education or have college degrees. Significantly, 27.6 percent of residents 25 years and over do not have a high school diploma.
23
Labor Force Pa rticipation
Educational Attainment
Source: U.S. Census ACS 2014 5-year estimates; Table created by FIU Metropolitan Center.
Educational Attainment
24
Miami-Dade County Total Population Population 25 years and over 29,764 1,799,044 Less than 9th grade 3,637 12.20% 194,826 10.80% 9th to 12th, no diploma 4,596 15.40% 173,544 9.60% High school graduate (includes equivalency) 12,680 42.60% 511,895 28.50% Some college, no degree 4,866 16.30% 288,609 16.00% Associate's degree 1,503 5.00% 154,601 8.60% Bachelor's degree 1,810 6.10% 300,700 16.70% Graduate or professional degree 672 2.30% 174,869 9.70%
2,600,861 49,981 Liberty City
An analysis of educational attainment by race and ethnicity in Liberty City shows a significantly higher percentage (17.5 percent) of Black and African American with less that a high school diploma compared to the White (5.6 percent) and Hispanic or Latino (6.1 percent) populations. While the percentage of Liberty City’s Black and African American without a high school diploma is higher than the White and Hispanic/Latino populations, Black and African Americans have a much higher percentage of their population with some college, an associate’s degree, an d a bachelor’s degree or higher than the resident White and Hispanic/Latino populations. Educational attainment for the Liberty City Market Area is higher in every category than Liberty City, but less than the County. An estimated 34.4 percent of the Market Area’s 358,234 residents older than 25 have a high school diploma, 14.3 percent have some college, but no degree, 6.8 percent have an associate’s degree, 9.7 percent have a bachelor’s and 4.3 percent have earned graduate degrees.
Worker Commute Times
According to 2014 ACS data, over 64 percent of all workers age 16 and over in Liberty City have travel times to work greater than 20 minutes. This means that a preponderance of its workers are working outside Liberty City, and a significant portion work outside the Liberty City Market Area
Liberty City Worker and Household Income
Worker Earnings
Worker earnings have been falling across the U.S. since 1999, and Mimi-Dade County is no exception. Although earnings losses have generally stabilized from 2014 to 2015, annual income per worker, adjusted for inflation, declined 7 percent across all occupations in Miami-Dade from 2010 to 2014.
Median earnings per resident worker in every Census Tract in Liberty City are less than the County median of $27,185 per worker. In addition, workers in almost all but a few occupations earn less than their counterparts in the remainder of the County. In addition, although two of Liberty City’s Census Tracts 18.02, 19.03 and 23 saw gains in median worker earnings of 17 percent, 21 percent and 11 percent, respectively, almost every other census tract in Liberty City saw median worker earnings decline at rates far exceeding the rest of the County.
Further detailed analysis of the wages paid to workers holding jobs in Liberty city indicate that significant opportunities exist for employment within Liberty City in higher skilled, higher wage occupations, but overall, workers are paid less than workers in the sa me occupations across MaimDade County. Fourteen percent of the occupations within Liberty City earn a median wage greater than workers in the same occupation in the remainder of the County.
25
Level of Education by Race and Hispanic Ethnicity Education Level Less than high school diploma 6,542 17.50% 2,090 5.60% 2,290 6.10% High school graduate (includes equivalency) 11,035 29.50% 2,179 5.80% 2,008 5.40% Some college or associate's degree 5,510 14.70% 1,048 2.80% 917 2.50% Bachelor's degree or higher 1,710 4.60% 726 1.90% 764 2.00%
Census ACS 2014 5-year estimates;
Source: U.S.
Table by FIU Metropolitan Center.
Hispanic or Latino White Black/African American
A large number of Liberty City’s employed residents work in high er-wage industries, but are employed overwhelmingly in the lower-wage occupations within those industries. An estimated 37 percent of Liberty City’s employed residents work in service occupations, and 25 percent work in sales and office occupations, while only 15 percent work in management, business, science, and arts occupations.
26
Liberty City and Miami-Dade County Median Earnings per Worker by Occupation Census Tract 9.03 Census Tract 10.04 Census Tract 15.01 Census Tract 15.02 Census Tract 17.01 Census Tract 17.02 Census Tract 18.01 Census Tract 18.02 Census Tract 18.03 Census Tract 19.01 Census Tract 19.03 Census Tract 19.04 Census Tract 23 Miami- Dade County 2014 Median Earnings Per Worker 21,823 19,801 13,763 16,396 20,857 22,411 21,234 27,356 18,125 21,082 21,344 17,018 21,316 27,185 Management, business, science, and arts occupations: 38,417 39,929 25,602 25,625 30,664 33,750 35,391 32,406 35,833 41,985 42,708 21,691 36,308 47,244 Management, business, and financial occupations: 44,531 41,438 30,45545,313 17,422 59,063 26,37544,375 78,021 17,097 35,326 52,017 Management occupations 46,705 91,154 30,45545,071 16,719 59,06357,788 78,021 15,887 35,978 53,901 Business and financial operations occupations-----32,20647,728 Computer, engineering, and science occupations:------53,663 Computer and mathematical occupations------56,849 Architecture and engineering occupations------51,551 Life, physical, and social science occupations------49,458 Education, legal, community service, arts, and media occupations: 21,750 39,292 13,750 11,66733,507 33,839 40,795 23,750 40,147 37,875 20,735 37,125 40,379 Community and social service occupations 40,357--34,464 31,458--35,836 Legal occupations------62,337 Education, training, and library occupations 18,462 38,726 11,250 10,62554,167 49,583-20,147 35,813 38,306 Arts, design, entertainment, sports, and media occupations--20,938--35,459 Healthcare practitioners and technical occupations: 32,50025,59230,481 50,80437,614-34,529 51,491 Health diagnosing and treating practitioners and other technical occupations-30,357---62,682 Health technologists and technicians 26,250-50,357--33,934 32,989 Service occupations: 16,164 15,873 12,500 13,902 17,875 18,715 17,136 16,848 23,208 21,128 20,511 18,031 15,443 17,596 Healthcare support occupations22,62521,406 30,227 33,62516,46729,10219,570 22,125 22,089 Protective service occupations: 58,611 21,976 12,713 21,250 32,292 23,125 21,6854,268 20,35721,250 31,641 Fire fighting and prevention, and other protective service workers including supervisors21,976 12,713 20,947 31,597 23,125 20,4894,268 20,35720,000 23,137 Law enforcement workers including supervisors------55,984 Food preparation and serving related occupations 14,938 12,123 6,515 8,464 8,932 16,563 17,121 13,533 24,688 25,227 17,857 18,750 14,015 16,368 Building and grounds cleaning and maintenance occupations 12,660 15,5009,948 12,222 15,114 14,329 12,468 14,135 19,479 22,125 18,796 14,063 15,665 Personal care and service occupations 16,95013,618 19,5002,50016,39122,833 16,178 Sales and office occupations: 13,889 21,029 20,898 14,943 23,939 16,849 12,077 25,833 12,500 12,021 32,825 13,221 16,284 25,765 Sales and related occupations 9,250 17,875 20,820 7,357 23,750 13,409 5,547 3,490 12,063 12,287 12,321 11,875 13,011 24,181 Office and administrative support occupations 16,979 26,951 25,125 19,922 24,375 24,181 22,768 40,272 13,846 7,18814,250 30,156 26,518 Natural resources, construction, and maintenance occupations: 22,250 19,688 12,643 19,143 16,850 19,609 25,114 41,096 30,391 43,621 20,227 33,917 19,861 24,893 Farming, fishing, and forestry occupations------14,027 Construction and extraction occupations 22,000 17,344 12,64330,455 16,000 41,51331,625 19,669 35,436 18,417 21,867 Installation, maintenance, and repair occupations 15,750 60,72630,789 19,297-30,85930,556 31,431 Production, transportation, and material moving occupations: 23,596 16,994 11,598 21,250 18,068 27,836 23,693 36,480 14,405 21,875 25,694 22,202 19,968 22,423 Production occupations 10,417 16,58218,188 28,221 24,886--22,220 Transportation occupations 24,167 26,321 11,450 17,426 26,927 29,146 21,477 28,250 14,286 28,69640,750 19,679 26,052 Material moving occupations 24,479 15,625 11,528 21,442 7,7509,83014,90020,53618,268 2010 Median Earnings per Worker, CPI Adjusted 23,609 22,969 24,389 19,148 21,590 27,512 24,383 23,342 19,309 22,101 17,610 27,167 19,121 29,230 % Change 2010-2014 -7.6% -13.8% -43.6% -14.4% -3.4% -18.5% -12.9% 17.2% -6.1% -4.6% 21.2% -37.4% 11.5% -7.0%
Household Income
Household incomes in Liberty City reflect the incomes of its resident working and non -working populations. Household and family incomes in Liberty City are substantially lower than Miami-Dade County, as a whole. An estimated 75.6 percent of households have annual incomes of less than $40,000, and 46.2 percent of households earn less than $20,000 annually, far below the County’s median household income of $43,099. Significantly, the poverty rate in Liberty City is 42.9 percent, which is more than double the overall poverty rate (20.5 percent) for Miami-Dade County.
Similarly, median household incomes in the market are range from a low of over $18,000 to over $48,000. Median household incomes in only two of the market area’s zip codes earn more than the County’s household median income.
Falling incomes since the recession, despite growing employment, are part of a larger national and regional trend. However, aggregate household income for resident households in Liberty City shrank 21 percent from 2010 to 2014 alone. Aggregate household income for the Market Area shrank by 10.3 percent for the same period.
Household incomes in Liberty City do not vary considerably according to race and ethnicity, but do vary considerably by location and median household incomes fall well below the County’s median household income. With the exception of households of “Two or More Races,” the vast majority of all other racial and ethnic households in Liberty City - including Black/African American, White Alone and Hispanic or Latino, have incomes well below the median household income of Miami-Dade County.
Though extremely low throughout, household incomes in the 50-80 percent of median range are more prominent in the Southeast section of Liberty City toward State Road 7 and I-95 where the largest concentration of owner- occupied housing units is found. The lowest household incomes, generally below 30 percent of median, are found in the central core area of the neighborhood which includes Liberty Square and surrounds.
27
Household Income by Race
Median
Income by Race and Hispanic Ethnicity
28 Census Tract Black African American White Hispanic or Latino Census Tract 9.03 $33,672 $22,083 $24,375 Census Tract 10.04 $26,860 $18,676 $16,820 Census Tract 15.01 $9,571 $21,250 $18,304 Census Tract 15.02 $18,190 $9,145 $8,882 Census Tract 17.01 $20,595 $21,190 $19,688 Census Tract 17.02 $26,051 $33,750 $31,932 Census Tract 18.01 $18,594 $24,830 $14,598 Census Tract 18.02 $25,956 $26,220 $26,458 Census Tract 18.03 $12,756 $10,313 $11,500 Census Tract 19.01 $25,000 $15,156 $15,781 Census Tract 19.03 $19,167 $28,684 $32,277 Census Tract 19.04 $21,608 $34,458 $33,458 Census Tract 23 $32,866 $29,286 $28,690
Household
U.S. Census ACS 2014 5-year estimates; Table by FIU Metropolitan Center. White Asian Alone Alone Less than $10,000 24.90% 24.80% 24.20% 100% 100% $10,000-$19,999 21.30% 21.60% 21.30% 0.00% 0.00% $20,000-$39,999 29.40% 29.00% 31.70% 0.00% 0.00% $40,000-$59,999 12.80% 12.90% 10.90% 0.00% 0.00% $60,000-$99,999 9.20% 9.40% 9.10% 0.00% 0.00% $100,000-$199,999 2.10% 2.10% 2.70% 0.00% 0.00% $200,000 or more 0.20% 0.30% 0.00% 0.00% 0.00% HOUSEHOLDS 15,614 12,763 2,549 28 24
Source:
Source: U.S. Census ACS 2014 5-year estimates; Table
FIU Metropolitan Center. Native American/Alas kan Black African American Total Household Income Household Income Households 15,641 833,541 Less than $10,000 3,889 24.90% 87,905 10.50% $10,000-$19,999 3,331 21.30% 112,491 13.50% $20,000-$39,999 4,585 29.30% 190,306 22.80% $40,000-$59,999 1,995 12.80% 135,707 16.30% $60,000-$99,999 1,444 9.20% 156,426 18.80% $100,000-$199,999 331 2.10% 112,961 13.60% $200,000 or more 39 0.20% 37,745 4.50% Liberty City Source: U.S. Census ACS 2014 5-year
Miami-Dade County
created by
estimates; Table created by FIU Metropolitan Center.
Liberty City Business Dynamics
Contrasted to the earning and incomes of its residents, Liberty City is a surprisingly diverse, dynamic, and growing business destination within Miami-Dade County. In fact, its industry composition, growth dynamics, performance, occupational mix and business community may be its single strongest asset, competitive advantage, and opportunity for broader redevelopment. Although just over 15,000 employed residents live in Liberty City, its 1,600 business establishments employ 18,526 workers. Liberty City’s business economy is driven by small, locally owned businesses over 87 percent of all businesses in Liberty City employ less than 20 people, and 1,504 are single locations, as opposed to branch, franchise establishment locations. Liberty City’s business establishments operate in a diverse mix of industries, with significant num bers in industry segments with higher overall wages, skills, and knowledge requirements.
Liberty City’s business community also has tremendous regional market reach. The total annual sales of all business establishments located in Liberty City who repo rt their annual sales is over $8 billion. The purchasing power of Liberty City and its Market Area total $6.9 Billion, meaning that its businesses are selling to an extended regional, and in some cases, national market of consumers and clients. A full 35 percent of its reporting businesses have sales over $1M per year, with 8 establishments reporting sales over $100 Million per year.
The same can be said for Liberty City’s Trade Area, defined as the four zip codes that encompass Liberty City, reaching slightly outside its borders. The immediate area including and surrounding Liberty represents is a major concentration of business, trade, shipment and employment within the County. The Liberty City Trade area includes over 5,200 business establishments employing over 49,000 workers, with total sales of over $18 Billion. The Liberty City Trade Area includes a number of nationally significant businesses leaders in their respective industries. In all, Liberty City and its immediate Trade Area represent one of the County’s most dynamic and dense business and employment locations.
Payroll and historic data regarding business establishments are only available at the zip code level. However, the two zip codes primarily covering Liberty City 33142 and 33147 have had steady growth since 2010. The total number of business establishments have grown by 6 percent, as has total employment, and total payrolls grew 4 percent from 2010 to 2014. In fact, total aggregate annual payroll for both zip codes averaged $31,726 per employee.
The Liberty City Market Area has experienced even more dramatic growth. It too is driven by the growth of its small businesses 88.5 percent of all establishments employ less than 20 employees. By industry, the largest number of establishments include retail trade, wholesale trade, professional, scientific, and technical services, transportation and warehousing, followed closely by accommodation and food services.
The Market Area added 933 new establishments from 2010 to 2014, a 7.7 percent increase. However, the largest number of new establishments created were in generally higher wage industries, including professional, scientific, and technical services (160 new establishments), real estate and rental and leasing (130 new establishments), and retail trade (123 new establishments). The Market Area’s fastest growing industries are educational services (22.8 percent growth), real estate and rental and leasing (22.3 percent growth), and professional, scientific, and technical services (12.6 percent growth)
The Market Area added 24,475 jobs from 2010 to 2014, and total annual payroll grew over 16 percent for the same period. Key business characteristics for Liberty City, its Trade and Market Areas are shown below.
29
Advanced Industry Employment
The U.S. Advanced Industries Sector , according to the Brookings Institution, are important regional core industries that concentrate in and drive many of the nation’s best performing regional economies. The Advanced Industries Sector is composed of 50 industries including manufacturing chemicals, pharmaceuticals, advanced metals, industrial machinery, medical equipment manu facture, energy development and distribution, software design, data processing and hosting and medical and diagnostic labs. The Institution’s analysis has sparked broad thinking regarding the development of these key sectors as important ways to improve American global economic competitiveness, lead the nation’s economic revitalization, build on regional economic strengths, create new employment postrecession, and provide badly needed high-skill, high paying employment opportunities.
Each of the industries in the Advanced Industries Sector have high relative levels of technology development and research and development spending that are well above averages for the rest of the economy. The Advanced Industries Sector both drives and relies on constant innovation, technology advances, and new service business models to expand and grow. As a sector, Advanced Industries employ 12.3 million workers, or 9 percent of total employment. The Sector produces $2.7 trillion in value-added annually, or 17 percent of all U.S. gross domestic product.
Liberty City and its Trade Area have a significant mix of business in the Advanced Industries sector, especially in Advanced Industry manufacturing Advanced Industry Employment in Liberty City and its Trade Area is at or above the state average of 3 percent and Miami-Dade County’s average of 2.5 percent of total employment. Expansion of businesses in the Advanced Industries sectors in the Liberty City Area represents a significant opportunity to create higher skilled, high wage jobs for local residents.
30
31 Zip Codes 33127, 33142, 33147, 33150 Total Sales $18.34B Total Employees 49,360 Total 5,207 Less Than 20 4,780 92% 20-99 Employees 354 7% 100 or more 73 1% Advanced Industries Employees 1,840 4% Establishments 239 5% Single Location 4,879 93.7% Branch 322 6.2% Headquarters 4 0.1% <1M sales 3,421 66% 1-5M 1,151 22% 5-10M 263 5% 10-50M 324 6% 50-100M 32 1% 100-500M 14 0% >500M 2 0% Liberty City Trade Area Business Characteristics
Establishments by Sales Revenue Local and National Presence Establishments by Employment Total Sales $8.7B Total Employees 18,526 Total 1,600 Less Than 20 1,393 87% 20-99 Employees 138 9% 100 or more 26 2% Advanced Industries Employees 545 3% Establishments 64 4% Single Location 1,504 94.0% Branch 93 5.8% Headquarters 1 0.1% <1M sales 1,041 65% 1-5M 329 21% 5-10M 84 5% 10-50M 121 8% 50-100M 15 1% 100-500M 8 1% >500M 2 0% Liberty City Business Characteristics Local and National Presence Establishments by Sales Revenue
Source: InfoUSA, 2016. Table prepared by FIU Metropolitan Center.
Metropolitan
Establishments by Employment
Source: InfoUSA, 2016. Table prepared by FIU
Center.
32
City Largest Industries
Employment Industry Establishments Employees 423 Merchant Wholesalers, Durable Goods 140 1,255 332 Fabricated Metal Product Manufacturing 38 813 452 General Merchandise Stores 19 582 813 Religious, Grantmaking, Civic, Professional, and Similar Organizations 135 559 812 Personal and Laundry Services 53 477 424 Merchant Wholesalers, Nondurable Goods 39 449 445 Food and Beverage Stores 80 419 5414 Specialized Design Services 9 410 441 Motor Vehicle and Parts Dealers 61 389 811 Repair and Maintenance 114 360 311 Food Manufacturing 9 267 448 Clothing and Clothing Accessories Stores 22 232 323 Printing and Related Support Activities 2 202 337 Furniture and Related Product Manufacturing 16 180 334 Computer and Electronic Product Manufacturing 2 171 444 Building Material and Garden Equipment and Supplies Dealers 14 163 442 Furniture and Home Furnishings Stores 18 133 453 Miscellaneous Store Retailers 37 126 321 Wood Product Manufacturing 7 111 333 Machinery Manufacturing 9 107 Data Source: InfoUSA, 2016. Table prepared by FIU Metropolitan Center. Liberty City Trade Area Largest Industries by Employment Industry Sector Establishme nts Employee s 423 Merchant Wholesalers, Durable Goods 349 2,741 445 445 Food and Beverage Stores 237 1,533 453 453 Miscellaneous Store Retailers 155 1,401 441 441 Motor Vehicle and Parts Dealers 296 1,387 332 Fabricated Metal Product Manufacturing 68 1,286 424 Merchant Wholesalers, Nondurable Goods 151 1,280 811 Repair and Maintenance 370 1,226 813 Religious, Grantmaking, Civic, Professional, and Similar Organizations 282 1,220 812 Personal and Laundry Services 155 1,079 448 448 Clothing and Clothing Accessories Stores 208 953 452 452 General Merchandise Stores 70 802 311 Food Manufacturing 35 682 444 444 Building Material and Garden Equipment and Supplies Dealers 63 590 5414 Specialized Design Services 29 494 446 446 Health and Personal Care Stores 63 407 442 442 Furniture and Home Furnishings Stores 58 351 336 Transportation Equipment Manufacturing 17 343 323 Printing and Related Support Activities 24 325 5418 Advertising, Public Relations, and Related Services 42 291 333 Machinery Manufacturing 24 280 Data Source: InfoUSA, 2016. Table prepared by FIU Metropolitan Center.
Liberty
by
33 Liberty City Establishments and Employment by Sector and Industry Indusrty Sector Establishme nts % Employee s % 81 Other Services (except Public Administration) 302 19% 1,396 8% 44-45 Retail Trade 291 18% 2,230 12% 42 Wholesale Trade 183 11% 1,738 9% 31-33 Manufacturing 130 8% 2,443 13% 48-49 Transportation and Warehousing 90 6% 3,805 21% 62 Health Care and Social Assistance 88 6% 652 4% 54 Professional, Scientific, and Technical Services 81 5% 662 4% 23 Construction 81 5% 526 3% 72 Accommodation and Food Services 67 4% 557 3% 53 Real Estate and Rental and Leasing 64 4% 709 4% 99 Not Available 47 3% 25 0% 56 Administrative and Support and Waste Management and Remediation Services 45 3% 500 3% 61 Educational Services 36 2% 1,916 10% 92 Public Administration 30 2% 1,002 5% 52 Finance and Insurance 26 2% 109 1% 51 Information 19 1% 116 1% 71 Arts, Entertainment, and Recreation 16 1% 104 1% 21 Mining, Quarrying, and Oil and Gas Extraction 2 0% 4 0% 22 Utilities 1 0% 24 0% 11 Agriculture, Forestry, Fishing and Hunting 1 0% 8 0% 1,600 100% 18,526 100% Manufacturing Establishme nts % Employee s % 311 Food Manufacturing 9 7% 267 11% 312 Beverage and Tobacco Product Manufacturing 3 2% 59 2% 313 Textile MillS 3 2% 61 2% 314 Textile Product MillS 5 4% 50 2% 315 Apparel Manufacturing 5 4% 67 3% 321 Wood Product Manufacturing 7 5% 111 5% 322 Paper Manufacturing 2 2% 27 1% 323 Printing and Related Support Activities 2 2% 202 8% 325 Chemical Manufacturing 7 5% 92 4% 326 Plastics and Rubber Products Manufacturing 4 3% 39 2% 332 Fabricated Metal Product Manufacturing 38 29% 813 33% 333 Machinery Manufacturing 9 7% 107 4% 334 Computer and Electronic Product Manufacturing 2 2% 171 7% 335 Electrical Equipment, Appliance, and Component Manufacturing 5 4% 97 4% 336 Transportation Equipment Manufacturing 5 4% 29 1% 337 Furniture and Related Product Manufacturing 16 12% 180 7% 339 Miscellaneous Manufacturing 8 6% 71 3% 130 100% 2,443 100% Wholesale Trade Establishme nts % Employee s % 423 Merchant Wholesalers, Durable Goods 140 77% 1,255 72% 424 Merchant Wholesalers, Nondurable Goods 39 21% 449 26% 425 Wholesale Electronic Markets and Agents and Brokers 4 2% 34 2% 183 100% 1,738 100% Retail Trade Establishme nts % Employee s % 441 Motor Vehicle and Parts Dealers 61 21% 389 17% 442 Furniture and Home Furnishings Stores 18 6% 133 6% 443 Electronics and Appliance Stores 12 4% 73 3% 444 Building Material and Garden Equipment and Supplies Dealers 14 5% 163 7% 445 Food and Beverage Stores 80 27% 419 19% 446 Health and Personal Care Stores 10 3% 52 2% 447 Gasoline Stations 13 4% 47 2% 448 Clothing and Clothing Accessories Stores 22 8% 232 10% 451 Sporting Goods, Hobby, Musical Instrument, and Book Stores 3 1% 10 0% 452 General Merchandise Stores 19 7% 582 26% 453 Miscellaneous Store Retailers 37 13% 126 6% 454 Nonstore Retailers 2 1% 4 0% 291 100% 2,230 100% Professional, Scientific, and Technical Services Establishme nts % Employee s % 5411 Legal Services 8 10% 25 4% 5412 Accounting, Tax Preparation, Bookkeeping, and Payroll Services 20 25% 63 10% 5413 Architectural, Engineering, and Related Services 2 2% 6 1% 5414 Specialized Design Services 9 11% 410 62% 5415 Computer Systems Design and Related Services 2 2% 6 1% 5416 Management, Scientific, and Technical Consulting Services 16 20% 56 8% 5417 Scientific Research and Development Services 7 9% 32 5% 5418 Advertising, Public Relations, and Related Services 9 11% 46 7% 5419 Other Professional, Scientific, and Technical Services 8 10% 18 3% 81 100% 662 100% Other Services (except Public Administration) Establishme nts % Employee s % 811 Repair and Maintenance 114 38% 360 26% 812 Personal and Laundry Services 53 18% 477 34% 813 Religious, Grantmaking, Civic, Professional, and Similar Organizations 135 45% 559 40% 302 100% 1,396 100% Data Source: InfoUSA, 2016. Table prepared by FIU Metropolitan
34 Liberty City: Advanced Industries Composition Industry NAICS Code Establishments Employment Services Architecture & Engineering 5413 2 6 Management Consulting 5416 16 56 Computer Systems Design 5415 2 6 Other Telecommunications 5179 3 10 Data Processing & Hosting 5182 1 2 Software Products 5112 -Wireless Telecom Carriers 5172 4 8 Web Search and Internet Publishing 5191 2 9 R&D Services 5417 7 32 Metal Ore Mining 2122 -Satellite Telecommunications 5174 -Medical & Diagnostic Laboratories 6215 -Cable & Other Programming 5152 -37 129 Manufacturing Semiconductors 3344 -Precision Instruments 3345 2 171 Computer Equipment 3341 -General Purpose Machinery 3339 5 38 Medical Equipment & Supplies 3391 1 7 Jewelry, Sporting Goods 3399 7 64 Aircraft Products & Parts 3364 -Pesticides & Fertilizers 3253 -Magnetic & Optical Media 3346 -Stone & Mineral Products 3279 -Commercial & Service Machinery 3333 -Engine & Power Equipment 3336 -Ships & Boats 3366 1 1 Railroad Rolling Stock 3365 -Iron & Steel Products 3311 -Foundries 3315 -Electrical Lighting Equipment 3351 -Aluminum Products 3313 -Clay & Refractory Products 3271 -Communications Equipment 3342 -Petroleum & Coal Products 3241 -Agri., Constr., Mining Machinery 3331 -Basic Chemicals 3251 -Audio & Video Equipment 3343 -Electrical Equipment 3353 4 62 Motor Vehicle Parts 3363 3 16 Motor Vehicles 3361 -Misc. Chemicals 3259 -Misc. Transportation Equipment 3369 -Motor Vehicle Body & Trailers 3362 1 12 Pharmaceuticals 3254 1 7 Misc. Electrical Equipment 3359 -Household Appliances 3352 1 35 Industrial Machinery 3332 -Resins & Synthetic Rubbers 3252 -Iron & Steel Products 3311 -26 413 Energy Oil & Gas Extraction 2111 1 3 Power Generation & Supply 2211 -1 3 Advanced Industries totals 64 545 Trade Area Totals 1,600 18,526 % Advanced Industries 4% 3% Source: The Brookings Institute Data Source: InfoUSA, 2016. Table prepared by FIU Metropolitan Center.
35 Liberty City Trade Area Establishments and Employment by Sector and Industry Industry Sector Establishme nts % Employee s % 44-45 Retail Trade 1,261 24% 7,934 16% 81 Other Services (except Public Administration) 807 15% 3,525 7% 42 Wholesale Trade 513 10% 4,082 8% 31-33 Manufacturing 359 7% 4,771 10% 62 Health Care and Social Assistance 276 5% 2,736 6% 54 Professional, Scientific, and Technical Services 264 5% 1,459 3% 72 Accommodation and Food Services 260 5% 3,537 7% 48-49 Transportation and Warehousing 244 5% 5,272 11% 23 Construction 241 5% 1,694 3% 53 Real Estate and Rental and Leasing 214 4% 2,093 4% 56 Administrative and Support and Waste Management and Remediation Services151 3% 1,361 3% 61 Educational Services 100 2% 5,935 12% 52 Finance and Insurance 131 3% 587 1% 99 Non-Classified 153 3% 42 0% 51 Information 78 1% 536 1% 92 Public Administration 77 1% 3,292 7% 71 Arts, Entertainment, and Recreation 70 1% 417 1% 11 Agriculture, Forestry, Fishing and Hunting 3 0% 49 0% 21 Mining, Quarrying, and Oil and Gas Extraction 2 0% 4 0% 55 Management of Companies and Enterprises 2 0% 10 0% 22 Utilities 1 0% 24 0% 5,207 100% 49,360 100% Manufacturing Establishme nts % Employee s % 311 Food Manufacturing 35 10% 682 15% 312 Beverage and Tobacco Product Manufacturing 7 2% 119 3% 313 Textile Mills 9 3% 82 2% 314 Textile Product Mills 15 4% 111 2% 315 Apparel Manufacturing 23 7% 172 4% 321 Wood Product Manufacturing 11 3% 139 3% 322 Paper Manufacturing 8 2% 62 1% 323 Printing and Related Support Activities 24 7% 325 7% 325 Chemical Manufacturing 9 3% 103 2% 326 Plastics and Rubber Products Manufacturing 11 3% 71 2% 332 Fabricated Metal Product Manufacturing 68 20% 1,286 28% 333 Machinery Manufacturing 24 7% 280 6% 334 Computer and Electronic Product Manufacturing 6 2% 266 6% 335 Electrical Equipment, Appliance, and Component Manufacturing 12 3% 141 3% 336 Transportation Equipment Manufacturing 17 5% 343 7% 337 Furniture and Related Product Manufacturing 35 10% 274 6% 339 Miscellaneous Manufacturing 31 9% 212 5% 345 100% 4,668 100% Wholesale Trade Establishme nts % Employee s % 423 Merchant Wholesalers, Durable Goods 349 68% 2,741 67% 424 Merchant Wholesalers, Nondurable Goods 151 29% 1,280 31% 425 Wholesale Electronic Markets and Agents and Brokers 13 3% 61 1% 513 100% 4,082 ##### Retail Trade Establishme nts % Employee s % 441 441 Motor Vehicle and Parts Dealers 296 23% 1,387 17% 442 442 Furniture and Home Furnishings Stores 58 5% 351 4% 443 443 Electronics and Appliance Stores 26 2% 130 2% 444 444 Building Material and Garden Equipment and Supplies Dealers 63 5% 590 7% 445 445 Food and Beverage Stores 237 19% 1,533 19% 446 446 Health and Personal Care Stores 63 5% 407 5% 447 447 Gasoline Stations 54 4% 228 3% 448 448 Clothing and Clothing Accessories Stores 208 16% 953 12% 451 451 Sporting Goods, Hobby, Musical Instrument, and Book Stores 21 2% 105 1% 452 452 General Merchandise Stores 70 6% 802 10% 453 453 Miscellaneous Store Retailers 155 12% 1,401 18% 454 454 Nonstore Retailers 10 1% 47 1% 1,261 100% 7,934 ##### Professional, Scientific, and Technical Services Establishme nts % Employee s % 5411 Legal Services 21 8% 57 4% 5412 Accounting, Tax Preparation, Bookkeeping, and Payroll Services 44 17% 128 9% 5413 Architectural, Engineering, and Related Services 20 8% 113 8% 5414 Specialized Design Services 29 11% 494 34% 5415 Computer Systems Design and Related Services 5 2% 20 1% 5416 Management, Scientific, and Technical Consulting Services 57 22% 214 15% 5417 Scientific Research and Development Services 13 5% 51 3% 5418 Advertising, Public Relations, and Related Services 42 16% 291 20% 5419 Other Professional, Scientific, and Technical Services 33 13% 91 6% 264 100% 1,459 ##### Other Services (except Public Administration) Establishme nts % Employee s % 811 Repair and Maintenance 370 46% 1,226 35% 812 Personal and Laundry Services 155 19% 1,079 31% 813 Religious, Grantmaking, Civic, Professional, and Similar Organizations 282 35% 1,220 35% 807 100% 3,525 ##### Data Source: InfoUSA, 2016. Table prepared by FIU Metropolitan Center.
36 Trade Area Advanced Industries Composition Industry NAICS Code Establishments Employment Services Architecture & Engineering 5413 20 113 Management Consulting 5416 57 214 Computer Systems Design 5415 5 20 Other Telecommunications 5179 15 66 Data Processing & Hosting 5182 7 37 Software Products 5112 -Wireless Telecom Carriers 5172 22 71 Web Search and Internet Publishing 5191 6 37 R&D Services 5417 13 51 Metal Ore Mining 2122 -Satellite Telecommunications 5174 -Medical & Diagnostic Laboratories 6215 -Cable & Other Programming 5152 1 8 146 617 Manufacturing Semiconductors 3344 1 80 Precision Instruments 3345 2 171 Computer Equipment 3341 2 9 General Purpose Machinery 3339 11 77 Medical Equipment & Supplies 3391 7 41 Jewelry, Sporting Goods 3399 24 171 Aircraft Products & Parts 3364 2 230 Pesticides & Fertilizers 3253 -Magnetic & Optical Media 3346 -Stone & Mineral Products 3279 4 32 Commercial & Service Machinery 3333 1 1 Engine & Power Equipment 3336 1 80 Ships & Boats 3366 7 41 Railroad Rolling Stock 3365 -Iron & Steel Products 3311 1 11 Foundries 3315 1 8 Electrical Lighting Equipment 3351 2 20 Aluminum Products 3313 -Clay & Refractory Products 3271 1 4 Communications Equipment 3342 1 6 Petroleum & Coal Products 3241 1 3 Agri., Constr., Mining Machinery 3331 1 2 Basic Chemicals 3251 -Audio & Video Equipment 3343 -Electrical Equipment 3353 6 82 Motor Vehicle Parts 3363 7 60 Motor Vehicles 3361 -Misc. Chemicals 3259 -Misc. Transportation Equipment 3369 -Motor Vehicle Body & Trailers 3362 1 12 Pharmaceuticals 3254 2 13 Misc. Electrical Equipment 3359 3 4 Household Appliances 3352 1 35 Industrial Machinery 3332 1 16 Resins & Synthetic Rubbers 3252 -Iron & Steel Products 3311 1 11 92 1,220 Energy Oil & Gas Extraction 2111 1 3 Power Generation & Supply 2211 -1 3 Advanced Industries totals 239 1,840 Trade Area Totals 5,207 49,360 % Advanced Industries 5% 4% Source: The Brookings Institute Data Source: InfoUSA, 2016. Table prepared by FIU Metropolitan Center.
Source: U.S. Census Bureau, 2014 County Business Patterns.


37 11,600 11,800 12,000 12,200 12,400 12,600 12,800 13,000 13,200 2004 2008 2009 2010 2011 2012 2013 2014 Source Market Area Establishment Growth 1,950 2,000 2,050 2,100 2,150 2,200 2,250 2,300 2004 2008 2009 2010 2011 2012 2013 2014 Source: Liberty City Establishment Growth5,000 10,000 15,000 20,000 25,000 30,000 2004 2008 2009 2010 2011 2012 2013 2014 Source: Liberty City Employment Growth 155,000 160,000 165,000 170,000 175,000 180,000 185,000 190,000 195,000 2004 2008 2009 2010 2011 2012 2013 2014 Source: Market Area Employment Growth 6,600,000,000 6,800,000,000 7,000,000,000 7,200,000,000 7,400,000,000 7,600,000,000 7,800,000,000 8,000,000,000 8,200,000,000 8,400,000,000 8,600,000,000 8,800,000,000 2004 2008 2009 2010 2011 2012 2013 2014 Source: Market Area Payroll Growth (CPI Adjusted)
100,000,000 200,000,000 300,000,000 400,000,000 500,000,000 600,000,000 700,000,000 800,000,000 900,000,000 1,000,000,000 2004 2008 2009 2010 2011 2012 2013 2014 Liberty City Payroll Growth (CPI Adjusted)
Employment Density and Job Location: The Jobs Mismatch Opportunity
Employment density refers to the ratio of jobs in a given area to the number of employed workers who live there. Given Miami-Dade’s historic land use patterns, much of the County has an employment density ratio far less than one. As the FIU Metropolitan Center has noted in other studies, most of the County’s employment base is concentrated in six zip codes running from downtown to the airport. This means that for most of the County’s communities, there are far less local jobs than there are employed residents, and creating significant, and in some cases overwhelming commuter traffic each day.
The Center for Economic Studies at the U.S. Census Bureau produces the Longitudinal EmployerHousehold Dynamics (LEHD) an quarterly analysis that tracks where workers live and where they work, in order to determine employment, commuting, and travel patterns. The LEHD uses Quarterly Bureau of Labor Statistics reports, so that it excludes certain type of employment, such as agricultural employees, self-employed farmers, self-employed nonagricultural workers, domestic workers, unpaid family workers, some railroad employees, and certain non-profit employers. The employment data therefore differs from absolute counts of employment used in other sections of this report. However, the LEHD reveals striking characteristics regarding work and employment in Liberty City
Liberty City is one of the few communities in the County where jobs within its boundaries outnumber its employed residents Liberty City’s over 16 employed population numbers 15,059, while the employers within its boundaries provide 18,526 jobs. This simple ratio, and the fact that Liberty City and its market area provide a large number of jobs in diverse industries, at wage levels above those of its residents may by Liberty City’s greatest redevelopment challenge. Commuting time data, as well as the mismatch between the occupations and pay offered by Liberty City employers, and the wages and income of its employees clearly indicate that although Liberty City is an engine of job growth in reasonably good paying industries and occupations, its residents are not getting access to those jobs.
The detailed LEHD analysis of the inflow and outflow of jobs versus residents in Liberty City is shown on the following pages The LEHD data is for 2014, and it undercounts employment and over-counts employed persons living in Liberty City. Even with these differences, the startling findings of that research are shown in the following table: only 3.6 percent of all working age residents who live in Liberty City work there, while over 95 percent of the jobs in Liberty City are taken by workers who live outside Liberty City., and in some cases, from outside the Market Area. Clearly, Liberty City does not want for jobs, but the reverse. Its residents need to be better prepared to take the large variety of jobs created in its vibrant business community.
38
Inflow/Outflow Report: 2nd Quarter 2014
In-Area Labor Force Efficiency (All Jobs)
Interior Flow Job Characteristics (All Jobs)
Source: U.S. Census Bureau, OnTheMap Application and LEHD Origin-Destination Employment Statistics
39 Count Share Count Share Employed in the Selection Area 1,057,123 100.0% 13,100 100.0% Living in the Selection Area 1,008,185 95.4% 17,801 135.9% Net Job Inflow (+) or Outflow (-) 48,938 - -4,701Living in the Selection Area 1,008,185 100.0% 17,801 100.0% Living and Employed in the Selection Area 790,931 78.5% 636 3.6% Living in the Selection Area but Employed Outside 217,254 21.5% 17,165 96.4% Employed in the Selection Area 1,057,123 100.0% 13,100 100.0% Employed and Living in the Selection Area 790,931 74.8% 636 4.9% Employed in the Selection Area but Living Outside 266,192 25.2% 12,464 95.1% Internal Jobs Filled by Outside Workers 266,192 100.0% 12,464 100.0% Workers Aged 29 or younger 53,199 20.0% 2,077 16.7% Workers Aged 30 to 54 152,880 57.4% 7,362 59.1% Workers Aged 55 or older 60,113 22.6% 3,025 24.3% Workers Earning $1,250 per month or less 62,180 23.4% 2,697 21.6% Workers Earning $1,251 to $3,333 per month 88,194 33.1% 6,170 49.5% Workers Earning More than $3,333 per month 115,818 43.5% 3,597 28.9% Workers in the "Goods Producing" Industry Class 19,650 7.4% 2,734 21.9% Workers in the "Trade, Transportation, and Utilities" Industry Class 89,149 33.5% 4,799 38.5% Workers in the "All Other Services" Industry Class 157,393 59.1% 4,931 39.6% Internal Jobs Filled by Residents 790,931 100.0% 636 100.0% Workers Aged 29 or younger 154,814 19.6% 129 20.3% Workers Aged 30 to 54 455,402 57.6% 353 55.5% Workers Aged 55 or older 180,715 22.8% 154 24.2% Workers Earning $1,250 per month or less 175,825 22.2% 225 35.4% Workers Earning $1,251 to $3,333 per month 337,585 42.7% 329 51.7% Workers Earning More than $3,333 per month 277,521 35.1% 82 12.9% Workers in the "Goods Producing" Industry Class 61,759 7.8% 99 15.6% Workers in the "Trade, Transportation, and Utilities" Industry Class 186,741 23.6% 186 29.2% Workers in the "All Other Services" Industry Class 542,431 68.6% 351 55.2%
Miami-Dade County Liberty City
In-Area Employment
Jobs) Inflow Job Characteristics (All Jobs)
Efficiency (All
Strategic Location and Connectivity
Liberty City is one of the most significant and unique multi-modal transportation corridors in Florida, based on its location, traffic capacity, connectivity and visibility:
n Liberty City is served by, or located within 15 minutes of every mode of transportation;
n Interstate 95 forms the major roadway spine alongside Liberty City it is the 6th most heavily traveled Interstate segment in the US, carrying 266,000 vehicles per day;
n NW 7th Avenue, the twin North-South spine to I-95, is one of only seventeen urban arterials in the County with 3 lanes or more in both directions, and currently carries 33,500 vehicles per day. NW 7th Avenue is the Southern terminus of State Route 441, extending to southern Georgia, has nine interchanges with I-95, and is the major alternate route to I-95;
n The Golden Glades Interchange, within 20 minutes of Liberty City, is a Strategic Intermodal System (SIS) hub, one of the largest facilities in a statewide network of high-priority transportation facilities such as airports, seaports, rail corridors and highways. The Golden Glades Interchange is the physical interchange and direct connecting point for I-95, SR 826, and Florida’s Turnpike, as well as host to a TriRail passenger Train Station, and direct road and rail connections to the Port of Miami and Port Everglades. The Golden Glades currently carries over 400,000 vehicles per day with direct impacts on regional travel within the tri-county area. Florida DOT is proposing to rationalize the flyover and ramp system to provide direct system -tosystem connection from SR 826 (East Bound) to I-95 North bound, and improve the Turnpike to I-95 SB connection, improving traffic flow and delay times;
n NW 7th Avenue is also a major transit corridor with significant Metrobus ridership. NW 7th Avenue has 72 bus stops along the length of the CRA, and twelve County Bus lines 2 along 7th, and 10 intersecting connecting bus lines serve NW 7th Avenue, carrying over 506,000 passengers along and to 7th Avenue each month.
n Tri-Rail, Florida’s most heavily utilized passenger rail line, almost 4.4 Million passenger trips annually. Its park and ride station at the Golden Glades (inside the CRA) is one of its busiest stations. Additionally, the Florida East Coast Railway (FEC) transects the CRA Market Area, as well runs parallel to NW 7th Avenue one mile to the east. The FEC has been proposed to convert to passenger travel within the next five years, with proposed stations at NW 79th and 125th Street, just east of 7th Avenue.
Liberty City and Regional Transportation Competitiveness
Roadway congestion is a critical issue facing the region. According to the Texas A&M Transportation Institute (TTI), Miami is the 14th most traffic congested City in North America, and 11th most congested in the US. Average travel times across the County are above the national average, and for workers living in the western and southern Commission Districts, travel times average 45 minutes each way, nearly double the national average.
40
Given Liberty City’s jobs creation dynamics, it has the potential to play a significant role in relieving regional transportation congestion, by supplying jobs within close proximity to dense residential development.
Economic Assets within the Market Area
Liberty City is strategically located within minutes of the region’s most important economic assets drivers of regional employment growth including major employers, institutions, infrastructure, and culture. They include:
Major Universities:
n Miami Dade College North Campus
n Barry University
n Florida International University Biscayne Bay Campus
n St. Thomas University
Medical Service and Research Institutions:
n North Shore Medical Center
n Jackson Memorial Hospital
n Jackson North Medical Center
n Miami Jewish Health Systems
n St. Catherine’s Rehabilitation Hospital
n Multiple Medical Research Centers
n The Miami Innovation & Discovery District (the “MIDD”), including the University of Miami Life Science & Technology Park
Cultural and Civic Facilities:
n Museum of Contemporary Art (MOCA)
n New County Library
n U.S. Citizenship and Immigration Services (USCIS)
n New County Police District Headquarters
n IGFA Fishing Hall of Fame & Museum (16 minutes, Dania Beach)
n Perez Art Museum
n Adrian Arsht Performing Arts Center
n Miami Children’s Museum
n American Airlines Arena
41
Airports and Infrastructure
n Miami International Airport and Free Trade Complex (20 minute drive)
n Fort Lauderdale-Hollywood International Airport (23 minute drive)
n Opa-Locka Executive Airport (14 minute dive)
n Port of Miami (15 minute drive)
n Port Everglades – (22 minute drive, Hollywood)
Business Centers, Major Employers and New Neighborhoods
n Design Center of the Americas (DCOTA) the largest design and office center campus of its kind, showcasing 775,000 square feet of design products (16 minute drive, Dania Beach)
n Liberty City is within 10-minute drive of the Region’s fastest growing new neighborhoods, including the Wynwood Arts District, the Miami Design District, and Miami Midtown
n Lincoln Road Pedestrian Mall (Miami Beach)
42
Housing
Housing Inventory and Tenure
According to 2010-2014 ACS estimates, there are 19,287 total housing units in Liberty City, of which, 81 percent (15,614 units) are occupied. Liberty City’s housing supply is largely comprised of 1-unit, detached structures (50.9 percent). Multi-family structures of 20+ units comprise 10.2 percent (1,973 units) of the housing inventory. An estimated 65.4 percent of housing units in Liberty City are renteroccupied. Liberty City’s owner-occupancy rate of 34.6 percent is significantly less than Miami-Dade County’s overall owner-occupancy rate of 54.9 percent. Liberty City has a housing vacancy rate of 19 percent, compared to 16 percent for Miami-Dade County, as a whole.
Housing Characteristics
Housing Tenure
Source: U.S. Census ACS 2014 5-year estimates; Table by FIU Metropolitan Center.
43
Count % Count % Total Housing Units 19,287 994,596 1-unit, detached 9,817 50.90% 405,572 40.80% 1-unit, attached 1,252 6.50% 100,328 10.10% 2 units 1,812 9.40% 20,287 2.00% 3 or 4 units 1,126 5.80% 35,329 3.60% 5 to 9 units 1,257 6.50% 51,359 5.20% 10 to 19 units 1,366 7.10% 64,862 6.50% 20 or more units 1,973 10.20% 303,444 30.50% Mobile home 662 3.40% 12,986 1.30% Boat, RV, van, etc. 22 0.10% 429 0.00% Occupied housing units Owner-occupied 5,407 34.60% 458,132 55.00% Renter-occupied 10,207 65.40% 375,409 45.00% Vacant housing units Homeowner vacancy estimates 391 10.60% 13,598 8.40% Sold, Not Occupied 230 6.30% 6,037 3.70% Rental vacancy estimates 1,508 41.10% 31,795 19.70% Rented Not Occupied 457 12.40% 7,759 4.80% Vacancy for seasonal, recreational, or occasional use 382 10.40% 69,305 43.00% Other 705 19.20% 32,561 20.20%
161,055 3,673 833,541 15,614
Liberty City Miami-Dade County
Housing Values and Demand
A basic premise of all housing markets is there should exist a spectrum of housing choice and opportunity for local residents. This axiom establishes that housing choice and needs differ in most communities due to a variety of factors, including: employment mix, household income, population age, proximity of employment and mere preference. Local housing and labor markets are inextricably linked to one another. Industries are served by local housing markets that provide choices and opportunities for both current and future workers.
A comparison of median monthly household income and median monthly owner costs is shown as a percentage that establishes overall affordability and level of cost -burden. Housing affordability is generally defined as the capacity of households to consume housing services and, specifically, the relationship between household incomes and prevailing housing prices and rents. As previously noted, the standard most frequently used by various units of government is that households should spend no more than 30 percent of their income on housing costs. This is the standard definition for housing programs administered by the Department of Housing and Urban Development (HUD) and most state housing agencies. Owner and renter households paying excess of 30 percent of their income on housing costs are considered “cost burdened.”
According to 2014 ACS estimates, 15.1 percent (8,175 owners) of Liberty City’s owner-occupied housing units with a mortgage are cost-burdened, paying 30 percent or more of their household income on housing costs. Significantly, 20.1 percent (1,088 owners) are “severely” cost burdened, paying in excess of 50 percent of their household income on housing costs. An estimated 66.2 percent (6,754 renters) of renter-occupied units are cost-burdened, of which, 39.6 percent (4,042 renters) are severely cost-burdened.
Currently, the percentage of cost-burdened owner units with a mortgage in Liberty City is almost 20 percent lower than Miami-Dade County (35 percent vs. 53 percent, respectively). However, the percentage of cost-burdened renters is slightly higher than the County percentage (61.5 percent). Liberty City represents a small pocket of homeowner affordability in a County where ownership costs are rapidly rising beyond incomes.
44
Total Renter Occupied Households Total renter occupied housing units that pay 30% or more of household income on rent 6,754 66.20% 231,212 61.60% Total renter occupied housing units that pay 50% or more of household income on rent 4,042 39.60% 130,401 34.70% Total Owner Occupied Households** Total owner occupied housing units that pay 30% or more of household income on mortgage payments 817 15.10% 160,195 35.00% Total owner occupied housing units that pay 50% or more of household income on mortgage payments 1,088 20.10% 82,389 18.00% Cost-Burdened Household Characteristics Source: U.S. Census ACS 2014 5-year estimates; Table by the FIU Metropolitan Center 458,132 5,407 Cost Burdened Owner Households 375,409 10,207 Cost Burdened Renter Households Miami-Dade County Liberty City
The “value” of owner-occupied housing units is an important determinant of housing accessibility and affordability. Housing values have fluctuated significantly in many housing markets during the past decade due initially to the 2004-2006 “housing bubble” and then followed by the subsequent collapse and economic recession. However, recent trends in the housing market show steady increases in the value of both owner and rental housing in the City of Miami and Miami-Dade County. The median values of owner-occupied and renter-occupied housing units in Liberty City vary significantly. According to 2014 ACS estimates, median values for owner-occupied housing range from a low of $67,900 to a high of $112,100. The highest median owner values are found in Census Tracts in the northeast sections of Liberty City immediately west of NW 7 th Avenue and south of NW 79th Street. The lowest median owner values are found in the east and central core area of Liberty City.
Current median gross rents in Liberty City range from a low of $428 to $1,075. The highest rents are found in the southeast section toward SR 112 and west of the NW 7th Avenue Corridor with the lowest in the central core area of the neighborhood.
Median Housing Unit Value By Census Tract
Source: U.S. Census ACS 2014 5-year estimates
45
Census&Tract Median Value: Owner-Occupied Units Median Gross Rent: Renter-Occupied Housing Units CT 9.03 $100,200 $100,200 CT 10.04 $112,100 $112,100 CT 15.01 $89,300 $89,300 CT 15.02 $109,400 $109,400 CT 17.01 $97,300 $97,300 CT 17.02 $102,400 $102,400 CT 18.01 $111,900 $111,900 CT 18.02 $95,600 $95,600 CT 18.03 $95,800 $95,800 CT 19.01 $67,900 $67,900 CT 19.03 $84,000 $84,000 CT 19.04 $104,700 $104,700 CT 23 $97,200 $97,200
Home Foreclosure Activity
Most of Liberty City’s owner residential properties are located in the southern section of neighborhood which is included in portions of Zip Codes 33142 and 33127. The balance of owner residential properties is largely found in Zip Code 33147. According to RealtyTrac, foreclosure activity in Liberty City is slightly higher than both Miami-Dade County and the City of Miami. The key characteristics regarding home foreclosures in Liberty City (Zip Codes 33142, 33127 and 33147) are as follows.
n According to RealtyTrac, there are currently 991 properties in the three zip codes comprising Liberty City that are in some stage of foreclosure (default, auction or bank owned);
n In March, the number of properties that received a foreclosure filing in each zip code increased from the same time the year before: 11 percent higher in 33127, 17 percent higher in 33142, and 16 percent higher in 33147;
n Significantly, most of the foreclosure activity, including bank-owned properties (REOs), involve structures that are 50+ years and older across Liberty City The age and condition of these structures drives lower median sales prices;
n For Zip code 33142, home sales in March 2016 were up 138 percent compared with the previous month, and up 153 percent compared with a year ago. The median sales price of a non-distressed home was $110,129. The median sales price of a foreclosure home was $80,000, or 27 percent lower than non-distressed home sales.
n For Zip code 33127, home sales for August 2015 were up 100 percent compared with the previous month, and down 92 percent compared with a year ago. The median sales price of a non-distressed home was $231,450. The median sales price of a foreclosure home was $115,000, or 50 percent lower than non-distressed home sales; and
n For Zip Code 33147, home sales for March 2016 were up 26 percent compared with the previous month, and up 33 percent compared with a year ago. The median sales price of a non-distressed home was $122,000. The median sales price of a foreclosure home was $90,000, or 26 percent lower than non-distressed home
46
Foreclosure Activity: Zip Code 331 42
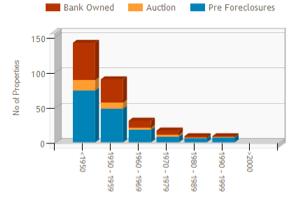
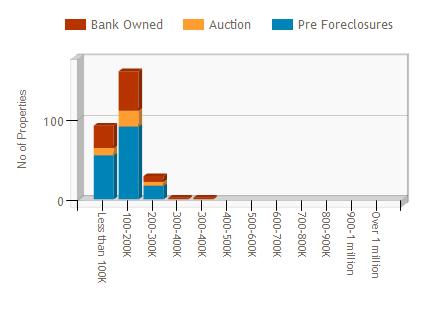
Foreclosure Rate
F or eclosures by Unit Value
F oreclosures by Age of Unit
Source: RealtyTrac, 2016
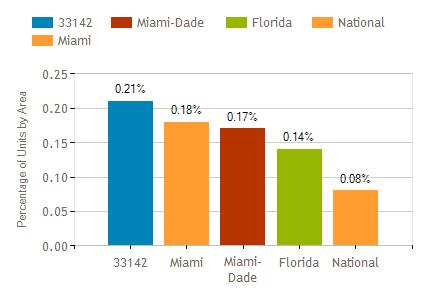
47
Foreclosure Activity: Zip Code 33127
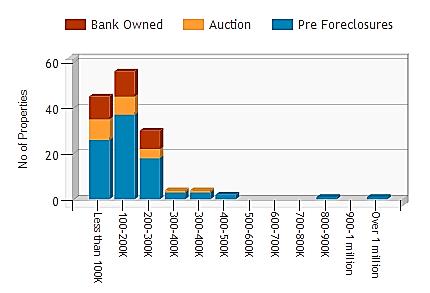
Fo reclosure Rate
F oreclosures by Unit Value
Source: RealtyTrac, 2016
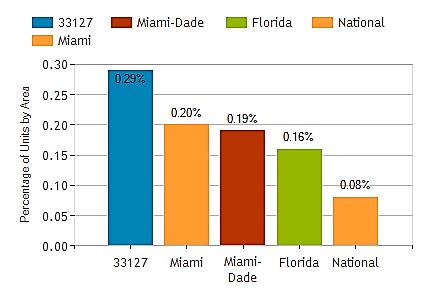
48
Foreclosure Activity: Zip Code 331 42

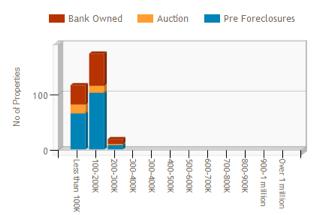
Foreclosure Rate
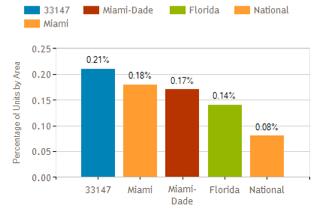
F oreclosures by Unit Value
F oreclosures by Age of Unit
Source: RealtyTrac, 2016
49
Land Use, Redevelopment Potential and Zoning
Predominant Land Use Patterns and Redevelopment Potential
Existing land use patterns and land use regulation determine the types and scale of redevelopment in Liberty City, and therefore determines the types of jobs that will be created there in the future. Land use, as related to economic development opportunities in Liberty City, has these characteristics:
n Liberty City is largely built out. Vacant land, both privately and publicly owned, totals 397 acres, or over 8 percent of Liberty City’s 4,594 total acres. However, these properties are scattered sites and most abut residential neighborhoods and are zoned residential;
n Liberty City’s importance in the regional economy is supported by its extensive inventory of industrial property. Liberty City is a working community 44 percent of its land area is occupied by residential uses, but over 23 percent, or over 1,000 acres, are occupied by industrial, warehousing and transshipment uses. Located primarily along the retail corridor at its western edge, Liberty City’s inventory of industrial property is densely developed, with low vacancy rates, and is part of the crucial regional industrial corridor connected to Miami International Airport;
n Liberty City has a very small inventory of existing office space, approximately 26 acres less than 1 percent of total land area;
n Liberty City is transected by at least seven significant commercial corridors, consisting of major avenues and streets. However, each of Liberty City’s commercial corridors are generally characterized by an under intensity of use. The City of Miami and County revised zoning code allows higher densities and building heights than are generally present on the commercial corridors. Many properties are legally nonconforming “grandfathered” uses developed prior to the code revision, and many are single story, small properties with limited on-site parking. Numerous properties are either vacant or used for storage;
n Most of the length of Liberty City’s commercial corridors abut occupied single family residences, which restrict redevelopment along the corridors under both the City of Miami and County zoning codes; and
n Zoning within Liberty City is fractured across two municipalities with differing allowable densities, uses, and requirements. The existing zoning regime(s) may be limiting future job growth in Liberty City.
50

51
Liberty City Land Use Inventory
52
Land Use Single Family 1,516 33.0% Industrial Intensive, heavy-light manufacturing, and warehousing-storage 812 17.7% Sales and Services (Wholesale facilities, Spot commercial, strip commercial, neighborhood shopping centers/plazas). Excludes office facilities 285 6.2% Vacant, Non-Protected, Privately-Owned 277 6.0% Two-Family (Duplexes) 262 5.7% Schools 245 5.3% Government, Residential 215 4.7% Railroads - Terminals, Trackage, and Yards 180 3.9% Multifamily 179 3.9% Parks 135 2.9% Vacant Government owned or controlled 120 2.6% Houses of Worship and Religious 105 2.3% Industrial Extensive 55 1.2% Mobile homes 55 1.2% Governmental/Public Administration (Other than Military or Penal) 48 1.0% Office 26 0.6% Bus/Truck/Freight Forwarding Terminals 23 0.5% Parking - Public and Private Garages and Lots 19 0.4% Hospitals, Nursing Homes and Adult Congregate Living Quarters 8 0.2% Junk Yard 8 0.2% Industrial Intensive, Office type of use 5 0.1% Cultural - auditoriums, convention centers, exhibition centers, museums, art galleries, libraries 4 0.1% Mixed Use 4 0.1% Industrial intensive, Commercial Condominium type of use 3 0.1% Transient-Residential (Hotel/Motel) 2 0.1% Social Services, Fraternal, Charitable (Shrines, Elks, Moose, Lions Club) 2 0.0% TOTAL 4,594 Source: Miami-Dade County, 2016. Acres
Commercial Corridor Zoning Analysis
Liberty City’s major commercial corridors are NW 7th Avenue, NW 12th Avenue, NW 17th Avenue, NW 22nd Avenue, NW 27th Avenue, NW 79th Street, NW 62nd Street, NW 54th Street, and NW 46th Street. NW 7th and 27th Avenues in particular, are regional scale commercial corridors. They both were historically important commercial destinations prior to the con struction of I-95, and are today major County vehicular corridors. NW 7th Avenue, prior to development of the Interstate system was one of Florida’s major interstate road connectors. It is a State Roadway State Route 441 and to this day is a continuous road terminating near Atlanta, Georgia.
Commerical Corridor Zoning Issues
Further job creation, especially the creation of higher wage jobs in high skilled industries and occupations, however, may be constrained by the conflicting zoning standards regulating future development in Liberty City.
As Liberty City overlaps the City of Miami and unincorporated Miami-Dade County, commercial corridor zoning is regulated by multiple zoning schemes across two government agencies. NW 7th Avenue, for its full length in Liberty City, NW 17th Avenue, as well as NW 62nd, NW 54th, and NW 46th Streets east of NW 7th Avenue, are regulated by the City’s Miami 21 zoning code.
The remaining commercial corridors NW 22nd, 27th and 32nd Avenues, and the streets west of NW 17th Avenue are regulated by the Miami-Dade County Zoning code, under two separate Urban Center District Zoning Districts. NW 79th Street is regulated by the North Central Urban Area District (NCUAD) zoning regulations, while the reminder of the area south of NW 62nd Street is regulated by the Model City Urban Center District (MCUCD) zoning code.
The Miami-Dade County Zoning Code is a traditional zoning code, with extremely specific use guidelines and regulations segregating land uses. Miami 21 is a form -based code, which is less specific regarding the details of uses, but provides a greater level of detail regarding building envelope and relationship to surrounding building forms and land uses. The issues created by the multiple zoning schemes are as follows.
Differing Corridor D e finitional Aproaches
Much of the inconsistency between the codes lies with their differing treatment of the commercial corridors. The Miami 21 approach to zoning and land uses treats all of the corridors within the City portion of Liberty City as more intense urban, mixed-use major commercial corridors. All four corridor segments are T5-O Urban Center Zones, with uses and design guidelines stressing a mix of complementary residential and retail uses which support convenience and walkability.
The four major intersections of each of the commercial corridors NW 27th Avenue and NW 54th Street, NW 27th Avenue and NW 62nd Street, NW 7th Avenue and NW 54th Street, and NW 7th Avenue and NW 62nd Street are classified as T6-8 O Transects (zones), which allow much higher density and intensity of use. The Miami 21 zoning scheme therefore allows a significant ramping up of density and intensity, or urban center “nodes” at these key intersections, with height, density and intensity stepping down away from the intersections.
The County Code classifies each of the corridors in the unincorporated portion of Liberty as MCMixed Use Corridors. However, NW 22nd Avenue is classified as a Neighborhood Retail Corridor ,
53
or minor commercial corridor, with uses and design aimed at lower density and intensity neighborhood related convenience uses. NW 27th Avenue is classified as a “Core” Urban corridor, allowing higher density commercial and business uses.
Allowable Land Uses
Both the County and City of Miami codes are relatively consistent in terms of allowed land uses, and include a wide range of allowable uses, from residential to institutional, commercial and educational. The notable difference in uses between the two codes are as follows.
n Miami 21 allows the development of single family and duplex housing units along the commercial corridors. The County code does not, restricting residential development to multifamily;
n Miami 21 allows “Auto related commercial” uses, including car washes, gas stations and vehicle rental facilities. The County code specifically restricts these uses;
n Miami 21 specifically allows live-work and home office development, while the County code does not; and
n Miami 21 is liberal regarding the development of residential uses buildings are encouraged to be mixed use, but can be single use. Under the County code, residential development in MC Corridors cannot be developed as single use structures, nor can residential development be placed on the ground floor, and must incorporate commercial uses on the ground floor
Of more concern are the inconsistent land uses allowed under both codes. In general, commercial and business corridors, in order to support higher wage, higher skill employment uses and industries, require complementary uses that also contribute to workday convenience and walkability. Both codes still allow uses that are low intensity, not truly supportive of higher intensity employment uses, and vehicle dependent. Uses in both codes that are inconsistent with the goals of walkable, high density employment districts include:
n Drive-through facilities, including drive-through restaurants and service business;
n Public storage facilities;
n Automotive related uses; and
n Large-scale retail development, at 40,000 square feet or larger.
Density a nd Intensity of Uses
The biggest difference between the two codes are their treatment of density and intensity. While setbacks from the street are generally consistent between the codes pushing buildings close to the street Miami 21 allows much higher densities of development. T5-O corridors permit up to 65 residential units per acre, 80 percent lot coverage, and a two story minimum and five story maximum building height. T6-8 O Transects (zones), permit 150 to 1,000 residential units per acre, 80 percent lot coverage, a Floor Lot Area up to 6.25 (with bonuses), and an eight story maximum building height.
The County code is considerably lower density. Under the MCUCD, development along NW 22nd Avenue is limited to 36 residential units per acre, requires only a 1.0 Floor Area Ratio, and a maximum building height of four stories. The segments of NW 62nd and NW 54th Streets abutting the City of
54
Miami are also subject to lower density development. NW 27th Avenue has higher density development allowed, from 41 to 80 residential units per acre, and maximum building height of 4 to 12 stories.
The Net Result of Zoning Issues Both City and County Codes
The result of both the difference between the two codes, and their shared inconsistencies, are as follows.
n The lower density development restriction in the County code limit development along NW 22nd Avenue. With rising land prices across the County, providing higher density in Liberty City’s commercial corridors, which has a history of being an employment generating center, would be a considerable incentive to develop new, higher skill, higher wage employment generating uses and supporting residential development;
n The existing code differences leave NW 54th and 62nd Streets as low intensity, lower density “Islands” in Liberty City, between areas of higher density and intensity;
n The densities in the County code are too low. Higher density and intensity is needed to build a critical mass of employment dense uses and supportive complementary uses.
n The County code needs to incorporate live-work as an allowed use in both the NCUAD and MCUAD Districts. Working from home is a rapidly growing segment of both self-employed occupations and large employers; and
n The incompatible, low-grade and low intensity commercial uses left as allowed uses in both codes are incompatible with the vision and goals of urbane, walkable employment centers.
Industrial Property Inventory
Industrial property represents Liberty City’s second largest category of land use. According the research County property records, Liberty City contains 1,087 acres of Industrial Intensive, heavylight manufacturing, warehousing-storage, Industrial Intensive, and Junk Yard properties. The bulk of these properties, located at Liberty City’s western edge, are a densely developed mix of manufacturing and distribution uses, sprinkled with open storage and junk yard uses.
Although the existing land use pattern is a closely packed arrangement of building mass, the County Zoning code allows significantly greater height and density than is already present. The County code also allows much greater development of office and “flex” space industrial buildings incorporating office space.
Land Use Conclusions
The research team did not complete a detailed commercial corridor property inventory However, redevelopment of the considerable inventory of properties to the minimum standards of the County and City zoning codes represent new development potential in the millions of square feet, and could provide space for office and mixed-use development housing new higher skilled and higher wage jobs than are currently predominant in Liberty City.
55
Manufacturing and industrial establishments play a major role in Liberty City’s economic structure and is one of its leading competitive advantages. It also represents one of Liberty City’s key job creating opportunities. Based on current minimum zoning densities in the CRA, and a 1.0 Floor Area Ratio (FAR), this inventory of property represents a minimum of just over 47 Million square feet of redevelopment potential If only 30 percent of these properties were redeveloped to the new zoning allowances, based on current real estate operating trends, this inventory could provide space for over 26,000 manufacturing jobs. Developing these properties at higher densities, or with a higher proportion of office uses provides even more new employment potential.
The central conclusion regarding development for future job growth in Liberty City is that space for the creation of new jobs through business expansion and/or relocation will be provided by significantly upgrading and redeveloping properties with existing structures and uses already on them. How this redevelopment is regulated, supported and incentivized is key to Liberty City’s economic future.
56
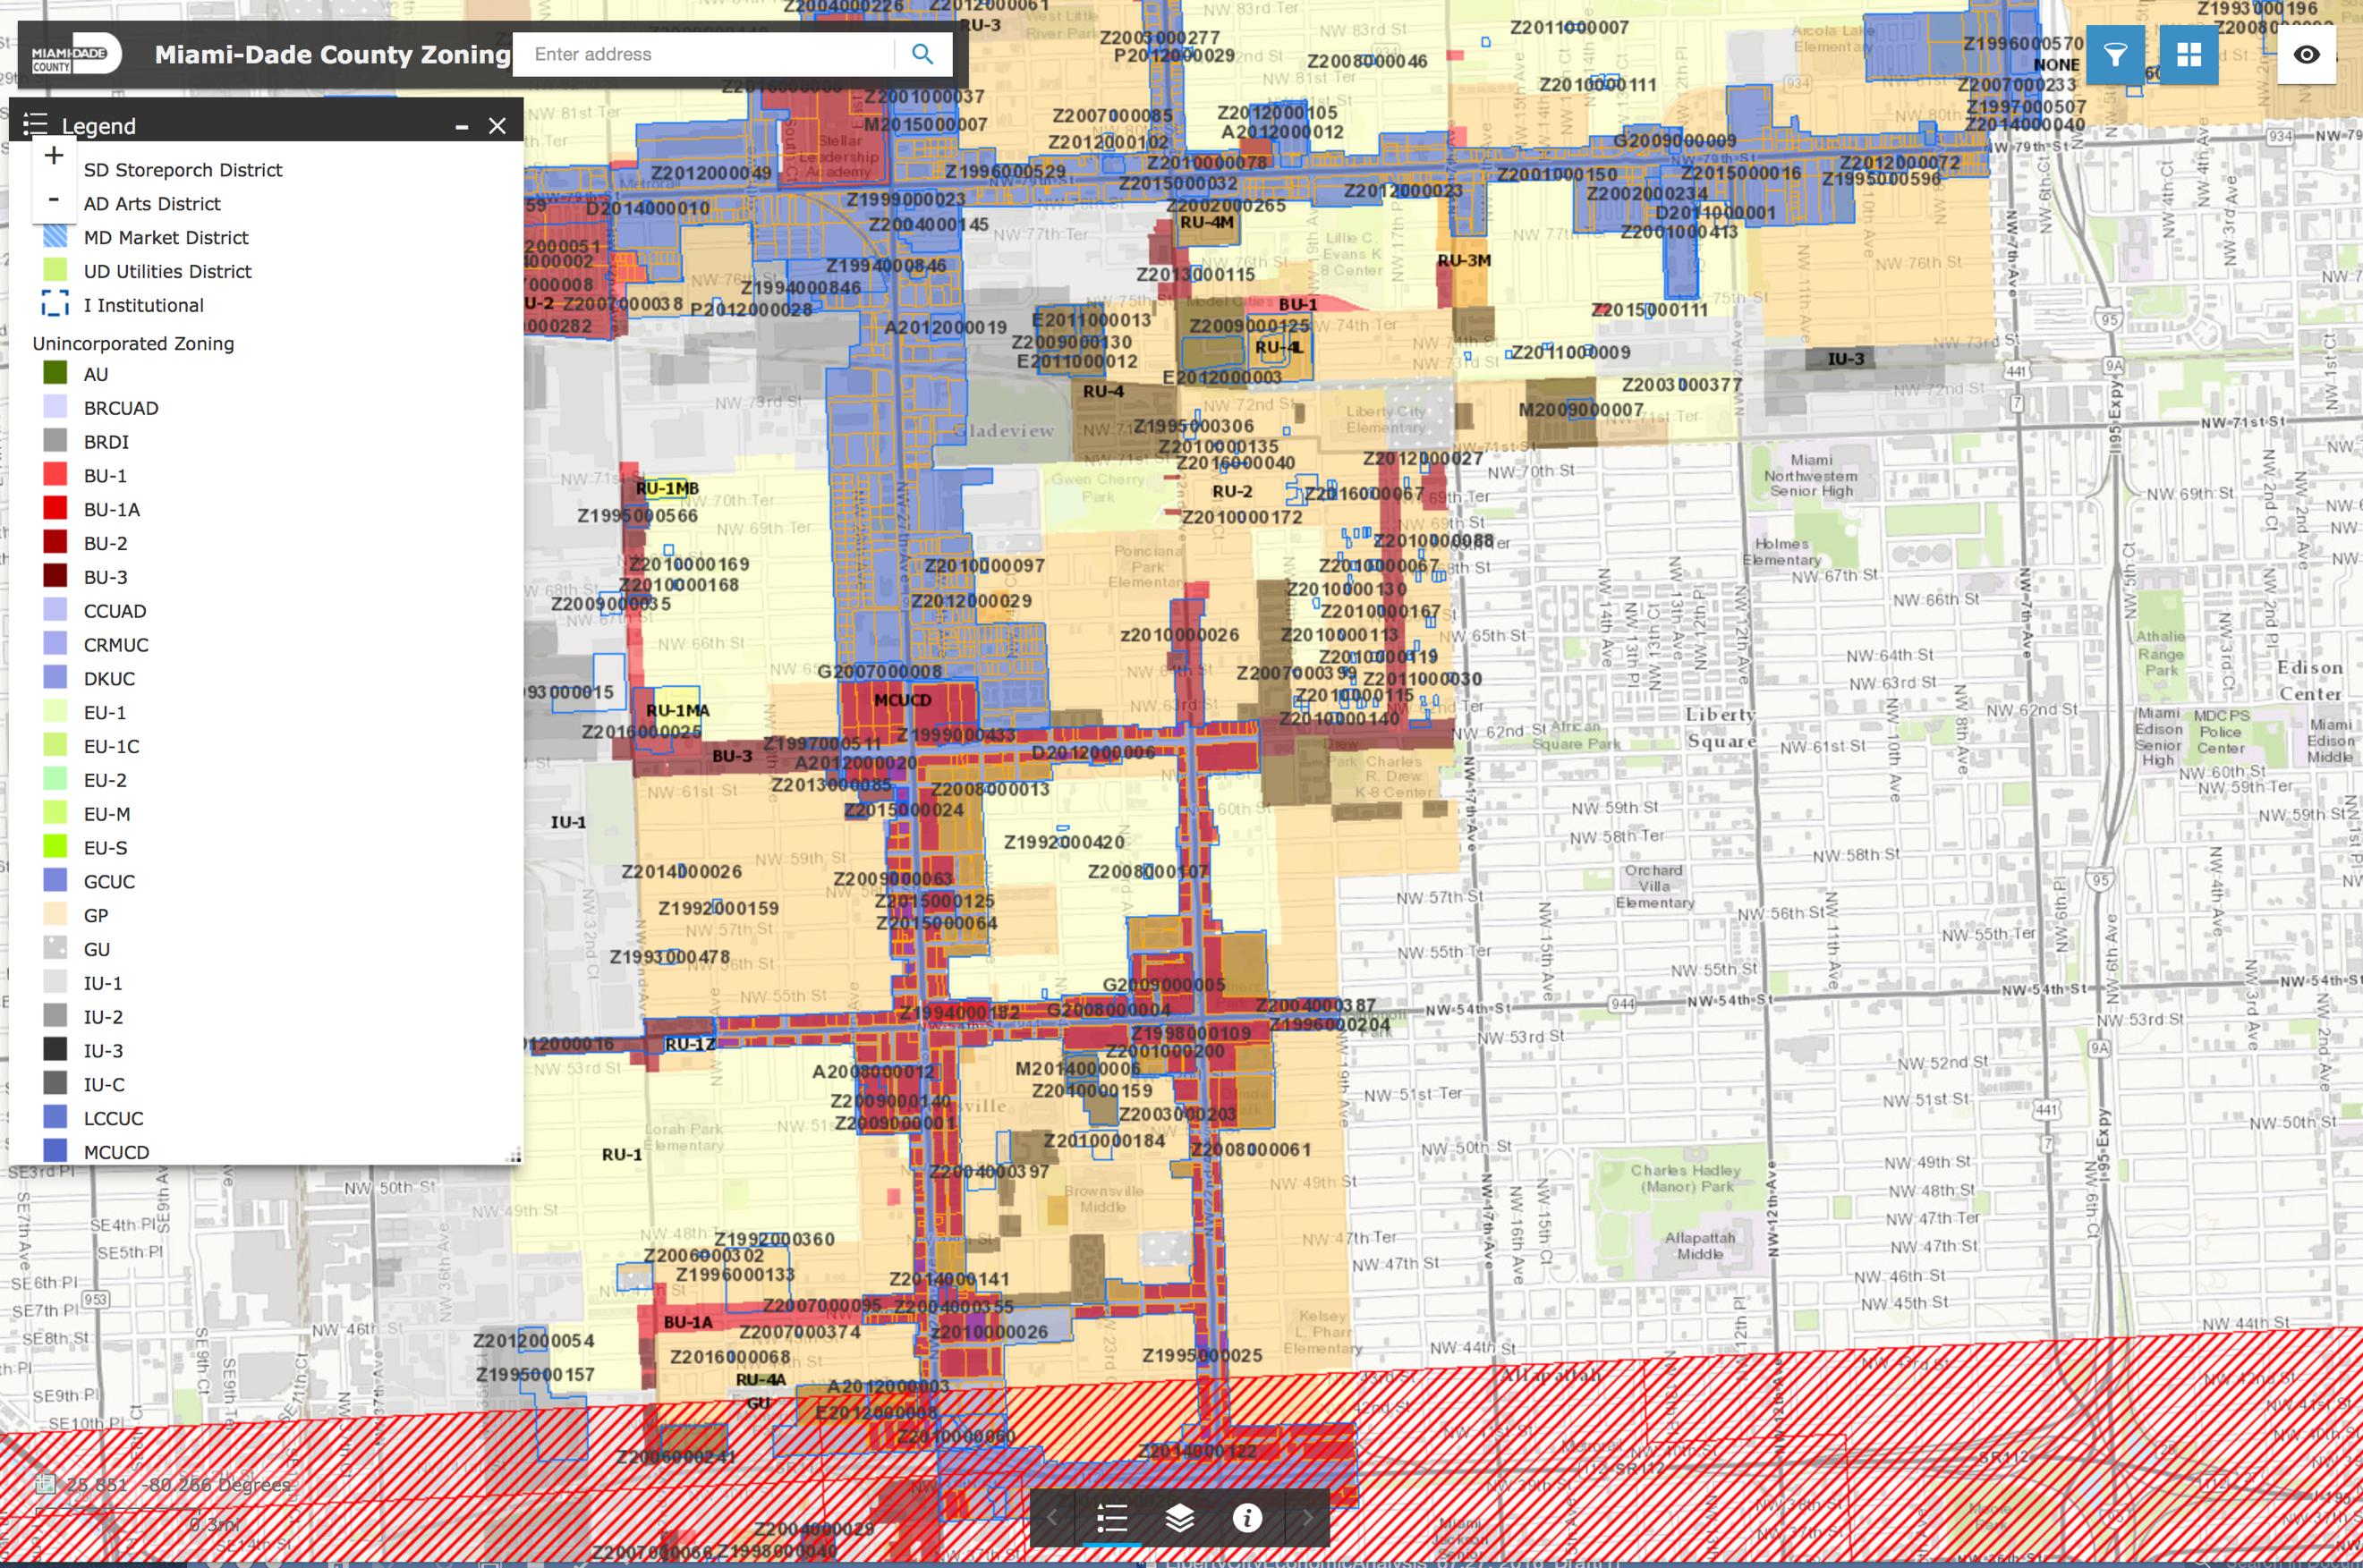
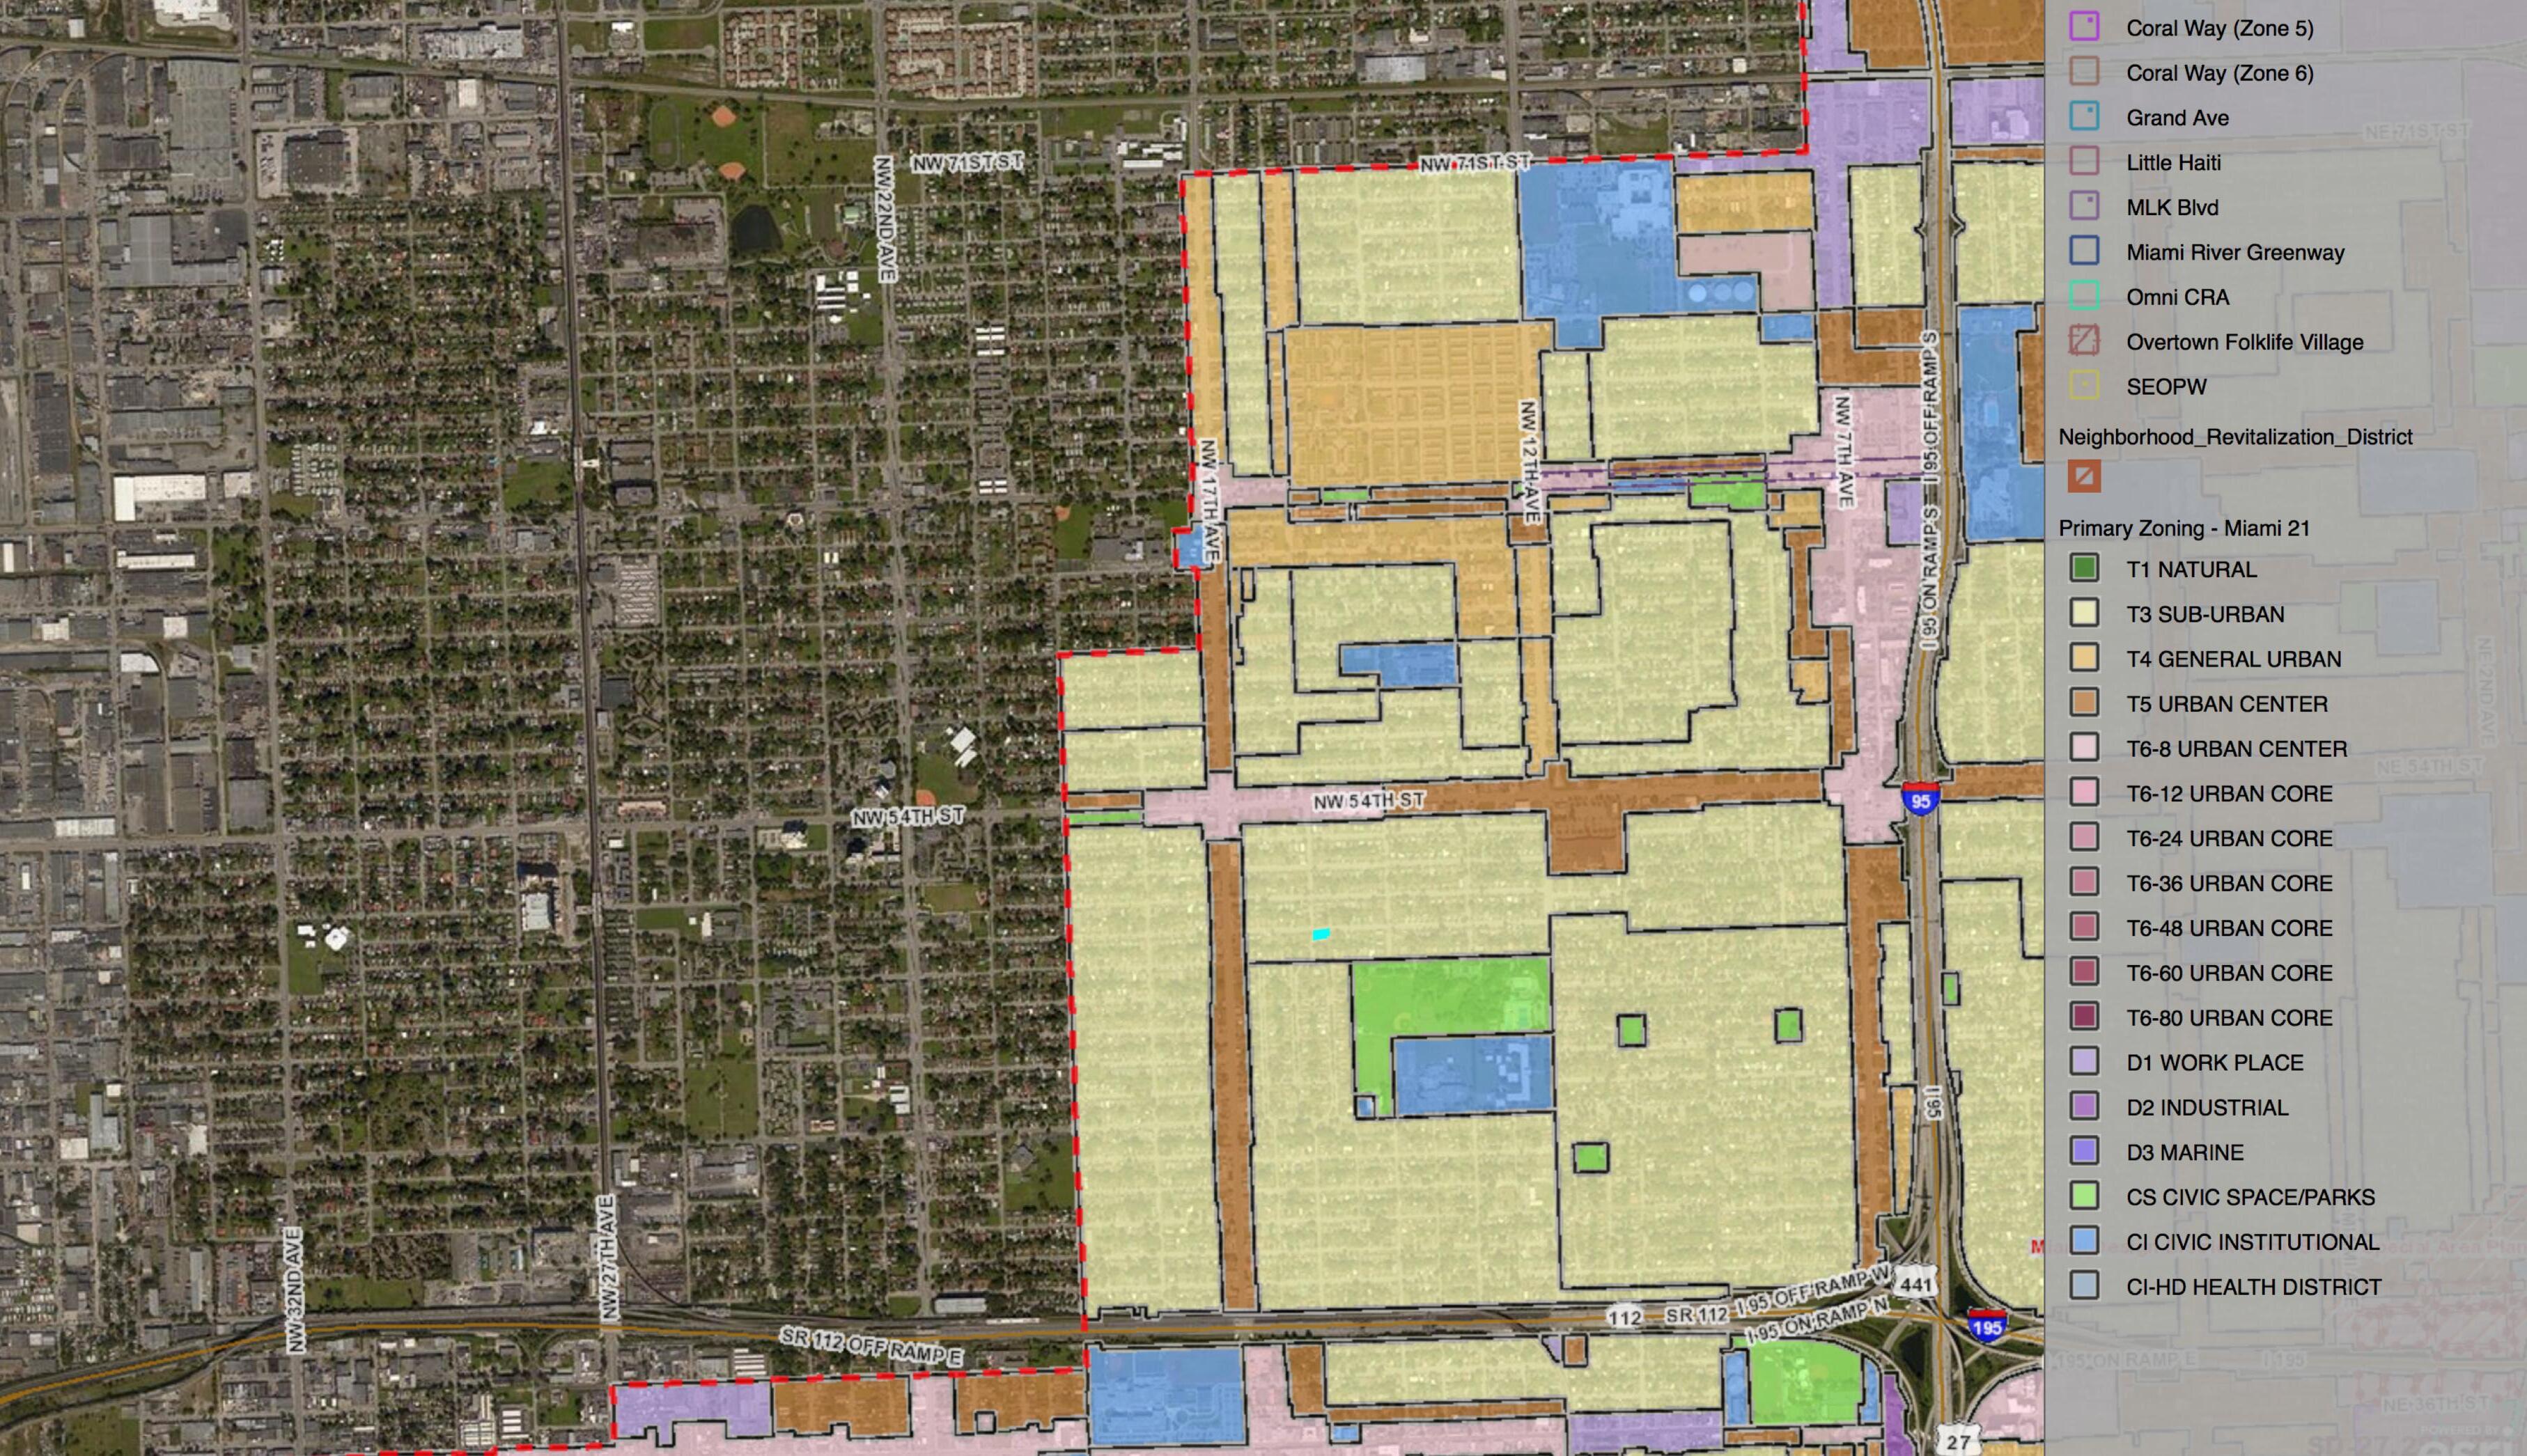
57
Miami - Dade County Zoning – Liberty City
Miami 21 Zoning – Liberty City
Business Development Incentives
Business development support in distressed communities is critically important to growing new employment. Development incentives can be extremely effective tools stimulating the formation of new companies, expanding existing businesses, growing market share for local businesses, overcoming real or perceived investment risks in distressed neighborhoods, and helping local residents receive training to compete for local jobs.
Appendix 1 lists all State and local business incentive programs that could potentially apply to a new or existing business in Liberty City. The now expired State Enterprise Zone Program is included as a reference. Despite what seems to be an extensive list of 17 programs, incentivizing business establishment, expansion and new employment in Liberty City faces significant barriers:
n Loss of the State Enterprise Zone Program: The State chose to sunset its Enterprise Zone Program in December 2015, which provided a very wide spectrum of job tax credits, property and sales tax abatements, discounts, and additional benefits on top of many other State incentive programs. Benefits were freely available to existing local businesses creating new jobs without industry or size restrictions. All of Liberty City was within Miami-Dade’s Enterprise Zone Unfortunately, the program was without question the most valuable set of incentives available to any business seeking a new investment to create new jobs in Liberty City;
n Minimum Size Requirements for Benefits: most of the business incentive programs available to businesses growing in Liberty City require minimum job creation, company size, and/or capital investment requirements that are out of reach of most small businesses in Liberty City and the rest of the County. For example, the Urban Jobs Tax Credit, which would otherwise be available to businesses in Liberty City, requires a minimum of 20 new jobs created by new companies, and 10 new jobs created by expanding companies in order to take the one-time tax credit for each job;
n Limited industry and location requirements: significant programs, including the State and Miami-Dade’s Qualified Target Industry tax credit requires that the recipient be a business from outside the State or, for the County program, outside the County. It only benefits companies relocating into the area from outside the State and/or County, or an existing company that can prove it is seeking to move outside the State or County. Additionally, important incentive programs limit benefits to a small number of 4-digit SIC code industry segments, most of which have little or no application in Liberty City, including agriculture, golf courses, and amusement parks;
n Limited Total Incentive Funding: Most of the State incentive programs which would have value to Liberty City business investment are capped at relatively low amounts. For example, the State Urban Jobs Tax Credit, which is delivered on a first-come-first –served basis, is capped at $5 Million per year for the entire State of Florida; and
n Liberty City is not served by a locally dedicated economic development agency. The 79th Street CRA boundaries include only the northernmost portion of Liberty City, and the Overtown CRA includes a 3 block sliver of property between NW 7th Avenue and I-95.
58
Business Development Incentive Conclusions
The State and County’s business incentive program structure is out of step with the dynamics of job creation in general 97 percent of all jobs are created by existing local, small businesses. They are also out of step with the dynamics of job creation in Liberty City Liberty City’s business economy is driven by small, locally owned businesses over 92 percent of all businesses in Liberty City employ less than 20 people, and over 94 percent are single location businesses, as opposed to branch or franchise establishment locations Due to size, industry and investment criteria that are out of reach of most of Liberty City’s businesses, the net effect of the current incentive structure is that business incentives needed to stimulate and support new job creation in Liberty City are almost completely unavailable.
Identity and Brand Recognition
Liberty City has Poor Brand Recognition Within the Region
Like successful businesses, neighborhoods benefit from a broader identity and knowledge of what that community has to offer the region. Calle-Ocho, Brickell, the Miracle Mile, Coco Walk, Wynwood, and the Design District, to name a few, are neighborhoods that have built a brand identity which over time, conveys a clear image to the region regarding shopping experiences, living, working, and investing in that community. Most recently, in Doral more than 100 interior decor businesses are organizing to promote themselves, improve area roads, and boost interest in the community of merchants from 87th Avenue east to the Palmetto and from 36th Street south to 25th Street under the Doral Decor District brand name.
The development of a positive brand identity creates create clear competitive advantages, becoming the platform upon which to build a successful marketing campaign, supporting the growth of businesses within the community, attracting new investment, and public support. However, Liberty City suffers from a number of identity and “brand” recognition issues, primarily the fact that little is publicly known about its economic strengths and advantages.
59
Rethinking Liberty City : Opportunities and Challenges
A summary of the key strengths, opportunities, barriers, and challenges framing redevelopment in Liberty City is as follows.
Key Strengths and Opportunities
Based on the economic analysis, Liberty City has considerable redevelopment, strengths, and opportunities. They include the following.
A Major Economic Sub-Region
Liberty City is the heart of an extremely important economic sub-region. Its Market Area has a population of 517,572 persons. If the Liberty City Market Area was its own city, it would be Florida’s 2nd, and the Nation’s 34th largest city bigger than Sacramento, Kansas City, the City of Atlanta, Miami, Oakland, New Orleans, Cleveland, Tampa, and almost twice the size of Orlando. Liberty City and its immediate Market Area also possess significantly large purchasing power: aggregate household income in Liberty City in 2014 was over $543 Million, while the Market Area represents one of the County’s largest purchasing power communities. Aggregate household income in the Liberty City Market Area is over $6.4 Billion.
Liberty City’s Redevelopment Aligns with Regional Development Goals
The County has targeted 39 high growth sectors for focused development of new jobs. Liberty City, given its location, land availability, and strong small business community, is an ideal location for the creation and expansion of businesses in back office, building & construction, healthcare, non-profits, private education, culture & entertainment, financial & real estate, professional services, electronics, biomedical supplies & labs, and consumer goods manufacturing Redeveloping Liberty City also addresses the region’s pressing transportation congestion issues.
A Significant Business Development and Employment Dynamic
Liberty City is a surprisingly diverse, dynamic, and growing business destination within Miami -Dade County. In fact, its industry composition, growth dynamics, performance, occupational mix and business community may be its single strongest asset a nd opportunity for broader redevelopment:
n As home to diverse manufacturing, professional services and support industries, Liberty City has an economic ecosystem which is uncommon for most communities across the region. The location of its industry mix proves out its competitiveness as an economic location. Properly supported and stimulated, the simple expansion of existing businesses already located in Liberty City represent a job creation competitive advantage with few comparable locations throughout the County;
60
n Although just over 15,000 employed residents live in Liberty City, its 1,599 business establishments employ 18,526 workers. Aggregate payrolls have been rising steadily in Liberty City and its Market Area. This local employment surplus is a distinct opportunity to provide jobs for the residents of Liberty City;
n Liberty City’s business economy is driven by small, locally owned businesses over 92 percent of all businesses in Liberty City employ less than 20 people, and 1,505 (94 percent) are single locations, as opposed to branch or franchise establishment locations;
n Liberty City’s business community also has tremendous regional market reach. The total annual sales of all business establishments located in Liberty City who report their annual sales is over $12 billion. The purchasing power of Liberty City and its Market Area total $6.9 Billion, meaning that its businesses are selling to an extended regional, and in some cases, national market of consumers and clients. A full 42 percent of its reporting businesses have sales over $1M per year, with 10 establishments reporting sale over $100 Million per year. Liberty City’s largest establishment by sales volume is Holy Spirit Ministries, with annual sales over $5 Billion.
Regionally Competitive and Significant Manufacturing & Industry Sectors
Manufacturing and industrial establishments play a major role in Liberty City’s economic structure and is one of its leading competitive advantages. Given the region’s need to grow advanced manufacturing, the region’s shortage of quality industrial acreage, and the scale of jobs and sales revenues of its businesses, the collection of industrial and distribution properties at Liberty City’s western edge play an important role in the region’s economic evolu tion. The established location of these properties provides a platform for the continued creation of new higher paying, higher skilled jobs.
Unparalleled Access, Connectivity and Regional Economic Assets
Liberty City has significant economic assets on which to build new employment capacity, including a large population, high employment density, a growing business base, major institutions, and infrastructure within a 14-minute drive.
Liberty City’s proximity to Wynwood and the Design District also represent two distinct opportunities. First, as small businesses are increasingly priced out of Wynwood and the Design District, Liberty City can be repositioned as an affordable alternative location to diverse design, fashion, arts and professional services businesses. Second, the incremental redevelopment of many Wynwood properties adaptively re-using older buildings for new economy uses can be an instructive model for the redevelopment of Liberty City.
Redevelopment and Job Growth Challenges
Regional Economic Barriers to Broader Prosperity
Despite recent employment gains, barriers to expanded prosperity, economic mobility and opportunity have been growing, rather than easing, during the post 2008 recovery. As the FIU
61
Metropolitan Center has noted recently, the regional economy faces numerous challenges that impact its communities, including:
n Evidence that Miami-Dade County’s economy is becoming less competitive;
n Declining real median income across every income segment in the County ;
n Incomes in all income quintiles that are lower than their respective national averages, and growing income inequality significantly above the national average;
n A countywide poverty rate, at 19.8 percent, that is 33 percent higher than the national poverty rate;
n Highly amplified cycles of job loss and recovery that erase significant household wealth, including homeownership equity;
n Low rates of vertical income mobility and declining horizontal job mobility;
n Rapidly rising regional housing and transportation costs;
n An economy creating a preponderance of lower wage jobs, and only slowly creating jobs in leading high-wage sectors;
n Persistent geographic poverty, unemployment and income inequality even in times of rapid economic expansion, a number of communities have not, and are not, participating in the economic growth of the region; and
n The lack of a coordinated local community development infrastructure.
Liberty City’s Workforce Challenges
Liberty City has a wealth of talented workers seeking upward job mobility, but as a community, residents of Liberty City face barriers to moving up the income ladder including household incomes below the County average, low educational attainment, and a poverty rate double the County rate.
A Mismatch Between Liberty City’s Employers and its Workers
As the study shows, Liberty City’s businesses have considerable sales volume, resources, and market reach. The community is also home to many businesses creating higher wage, higher skilled jobs. Unfortunately, most of the residents of Liberty City aren’t taking these jobs, and work outside of Liberty City and its Market Area. Only 4.9 percent of Liberty City’s jobs are held by Liberty City residents.
A Stressed Housing Market
Housing costs, while reasonable by County standards, are still a challenge for many households in Liberty City. The community is marked by a high proportion of households who are cost burdened, and foreclosures on owner occupied homes continues to destroy asset values and personal wealth for too many families
Land Availability and Redevelopment Potential
Liberty City is largely built out. Vacant land, both privately and publicly owned, totals 397 acres, or over 8 percent of Liberty City’s 4,594 total acres. However, these properties are scattered sites and most abut residential neighborhoods and are zoned residential.
Liberty City’s commercial corridors, both major avenues and streets, are largely underdeveloped given existing zoning allowances. In addition, the approximately 1,000 acres of industrial prop erty are
62
densely developed, but for the most part at lower density than is allowed under the County’s zoning code.
Liberty City’s commercial corridors and industrial properties represent significant location for the development of new jobs and employment. If only 30 percent of the industrial properties at Liberty City’s western edge were redeveloped to current zoning allowances, this inventory could provide space for over 15,000 new jobs. However, both business expansion and new business development will require either the adaptive re-use or complete redevelopment of properties with existing uses and structures on them, rather than vacant “greenfield” development.
Fragmented and Inconsistent Zoning
Liberty City has largely flexible, but fragmented zoning, stretched between two municipalities (the City of Miami and Miami-Dade County). Density limitations, for residential development may be too low to foster extensive redevelopment, is out of step with newer concepts of mixed-use development stressing walkability, and does not leverage Liberty City’s tremendous transportation capacity and connectivity.
A Non-Existent Business Redevelopment Incentive Structure
Business expansion and development incentives are a critical, central component of economic competitiveness. Unfortunately, businesses growth in Liberty City face two fundamental challenges.
First, Liberty City lacks a set of focused redevelopment resources and incentives shaped to its specific needs. The loss of the State’s Enterprise Zone Program represents a potentially crippling loss to new job creation in Liberty City. In addition, the State and County’s business incentive program structure is out of step with the dynamics of job creation in general 97 percent of all jobs are created by existing local, small businesses.
More specifically, they are also out of step with the dynamics of job creation in Liberty City Liberty City’s business economy is driven by small, locally owned businesses over 92 percent of all businesses in Liberty City employ less than 20 people, and over 94 percent are single location businesses, as opposed to branch or franchise establishment locations. Due to size, industry and investment criteria that are out of reach of most of Liberty City’s businesses, the net effect of the current incentive structure is that business incentives needed to stimulate and support new job creation in Liberty City are almost completely unavailable.
Second, distressed communities can benefit significantly from a development entity focused on its particular needs and strengths, but Liberty City isn’t served by any such agency. The community is only partially served by the 79th Street CRA, which has no significant economic development funding.
Brand and Image Issues
Liberty City has a damaged regional identity or “brand,” driven by both real and perceived threats of crime, varying building and streetscape conditions, an underdeveloped public domain, and underutilized spaces creating an inconsistent street image, the community’s location, strengths, and business advantages are misunderstood in the regional real estate and business communities.
63
Economic Development Opportunity Strategies
The prior sections of the report provide a competitive assessment that identifies the economic strengths, challenges and opportunities in Liberty City. The analysis provides clear opportunities for Liberty’s City’s businesses and residents to connect to and compete in the larger regional economy. Given Liberty City’s opportunities, strengths, and challenges, economic redevelopment of the community should be targeted at achieving four objectives:
n Increase the skills and education of local residents to assume and transition into higher paying jobs and compete for valuable employment already present in Liberty City;
n Liberty City can benefit significantly in the short term by growing the businesses it already has. Incentives, investment and business support is best directed at existing small local businesses;
n Build employment and asset wealth by aggressively supporting the formation of new start-up businesses by local entrepreneurs;
n Implement strategically targeted, incremental physical investments to stimulate redevelopment and physical improvements in highest need locations in the community; and
n Drive neighborhood business growth through strategic public-private initiatives and partnerships that can help leverage and influence larger market forces and strengthen their local and regional competitiveness
The following are specific economic development “opportunity” strategies that should be implemented in Liberty City in the near term
Strategy 1: Connect the Resident Labor Force with Existing Businesses in Liberty City
The economic analysis determined that Liberty City businesses have considerable sales volume, resources, and market reach and is also home to many businesses creating higher wage, higher skilled jobs. The economic analysis found that over 15,000 employed residents live in Liberty City and its 1,599 business establishments employ 18,526 workers but only 4.9 percent of Liberty City’s jobs are held by its residents. Connecting Liberty City’s working residents with job opportunities in Liberty City’s existing businesses might be its most potent immediate employment and income strategy. We suggest a three step approach to develop a targeted job training program:
n Create a business inventory according to industrial classification, address and product/service;
64
n Administer a business survey to determine employment needs and skill levels of local businesses; and
n Complete an employment analysis to determine the match of employment demand to worker skills in Liberty City and develop job training programs where employment mismatches are indicated, in partnership with Liberty City businesses.
Strategy 2: Connect Liberty City Businesses to Regional Industry Growth Sectors
Economic development in inner city areas such as Liberty City will come only from recognizing the potential advantages of an inner-city location and building on the base of existing companies, while dealing frontally with the present disadvantages of inner cities as business lo cations. As such, the challenge is to grow and create new businesses that will provide both entrepreneurial and job opportunities for Liberty City residents.
Research has found that inner cities experience faster employment growth when they have strong connections with regional clusters. The prior analysis found that businesses in Liberty City and its Market Area are already selling to an extended regional market of consumers and clients. Liberty City, given its location, land availability, and strong small business community, is an ideal location for the creation and expansion of businesses within targeted industry sectors including building & construction, healthcare, culture & entertainment, financial & real estate, professional services, electronics, biomedical supplies & labs, and consumer goods manufacturing The analysis found that the Liberty City Market Area added 933 new establishments from 2010 to 2014, a 7.7 percent increase with the largest number of new establishments created generally in higher wage industries, including professional, scientific, and technical services, real estate and rental and leasing.
Further, the growth of cluster activities in urban neighborhoods helps revitalize the immediate surroundings of where those buildings are located. However, the correlation between clusters and employment in inner cities is weaker due to the fact that cluster strategies for inner-cities such as Liberty city may include institutional barriers and fewer employment networks that constrain minority populations. Therefore, effective cluster-based strategies that reach underserved populations must include reaching out to small business owners, learning from community-based partners about the barriers facing small business owners and seeking targeted sources of funding Cluster based development investment includes:
n Supporting business development in Liberty City by connecting local businesses with regional clusters;
n Identify the human capital and employment skills that are needed by businesses and organizations in both Liberty City and regional clusters; and
n Connect cluster industry entrepreneurial ecosystems to small and minority ownedbusinesses in Liberty City.
65
Strategy 3: Re-Tool Local Business Development Incentives
Supporting wealth creation and job opportunities within Liberty City requires continued and expanded support for neighborhood businesses. Job creation and business investment incentives are also a critical competitive advantage. As we have noted, however, businesses in Liberty City, and many small businesses that might consider a location in Liberty City are eligible for few, if any, economic development incentive programs. The study team recommends immediately considering the development of a package of economic development incentives aimed at Liberty City’s specific needs, focusing on existing small businesses Many of these programs do not require new legislation, however, but merely amending existing programs. A robust incentive program would include the following elements
n Revise the County’s existing Urban Jobs Tax Credit Program: Enact three amendments to the Urban Jobs Tax Credit Program: 1) Decrease the number of new jobs required to qualify for the program from 20 jobs to 5 new jobs for new businesses; and from 10 jobs to 3 for existing businesses; 2) either eliminate altogether, or expand the number of industries qualifying for the credits to include all manufacturing, professional services, information technology, and design sectors; and 3) include a bonus, or automatically qualify jobs paying 150 percent of the County median wage
n Re-establish a local (County) Enterprise zone program : The Enterprise program provided an extensive range of performance based incentives for small businesses investing, expanding, or locating in the County Enterprise Zone, which previously covered all of Liberty City. The maximum annual incentive benefits claimed by all businesses totaled $3.5 Million for the entire County under the now expired program. A renewed County-wide program would benefit Liberty City, or a considerably smaller program targeted for Liberty City could be developed as a pilot program. State tax credits under the old program could be replaced by cash reimbursement from the County. If modeled on the State program, it would support the creation of new jobs and significant new capital investment each year throughout Liberty City.
n Provide small-scale Seed Grants to fund small-scale neighborhood economic development and revitalization projects identified and developed by communities within priority neighborhoods and/or culturally-specific organizations.
n Create a Storefront Revitalization Program: Provide grant funds to partially subsidize the costs of property improvements to commercial storefronts in all commercial districts in Liberty City.
n Establish Business Opportunity Districts: In addition to other incentive programs, provide automatic benefits for businesses locating in target commercial development zones. Additional automatic benefits could include property tax abatements, sales tax abatements, demolition assistance (see below), and eliminate and/or reduced permitting and impact fees. Recommended commercial development target areas would include each of the major avenues in Liberty City, between 54th and 62nd Streets.
66
n Consider Financial Assistance for Demolition Costs: redevelopment in Liberty City will depend upon cost effectively repurposing or demolishing older properties for new employment generating uses. Subsidizing demolition costs could be a valuable business incentive, provide new, efficient space, and improve the appearance of Liberty City’s commercial corridors.
n Package Additional Public-Private Financing Tools: In order to facilitate neighborhood-based economic development projects, Miami-Dade County will need to identify and package a wider range of funding sources to fill the gap between development costs and investment supported by market rents. Providing access to reduced interest loans, working capital loans, and assistance with Florida New Market Tax Credit financing loans can be developed using partnerships with community development financial institutions, foundations, banks, and other financial institutions Emphasis should be on loan funds to minority-owned firms and high value businesses who have difficulty accessing capital through traditional means.
Strategy 4: Build an Accelerator Ecosystem for Liberty City
Liberty City has proven to be a desirable business location. North Central Miami-Dade is also home to significant local entrepreneurial talent with the potential to create a myriad of new and expanding business opportunities in Liberty City. However, entrepreneurs choosing to invest in distressed neighborhoods face challenges including securing early stage funding, connecting to markets, connecting to investors, and securing appropriate office and/or manufacturing space.
Business Accelerators can provide numerous economic benefits, including helping start-ups overcome the hurdles of investing in distressed neighborhoods, increasing local employment opportunities, and providing new businesses that tend to stay and grow in local neighborhoods.
The study team recommends establishing a network of business accelerators focused on serving local entrepreneurs and social impact entrepreneurs. Even three small well run accelerators could serve up to 96 businesses per year, creating up to 360 new jobs per year. Additionally, accelerators are most effective when privately owned and operated Though developing a small network of accelerators may require an initial seed investment or subsidy, the continued costs of operation would be a completely private expense.
Strategy 5: Expand Local Business Technical Assistance
Growing Liberty City’s existing businesses is the fastest way to grow new jobs in the community. However, expanding market share, making new capital investments, or moving into new markets can be a daunting, risky, or difficult proposition. Small businesses benefit from technical support when making critical expansion decisions.
The study team recommends aggressively expanding the scope and quality of business technical support services in Liberty City. The key services provided by successful business technical support providers include:
n Business Finance Analysis;
67
n Growth Strategies Analysis;
n Operations Improvement Analysis;
n Entering International Trade Markets and Development;
n Government Contracts & Funding;
n Site Selection Analysis;
n Strategic Market Research;
n Marketing & Brand Positioning;
n Business Plan Development;
n Capital Access and Loan Packaging; and
n Investment Business Plans and Investor Solicitations (for domestic and foreign direct investment)
The region has a number of qualified non-profit business development service providers who affordably focus on stabilizing and growing small businesses with modest revenues in distressed neighborhoods.
Strategy 6: Amend Miami-Dade County and Miami 21 Zoning Codes to Support Redevelopment
The existing zoning regulatory scheme applying to Liberty City is inconsistent, fractioned, and includes uses which hamper the near and long term development of higher wage, higher skilled businesses along its commercial corridors and industrial areas. The study team recommends the following changes to both County and City of Miami zoning codes in Liberty City:
n Adopt the same approach, density, and height allowances to critical commercial intersections within the County code as Miami 21. Miami 21 treats major intersections as separate Zoning Transects, allowing a significant increase in unit density above the rest of the corridor Higher density and intensity is needed to build a critical mass of employment supporting complementary uses. The County code leaves NW 54th and 62nd Streets as low intensity, lower density “Islands” between areas of higher density and intensity. Each of the of the major avenue intersections NW 7th, NW 17th, NW 22nd and NW 27th at 54th and 62nd Streets should be rezoned to match Miami 21’s density and height allowances (150 residential units per acre, 80 percent lot coverage, a Floor Lot Area up to 6.25, and an eight story maximum building height);
n Amend Miami 21 to exclude “Auto related commercial” uses, including car washes, gas stations, vehicle rental facilities, drive-through facilities, including drive-through restaurants and service business, public storage facilities, and large-scale retail development (40,000 square feet or larger);
n Amend the County zoning code to incorporate live-work and home office development as an allowed use in both the NCUAD and MCUAD Districts;
n Amend Miami 21 to eliminate the development of single family and duplex housing units along commercial corridors and allow only multifamily residential; and
68
n Amend the County zoning code remove junk yard and open storage uses from industrially zoned properties in Liberty City. Consider incentivizing higher end manufacturing by providing relief from setback and parking requirements in exchange for higher density, more office, and/or new industrial construction in Liberty City’s western edge industrial properties.
Strategy 7: Sponsor a Catalytic Signature Development Project
Directing the development of a signature, high-impact development project on an underutilized parcel or property can have catalytic effects on nearby properties and districts, provide community benefits, and stimulate further economic development A properly conceived development project can jump-start significant new development in the community. The development of a signature development project could take one of four forms:
n Partner with a property owner to assist with the solicitation (RFP) of a priv ate developer;
n Option an existing property, with an agreement to solicit (RFP) the property to the development community on behalf of the property owner;
n Purchase a property outright, and solicit (RFP) proposals for redevelopment ; or
n Execute a public-private partnership agreement with a property owner to solicit and RFP the property for redevelopment, on established terms. Both the property owner and CRA stay in as partners on the project (land-lease, etc.).
Strategy 8: Implement a Development Land Bank Program
Land banks are public or community-owned entities created for a single purpose: to acquire, manage, maintain, and repurpose vacant, abandoned, and foreclosed properties. They can simply acquire property on behalf of a local municipality, or act as a full-fledged property developer. Generally, land banks acquire or receive of tax-foreclosed property, and provide a property inventory for long-term community development. Successful land bank programs revitalize blighted neighborhoods by directing reinvestment to support their long-term community vision. The study team recommends formation of a Community Land Bank program operated by the County or a designated third party development agency.
Strategy 9: Aggressively Market Liberty City’s Strengths and Opportunities
Aggressively marketing Liberty City through a multi-pronged, multi-media marketing program to businesses, entrepreneurs, investors, developers and site selectors can spur new investment and help connect Liberty City business with regional markets. The elements of the marketing program should include 1) a WEB site; 2) a digital marketing package with all basic information needed to consider expanding, growing, or relocating a business in Liberty City; 3) a Direct Marketing Program; and 4)
69
In-Person Presentations and Regular Communications to professional development, business and realty groups
Strategy 10: Create or Assign a n Agency to Lead Economic Development in Liberty City
Implementing the economic development program recommended herein will require a dedicated agency with staff and resources to raise, coordinate and direct investment in Liberty City. The study team recommends either 1) designating an existing non-profit agency, or 2) creating a new agency to lead redevelopment programs in Liberty City. The development agency could be a new or existing CRA, Community Development Corporation, or non-profit community development agency with the required staffing and resources to carry out the economic development plan. Ideally, the agency should be a community-led partnership to finalize and carry out the strategy, ensuring that the benefits of increased economic activity flow to those most disconnected from the regional economy
70
Appendix 1: State & Local Business Development Incentives
Florida State Enterprise Zone (Program Expired December 2015)
The State of Florida chose to sunset the State’s Enterprise Zone Program in December 2015. The program was available to businesses within locally defined enterprise zone locations, located in the State’s most distressed communities. Benefits to small and large businesses were extensive. They included:
n Jobs Tax Credit A credit against either the Florida Corporate Income Tax or the Florida Sales & Use Tax on wages paid to new employees who have been employed by the business for at least 3 months and are residents of a Florida Enterprise Zo ne.
n Property Tax Credit New or expanded businesses located in an enterprise zone are allowed a credit on Florida corporate income tax equal to 96 percent of ad valorem taxes paid on the new or improved property (the assessment rate varies by county).
n Sales Tax Refund for Business Machinery and Equipment Used in an Enterprise Zone Refund on sales taxes paid on the purchase of certain business property.
n Sales Tax Refund for Building Materials Used in an Enterprise Zone A refund for sales taxes paid on the purchase of building materials used to rehabilitate real property located in an Enterprise Zone.
n Sales Tax Exemption for Electrical Energy for businesses in a newly occupied structure or renovated structure, a 50 percent exemption on municipal utility tax and at least a 50 percent exemption from the state sales tax on electrical energy. If 20 percent or more of the businesses’ employees are Enterprise Zone residents, the business will receive a 100 percent exemption from the state sales tax; if less than 20 percent of the businesses’ employees are Enterprise Zone residents, the business will receive a 50 percent exemption from the state sales tax.
State of Florida Qualified Target Industry (QTI) Tax Refund
The QTI is a tool available to Florida comm unities to encourage quality job growth in specific targeted high value-added businesses. If approved, the applicant may receive refunds on the taxes it pays. This includes corporate income, sales, ad valorem, intangible personal property, insurance premium, communications services, and certain other taxes. There is a cap of $5 million per single qualified applicant in all years, and no more than 25 percent of the total refund approved may be taken in any single fiscal year. Pre-approved applicants who create jobs in Florida receive tax refunds of $3,000 per net new full-time equivalent Florida job created; $6,000 in an Enterprise Zone or Rural Community (county). Additional awards include:
71
n $1,000 per job for businesses paying at least 150 percent of the prevailing average annual wage or $2,000 per job for businesses paying at least 200 percent of the prevailing average annual wage;
n $2,000 per job if the business falls within a designated high impact sector OR if the business increases exports of its goods through a seaport or airport in the state by at least 10 percent in value or tonnage in each year of receiving a QTI refund;
n $2,500 per job if project is located in a designated Brownfield area (Brownfield Bonus); and
n $1,000 per job if the local financial support is equal to the base QTI award.
Qualified Defense and Space Contractor Tax Refund (QDSC)
Florida is committed to preserving and growing its high technology employment base by giving Florida defense, homeland security, and space business contractors a competitive edge in consolidating contracts or subcontracts, acquiring new contracts, or converting contracts to commercial production. Pre-approved applicants creating or retaining jobs in Florida may receive tax refunds of $3,000 per net new Florida full-time equivalent job created or retained; $6,000 in an Enterprise Zone or rural county. For businesses paying 150 percent of the average annual wage, add $1,000 per job; for businesses paying 200 percent of the average annual salary, add $2,000 per job.
Florida Research And Development Equipment Sales Tax Exemption
The Sales and Use Tax Exemption on Machinery and Equipment Used for Research and Development is available to help foster innovation throughout the state. Under this exemption, effective July 1, 2006, machinery and equipment used predominantly* for research and development are exempt from sales and use tax.
Florida Machinery And Equipment Sales Tax Exemption
Machinery and Equipment purchased by new and expanding businesses that use such equipment at a fixed location to manufacture, process, compound, or produce tangible personal property for sale, or for exclusive use in spaceport activities, is tax exempt.
Florida Urban Job Tax Credit Program
The Urban Job Tax Credit Program offers an incentive for eligible businesses located within one of Miami-Dade’s 10 designated urban areas to create new regular and full -time jobs (minimum of 20 new jobs for new businesses and minimum of 10 new jobs for existing businesses). The credit ranges from $500 to $1,000 per qualified job and can be taken against either the Florida Corporate Income Tax or the Florida Sales and Use Tax. The credit can only be taken against one of these two taxes.
72
Capital Investment Tax Credit (CITC)
The Capital Investment Tax Credit is used to attract and grow capital-intensive industries in Florida. It is an annual credit, provided for up to twenty years, against the corporate income tax. Eligible projects are those in designated high-impact portions of the following sectors: clean energy, biomedical technology, financial services, information technology, silicon technology, transportation equipment manufacturing, or be a corporate headquarters facility. Projects must also create a minimum of 100 jobs and invest at least $25 million in eligible capital costs. Eligible capital costs include all expenses incurred in the acquisition, construction, installation, and equipping of a project from the beginning of construction to the commencement of operations. The level of investment and th e project's Florida corporate income tax liability for the 20 years following commencement of operations determines the amount of the annual credit.
High Impact Performance Incentive Grant (HIPI)
The High Impact Performance Incentive is a negotiated grant used to attract and grow major high impact facilities in Florida. Grants are provided to pre-approved applicants in certain high-impact sectors designated by the Florida Department of Economic Opportunity (DEO). In order to participate in the program, the project must: operate within designated high- impact portions of the following sectors clean energy, corporate headquarters, financial services, life sciences, semiconductors, and transportation equipment manufacturing; create at least 50 new full-time equivalent jobs (if a R&D facility, create at least 25 new full-time equivalent jobs) in Florida in a three-year period; and make a cumulative investment in the state of at least $50 million (if a R&D facility, make a cumulative investment of at least $25 million) in a three-year period. Once recommended by Enterprise Florida, Inc. (EFI) and approved by DEO, the high impact business is awarded 50 percent of the eligible grant upon commencement of operations and the balance of the awarded grant once full employment and capital investment goals are met.
Quick Response Training Program (QRT)
An employer-driven training program designed to assist new value-added businesses and provide existing Florida businesses the necessary training for expansion. A state educational facilitycommunity college, area technical center, school district or university - is available to assist with application and program development or delivery. The educational facility will also serve as fiscal agent for the project. The company may use in-house training, outside vendor training programs or the local educational entity to provide training. Reimbursable training expenses include: instructors'/trainers' wages, curriculum development, and textbooks/manuals. This program is customized, flexible, and responsive to individual company needs.
Incumbent Worker Training Program (IWT)
The Incumbent Worker Training program provides employers with funds to train currently employed workers in an effort to keep their firms and workers competitive. The program addresses retraining to meet changing skill requirements caused by new technology, retooling, new product lines, and new organizational structuring. The Program provides training to currently employed workers to keep
73
Florida's workforce competitive in a global economy and to retain existing businesses. The program is available to all Florida businesses that have been in operation for at least one year prior to application and require skills upgrade training for existing employees. Priority is given to businesses in targeted industries, Enterprise Zones, HUB Zones, Inner City Distressed areas, Rural Counties and areas, and Brownfield areas.
Economic Development Transportation Fund
The Economic Development Transportation Fund, commonly referred to as the "Road Fund," is an incentive tool designed to alleviate transportation problems that adversely impact a specific company's location or expansion decision. The award amount is based on the number of new and retained jobs and the eligible transportation project costs, up to $3 million. The award is made to the local government on behalf of a specific business for public transportation improvements.
Local Government Distressed Area Matching Grant Program (LDMG)
The Local Government Distressed Area Matching Grant Program stimulates investment in Florida's economy by assisting Local Governments in attracting and retaining targeted businesses. Applications are accepted from local governments/municipalities that plan on offering financial assistance to a specific business in the area. These targeted businesses are required to create at least 15 full-time jobs and the project must either be new to Florida; expanding operations in Florida; or leaving Florida unless it receives local and state government assistance. The amount awarded by the State of Florida will equal $50,000 or 50 percent of the local government's assistance amount, whichever is less, and be provided following the commitment and payment of that assistance.
State of Florida Brownfield Program
A brownfield site means real property, the expansion, redevelopment, or reuse of which may be complicated by actual or perceived environmental contamination. Florida’s brownfield program offers businesses and developers a flexible set of regulatory and fi nancial incentives to clean up and redevelop a brownfield site within a locally designated brownfield zone, including:
n Brownfield Redevelopment Bonus Refund: A $2,500 tax refund is available for each new job created by an eligible business.
n Voluntary Clean Up Tax Credits (VCTC): Projects that execute a Brownfield Site Remediation Agreement (BSRA) with the Florida Department of Environmental Protection are eligible for a 50 percent tax credit for cleanup costs. The tax credit is applicable to Florida’s corporate income tax. An additional 25 percent tax credit is available if the property is redeveloped with affordable housing.
n Sales Tax Credit on Building Materials available for construction of housing or mixed-use projects.
n Loan Guarantee Program: Up to 5 years of state loan guarantees on 50 percent of the primary lender loan. If the project is for affordable housing, the loan guaranty applies to 75 percent of the lender loan.
74
n Cleanup Liability Protection for projects that have an executed Brownfield Site Remediation Agreement with the Florida Department of Environmental Protection.
Energy Efficiency: Florida Power and Light (FPL) Business Programs
n Free Business Energy Evaluations provide comprehensive analysis of facility energy use and recommendations for cost-effective energy efficiency improvements. Evaluations are available both online and on-site.
n Building Envelope rebates include window treatments (up to $1 per sf), ceiling insulation (up to $0.15 per sf) and reflective roof measures. Projects must be approved in advance in order to qualify for incentives.
n FPL's Interior Building programs provide incentives for efficient lighting (e.g., rebates of 65 cents to $4 for each linear fluorescent lamp), a variety of HVAC and chiller equipment, thermal energy storage, refrigeration and water heating equipment. Installations must be approved in advance.
n The Energy Innovation is a custom incentive program that rewards innovations that trim at least 25 kW from summer peak demand (April - October between 3 and 6 P.M.). To qualify for an incentive under this program, the project must differ from other FPL rebate programs (see above) and be approved by FPL in advance.
n The Services for Government program offers turn-key services including identification of energy-saving opportunities, carbon footprint calculation, project management, performance contracts and assistance obtaining financing for energy efficiency projects.
Miami - Dade Building Better Communities (BBC)
The Building Better Communities Bond Program is the largest capital construction bond program in Miami-Dade County history. Bond financing for projects can be used for site and infrastructure improvements.
Quality Neighborhood Improvement Program
The Quality Neighborhoods Improvements Program (QNIP) funds capital infrastructure projects in unincorporated Miami Dade County. Since 1999, the County has issued Florida Public Service Tax Revenue Bonds Unincorporated Municipal Service Area (UMSA Public Improvements), for what has become known as QNIP projects in each of the County's 13 Board of County Commission districts. Projects include new or repaired sidewalk installation, drainage improvements, roadway resurfacing and park facility improvements.
Miami - Dade County Mom and Pop Small Business Grant Program
Grants for start-up and operating assistance for small businesses administered through Miami-Dade County.
75
76
