Draft Palm Beach and Martin Counties


Affordable Rental Housing Needs Assessment and Investment Strategy


The Metropolitan Center at Florida International University:
The Metropolitan Center at Florida International University (FIU) delivers information and expertise to decision makers, community leaders and citizens as they seek to forge solutions to urban problems. The Center is engaged in the study of housing, demographics, economics and politics in South Florida. The overall goal of the Center, as an "applied research" institute, is to provide decision-makers with the best possible information to forge solutions to the problems confronting South Florida’s urban areas. Toward that goal, the Center provides research, training, and technical assistance to governmental and nonprofit institutions in South Florida.
Metropolitan Center
1101 Brickell Avenue, Suite S-200
Miami, FL 33131
Tel: 305-779-7879
Fax: 305-779-7880
Email: murrayn@fiu.edu
FIU Metropolitan Center Study Team:
Ned Murray, Ph.D., AICP, Principal Investigator
Lina Duran, Project Manager
Ebony Johnson, Research Assistant
Julia Webb, Research Assistant
Community Foundation for Palm Beach and Martin Counties Board of Directors
Board Officers
Deborah Dale Pucillo, Chair, Retired Palm Beach County Judge
Sally Gingras, Vice-Chair, Registered Architect, Member American Institute of Architects
Douglas Stockham, Vice-Chair, Asset Specialists, Inc.
Royal Victor, III, Vice-Chair, Private Investor
Steven A. Templeton, CPA, CVA, Treasurer, Founder and CEO, Templeton & Company
J.B. Murray, Secretary, Managing Partner, Squire Sanders & Dempsey, LLP
William M. Matthews, Immediate Past President, Private Investor
Anson Beard, Advisory Director, Morgan Stanley & Co. Inc.
Pedro del Sol, Community Volunteer
George T. Elmore, President/Owner Hardrives, Inc.
Kathleen B. Emmett, CFRE, Great Expectations Campaign Director for Palm Beach Day Academy
Katherine P. Goldsmith, Community Volunteer
Paulette Koch, Senior Vice President, The Corcoran Group Palm Beach
The Honorable Kathleen J. Kroll, 15th Judicial Circuit of Florida
Andrew Kushner, Assistant Treasurer at NextEra Energy, Inc.
Peter Matwiczyk, Partner, law firm of Matwiczyk & Brown, LLP
Lawrence J. Miller, Partner, law firm of Miller & O’Neill, PL
Lisa Newcomer Mulhall, President, In Rem Solutions, Inc.
David G. Ober, Chairman, Sotheby’s Southeast, Managing Director Sotheby’s, Inc.
James F. Orr, III, Chairman of the Board of Trustees, Rockefeller Foundation
Virginia Smith, Retired Educator
Roy Zuckerberg, Chairman, Samson Capital Advisors
The Palm Beach and Martin Counties Affordable Rental Housing Needs Assessment and Investment Strategy was prepared by the Metropolitan Center at Florida International University (FIU) on behalf of the Community Foundation for Palm Beach and Martin Counties. The study provides an update to the 2007 Rental Housing Study and includes recommended rental housing investment strategies based on current housing supply and demand conditions.
The previous 2007 Rental Housing Study of Palm Beach and Martin Counties was prepared toward the end of South Florida’s “housing bubble.” The study revealed the impact of the explosive three-year residential boom from 2003-2005 which resulted in rapid housing appreciation, a severe shortage of affordable housing and extreme affordability gaps for all housing types. Palm Beach and Martin Counties’ affordable housing supply mismatch was exacerbated by speculative investment that resulted in the conversion of 16,000 rental units to condominiums and an overall development trend toward more upscale housing demand external to the local market.
The current study determined that current housing market conditions in Palm Beach and Martin Counties are far more complex than what existed during the height of the residential boom period. The current assessment of affordable housing factors and conditions found that increasing levels of affordability for existing single-family and condominiums brought on by the collapse of the housing “bubble” has not improved overall housing affordability for existing owners and renters alike. This is due to a number of contributing factors including prolonged unemployment, foreclosure activity and rising rent prices.
Economic conditions have pushed up the number and share of renter households and this trend is expected to increase in the coming years. Rental markets are tightening throughout the two counties and with little new supply of multi-family units in the pipeline rents could continue to rise as demand increases. While the foreclosure crisis had its greatest impact on homeowners, it has also displaced a significant number of renters. According to statistics from the National Low Income Housing Coalition, about half of renters live in the types of properties that are at the center of the crisis, including single-family homes, condominiums and buildings with 2–4 units. The Coalition’s study estimated that, as of 2009, renters may have accounted for some 40 percent of households that faced eviction because of foreclosure activity.
The study found the availability and accessibility of affordable rental housing vital to Palm Beach and Martin Counties’ average working family and household employed in service sector occupations. However, current and projected housing and economic market conditions indicate a serious shortfall of affordable rental housing in both counties.
The current affordable rental housing need assessment and investment strategy for Palm Beach and Martin Counties assessed a range of housing market factors and conditions that impact the supply and demand of affordable rental housing in Palm Beach and Martin Counties. The following highlights the key findings of the study:
Renter-occupied housing units in Palm Beach and Martin Counties increased by 10.9 and 6.9 percent, respectively, from 2006-2010;
The increase in renter-occupied units is attributed to the loss of homeownership, displacement of existing renters and concomitant increase in demand for rental housing;
Multi-family rental structures of 5-19 units (54,103 units/38 percent) comprise the largest share of Palm Beach County’s rental housing inventory.
New rental housing starts, completions and occupancies have plummeted since 2006;
In Palm Beach County, the average monthly lease for a two bedroom apartment increased from $757 in 2000 to $1,292 in 2011, an increase of 71 percent;
Approximately 60 percent of Palm Beach County’s and over 65 percent of Martin County’s renter households earn less than 50 percent of the area median income (AMI);
Approximately 90 percent of renter households in both counties earning less than $35,000 and 62 percent of renters earning between $35,000 and $49,999 are cost-burdened;
Affordability analysis shows growing and substantial affordability gaps in all household income categories below 100 percent of AMI;
Multi-family complexes (100+ units) in Palm Beach and Martin Counties show across the board year-to-year increases in both average occupancies (95 percent) and average rents ($1,132);
There will be an estimated annual demand for an additional 5,216 rental apartments in Palm Beach County during 2011-2015;
The Palm Beach and Martin Counties Affordable Rental Housing Needs Assessment and Investment Strategy was prepared by the Metropolitan Center at Florida International University (FIU) on behalf of the Community Foundation for Palm Beach and Martin Counties. The study provides a closer analysis of the renter housing market in two relatively different counties with respect to population, density and development philosophies. Despite these obvious differences, their spatial relationship co-joins the two counties in terms of shared economies and residential markets.
The following rental housing analysis of Palm Beach and Martin Counties is intended to provide a clear understanding of the rental supply and demand factors and conditions that impact the two counties. With this understanding the study then recommends rental housing investment strategies to help preserve existing affordable rental housing units in the two counties.
The methodology used by the FIU Metropolitan Center in the research and preparation of the Rental Housing Study for Palm Beach and Martin Counties was to assess current rental supply and demand factors and conditions to determine the level to which the local rental market is providing adequate choices and opportunities for households in need of rental housing. The housing demand and supply assessment examines the existing and future rental housing needs of Palm Beach and Martin Counties with respect to household income, affordability and location of the existing inventory
The study includes the following tasks:
Population Trend Analysis: This section provides an assessment of population changes with an emphasis on recent shifts due to economic and housing conditions.
Rental Housing Supply and Demand Impact Analysis: An assessment of the key rental housing supply and demand factors and conditions that impact the availability of affordable rental housing in the two counties. Includes,
√ Housing Supply Analysis: This section provides an update of Palm Beach and Martin Counties’ housing inventory/supply based on housing type, tenure, development activity and values by major municipality;
√ Housing Demand Analysis: This section provides an update of Palm Beach and Martin Counties’ current housing demand (need) based on an economic base analysis of the County and its impact on owner and renter households;
Identification of Barriers to Affordable Rental Housing: An assessment of existing policies, regulations and programs and their impact on the availability of an adequate supply of affordable rental housing in the two counties.
Affordable Rental Housing Investment Strategies: Based on the above assessments, specific rental housing investment strategies are proposed with supporting project pro forma.
A basic premise of all housing markets is that there must exist a spectrum of housing choice and opportunity for local residents. This axiom establishes that housing choice and needs differ in most communities due to a variety of factors, including: household income, population age, proximity of employment and mere preference. A spectrum of rental housing choice and opportunity is particularly important as rental housing can accommodate an assortment of individual and household needs. First and foremost, an adequate supply of affordable rental housing provides choice and opportunity to working individuals and families with more modest incomes. Affordable rental housing allows independent household formation without the need to accumulate or deploy a lot of capital. In fact, affordable rental housing serves many family and household types, including:
People of all income levels that prefer to rent due to its lower cost, greater flexibility, and reduced maintenance obligations
Young people establishing new households
People of all income levels in urban centers
Seniors of many income levels, some who are leaving homeownership
A mobile work force, both urban and rural
Households recovering from job loss, foreclosure or other dislocation
Low-income or poor credit households that cannot access homeownership
The need for an adequate supply of affordable rental housing is vital to the economies of Palm Beach and Martin Counties. However, economic conditions in South Florida have pushed up the number and share of renter households and this trend is expected to increase in the coming years. Rental markets are tightening throughout the two counties, and with little new supply of multi-family units in the pipeline, rents could continue to rise as demand increases. While the foreclosure crisis had its greatest impact on homeowners, it has also displaced a significant number of renters. According to statistics from the National Low Income Housing Coalition, about half of renters live in the types of properties that are at the center of the crisis, including single-family homes, condominiums and buildings with 2–4 units. The Coalition’s study estimated that, as of 2009, renters may have accounted for some 40 percent of households that faced eviction because of foreclosure activity.
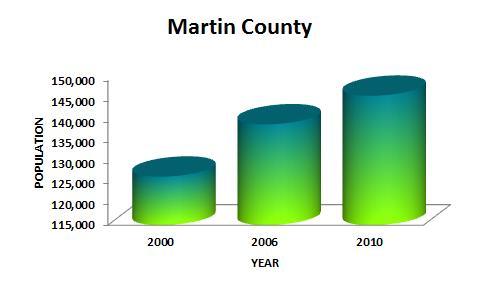
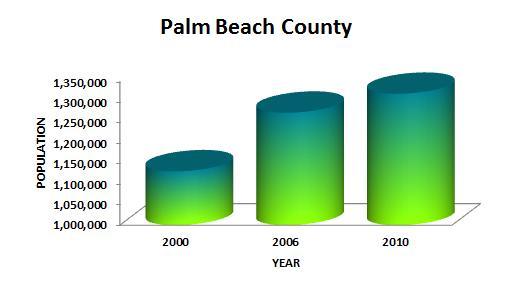
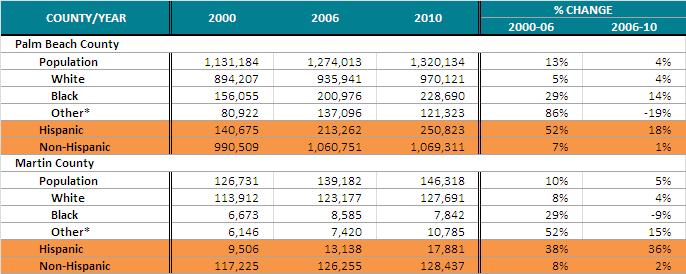
This section provides an assessment of population changes with an emphasis on recent shifts due to economic and housing conditions. Both Palm Beach and Martin Counties experienced double digit population growth rates from 2000-2006. However, economic conditions have contributed to a slowdown in both counties’ population growth rates from 2006-2010 (Table 2.1).
The largest population increases in both counties since 2006 resulted from significant increases in the Hispanic population. Palm Beach County’s Hispanic population grew by 18 percent (37,561 persons), while Martin County’s Hispanic population grew by 36 percent (4,743 persons). Palm Beach County’s Black population also had a significant increase of 14 percent (27,714 persons) since 2006 (Table 2.2).
** Includes: American Indian/Alaska Native, Asian, Native Hawaiian/Pacific Islander, Some Other Race and Two or More Races
Source: U.S. Census 2000 General Population & Housing Characteristics SF 1 (DP-1), U.S. ACS 2006 Demographic & Housing 1 Year Estimate (DP05), U.S. Census 2010 Demographic Profile (DP-1)
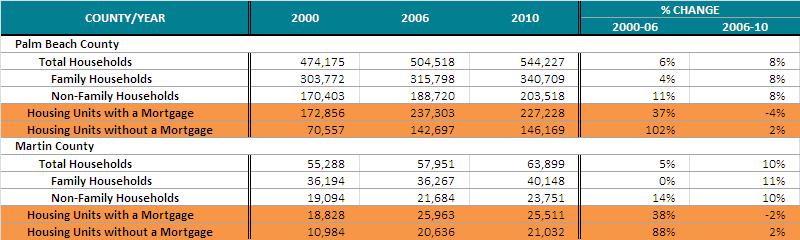
Both Palm Beach and Martin Counties experienced household growth rates of 8 and 10 percent respectively since 2006 which is significantly higher than each county’s household growth rates from 2000-2006. Non-family households increased in both counties since 2006, although at a slower pace than from 2000 to 2006. Both counties experienced a slight loss in housing units “with a mortgage” since 2006 after significant increases from 2000-2006 (Table 2.3).
Source: U.S Census 2000 General Population & Housing Characteristics SF 1 (DP-1), U.S. Census 2000 Profile of Selected Housing SF 4 (DP-4), U.S. ACS 2007 Demographic & Housing 1 Year Estimate (DP05), U.S. ACS 2006 Selected Housing Characteristics 1 Year Estimate (DP04), U.S. ACS 2007 Selected Social Characteristics 1 Year Estimate (DP02), U.S. Census 2010 Demographic Profile (DP-1), U.S. ACS 2010 Selected Housing Characteristics 1 Year Estimate (DP04)
Housing supply factors include the total number of units by type, price range, tenure and absorption. Housing supply analysis must also consider development trends and projections based on planned development activity. As previously noted, Palm Beach and Martin Counties have endured the repercussions of the collapse of the housing bubble and subsequent “Great Recession.” These economic conditions have significantly impacted the supply of affordable rental housing by increasing the share and number of renter households in both counties.
The first step in defining a rental housing inventory is to establish an overall housing inventory that differentiates owner and renter housing by total units, structure type, occupancy, age and condition.
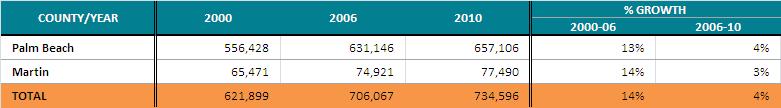
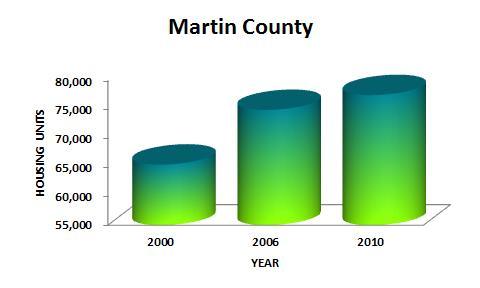
According to 2010 Decennial Census estimates, there are 734,596 housing units in Palm Beach and Martin Counties with nearly 90 percent of the units located in Palm Beach. Both counties experienced double digit growth rates from 2000-2006 followed by more modest 3-4 percent growth rates from 2006-2010.
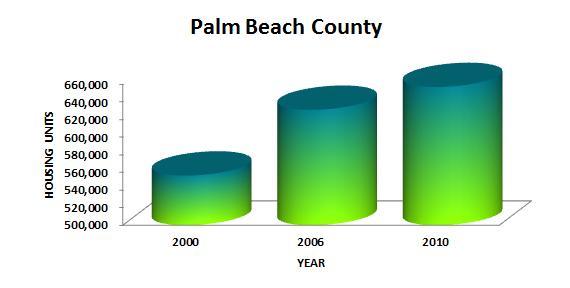
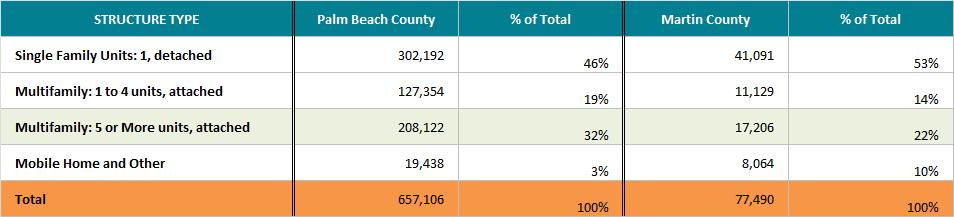
The majority of housing structures in Palm Beach and Martin Counties are single-family homes. However, both counties experienced significant losses in single-family home inventories from 20062010, but significant gains in multi-family units during this time period. According to 2010 Decennial Census estimates, there are currently 302,192 single-family detached homes (12 percent decrease) in Palm Beach County compared to 335,476 multi-family units (25 percent growth). Mobile homes comprise 19,438 units (2 percent loss) in Palm Beach County. There are currently 41,091 single family homes in Martin County (9 percent decrease) compared to 28,335 multi-family units (38 percent increase). Mobile homes comprise 8,064 units (15 percent decrease) in Martin County.
Source: U.S Census 2000 Summary File 3 (H030) – ACS 2006 and 2010 Units in Structure (B25024), (B25024)
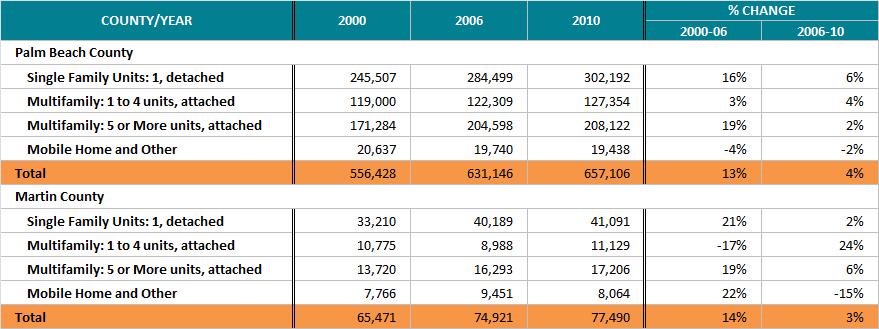
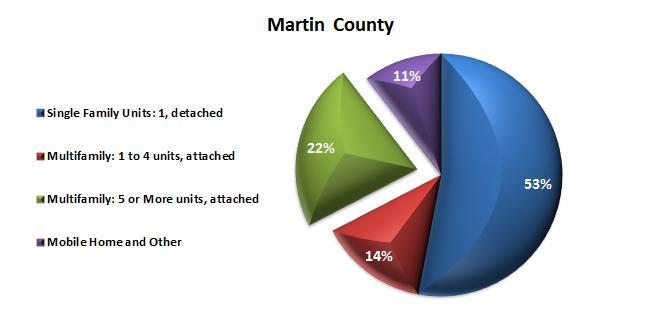
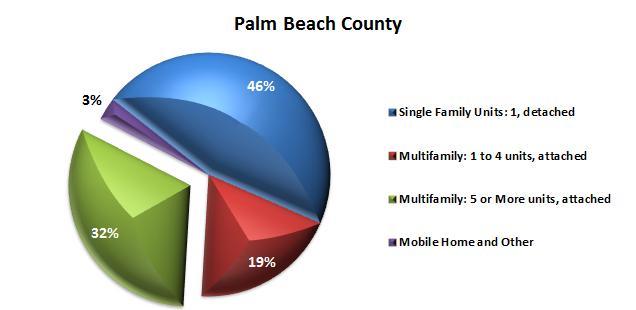
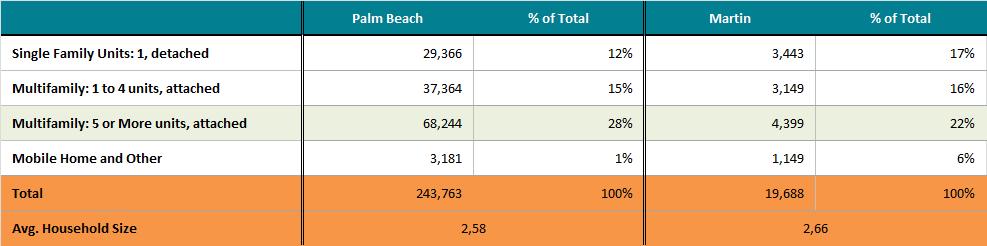
An analysis of housing units by structure type indicates that single-family detached structures comprise the single largest unit/structure type in both counties. Single-family detached structures comprise 46 percent (302,192 units) in Palm Beach County and 53 percent (41,091 units) in Martin County. Multi-family structures (1-unit, attached and above) comprise 32 percent (335,476 units) of the total inventory in Palm Beach County and 22 percent (28,335 units) in Martin County.
Source: U.S. ACS 2010 Units in Structure (B25024), 5Year Estimates
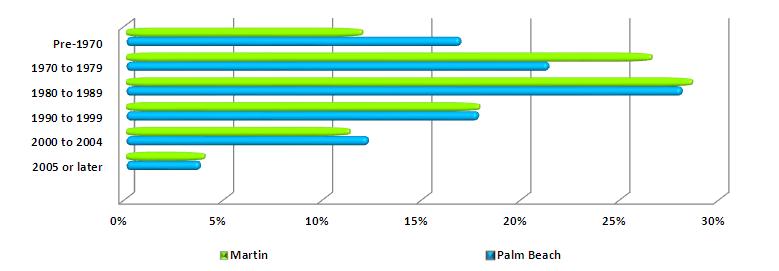
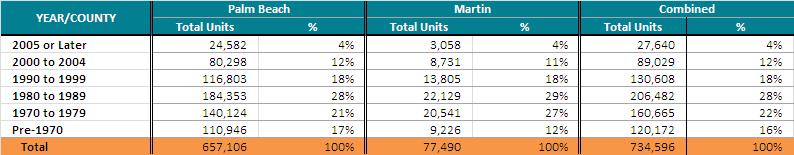
The housing supply in Palm Beach and Martin Counties is very similar in terms of age. The vast majority of units (over 80 percent) were built after 1970. While the overall age of the housing stock in both counties is relatively new, the fact that over 120,172 units are now approaching over 50 years of age raises housing preservation issues. The older housing stock, particularly older rental housing units, often has code and deferred maintenance issues that can impact the longevity of the housing structure.
Source: U.S. ACS, 2006-2010, Selected Housing Characteristics (DP04), 5 Year Estimates
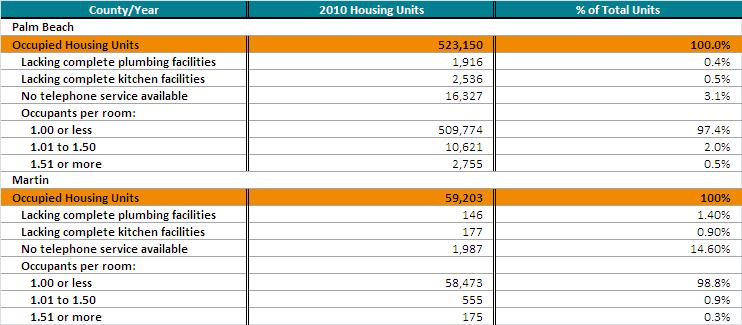
The U.S. Census estimates the total number of substandard units in a geographic area by calculating both owner- and renter-occupied units 1) lacking complete plumbing facilities, 2) lacking complete kitchen facilities, and 3) 1.01 or more persons per room (extent of housing overcrowding). The U.S. Census defines “complete plumbing facilities” to include: (1) hot and cold piped water; (2) a flush toilet; and (3) a bathtub or shower. All three facilities must be located in the housing unit.
According to 2010 ACS 5-Year estimates, 4,452 units/.9 percent of Palm Beach County’s 523,150 occupied housing units are lacking complete plumbing or kitchen facilities. A total of 13,376 units/2.5 percent are classified as overcrowded. In Martin County, 323 units/2.3 percent of the County’s 59,203 occupied housing units are lacking complete plumbing or kitchen facilities. A total of 730 units/1.2 percent are classified as overcrowded.
Source: U.S. ACS, 2006-2010, Selected Housing Characteristics (DP04), 5 Year Estimates
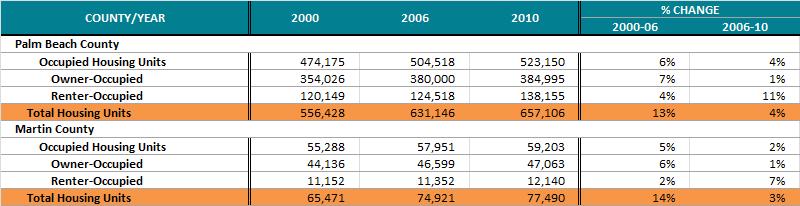
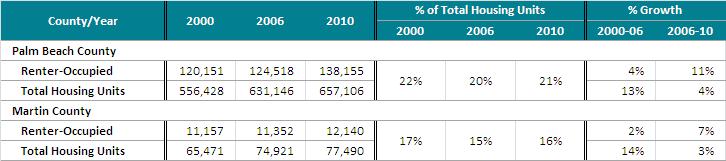
According to 2010 U.S. Decennial Census estimates, owner-occupied units comprise 73 percent of Palm Beach County’s total occupied units and 79 percent of Martin County’s occupied units. Significantly, owner-occupied units increased by only 1 percent in both counties since 2006, while renter-occupied units increased by 11 and 7 percent, respectively (Table 3.6). The average household size of owner-occupied units is 2.40 in Palm Beach County compared to 2.58 for renter-occupied units. Martin County’s average household size of owner-occupied units is 2.32 compared to 2.66 for renteroccupied units.
Source: U.S. ACS, 2006-2010, Selected Housing Characteristics (DP04), 5 Year Estimates
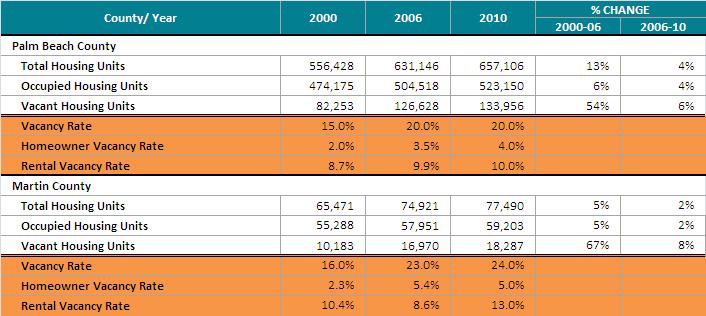
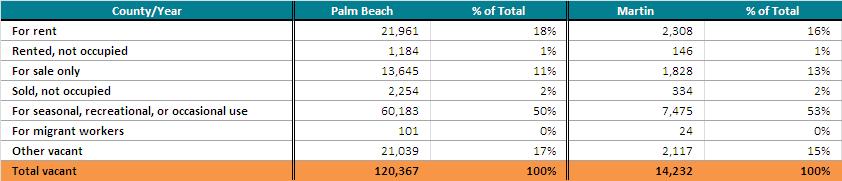
Housing vacancies have continued to increase in both Palm Beach and Martin Counties. Total housing vacancies have increased by 5.7 percent in Palm Beach County and 8 percent in Martin County since 2006. The total number of housing vacancies has steadily increased in both counties since 2000.
Source: U.S. Census 2010 Census Summary File 1, General Housing Characteristics (QT-H1)
The high vacancy rates in Palm Beach and Martin Counties are attributed to the large number of homes intended for “seasonal, recreational, or occasional use.” Significantly, this vacancy type has decreased in recent years in both counties. The recent decreases are attributed to the “selling-off” of “second” homes that have depreciated in value and other factors related to the economic recession
Source: U.S. Census 2010 Census Summary File 1, General Housing Characteristics (QT-H1)
According to the 2010 ACS 5-Year estimates, there are 138,155 renter-occupied units in Palm Beach County which account for approximately 21 percent of all occupied units. Palm Beach County experienced a 10.9 percent increase from 2006 in renter-occupied units. The increase is attributed to the collapse of the housing bubble and subsequent growth in demand for rental housing in the county.
Martin County has a total of 12,140 renter-occupied units which represents nearly a 7 percent increase since 2006. The renter share has increased during this period which is also attributed to the growing increase in renter demand.
Source: U.S. ACS 2006-2010, Tenure by Units in Structure (B25032), 5 Year Estimates
Source: U.S ACS, 2006-2010, Selected Housing Characteristics (DP04), 5 Year Estimates
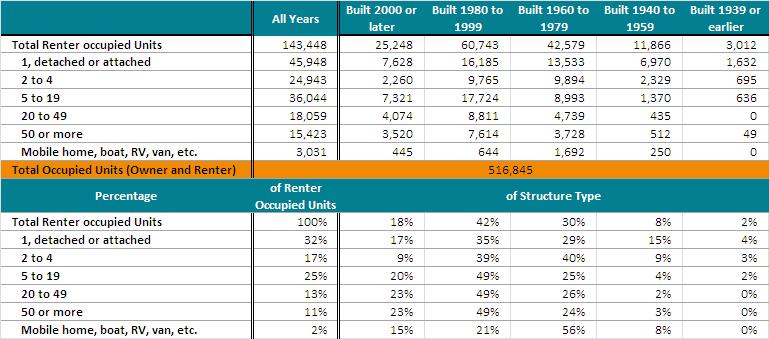
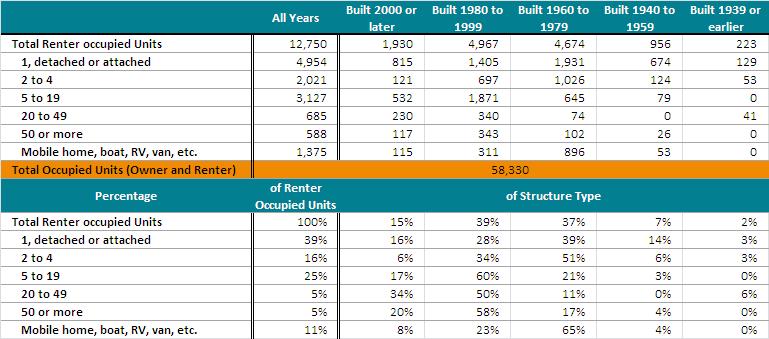
An analysis of renter-occupied units in Palm Beach County by “age and structure type” shows the preponderance of rental units (45,948 units/32 percent) are one unit, detached or attached structures. The majority of these structures (29,718 units/64 percent) were built between 1960 and 1999. Significantly, multi-family rental structures of 5-49 units (54,103 units/38 percent) comprise the largest share of Palm Beach County’s rental housing inventory. Approximately 75 percent of these structures (40,267 units) were built between 1960 and 1999.
Source: U.S ACS, 2008-2010, Tenure by Year Structure Built By Units in Structure, 3 Year Estimates
Source: U.S. ACS, 2008-2010, Tenure by Year Structure Built By Units in Structure, 3 Year Estimates
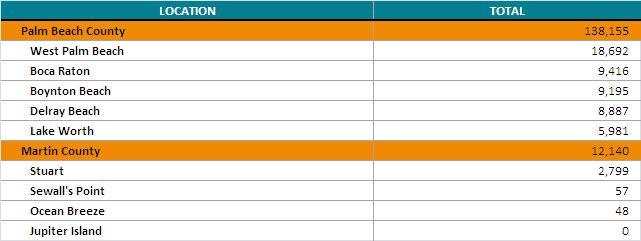
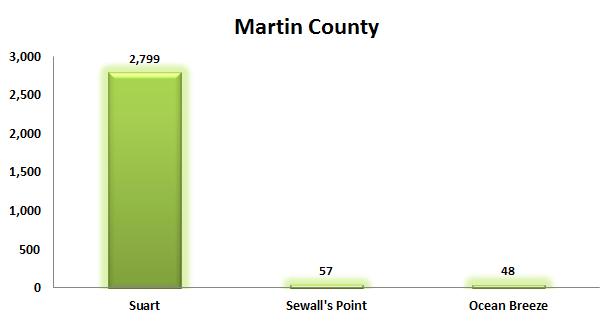
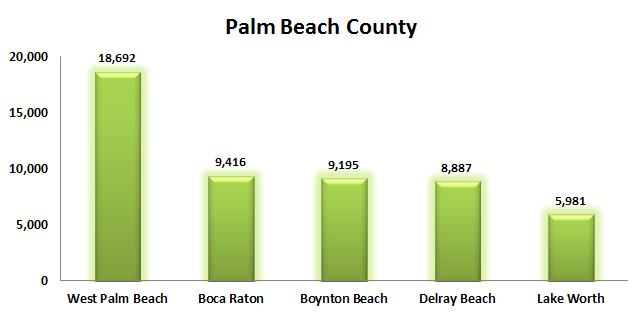
Renter-occupied housing units are dispersed throughout Palm Beach and Martin Counties with the largest totals in the unincorporated areas of each respective county. Concentrations of renteroccupied housing units exist in the major municipalities of each county. West Palm Beach (18,692 units) and Stuart (2,799 units) have the largest totals of renter-occupied units in their respective counties.
Source: U.S. ACS 2006-2010 Tenure by Units in Structure (B25032), 5 Year Estimates
Large (100+ units) multi-family apartment communities (complexes) represent a significant share of the rental housing inventory. Apartment communities typically represent a significant share of the local affordable housing supply and generally provide opportunity and choice regarding bedroom distribution.
There are currently a total of 95 private rental apartment communities with 100+ units in Palm Beach County totaling 27,699 units. In Martin County, there is currently only one private apartment community of 100+ units. Multi-family rental complexes are either managed by outsourced management companies or by the owners of the development. In Palm Beach County, there are 60 multi-family rental properties managed by an outsourced management company and 35 managed by the owner of the development. The single large apartment complex in Martin County is managed by an outside professional management company.
Palm Beach County’s large multi-family rental apartment communities are concentrated in cities where the bulk of the County’s renter housing inventory is currently located, e.g. West Palm Beach (21 communities), Boca Raton (19 communities), Boynton Beach (16 communities) and Delray Beach
(13 communities). The current analysis of multi-family complexes shows nearly across the board year-to year increases in both average occupancies and average rents.
Source: Real Facts, 1st Quarter 2012 Data
The 95 multi-family rental communities in Palm Beach County are largely comprised of 2bedroom/2-bath (11,954 units) and 1-bedroom/1-bath (9,313 units) apartments (Table 3.15). The average square foot is 1,044 and the average monthly rent $1,132 or $1.08 per square foot. The average monthly rent for a 2-bedroom/2-bath unit is $1,196. The average occupancy rate for all multi-family rental communities is 94.5 percent compared to 91.3 in 2007.
Source: Real Facts, 1st Quarter 2012 Data
The single large, multi-family rental community in Martin County consists of 123 rental units. The bedroom distribution consists of 57 1-bedroom/1-bath units; 37 2-bedroom/2-bath units; and 33 3bedroom/2-bath units. The rents range from $835 for the 1-bedroom units to $1,308 for the 3bedroom units. The average occupancy rate is 97.6 percent which is comparable to 2007.
Important to the local rental housing inventory are multi-family communities (complexes) that provide rental opportunities to low-income individuals and households. There are 93 multi-family apartment complexes in Palm Beach County and 17 in Martin County comprising approximately 14,000 units subsidized either in part or full by the Florida Housing Finance Corporation. The following is a brief summary of the major assisted housing programs in Palm Beach and Martin Counties:

The Multi-family Mortgage Revenue Bond (MMRB) program uses both taxable and tax-exempt bonds to provide below market-rate loans to non-profit and for-profit developers who set aside a certain percentage of their apartment units for low income families. These bonds are sold through either a competitive or negotiated method of sale or private placement. The program requires that at least 20 percent of the units be set aside for households earning at or below 50 percent of the area median income (AMI). The developer may also opt to set aside 40 percent of the units for households earning at or below 60 percent of the AMI.
The MMRB program gives special consideration to developments that target specific groups or areas such as the Florida Keys, rural development, the elderly, urban infill areas, Front Porch Florida communities, HOPE VI communities, homeless people, and farmworkers or commercial fishing workers. Affordable housing developers are able to use the dollars from this program in conjunction with other Florida Housing programs, such as the Affordable Housing Guarantee
Program, which participates in the U.S. Department of Housing and Urban Development's Multifamily Risk Sharing program, and the State Apartment Incentive Loan Program (SAIL).
The Housing Credit (HC) program provides for-profit and nonprofit organizations with a dollarfor-dollar reduction in federal tax liability in exchange for the acquisition and substantial rehabilitation, substantial rehabilitation, or new construction of low and very low income rental housing units. Eligible development types and corresponding credit rates include: new construction, 9 percent; substantial rehabilitation, 9 percent; acquisition, 4 percent; and federally subsidized, 4 percent. A Housing Credit allocation to a development can be used for 10 consecutive years once the development is placed in service.
Qualifying buildings include garden, high-rise, townhouses, duplexes/quads, single family or mid-rise with an elevator. Ineligible development types include hospitals, sanitariums, nursing homes, retirement homes, trailer parks, and life care facilities. This program can be used in conjunction with the HOME Investment Partnerships program, the State Apartment Incentive Loan program, the Predevelopment Loan program, or the Multifamily Mortgage Revenue Bonds program.
Each development must set aside a minimum percentage of the total units for eligible low or very low income residents for the duration of the compliance period, which is a minimum of 30 years with the option to convert to market rates after the 14th year. At least 20 percent of the housing units must be set aside for households earning 50 percent or less of the area median income (AMI) or 40 percent of the units must be set aside for households earning 60 percent or less of the AMI. Additionally, housing credits are sometimes reserved for affordable housing that addresses specific geographic or demographic needs, including the elderly, farmworkers and commercial fishing workers, urban infill, the Florida Keys Area, Front Porch Florida communities, or developments funded through the U.S. Department of Agriculture Rural Development.
The State Apartment Incentive Loan program (SAIL) provides low-interest loans on a competitive basis to affordable housing developers each year. This money often serves to bridge the gap between the development's primary financing and the total cost of the development. SAIL dollars are available to individuals, public entities, not-for-profit or forprofit organizations that propose the construction or substantial rehabilitation of multifamily units affordable to very low income individuals and families. A minimum of 20 percent of the development's units must be set aside for families earning 50 percent or less of the area median income. Developments that use housing credits in
Table
conjunction with this program may use a minimum set-aside of 40 percent of the units for residents earning 60 percent of the area median income. Developments in the Florida Keys Area may use a minimum set-aside of 100 percent of the units for residents with annual household incomes below 120 percent of the state or local median income, whichever is higher.
Tables 3.17 and 3.18 below depict the total properties and units assisted in Palm Beach and Martin Counties and the delineation by funding program.
The Assisted Housing Inventory - General (AHI-General) is a database of multifamily rental developments in the state of Florida that receive assistance under federal, state, and local government funding programs to offer affordable housing units
Source: U.S. Department of Agriculture Rural Development (RD), the U.S. Department of Housing and Urban Development (HUD), Florida Housing Finance Corporation (FHFC), and Local Housing Finance Authorities (LHFAs) in Florida
Notes: These are duplicated counts. Properties and units may appear in more than one row if they are funded under multiple programs, such as in a development with FHFC 9% Tax Credits and a HUD Rental Assistance contract. Programs that don't impose income or rent restrictions are only reported if combined with HUD Rental Assistance or other assisted programs. For example, if a county houses properties insured under the HUD Section 221(d)(4) program, the count in this table only includes those properties that also have HUD Rental Assistance.
Source: U.S. Department of Agriculture Rural Development (RD), the U.S. Department of Housing and Urban Development (HUD), Florida Housing Finance Corporation (FHFC), and Local Housing Finance Authorities (LHFAs) in Florida
*"Link Initiative" refers to units set aside for extremely low income households, at least half of which are special needs households (homeless families, survivors of domestic violence, persons with a disability, or youth aging out of foster care).These are duplicated counts. Properties and units may appear in more than one column if they have multiple target populations, such as in a family/farmworker development.
Source: U.S. Department of Agriculture Rural Development (RD), the U.S. Department of Housing and Urban Development (HUD), Florida Housing Finance Corporation (FHFC), and Local Housing Finance Authorities (LHFAs) in Florida
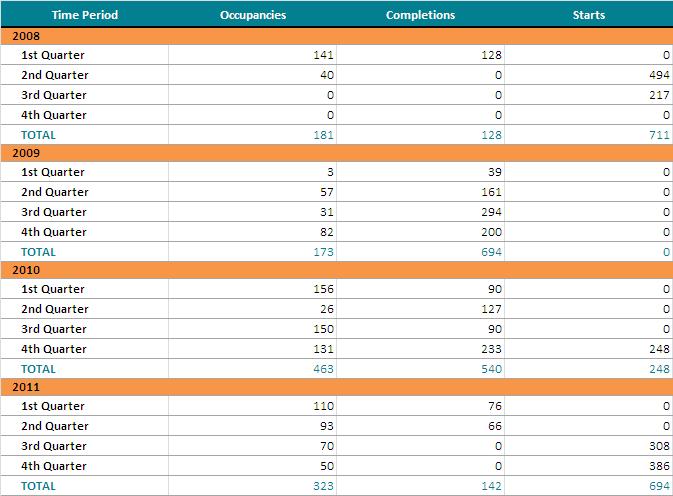
New rental housing development in Palm Beach and Martin Counties has remained sluggish since 2005. During the fourth quarter of 2011 a total of 50 new rental apartment units were absorbed (renter taking possession of a completed new rental unit) in Palm Beach County, while no units were completed and only 386 started. The 323 new units absorbed in the County during 2011 were 30 percent less than the 463 absorbed during 2010. During the six month period ending with December, 2011 an average of only 20 new apartment units were absorbed per month. A total of 694 apartment units were found to be under construction in December, 2011.
According to Reinhold P. Wolf Economic Research, there will be an estimated annual demand for an additional 5,216 rental apartments in Palm Beach County during 2011-2015. Up to six months of supply is considered acceptable to have available without the inventory being excessive. The market could support, therefore, up to 2,608 new units in inventory without having an excessive supply.
Over the past year, the vacancy rate for older rental apartment complexes that have been occupied for 18 months or more has declined by 1.0 percent. The vacancy rate decreased from 6 percent in November, 2011 to 5 percent in February, 2012. The highest vacancy rate was found in the Central and West Boca Raton areas and Central West Palm Beach. East Boca Raton had the lowest vacancy rates.
Based on the survey data from Reinhold Research, the overall average monthly rent for Palm Beach County is 4.6 percent higher than it was one year earlier. In the past quarter, rent for a one-bedroom has increased by $29 and rent for a two-bedroom has increased by $52. These rents are averaged from projects that include some small and older complexes and may not be representative of newer rental developments.
Reinhold also surveyed 29 lower income affordable tax credit developments in Palm Beach County. There were a total of 6,448 units with an average rent of $855. As of February 2012, there was a vacancy rate of 6.9 percent in these developments which was down from 7.8 percent in November
2011. Compared to the market rate developments, the average rent is 30.3 percent less and the vacancy rate is 1.9 percent higher in the lower income developments.
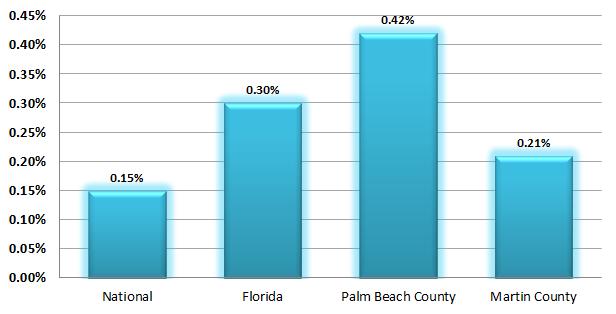
South Florida, including Palm Beach and Martin Counties, experienced high foreclosure rates in the years following the collapse of the housing bubble. During the height of foreclosure activity in 2008 the Palm Beach MSA was ranked 18th among the “top 20” metropolitan areas in the country. Both Palm Beach and Martin Counties’ foreclosure rates have decreased in the past year to 1 per 462 and 1 per 610 housing units, respectively. However, Palm Beach County’s foreclosure rate remains significantly higher than both the State of Florida and the country as a whole.
The rise in home foreclosures was the result of several factors, including the proliferation of the subprime lending market during the height of the building boom, speculative investment and predatory lending practices. The home foreclosure crisis exacerbated an already volatile market in
South Florida brought on by an oversupply of price-inflated housing. While no county or municipality in South Florida was spared from the rampant increase in home foreclosures, there were discernible spatial concentrations of foreclosure activity. In all three counties, the level of foreclosure activity was generally highest in zip codes that experienced significant levels of new housing construction during the South Florida building boom. In Palm Beach County, the highest levels of foreclosure activity occurred in Royal Palm Beach, Wellington, Greenacres and the unincorporated areas west of I95. High levels of foreclosure activity also overlapped areas of Palm Beach County impacted by condominium conversions during the 2003-2006 housing bubble years. These areas included West Palm Beach (5,542 units), Boynton Beach (2,056 units), Boca Raton (1,617 units), Palm Beach Gardens (1,354 units) and Delray Beach (1,100 units). Martin County lost 662 rental units from condominium conversions during this period
Table 3.21: Foreclosure Rate Comparisons
Source: RealtyTrac, May, 2012
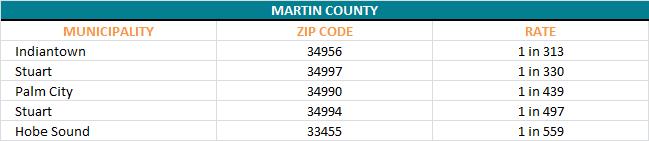
Table3.22: Highest Foreclosures Rates by Sub-Geography, Palm Beach and Martin Counties, 2012
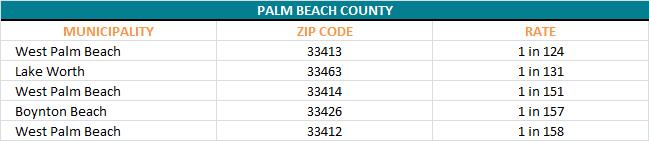
Source: RealtyTrac, May, 2012
Source: RealtyTrac, May, 2012
In 2008, Palm Beach County submitted their Neighborhood Stabilization Areas (NSP) -1 Application to the Department of Housing and Urban Development (HUD). As part of the application, the county was required to identify contiguous, sub-geographical areas with the highest percentages of home foreclosures. The highest levels of foreclosures were found in the following areas:
The Village of Wellington, Loxahatchee Groves and surrounding unincorporated Palm Beach County (14.26%);
Unincorporated Palm Beach County located S of 45th Street, E of Turnpike, W of I-95, and N of Lake Worth Road (12.34%);
Royal Palm Beach and the Acreage (9.47%);
Unincorporated Palm Beach County - S of Clint Moore Rd., E of Loxahatchee National Wildlife Refuge, W of I-95, and N of Broward County line (9.24%);
The City of Greenacres and the surrounding unincorporated areas (7.28%);
Unincorporated Palm Beach County - S of Boynton Beach Blvd, E of Loxahatchee National Wildlife Refuge, W of Military Trail, and N of Clint Moore Rd.(4.72%);
Unincorporated Palm Beach County (including Golf) – S of Gateway Blvd., E of Loxahatchee National Wildlife Refuge, W of Congress Ave., and N of Atlantic Ave. (4.48%);
Jupiter/Tequesta/Unincorporated Palm Beach County (4.29%); and Lake Worth (4.11%)
The following table updates to 2012 the county’s foreclosure information provided in the 2008 NSP-1 Application. The current information shows a general decrease in home foreclosures, as noted above, from 11,997 housing units in 2008 to 8,052 housing units in 2012. At the zip code level, new foreclosure data shows a significant decrease in the percentage of foreclosures in the Wellington/Loxahatchee/Unincorporated Palm Beach County area with significant increases in other unincorporated areas including Westgate and the western areas of the county south of Clint Moore Road and Boynton Beach Boulevard.
Source: Palm Beach County NSP-1 Application, 2008; RealtyTrac 2008, 2012.
As part of the HUD NSP-3 Application, Palm Beach County identified seven “Areas of Greatest Need” after analyzing pertinent data for all census tracts countywide. The seven target areas included:
Table
Source: Palm Beach County NSP-3 Application, 2010
The County’s NSP-3 Application notes that the predominant housing unit type in Target Areas B, D, and G is single-family, while a majority of housing units in Target Areas A, C, E, and F are multi-family. A further extrapolation of the seven target areas shows a significant variation among the areas in terms of household income and foreclosure status. Households in the Glades Region, Coleman Park/Pleasant City Area and the Westgate/Belvedere Area predominantly have incomes of less than 80 percent of the area median income (AMI). These are also the areas with the highest percentages of households that were either delinquent on their mortgages or in foreclosure proceedings.
Table
Source: Palm Beach County NSP-3 Application, 2010
Housing demand is largely driven by several key factor conditions – local employment patterns, shifts in population and household growth, and household income. Employment is the principal driver of population and household growth. Conversely, economic decline and associated job loss has the opposite effect, typically resulting in decreases in population, households and household income with a profound effect on residential markets. As previously noted, rental housing demand in Palm Beach and Martin Counties has been impacted by the collapse of the housing bubble and subsequent Great Recession. Access to traditional lending instruments and credit has been severely diminished for foreclosed homeowners and most working families with homebuyer aspirations. The combination of these economic and financial conditions has significantly increased renter housing demand throughout the two counties.
The economic base of Palm Beach and Martin Counties is largely supported by the non-durable service-providing industries. These industries currently comprise over 90 percent of each County’s employment base. The majority of these jobs are directly related to South Florida’s tourism industry. However, employment growth in professional and business services, education and health services and retail trade is directly related to the population growth during the past decade. The diversity of the employment base has significant implications with respect to rental housing demand.
South Florida’s prolonged housing downturn has significantly impacted the economy of Palm Beach and Martin Counties. Both counties experienced significant job loss through 2010 that was across the board in all leading industrial sectors, including construction, retail trade and financial activities. Palm Beach County’s employment base has shown modest growth in 2012, while Martin County has continued to experience overall job loss. According to employment figures released by the Florida Department of Economic Opportunity (DEO), Palm Beach County’s total employment grew by 2,500 jobs from February, 2011-February, 2012. Martin County’s total employment decreased by 2,100 jobs during this time period.
* Data reported as Port St. Lucie MSA which includes St. Lucie and Martin Counties
Source: Florida Department of Economic Opportunity, Labor Market Information, Current Employment Statistics, Nonagricultural Employment by Industry
The salaries and wages of Palm Beach and Martin Counties’ workers ultimately determines household income and subsequently, levels of housing choice and opportunity. The decrease in the average annual wage in 2010 dollars since the onset of the Great Recession has reduced household income in both counties, thereby restricting housing choice and opportunity. Annual average wages in several industry sectors, including professional and business services, financial activities and manufacturing, provide the necessary household income to expand housing choices to an array of homeownership and rental options. However, the vast preponderance of workers in both counties earn salaries and wages in service sector employment, including retail trade, leisure and hospitality and educational and health services. The household incomes of these service sector workers limit housing choices to affordable rental housing opportunities, where accessible.
As previously stated, renter housing demand is based on annual household income. Rental housing affordability is calculated by household income category. Affordability calculations are provided for the following household income categories:
√ Extremely Low – 30% of Median HH Income
√ Very Low – 50% of Median HH Income
√ Low – 80% of Median HH Income
√ Middle Income – 120% of Median HH Income
According to the most recent 2010 ACS estimates, the median household income of Palm Beach and Martin Counties is $49,879 and $48,311, respectively. Applying the above the household income
categories, maximum rent levels are established based on the prevailing affordability standard (housing expenditures do not exceed 30 percent of household income). Households paying in excess of 30 percent of their monthly income on housing costs are considered “cost-burdened”.
Source: U.S. ACS 2010 Selected Economic Characteristics 1 Year Estimate
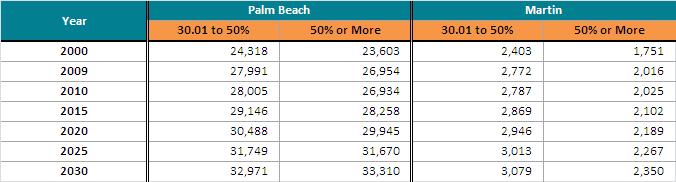
Table 3.25 below identifies the number of renter households in Palm Beach and Martin Counties paying 30 percent or more of their household income on rent payments. The analysis shows that approximately 90 percent, collectively, of renters in both counties earning less than $35,000 annually are cost-burdened. Significantly, 62 percent of households in both counties earning between $35,000 and $49,999 are also cost-burdened. This income range is closely proportionate with the 80-100 percent of median household income category.
Source: U.S. ACS 2010, Tenure by Housing Costs as a Percentage of Household Income (B25106), 1-Year Estimates
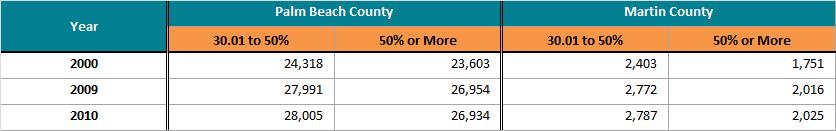
Significantly, job loss, declining household incomes and rising rent prices have increased the number of cost-burdened and “severely” cost-burdened (households paying in excess of 50 percent of income on housing costs) renter households in recent years. Cost-burdened renter households increased by 15 percent (currently 54,939 total renter households) from 2000 to 2010 in Palm Beach County and 16
percent (currently 4,812 total renter households) in Martin County. Severely cost-burdened renter households increased by 14 percent (26,934 renter households) in Palm Beach County and 16 percent (2,025 renter households) in Martin County during the same time period. Currently, 40 percent (59,751 households) of all renter households in Palm Beach and Martin Counties are cost–burdened.
Source: Florida Housing Data Clearinghouse
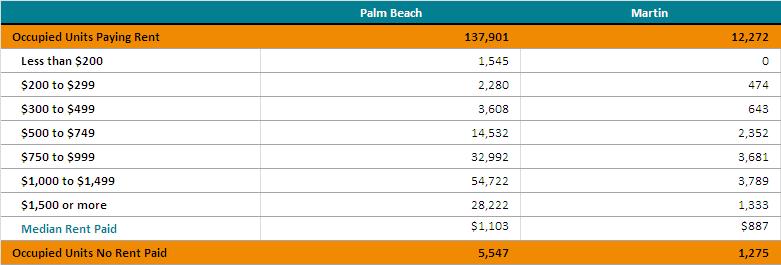
According to 2010 ACS 5-Year estimates, there are 137,901 occupied housing units in Palm Beach County that are paying rent (26 percent of all occupied units). The median monthly gross rent of all renter-occupied housing units in Palm Beach County is $1,103. In Martin County, there are 12,272 occupied units paying rent (21 percent of all occupied units). The median monthly gross rent of all renter-occupied units in Martin County is $887. Significantly, the median gross monthly rent in Palm Beach County is above the affordability levels of all renter households earning less than 80 percent of the median income. In Martin County, the median monthly gross rent is well above the affordability levels of all renter households earning less than 50 percent of the median household income (Table 3.27).
Source: U.S. ACS 2010 Selected Housing Characteristics (DP04), 1 Year Estimates
As previously noted, rental housing prices in Palm Beach and Martin Counties during the housing bubble was commensurate with rapidly escalating home sale prices. In Palm Beach County, the average monthly rent for a two-bedroom apartment increased from $757 in 2000 to $1,292 in 2011,
an increase of 71 percent. The growing demand for rental housing has impacted vacancy rates, absorption levels and rent prices. The substantial increase in renter-occupied units in both counties is evidence of changing housing demand factors attributed to recent economic conditions, including the home foreclosure crisis.
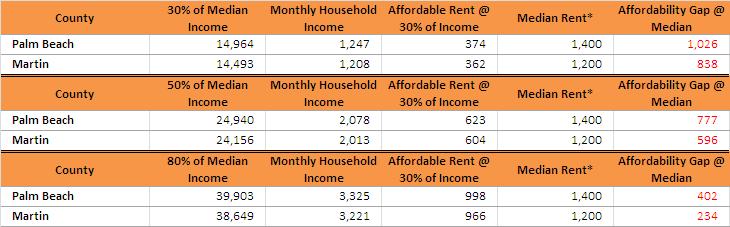
An affordability analysis of market rate rental units using the most current median rent figures from Zillow Real Estate indicates growing and substantial affordability gaps at the low, very low and extremely low household income levels (Table 3.28). Rents are generally affordable at the upper end (110-120 percent) of the middle household income category.
*Median rent as of April 2012 from Zillow Real Estate
Source: U.S ACS 2010 Selected Economic Characteristics
1-Year Estimate (DP03), Zillow Real State
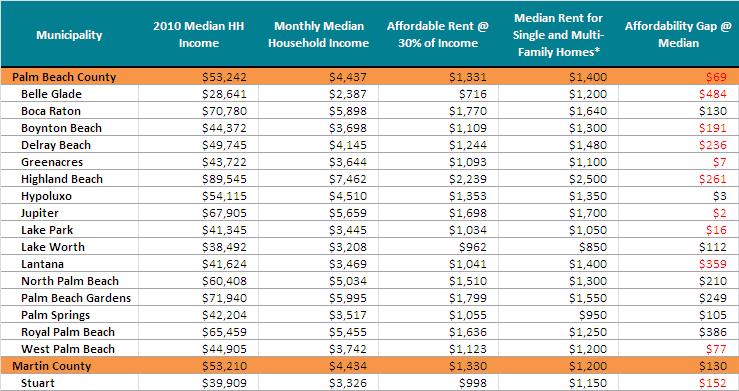
The median gross monthly rents in many of Palm Beach County’s largest municipalities are well above the county-wide average, including Jupiter ($1,700), Boca Raton ($1,640) and Palm Beach Gardens ($1,550). An affordability gap analysis was performed for the major municipalities in Palm Beach County, the City of Stuart in Martin County and both counties as a whole. The gap analysis shows significant affordability gaps in Belle Glade ($484), Lantana ($359), Highland Beach ($261), Delray Beach ($236) and Boynton Beach ($191).
As previously discussed, housing demand is largely driven by several key factor conditions, including local employment patterns, shifts in population and household growth, and household income. Future housing demand is typically calculated using a combination of population and employment projections for a particular area or labor market. As previously noted, future renter housing demand in Palm Beach and Martin Counties will continue to be impacted by stagnant economic conditions, foreclosure activity and an uncertain homebuyer market.
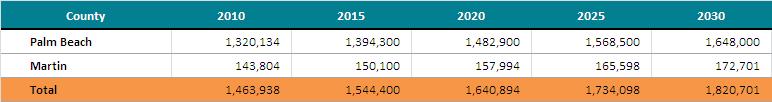
The methodology for projecting future housing demand calculates Palm Beach and Martin Counties’ projected employment growth by industry type and population projections to 2030. Population projections provided by the Florida Bureau of Economic and Business Research (BEBR) indicate that Palm Beach and Martin Counties overall populations will increase by 356,763 permanent residents (24 percent) by the year 2030. These projections have been adjusted downward in recent years due to slowing migration patterns and the economic and housing impacts of the economic recession.
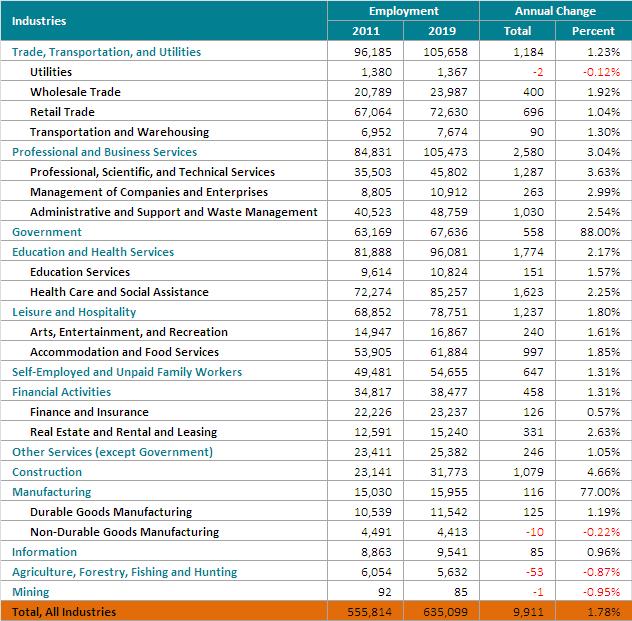
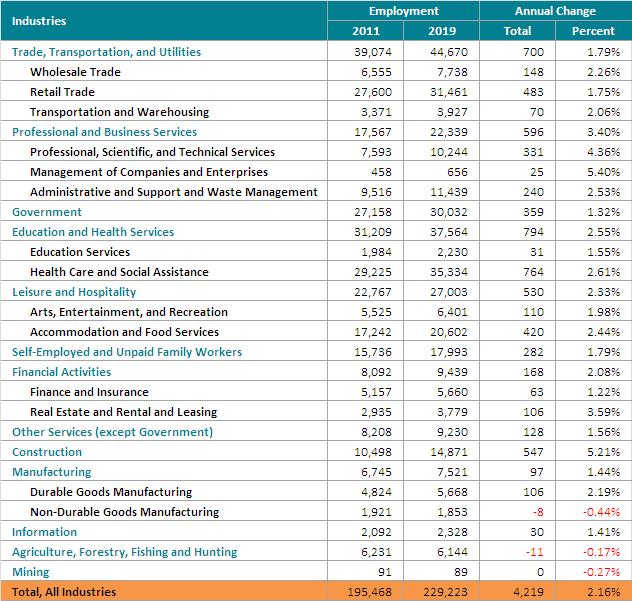
Employment projections by the Florida Department of Economic Opportunity (DEO) show 14 percent employment growth (79,285 total jobs) in Palm Beach County from 2011 to 2019 (9,910 annual job growth), and 17 percent employment growth (33,755 total jobs) in Martin County (4,219 annual job growth) during the same eight year period.
The highest levels of employment growth in the two counties are projected in health care and social assistance (19,092 jobs), construction (13,005 jobs), professional, scientific & technical services (12,950 jobs) and accommodation and food services (11,339 jobs).
Source: Florida Department of Economic Opportunity, Labor Market Information, Employment Projections by Workforce Region
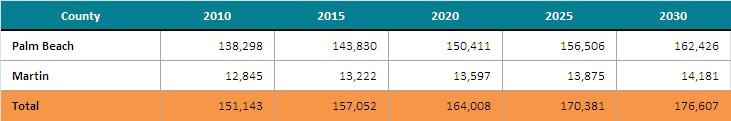
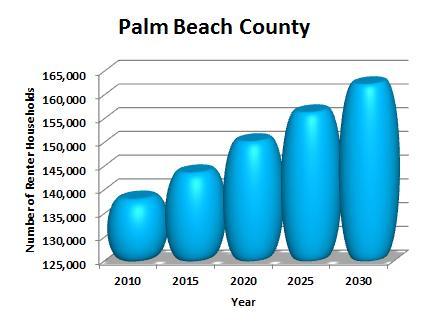
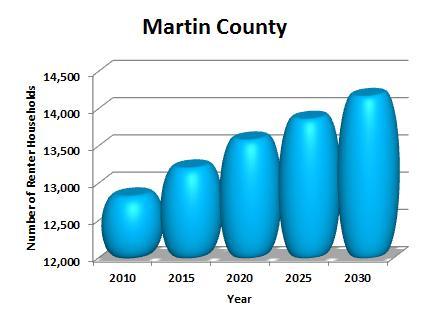
Future rental housing demand is calculated based on population and employment projections during the period 2010 to 2030. According to BBER statistics, renter-occupied units in Palm Beach County are expected to increase by 17 percent (24,128 units) by 2030 and by 10 percent (1,336 units) in Martin County.
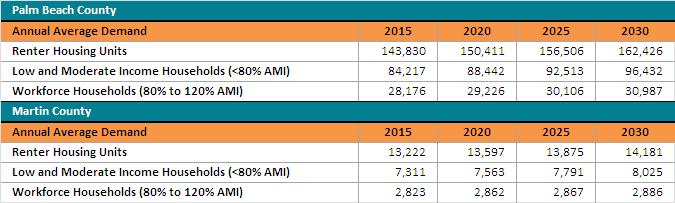
An analysis of annual average demand for the years 2015 to 2030 by renter household income category indicates that approximately 60 percent of the units will need to accommodate Palm County and Martin County households earning less than 80 percent of the area median income (AMI). Approximately 19 percent of the average annual demand will be for renter households earning between 80 and 120 percent of AMI (Table 3.33).
As previously noted, Palm Beach and Martin Counties have experienced a steady increase in costburdened and “severely” cost-burdened renter household since 2000. Projections to 2030 show that trend will continue at approximately the same pace as recent years. By the Year 2030, 117,317 renter households in Palm Beach and Martin counties will be cost-burdened and an additional 90,984 renter households severely cost-burdened.
The following section provides an assessment of existing public policies, regulations and public programs and their impact on the availability of an adequate supply of affordable rental housing in Palm Beach and Martin Counties. The prior analysis documents the critical supply and demand factors and conditions that have created a growing shortage of affordable rental housing in the two counties. The leading factors and conditions include: 1) a growing increase in renter housing demand resulting from the collapse of the housing bubble and subsequent economic recession; 2) limited federal and state funding for rental housing production and preservation; and 3) limited public and private multifamily housing production to keep pace with the rising demand for affordable rental housing.
Given the current and projected demand for affordable rental housing in Palm Beach and Martin Counties, local governments will need to evaluate their existing policies, regulations and programs to determine whether the requisite planning and management capacity is in place to effectively respond to the demand for affordable housing within their respective communities. The first step is to conduct a self-assessment to determine whether existing policies, regulations and programs encourage rental housing production and preservation or create barriers and other inefficiencies that prevent or discourage the availability of affordable rental housing in each community.
The prior renter housing supply and demand analysis concluded that the affordable rental housing shortfall is unlikely to improve any time soon. In fact, the growing demand for rental housing, at all income levels, will likely further diminish the supply of affordable rental housing in Palm Beach and Martin Counties. Rental housing affordability will also be impacted by persistently high unemployment and stagnant growth in household income in the coming years. Therefore, local government policymakers must find ways to do more with less as they confront their respective community’s need for affordable rental housing.
Perhaps the most immediate need in Palm Beach and Martin Counties is the rising percentage of “severely” cost-burdened renter households. As the previous analysis showed, long-term increases in the number and share of severely cost-burdened renters show no sign of improving. And, with unemployment expected to remain high for the next few years and rental demand increasing, competition for affordable rental housing will likely intensify.
Both Palm Beach and Martin Counties have adopted policies in recent years to address their affordable housing needs. As previously reported, the most effective way to address a community’s affordable housing needs is through the Comprehensive Growth Management Plan. One of the
critical findings of the 2008 Rental Housing Study was a general lack of coordination and integration in the affordable housing delivery management systems of local governments. Housing delivery was found to be typically fragmented among each municipality’s Housing and Community Development, Planning and Zoning Departments and Community Redevelopment Agencies (CRAs). The Comprehensive Growth Management Plan, through it various elements, can help coordinate and integrate a local government’s overall housing delivery system, including programs administered through the HUD Consolidated Plan.
The current analysis found that both Palm Beach and Martin Counties have updated the Housing Element of their respective Comprehensive Growth Management Plans to include significant language regarding affordable housing ,and specifically rental housing. Palm Beach County’s Housing Element includes the following goal statement:
“The County shall increase its effectiveness addressing Housing needs by:
√ Designating the Planning, Zoning and Building Department as the lead department for all data efforts for the Housing Element;
√ Coordinating housing policy objectives with all County agencies, such as the Department of Planning, Zoning and Building; the Department of Housing and Community Development, the Commission on Affordable Housing; and the Housing Finance Agency, and designate the Department of Housing and Community Development as the lead agency for coordinating all housing efforts;
√ The County shall also assist and encourage public/private partnerships with private community-based non-profit agencies and other private sector agencies that further County housing policy objectives, in order to improve cooperation among participants involved in housing production and to enhance the feasibility of producing and delivering affordable housing. The County could assist such agencies by paying administrative costs, by entering into joint ventures on land acquisition and by providing infrastructure.”
In 2009, Martin County amended the Housing Element of the Comprehensive Growth Management Plan (CGMP) to address their affordable housing needs. The Affordable Housing Needs Summary analyzed the amount of land needed to accommodate the projected population and the proposed distribution, extent and location of all types of uses, including residential uses. The CGMP provides incentives for affordable housing projects in areas where infrastructure is already in place by allowing a density bonus or deferring impact fees. The Future Land Use Element also provides for the establishment of a density and intensity bonus in community redevelopment areas and mixed-use developments that target urban in-fill and redevelopment areas.
Examples of the land use principles endorsed by Martin County are:
√ The allocation of residential densities in a manner compatible with available public services, natural features of land and existing and anticipated future development;
√ The allocation of higher residential densities to sites (1) accessible to major urban thoroughfares or urban collector streets, (2) sites adjacent to existing development with the same or higher density or less restrictive zoning district, (3) sites that can be adequately buffered from adjacent existing development of lesser intensity, and (4) sites that meet the density transitioning requirements of section 4.1F., of the CGMP;
√ The provision of a variety of lot sizes, floor areas, setbacks and residential land use mixes to allow for a choice in housing types, designs and price levels for both urban and rural residential environments; and
√ The use of the planned unit development, mixed use, and traditional neighborhood development concepts to encourage creativity in development, design, protection of open space, environmental features, and a mix of residential and nonresidential land uses.
Administrative processes for developmental approvals continue to create unnecessary delays that ultimately raise development costs with subsequent increases to housing prices and rents. These barriers can particularly impact affordable rental housing production and preservation and exclude affordable rental housing developments in a community altogether.
Although much attention is given to the availability of federal and state housing programs to address local demand for affordable rental housing, the most important impact of local governments on affordable housing development is not limited to the channeling of federal funds but rather control over land use and construction standards. A slow regulatory process of local planning and zoning approvals can significantly increase the cost of construction. To minimize these costs, local governments can expedite their permitting process and thereby reducing the approval process to 1-2 weeks. Local governments can establish internal standards of performance to streamline the permitting policy to make it easier for residents and developers to schedule contractors and construction work. By providing this predictability, local governments can leverage costs savings as a way to negotiate additional affordable rental housing units.
One of the greatest regulatory barriers to rental housing production is land use. Typically, land use regulations often restrict the location and allowable densities that are needed to provide the land capacity for rental housing production. Given the scale of rental housing demand in Palm Beach and
Martin Counties, land availability and density are essential. Palm Beach and Martin Counties will need to create or expand multi-family districts throughout their respective counties. The goal of a multifamily district is to encourage a well-planned and appropriate multiple-family developments within medium, high, and very high density land use classifications while stabilizing and protecting the residential characteristics of the district. Multi-family districts should be designed to create a suitable environment for multi-family living within existing and future land use designations that meet the diverse needs of local residents, and provide multi-family developers the flexibility to meet these goals.
With funding for HUD’s Neighborhood Stabilization Program (NSP) coming to an end, the Low-Income Housing Tax Credit (LIHTC) program is nearly all that is available to fund both new construction and substantial rehabilitation of existing properties including older assisted developments. However, the LIHTC program most commonly caps tenant eligibility at 60 percent of area median income (adjusted for family size), while the voucher program usually caps eligibility at 50 percent of area median income. Households with incomes above 60 percent of area medians are therefore excluded despite the rising the rapid growth of cost burdened and severely cost burdened renter households with incomes well above that threshold. One of the most important questions in the aftermath of the housing bubble is whether mortgage financing will be available for rental property acquisitions and investments. Even before the housing bubble and financial crisis, Fannie Mae and Freddie Mac were an important source of financing for both multi-family and investor-owned single-family properties.
Palm Beach and Martin Counties have programs in place to help fund affordable rental housing construction and preservation. As previously noted, however, the principal source of funding in recent years, HUD’s Neighborhood Stabilization Program (NSP) is not expected to be reauthorized after the current funding round (NSP3). Palm Beach County’s NSP3 allocation of $11,264,172 was used to undertake the following activities:
√ First and Second Mortgage Program (Category A-Financing Mechanism): provides first and/or second mortgages to homebuyers to acquire and rehabilitate approximately 45 foreclosed single-family housing units for owner-occupancy.
√ Palm Beach County Housing Authority (Category B-Acquisition and Rehabilitation): Palm Beach County. Housing Authority, acting a sub recipient, to acquire and rehabilitate 6 foreclosed single-family homes for rental to 0-50% AMI households. The activity will be located in an Area of Greatest Need located in western Palm Beach County (Target Area E).
√ Pahokee Housing Authority (Category E-Redevelopment): Pahokee Housing Authority, acting as a sub recipient, to construct 6 new rental housing units on vacant or demolished
property at the Authority's McClure Village development. The activity will be located in an Area of Need located in the western area of Palm Beach County (Target Area E).
Palm Beach County’s principal affordable housing programs are the Workforce Housing Program and the Affordable Housing Program. The Workforce Housing Program targets households with incomes ranging from 60-150 percent of area median income (AMI). The Affordable Housing Program targets households at or below 60 percent of AMI.
The Workforce Housing Program and Affordable Housing Program units are made available at a rate affordable to the specified income groups and only to income-eligible households for a period of time set forth in the Unified Land Development Code (ULDC). All Workforce Housing Program and Affordable Housing Program criteria are subject to the review and approval of the Board of County Commissioners.
The County makes adequate provisions to enable the public, private and not-for-profit sectors to provide affordable housing, and supports the distribution of housing for very low, low, moderate and middle income households, to avoid undue concentrations of very low and low income housing throughout the County through the Workforce Housing Program and the Affordable Housing Program.
The Workforce Housing development evaluation addresses specific criteria, including but not limited to:
1. Eligible developments must have a minimum number of 10 permitted units;
2. Workforce units can be both rental units and for sale units;
3. Workforce units built on site will be designed to be compatible with the overall development;
4. Workforce units built on-site can be clustered or integrated within the development;
5. Rental unit and resale unit affordability controls shall be guaranteed for a period to be set forth in the Unified Land Development Code (ULDC);
6. Workforce units may be allowed based on location, and land use compatibility, in any of the following land use categories: Commercial (mixed use); Industrial (mixed use); Economic Development Center; Institutional and Public Facilities, Traditional Town Development (TTD); and Multiple Land Use (MLU).
Incentives include:
1. For LR-1, LR-2, and LR-3, a density bonus of up to 30 percent
2. Traffic performance standards mitigation,
3. An expedited permit, zoning, and land use site plan approval process including engineering plating procedures.
4. A method to effectively offset impact fees and other development fees for the workforce units only may be included.
For land uses MR-5, HR-8, HR-12, and HR-18 a density bonus greater than 30 percent, up to 100 percent, shall be permitted when all program criteria are met and the increased density creates no compatibility issues with adjacent properties.
In 2008, Martin County created the Affordable Housing Land Bank and the Local Housing Trust Fund. The "Land Bank" is both an inventory and a functional program that identifies county and privately owned land that is suitable for affordable housing. The Local Housing Trust Fund was created to fulfill a need to have a locally established housing trust fund to bring additional dollars to match with other housing resources. The following policies and objectives have been adopted as part of the Housing Element of Martin County’s Comprehensive Growth Management Plan:
1. Policy 6.1E. 10. Housing Trust Fund, “Martin County shall use the Local Housing Trust Fund to fund programs that contribute to the creation and maintenance of affordable housing. Revenue sources for the Local Housing Trust Fund may include, but are not limited to, general revenue, private donations, developer contributions, tax increment funding, grants, unclaimed funds, and the sale of County land.”
2. Objective 6.1D. To provide adequate and affordable housing for very low, low, moderate, and workforce income households, including households with special housing needs, such as rural, farm worker and the elderly.
3. Policy 6.1D. Consolidate housing functions. The County shall consolidate its housing functions including implementation of housing programs, development of policies and programs, and solicitation of public input. The County shall support and assist non-profit housing providers,
administer County programs funded through state and federal funding sources, and coordinate land banking.
4. Policy 6.1D.2. Affordable Housing Advisory Committee. The County shall coordinate with the Affordable Housing Advisory Committee to assure safe, decent and sanitary housing to meet the needs of affordable housing for County residents. The Affordable Housing Advisory Committee membership shall meet statutory requirements and have the following duties:
a. Review policies, procedures, ordinances, land development regulations and the CGMP every three years pursuant to Section 420.9076, Florida Statutes.
b. Recommend specific initiatives or changes to the CGMP, to encourage or facilitate affordable housing while protecting property values and the potential for appreciation.
c. Evaluate the incentives in the LHAP and make recommendations for amendments, as needed, to encourage or facilitate the creation or maintenance of affordable housing.
d. Review changes to the LHAP before its submission to the Board of County Commissioners.
e. Review applications for SHIP funds by community-based organizations or eligible sponsors.
f. Function as the review committee to advise on and monitor the SHIP program, evaluate requests for exceptions from the regulations, and hear appeals from decisions made by the SHIP program administrator in accordance with the procedures set forth in the LHAP.
g. Submit a report to the Board of County Commissioners evaluating the implementation of affordable housing incentives and making recommendations for changes.
h. Perform additional responsibilities related to affordable housing at the request of the Board of County Commissioners, including creation of best management practices for the development of affordable housing in the community.
5. Policy 6.1D.3. Pursue innovative programs and concepts. The Affordable Housing Advisory Committee shall continue to investigate innovative concepts that facilitate the development or rehabilitation of very low, low, moderate and workforce income housing. Concepts to be investigated may include:
a. The promotion of innovative design, site plan or construction standards to reduce construction and/or infrastructure costs as part of the sustainable community initiative;
b. The use of density bonuses for projects providing very low and low income housing;
c. The development of criteria whereby impact fees could be paid by the County for very low income housing developments;
d. The utilization of the Housing Trust Fund for very low and low income housing. One source of revenue could be a local option surtax on documentary stamps for commercial real estate transactions (legislative action is required to allow this revenue source) and/or other sources of funds identified by the Affordable Housing Advisory Committee;
e. The development of a mortgage program through the Housing Finance Authority for very low, low and moderate income housing;
f. The application of green building practices;
g. The aggressive pursuit of grants and other funding possibilities.
6. Policy 6.1D.4. Housing Programs. Martin County shall undertake the following activities to provide very low, low and moderate income housing:
a. Use the County's Affordable Housing Land Bank program to identify county and privately owned land that is suitable for affordable housing.
b. Pursue Community Development Block Grants for neighborhood revitalization and housing programs.
c. Assist private organizations to obtain grants and loans to build low and moderate income housing, including assistance in accordance with the LHAP and the SHIP program.
d. Continue to provide information and referral on housing programs to individuals in need of housing, and to developers wishing to construct housing; and
e. Continue working with for-profit and nonprofit organizations to obtain funding for Florida HOME projects.
f. Use the County's Local Housing Trust Fund to combine donations towards affordable housing projects.
Multi-family rental housing is an essential asset class in American housing. Some 15 million U.S. households live in multi-family rental housing, representing more than 13 percent of all U.S. households and nearly 43 percent of U.S. renters. Multi-family rental housing is also an element of national economic competitiveness for it enables workforce mobility, household formation, rebuilding of personal credit and capital accumulation for those aspiring to homeownership and a quality retirement for the elderly. The rebuilding of personal credit and capital accumulation are particularly relevant in the aftermath of the recent economic recession.
Multi-family rental housing has long been an essential asset in both Palm Beach and Martin Counties. As noted in the previous analysis, multi-family housing, and especially small, multi-family structures (5-49 units), are the principal multi-family housing type in both counties. Small structures of 5-49 units comprise 78 percent of all multi-family units in Palm Beach County and 89 percent of all multifamily units in Martin County. In their 2011 Report, America’s Rental Housing, the Joint Center for Housing Studies of Harvard University found that while the common perception of rental housing is of large structures in urban areas, more than half of all rental units are in buildings with four or fewer units. The study also found almost three-fifths of rentals in suburban areas, and four out of five in non-metro areas, are also in smaller structures of 1-4 units.
The major goal of affordable rental housing investment is to help bridge the gap between what lower income renters can afford to pay and the rents necessary to produce or preserve and to maintain the affordable rental housing structure. Investing in new and existing rental housing requires access to affordable financing. Of particular concern, is that owners of smaller multi-family properties have access to affordable financing to maintain this valuable housing stock. Without subsidies developers are generally unable to produce rental housing for the lower household levels, leaving the growing number of poor renters to compete for a dwindling supply of affordable units. Absent greater efforts to preserve existing rental housing and build more affordable units, these trends are likely to persist.
Studies have found that the underserved rental housing investment market is small multi-family loans on properties ranging from 5 to 50 units. Unlike large multi-family properties of 100+ units, they are not typically operated by private developers and management companies with track records. Instead, they are income-producing properties requiring the same detailed, individualized underwriting as large multi-family loans. However, the loans, in the $500,000 to $2,000,000 range, support much smaller loan fees and must be packaged in greater volume to attract investors. Most origination for small multi-family loans comes from community banks, state housing finance agencies and specialized local or regional loan pool originators. Much still relies community development financing.
The proposed affordable rental housing strategies were developed following a careful analysis of Palm Beach and Martin Counties’ rental housing inventory and current market conditions with respect to sales and foreclosure activity. Specifically, an assessment, based on site surveys, was conducted of both market and distressed multi-family properties that were either foreclosed, real estate owned (REO) or presently on the market as a “short sale.” The Costar Group, a commercial real estate information company, was the principal source for calculating current multi-family rental sales values in Palm Beach and Martin Counties. Estimates for rehabilitation and operation costs were based on interviews with various housing professionals including county and municipal officials from Palm Beach County.
The analysis concluded that the bulk of REO and short sale properties are small, multi-family properties generally in the range of 6-53 units. These properties are typically located within the I-95 Corridor. As the previously housing supply analysis confirmed, these properties are typically 40+ years old and have moderate levels of deferred maintenance and probable health and building code violations. Many of the properties surveyed were either fully or partially occupied with existing tenants.
The proposed affordable rental housing investment strategy was formulated based on the prior housing supply and demand analysis and general feasibility regarding potential acquisition and rehabilitation. The following “guiding principles” were established to help assign priority to specific rental properties:
Rental properties of 5-49 units;
Rental properties with existing at-risk tenants in place;
Rental properties in generally good to fair condition requiring no more than moderate levels of rehabilitation;
Rental properties in proximity to transit and employment
Rental properties in HUD-NSP designated Areas of Greatest Need
Project pro forma were developed for three rental investment prototypes that represent the range of small, multi-family rental properties that 1) meet the above guiding principles, and 2) meet general acquisition and rehabilitation feasibility as noted above. The project pro forma used for the rental housing investment prototypes was modeled after the project pro forma calculations used in housing
linkage fee nexus studies. Housing linkage fee nexus studies calculate local housing demand by the various household income categories of the worker population. For the purposes of this study, calculations are performed for renter households earning 50, 80 and 120 percent of the area median income (AMI).
In each case, gap financing is the proposed investment option over direct renter assistance or other forms of subsidy. Gap financing provides a front end subsidy to the fill the financing gap that exists between a feasible private loan and the acquisition/rehabilitation costs of the project.
The following three rental housing investment scenarios include 9, 24 and 49 unit prototypes As previously noted, rent calculations were determined for household incomes at 50, 80 and 120 percent of AMI based on HUD’s Fair Market Rent Schedule. A $25,000 equity contribution was applied to each project.
Property description: 9–unit multi-family rental property
Estimated acquisition cost: $375,000
Per unit cost: $41,666
Estimated rehabilitation cost: $520,000
Per unit cost: $57,777
Property description: 24–unit multi-family rental property
Estimated acquisition cost: $1,200,000 million
Per unit cost: $50,000
Estimated rehabilitation cost: $685,000
Per unit cost: $28,541
Property description: 49–unit multi-family rental property
Estimated acquisition cost: $4,312,000
Per unit cost: $88,000
Estimated rehabilitation cost: $1,352,750
Per unit cost: $27,607
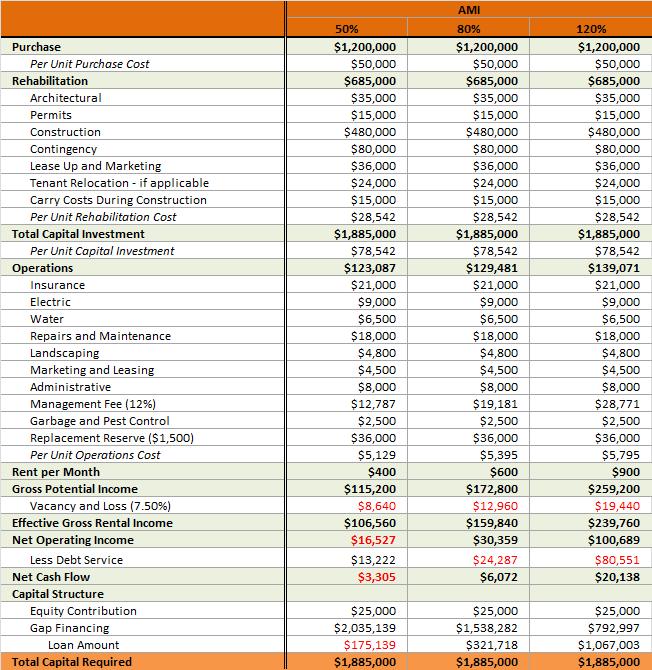

The project pro forma for the 9-unit multi-family property shows substantial gap financing of $974,224 ($108,274 per unit) at the 50 percent of AMI household income rent maximum decreasing to $508,420 ($56,491) at the 120 percent of AMI household income rent maximum. The larger 24 and 49 unit properties also show substantial gap financing at the 50 percent of AMI level, but at a significantly lower per unit cost. Gap financing is substantially lower at the 80 and 120 percent of AMI household income levels and rent schedules.
The survey and analysis of multi-family rental properties found the vast majority to be older structures of less than 50 units in need of moderate levels of rehabilitation. The above prototypes indicate higher per unit rehabilitation costs for the small nine (9) unit structure than the larger 24 and 49 unit structures. In fact, the survey found multi-family structures in the 24-49 unit range in generally better physical condition than the 6-9 unit prototypes. This may be attributed to several factors including age of the property, attention to deferred maintenance issues and the presence of on-site management.
From an investment standpoint, small, multi-family properties in the 24-49 unit range are more financially feasible both in terms of per unit acquisition and rehabilitation costs. Programmatically, control and improvement of these properties would have a greater impact in terms of preserving a larger number of affordable rental housing units than the smaller prototypes. The 24-49 unit structure prototypes also allow for greater unit mix in terms of household income levels (i.e. 50, 80, 120 percent of AMI). Finally, the small, multi-family property under 50 units is typically the structure type most in need of gap financing for the reasons previously identified. These multi-family structure types are generally the more valued affordable rental housing investment from both a financial feasibility and programmatic perspective.