18 minute read
Market Watch


STUDY: HALF OF COMPANIES MISS CYBERSECURITY THREATS
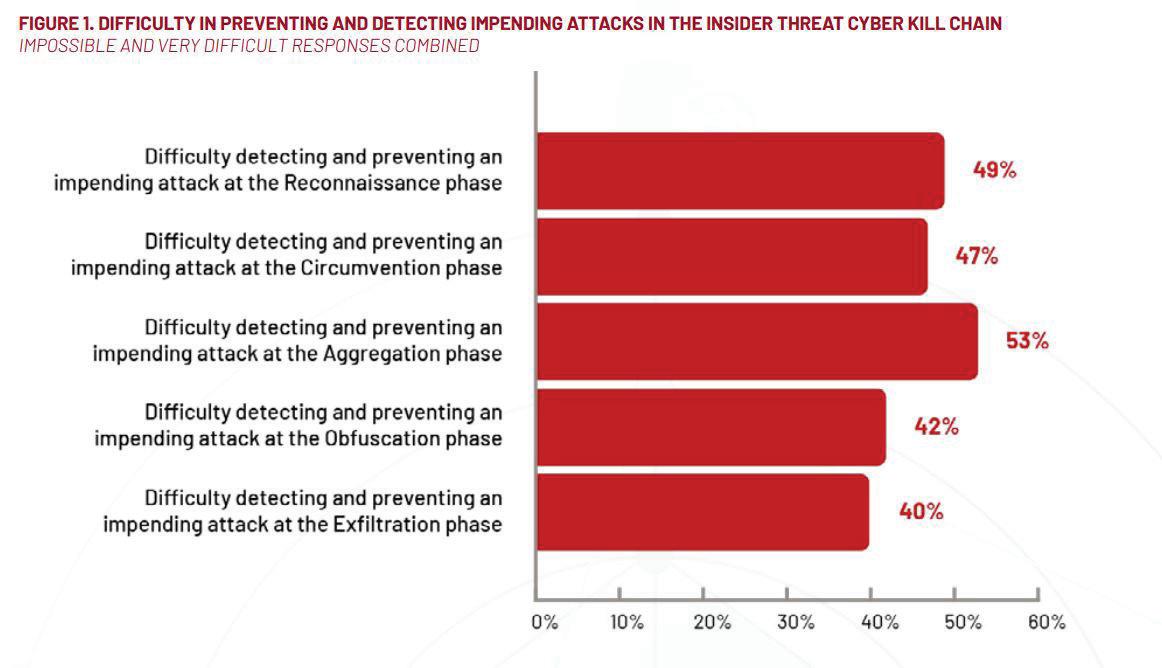
Businesses are missing cybersecurity threats to their own companies in a big way. The Ponemon Institute recently published a study showing nearly half of the 1,249 IT professionals surveyed say they have no way of identifying cybersecurity risks in the early stages. The study found that: • 53% of companies find it impossible or very difficult to prevent an insider attack when data is being aggregated, a key indicator of intent of an attack. • Only 32% of companies say their organizations are very or highly effective in preventing the leakage of sensitive information. • 15% of organizations state that no one has ultimate authority and responsibility for controlling and mitigating workforce risks. • Nearly half of companies find it impossible or very difficult to prevent an insider attack at the earliest stages of the Insider Threat Kill Chain.
In observance of Insider Threat Awareness Month, cybersecurity company DTEX partnered with Ponemon to better understand the growing rate of risks, especially following major breaches like SolarWinds. Recent cybersecurity studies have shown a: • 450% increase in employees circumventing security controls to intentionally mask online activities. • 230% increase in behaviors indicating an intent to steal data.
The study showed that security threats typically follow a recurring pattern. What they refer to as an Insider Threat Kill Chain includes five steps present in most attacks: 1. Reconnaissance: When preparing for data theft, a malicious insider typically begins with research. This is where they locate the data that they would like to steal, test security controls, or, in the case of compromised credentials, where the insider will test the limits of the stolen credentials privilege. 2. Circumvention: Any attempts to bypass existing security controls provide an important indication that subsequent actions were intentional. Many organizations place too much reliance on the “locks on their doors,” however an insider typically has sufficient domain knowledge to know which doors are unlocked or simply has access to the key. To read the rest, visit forconstructionpros.com/21648232.
COVID-RELATED FREIGHT CONSTRAINTS, LABOR COSTS CONTINUE TO PUSH ENGINEERING AND CONSTRUCTION COSTS UPWARD
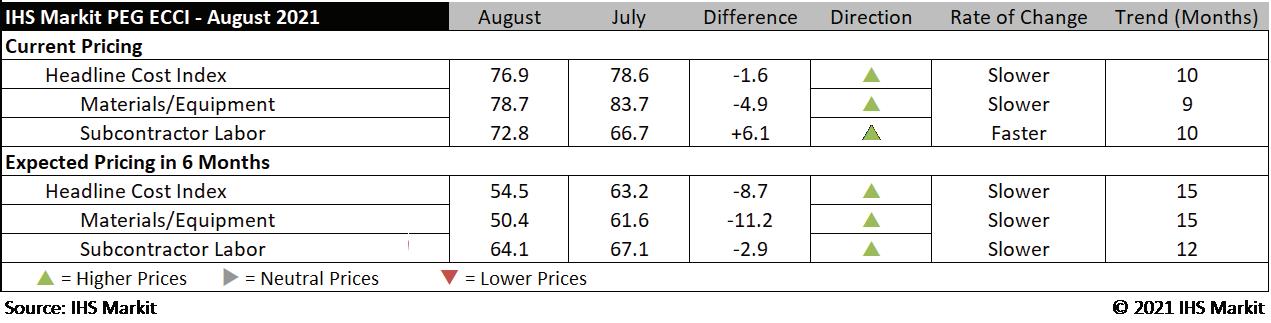
The August 2021 headline IHS Markit PEG Engineering and Construction Cost Index decreased 1.6 index points from July to 76.9, though construction costs continue to rise, according to IHS Markit and the Procurement Executive Group (PEG).
For the ninth straight month, the materials and equipment sub-index remained above 50, indicating increasing prices, but the sub-index fell 4.9 points from last month to 78.7. The subcontractor labor index recorded 72.8, a 6.1 index point increase from the previous month, indicating a consensus for a quickening pace of labor costs increasing among respondents.
In August, all categories within the materials and equipment index increased individually for the eighth straight month, as well, though index levels have fallen further from peak levels experienced earlier in the year for most categories. • The sub-index for electrical equipment fell from 72.2 in
July 2021 to 66.7 in August 2021. • The sub-index for transformers also fell from 72.2 in July to 70.0 in August. • Costs of ocean freight from both Europe and Asia to the
United States officially increased for a continuous calendar year, though the pace of price increases are slowing.
To read more, visit forconstructionpros.com/21627311.
SKID STEER PRICES UP 30% IN THE U.S. ACCORDING TO RITCHIE BROS.
Ritchie Bros.’ August Market Trends Report continues to show growing prices across all its equipment indexes, with truck tractor prices up 31% in the U.S., while medium earthmoving and vocational trucks are up 27% and 26% respectively for the three months ending July 31, 2021.
Over the past decade Ritchie Bros. has seen multi terrain loader sales grow exponentially in comparison to its wheeled counterpart. In 2010 Ritchie sold roughly five times more skid steers (3,037 units) in the U.S. than multi terrain loaders (624 units). By 2020 that ratio had changed drastically, as the company sold approximately 2.5 times more multi terrain loaders (3,484) than skid steers (1,310). Interestingly, in Canada, while multi terrain loader sales have certainly grown, skid steer loaders have maintained their lead in terms of number of units sold.
“Medium earthmoving equipment like skid steer loaders and multi terrain loaders are performing particularly well this year,” said Doug Olive, senior vice president for pricing at Ritchie Bros. “According to our recent skid steer index, prices for the small but versatile machines are up 30% in Canada and 27% in the United States.”
Doug Rusch, managing director of Rouse Sales, added, “The retail market for used compact-sized earthmoving
equipment, including skid steer loaders, has shown impressive strength this year, leading all other categories in price achievement. Retail values for compact-sized earthmoving equipment are up 11% since January and are now at the highest level we’ve seen in the last 5+ years.”
To read more, visit forconstructionpros.com/21615333.

CONSTRUCTION ECONOMY GROWS IN AUGUST DESPITE LABOR, SUPPLY CHAIN CHALLENGES
The business sector that includes construction, the services sector, saw a slight dip in its economic activity in August, but only because companies can’t find enough workers and materials are in short supply.
Anthony Nieves, chair of the Institute for Supply Management (ISM) Services Business Survey Committee, delivered the Services ISM Report on Business on Sept. 3, saying the services sector is experiencing growth at 61.7%, but is down slightly from its historic high at 64.1% in July.
“We’ve had some pull back, which was to be expected,” Nieves says. “We couldn’t maintain such a high rate ongoing, especially with the capacity constraints.”
The ISM Services PMI index is a set of economic indicators based off surveys of private-sector companies in the services sector, which includes construction.
“(Survey) respondents are saying it’s just tough filling jobs out there,” he says. “We know there’s been a challenge with the availability of containers, trucks and drivers. There’s been port congestion; throw weather into the mix, and the fact that the output upstream in the supply chain is not up to speed as far as demand, both with staffing and materials.” According to one survey respondent in the construction industry, “Material and labor shortages continue to hinder productivity. Price increases are ever-present and repetitive. Large, multinational manufacturers have had multiple price increases in the last three months.” August was the 15th straight month of growth for the sector.
Prices paid by services organizations for materials and services increased in August, with the index registering 75.4%, 6.9% age points lower than July’s reading of 82.3%.
To read more, visit forconstructionpros.com/21648397.

ARA FORECASTS 3.5 PERCENT INCREASE FOR RENTAL EQUIPMENT INDUSTRY
The outlook for equipment rental revenue, comprised of the construction/industrial and general tool segments, has improved over the last quarter.
The updated second quarter forecast released by the American Rental Association (ARA) now calls for equipment rental revenue to exceed $47.8 billion in 2021, nearly a 3.5 percent increase over 2020 and greater than last quarter’s forecast that called for a 3.1 percent increase this year.
Overall, the ARA forecast calls for a 9.68 percent increase in revenue in 2022 to reach nearly $52.5 billion, surpassing the equipment rental industry’s previous peak revenue of nearly $51 billion in 2019. Growth is expected to be 3.9 percent in 2023, 2.4 percent in 2024, and 3.5 percent in 2025 to total $57.7 billion.
The revenue increases are fueled by the expected strong demand for construction and industrial equipment rental, particularly in 2022, when the segment’s revenues are expected to jump 11.9 percent to $38.9 billion, surpassing the record $37.7 billion in revenue set in 2019.
Also, with the likely passage of the Infrastructure Investment and Jobs Act of 2021 (IIJA) by the U.S. Congress, the future forecast for equipment rental revenue in 2022 and beyond could be even more robust.
“Once final passage occurs, we will have more specific analysis built into future forecasts, but at first glance, it looks like the IIJA could increase rental revenues by about $8 billion over the eight-year spending program the IIJA authorizes,” says John McClelland, ARA vice president for government affairs and chief economist.
“That would roughly amount to an increase in rental revenues for construction and industrial equipment of 7.8 percent over the current forecast. While we need details on how and when the money will be spent to provide a more complete forecast on the IIJA’s impact on the equipment and event rental industry, early analysis is quite positive,” McClelland says.
Scott Hazelton, director, economics and country risk, IHS Markit, says the timing of the infrastructure spending remains unclear, making it difficult to assess the rental forecast implications over time, but that the company, which provides data and analysis for the ARA Rentalytics forecasting service, expects to start incorporating the details into the next quarterly rental revenue forecast update.
For now, Hazelton says the outlook this quarter is more positive than the first quarter because the forecast for nonresidential construction has improved and the American Institute of Architects billings index has moved into positive territory.
“When that index indicates expansion for three consecutive months, there is a high likelihood that nonresidential construction will pick up 12 to 18 months later. While this only moves the nonresidential forecast from roughly flat to modest growth, it is enough to move rental equipment demand up,” Hazelton says.
In addition, he says some of the $350 billion in undesignated funds to state and municipal governments in the American Rescue Plan is expected to be used for construction projects, which also translates into more demand for equipment rental. Perhaps the most interesting figures included in the forecast concern the outlook for investment. According to ARA Rentalytics, those in the construction and industrial segment are expected to increase investment this year by 48.1 percent to $7.2 billion and another 40 percent in 2022 to reach nearly $10.1 billion, surpassing the peak industry investment in equipment of $9.95 billion in 2019.
“Investment in new equipment dropped precipitously — 51 percent — in 2020 and is now expected to rebound by 48 percent in 2021 and 40 percent in 2022. This forecast is supported by our analysis of industry metrics that show increases in physical utilization, fleet age and fleet turnover,” McClelland says.
“These measures suggest that there has been defleeting and aging of the fleet during the pandemic as a reaction to the resulting economic downturn. With the economy now in recovery, demand for rental equipment is increasing. With physical utilization already high, rental companies much make significant investments in new fleet to meet that demand,” he says.
In addition, investment in general tool equipment is expected to increase by 19.5 percent this year to reach $3.31 billion and then grow another 22. 1 percent in 2022 to teach $4.04 billion.
To read more, visit forconstructionpros.com/21614961.

OSHA ISSUES UPDATED GUIDANCE TO PROTECT AT-RISK WORKERS FROM COVID-19
Updated guidance issued by the Occupational Safety and Health Administration is intended to help employers protect at-risk workers from the coronavirus.
Reflecting the latest developments in science and data, including the Centers for Disease Control and Prevention’s (CDC) updated COVID-19 guidance issued July 27, the updated guidance expands information on appropriate measures for protecting employees in higher-risk workplaces with mixed-vaccination status workers, particularly for industries where there is often prolonged close contact with other workers and/or non-workers.
OSHA’s latest guidance recommends that fully vaccinated workers in areas of substantial or high community transmission wear masks in order to protect unvaccinated workers. It also advises that fully vaccinated workers who have close contacts with people with COVID-19 wear masks for up to 14 days unless they have a negative coronavirus test at least three to five days after contact.
“OSHA continues to emphasize vaccination as the optimal step to protect workers and encourages employers to engage with workers and their representatives to implement multilayered approaches to protect unvaccinated or otherwise at-risk workers from the coronavirus,” a statement from the U.S. Department of Labor noted. OSHA will continue its enforcement efforts to ensure workers are protected from the coronavirus while on the job, including through the National Emphasis Program (NEP) on COVID. The agency launched the NEP on March 12, 2021, to focus on companies that put the largest number of workers at serious risk of contracting the coronavirus, and on employers that engage in retaliation against employees who complain about unsafe or unhealthful conditions or exercise other rights under the Occupational Safety and Health Act. A revision issued July 8 adjusted the targeted industries to those most at risk for COVID-19 exposure, while still including healthcare and non-healthcare sectors.
For more information, visit forconstructionpros. com/21614789.

CONSTRUCTION SPENDING UP ONLY SLIGHTLY IN JULY, BUT CLIMBS OVER 6% YEAR TO DATE
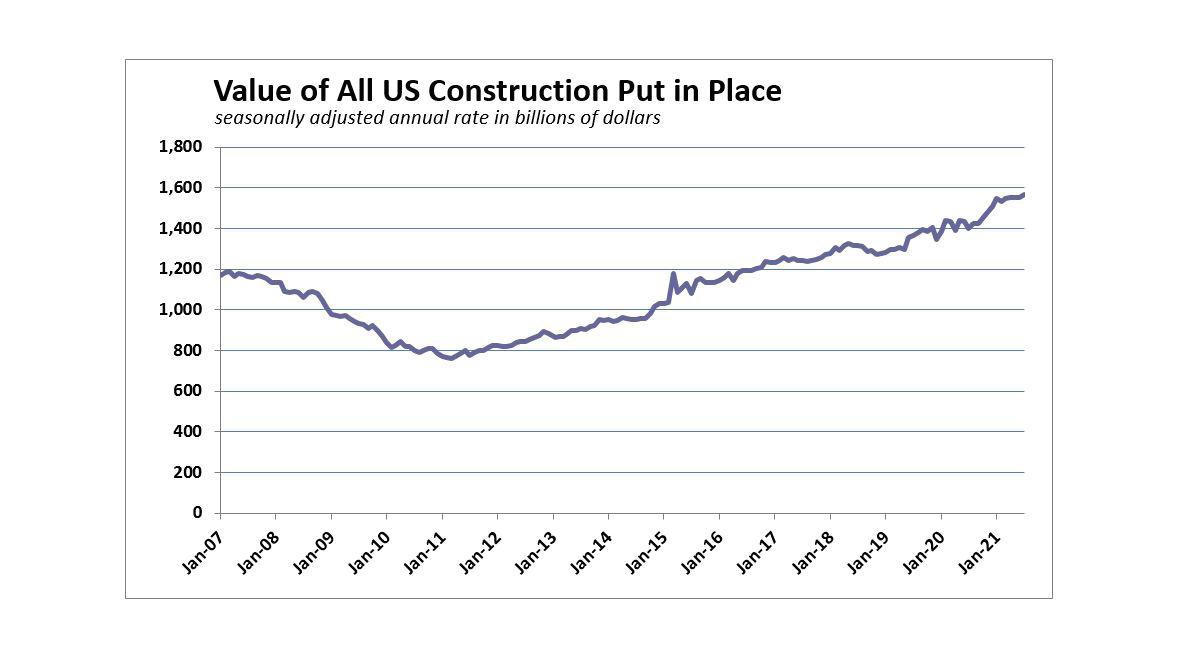
The U.S. Census Bureau reports total construction spending edged up slightly (+0.3%) for July 2021 to an estimated seasonally adjusted annual rate of $1,568.8 billion, compared to June’s revised estimate of $1,563.4 billion. Longer term gains were more pronounced. Total spending saw a 6.2% increase during the first seven months of 2021 (to $883.2 billion) vs. the same period in 2020 and is 9% higher on a year-over-year basis.
Private construction spending, which makes up the bulk of the spending total, edged up just 0.3% to a seasonally adjusted annual rate of $1,231.0 billion vs. June’s $1,227.8 billion. However, it retained a double-digit increase (+13.6%) over June 2020.
Residential construction inched up just 0.5% to $773.0 billion in July over the revised June estimate of $768.9 billion, yet is a healthy 27% above the same month in 2020. Single-family construction rose 0.9% for the month and a hearty 47.1% year over year, while new multifamily construction was flat in July 2021, but up 14.9% compared to the same month last year.
Nonresidential construction fell 0.2% in July 2021 to $458.0 billion and is down 3.6% from July 2020. Not surprisingly, the segments hardest hit on a year-over-year basis were office (-29.8%), educational (-19.6%) and amusement and recreation (-11.6%), all of which have struggled most to recover from the pandemic’s impacts.
For more information, visit forconstructionpros. com/21648077
HOW TO OVERCOME CONSTRUCTION SUPPLY CHAIN CHALLENGES
The way consumers purchase goods has changed over the last 18 months. Traditional methods are no longer an option. Stocks at the manufacturers and wholesalers used to be plentiful. There were also no issues with the pipelines.
That was until the Coronavirus disease (COVID-19) hit early in 2020..
What we’ve been left with is those pipelines clogged up and congested, while broad materials are scarce across multiple industries. Because of the pandemic, factories closed for long periods of time. A combination of that and Brexit has meant catching up has proven to be incredibly difficult during 2021 to the point that it has been estimated that construction won’t see a complete recovery back to pre-crisis 2019 levels until 2023.
Sticking with that theme of purchasing though, many businesses, and particularly buyers, in the construction and manufacturing industries will recognize how difficult it has been over the last eight months.
A good example of products that have been caught up in the supply chain disruption is personal protective equipment (PPE). That shortage led to another issue -- price hikes, which are up 70% on what they were prior to the pandemic.
That equipment wasn’t alone. Numerous products have seen the same increase and forced many businesses with a decision to make on whether to purchase a product for an inflated price in big volumes, in the hope that it sells through before prices could fall again. That issue is still ongoing now and has made purchasing incredibly difficult. To forecast further ahead, especially with larger suppliers, companies are placing orders for the next year or 18 months, scheduling the products so they know when they’re going to receive them. Doing so does mitigate the issue, but it certainly doesn’t solve it because there are still some products and materials that companies cannot get into their depots until Q1 or even Q2 of 2022.
As well as forecasting ahead, there are other steps that businesses can take now to ease the heavy burden of pressure being caused by this supply chain disruption.
To read the rest of the article, visit forconstructionpros. com/21627947.

MANUFACTURERS STRUGGLE TO MEET DEMAND; ECONOMIC ACTIVITY GROWS IN AUGUST
Economic activity in the manufacturing sector grew in August, with the overall economy notching a 15th consecutive month of growth, say the nation’s supply executives in the latest Manufacturing ISM Report on Business.
The report was issued Sept. 1 by Timothy R. Fiore, chair of the Institute for Supply Management (ISM) Manufacturing Business Survey Committee. The Manufacturing PMI, or the Purchasing Managers’ Index, is a set of economic indicators based off surveys of private-sector companies.
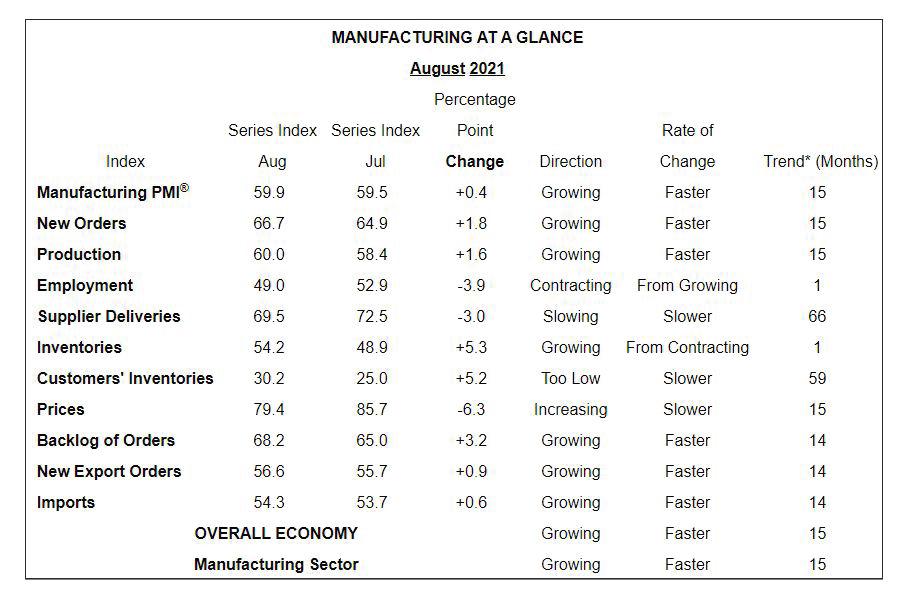
“The August Manufacturing PMI registered 59.9%, an increase of a 0.4 percentage point from the July reading of 59.5%. This figure indicates expansion in the overall economy for the 15th month in a row after contraction in April 2020,” he says.
The New Orders Index registered 66.7%, increasing 1.8 percentage points from the July reading of 64.9%. The Production Index registered 60%, an increase of 1.6 percentage points compared to the July reading of 58.4%.
The Prices Index registered 79.4%, down 6.3 percentage points compared to the July figure of 85.7%; this is its first reading below 80% since December 2020 (77.6%). To read the entire report, visit forconstructionpros.com/21648063.


JOB CREATION A WINNER UNDER INFRASTRUCTURE PLAN, BUT WHO WILL DO THE WORK?
According to a report by S&P global, the $1.2 trillion Infrastructure Investment & Jobs Act (IIJA) will create close to 1 million new jobs over the next decade. The analysis says that employment would be boosted by more than 880,000, with many middle-class jobs, including in construction, engineering and accounting.
If it becomes law, the bipartisan, Senate-approved infrastructure bill will also increase per capita personal income in 2030 by about $100 per person, or roughly 10.5%, according to the S&P study. With fatter paychecks and more jobs, households are projected to spend an additional $677 billion over the eight-year period.
Projects small and large are experiencing delays as the nation is short about a quarter-million workers. Add to that a pandemic, dramatic increases in the cost of supplies, and supply chain delays and you have an industry on shaky ground.
Associated Builders and Contractors predicts the shortage will grow to one million workers in two years.
“Contractors should think about labor and their relationship with technology differently,” Josh Weiss COO/ CDO, Hexagon Geosystems says. “Rather than focus on the labor they want and don’t have, focus on the available tools and how to use them to grow the productivity of existing talent. Technology optimizes workflows so less time-intensive work, or rework, is needed, increasing the capability of the existing workforce. In other words, technology is not killing jobs; it’s “skilling” jobs. Technology allows companies to look at projects in a new way.”
In fact, McKinsey found that if construction productivity could at least catch up to the economy as a whole, the sector’s value would increase by an estimated $1.6 trillion — the equivalent to around half of the world’s annual infrastructure needs.
“Today the pandemic has created a significant shift for construction firms and tech adoption is the only way forward to embrace the ‘next normal,’” Ed Williams senior team lead at ProjectPro says. “To eliminate inefficient processes that plague the industry’s productivity caused by ineffective communication and inaccurate project data, going digital is the only way forward. By leveraging construction technology one can seize the incredible financial opportunities that 2022 will usher in, as cost savings can no longer be ignored.”
Until we can attract more people to the industry, we need to find ways to do more work with fewer resources. It might be time to investigate technology to help.
To read the full story, visit forconstructionpros. com/21627837.

CONSTRUCTION SPENDING IS STABLE, NONRESIDENTIAL IS ‘MEANINGFULLY WORSE THAN IT APPEARS’
The total value of U.S. construction put in place in July crept up 0.3% on 0.5% growth in residential spending. Nonresidential construction spending was nearly flat, up just 0.1% on growth in public projects, according to data published today by the U.S. Census Bureau. That 0.1% was nonresidential construction’s second monthly gain over the past six months.
Year-to-date, the construction industry would be suffering dramatically if not for the gobsmacking 25.3% growth in residential spending. By contrast, nonresidential spending has tumbled 7.5% compared to the first seven months of 2020. July spending was down in six of 16 nonresidential subcategories.
“The nonresidential construction spending numbers are meaningfully worse than they initially appear,” said Associated Builders and Contractors’ Chief Economist Anirban Basu. “While the headline number suggests that nonresidential spending was effectively flat in July, the figure does not adjust for inflation. In real terms, the volume of construction services delivered by the nation’s nonresidential contractors declined in July.
“Higher materials prices and worsening skills shortages represent primary culprits,” said Basu. “Many project owners are delaying projects due to elevated construction service delivery costs. With COVID-19 continuing to wreak havoc on supply chains, materials prices and transportation costs are set to remain elevated well into 2022. The result is that the construction recovery is significantly slower than it would otherwise be, a fact reflected in the most recent reading from ABC’s Construction Backlog Indicator.”
To read more, visit forconstructionpros.com/21648167.


