14 minute read
EPA Announces $6.5 Billion in New Funding for Water Infrastructure
Support for wide range of projects in large and small communities
In an address made during Drinking Water Week, Michael S. Regan, U.S. Environmental Protection Agency (EPA) administrator, announced that new funding is being made available under the agency’s Water Infrastructure Finance and Innovation Act (WIFIA) program and state infrastructure financing authority WIFIA (SWIFIA) program. Monies will go toward critical water infrastructure projects in both large and small communities in the United States.
Advertisement
Investing in Infrastructure
There are more than 2.2 million miles of underground pipes that make up America’s drinking water infrastructure system. As the American Society of Civil Engineers (ASCE) points out, “the system is aging and underfunded. There is a water main break every two minutes, and an estimated 6 billion gallons of treated water are lost each day in the U.S., enough to fill over 9,000 swimming pools.” This is one of the many reasons water infrastructure earns a C- on the ASCE 2020 Report Card.
Water for drinking, washing clothes, flushing toilets, and bathing has long been taken for granted and the infrastructure that supports these and other uses needs the industry’s full attention. Funding for repairs and replacement has not kept pace with the growing need to address aging systems. The WIFIA and SWIFIA programs provide funds to accelerate investment in water infrastructure through innovative and flexible financing of long-term, low-cost supplemental loans.
A recent EPA press release notes that the “WIFIA loan program has become one of the most effective tools used to upgrade the nation’s infrastructure. To date, EPA’s 49 WIFIA loans are providing over $9.3 billion in credit assistance to help finance nearly $20 billion for water infrastructure, while creating approximately 49,000 jobs and saving ratepayers over $4 billion.”
The new funds will support water infrastructure projects and prioritizes five areas: S Supporting economically stressed communities. S Protecting water infrastructure against the impacts of climate change. S Reducing exposure to lead and addressing emerging contaminants. S Updating aging infrastructure. S Implementing new or innovative approaches, including cybersecurity and green infrastructure.
Part of the Plan
The “EPA’s $6.5 billion in water infrastructure funding will provide more than $13 billion in water infrastructure projects, while creating more than 40,000 jobs,” Regan said during his announcement. He went on to explain that it “illustrates the multiple benefits of investing in water infrastructure—better public health, environmental protection, job creation, and economic development.”
Funding will go to a wide range of projects, in addition to the existing active pipeline of WIFIA projects (76 projects in 25 states), including: S Drinking water treatment and distribution projects. S Wastewater conveyance and treatment projects. S Nonpoint source pollution management program. S Management, reduction, treatment, or recapture of stormwater. S National estuary program projects. S Enhanced energy efficiency projects at drinking water and wastewater facilities. S Desalination, aquifer recharge, alternative water supply, and water recycling projects. S Drought prevention, reduction, and mitigation projects. S
FWRJ Anaerobic Codigestion of Food Waste to Increase Methane Yields
Karamjit Panesar, Ian Atkins, and Sarina J. Ergas
Up to 63 mil tons of food waste are produced in the United States each year (“USEPA Food Recovery Hierarchy,” 2016). Food waste significantly contributes to landfill methane emissions and high concentrations of chemical oxygen demand (COD) and ammonia in leachate (Trabold and Nair, 2018). Characteristics of food waste also pose challenges to other solid waste management options; for example, food waste is a poor incineration feedstock due to its high moisture content and low calorific value (Lee et al., 2020).
Different states also have different policies in regard to organic waste. Florida previously enacted but fell short of the 75 percent recycling goal for 2020 and may require creative solutions to help reach future thresholds (Florida Senate and House of Representatives, 2019).
A more-desirable option for treating food waste is through anaerobic digestion, which diverts the waste from landfills and incinerators, while producing biogas (a mixture of methane and carbon dioxide) and fertilizer as valuable byproducts (Hinds et al., 2017). Management of food waste through anaerobic codigestion is a well-established technology in Europe and has had an increase in popularity in the U.S. (Baere and Mattheeuws, 2015).
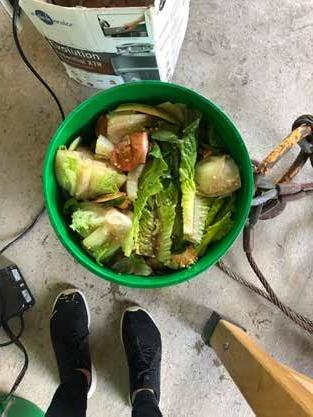
A common attribute of these systems, however, is that they only accept preconsumer waste, such as the waste seen in Figure 1, due to the risk of contamination of postconsumer food waste with nonbiodegradable components, such as single-use plastic tableware and containers (Zhu et al., 2010). Between 15 and 30 percent of postconsumer food is wasted, and 97 percent of this food waste ends up in landfills, which is the least desirable method for food-waste disposal (Trabold and Nair, 2018; “USEPA Food Recovery Hierarchy,” 2016).
In addition, food waste is often not a desirable anaerobic digestion (AD) substrate on its own due to its low carbon-to-nitrogen (C/N) ratio, resulting in a high concentrations of volatile fatty acids (VFA) and free ammonia nitrogen (FAN) in the digester that inhibit methanogenesis (Dixon et al., 2019). Prior studies have shown that codigestion of food waste with high C/N feedstocks, such as yard waste and sewage sludge, results in increased methane yields compared with AD of food waste alone (Lee et al., 2019).
Background
This study grew out of a partnership between the University of South Florida (USF) and TBD Café, a tea wholesaler in Riverview, Fla., which is near Tampa, seeking to form a partnership to divert postconsumer waste from incineration, improve biomethane production from food waste, and prevent contamination of the waste from cafeterias and restaurants normally caused by single-use plastics. The overall goal was to evaluate the effects of AD of food waste, with sugarcane-bagasse (SCB) compostable plates and/or tea leaves at varying mixing ratios.
The SCB is a lignocellulosic-rich waste product of sugar and bioethanol production (Mustafa et al., 2018). For every ton of sugarcane used, between 250 and 280 kg of SCB is produced (Vats et al., 2019). Florida has over 440,000 acres of farmland dedicated to sugarcane growth (Baucum and Rice, 2009). The SCB can be molded into compostable tableware, minimizing bagasse waste and offsetting the use of single-use plastics (Loh et al., 2013).
Prior studies have investigated AD of SCB after pretreatment to allow anaerobic microbes to penetrate the cell wall (Zheng et al., 2014). Vats et al. (2019) codigested acid-treated SCB with food waste at varying ratios. A 1:1 ratio of SCB to food waste resulted in the highest biogas yield of 1,404 ml biogas/g volatile solids (VS) added. Mustafa et al. (2018) reported a maximum methane yield of 220 ml CH4/g VS with alkaline pretreated at 180oC.
The authors recommend a combination of heat and chemical pretreatment to maximize methane yield. Nosratpour et al. (2018) observed a maximum methane yield of 239 ml CH4/g VS with alkaline-pretreated SCB; however, little information is available about anaerobic codigestion of food waste with SCB-based compostable tableware.
The world tea industry is valued at $55 billion; an estimated 30 to 36 bil liters of tea are consumed annually, representing a large volume of tea-leave waste product (Kumar and Deshmukh, 2020). Florida is also looking to tap into the growth of the tea market with tea wholesalers, as well as research the growing market (UF IFAS, n.d.); however, little is known about AD of tea leaves. Goel et al. (2001) investigated AD of tea leaves and did not observe significant methane production without nutrient
Karamjit Panesar is an engineering associate with the Sanitation Districts of Los Angeles County. Ian Atkins is a graduate research assistant and Dr. Sarina Ergas is a professor in the department of civil and environmental engineering at the University of South Florida.
Continued on page 8
Table 1. Biochemical Methane Potential Assay Compositions During Different Experimental Phases
Phase Substrates Mixing Ratioa Inoculum
FW n/a Unacclimated Phase 1 FW+TL 1:1 Unacclimated FW+CP 1:1 Unacclimated Phase 2 FW+TL+CP FW+TL+CP 2:1:1 1:1:1 Acclimated Acclimated a. Food waste (FW), tea leaves (TL), compostable plates (CP) b. Mixing ratio = FW total solids (TS): codigestion substrate TS 6 June 2021 • Florida Water Resources Journal
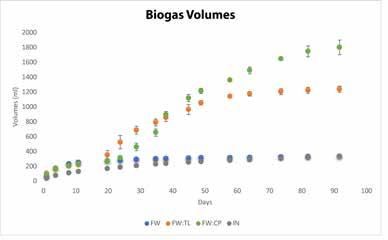
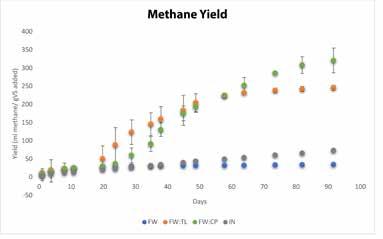
Figure 2. a) Cumulative biogas volume and b) methane yields (normalized to g/volatile solids added) for Phase 1 biochemical methane potential assays.
Continued from page 6 addition. After nutrients were added, the authors achieved a methane yield of 146 ml CH4/g VS.
Materials and Methods
Biochemical methane potential (BMP) assays were set up in the environmental engineering laboratories at USF with varying substrates, codigestion mixing ratios, and inoculum sources (Table 1).
Materials
The food waste was collected from the dining services at USF and processed in an InSinkErator Inc. (Mount Pleasant, Wis.) 350-horsepower garbage disposal. The waste composition varied in different phases due to the differences in waste produced by dining halls. Spent tea leaves were provided by TBD Café and used as received. The tea leaves were a mixture of green, black, and oolong teas, and included flavor additives, such as ginger. The SCB-based molded compostable plates were purchased from Monogram Cleaning Disposables Inc. (Rosemont, Ill.) and cut into ~ 1cm-sized strips using scissors.
Phase 1 inoculum consisted of effluent from a mesophilic AD at a wastewater treatment facility in Clearwater. In order to reduce the lag period, Phase 2 inoculum consisted of 75 percent Clearwater AD effluent and 25 percent digestate from Phase 1 BMPs (referred to as “acclimated” inoculum in Table 1).
Biochemical Methane Potential Assays
The BMPs are described in detail in Panesar (2020). Briefly, BMPs were set up in 250-mL septum-sealed glass serum bottles at a TS content of 2.5 percent and a food-to-microorganisms (F/M) ratio of 1 based on VS BMPs was incubated in a constant temperature room under mesophilic (35ºC) conditions. Each digestion set included three sets of duplicates; inoculum-only controls were also set up in duplicate. Duplicate BMPs were sacrificed for chemical analysis on weeks 1 and 3 and at the end of the assay.
Analytical Methods
Standard Methods (APHA, 2018) was used to measure methane content (6211-C), TS, VS (2540), soluble COD (sCOD; 5200), VFA (5560D) and alkalinity (Alk:2320-B). Biogas volume was measured using a frictionless glass syringe. Ammonia concentrations were measured using a Timberline (Boulder, Colo.) TL-2800 Ammonia Analyzer. Samples for COD, VFA, pH, alkaline, and ammonia were first centrifuged at 9800 revolutions per minute (rpm) for 20 minutes, and then filtered through a 0.45 µm glass filter prior to testing. Statistical analysis was done using a twotailed t-test with a 95 percent confidence interval. Analysis of the covariance (ANCOVA) with a 95 percent confidence interval was also done on the methane yields over time to see if there was a difference in the methane yields of the BMPs.
Table 2: Final Chemical Analysis Results for Phase 1 Biochemical Methane Potential Assays
Digestion VS Final pH Ammonia VFA:Alk Methane CH4 Yield Set Reduction (mg/L) Ratio Quality (ml CH4/g (%) (%) VS)
Inoculum 54.8±0.2 8.96±0.02 864±174 0.015±0.009 51±27 73±0.0 FW 40.7±0.1 5.06±0.07 862±33 2.12±0.10 39±8 35±4.9 FW+TL 62.4±3.0 8.99±0.03 371±14 0.017±0.001 63±15 246±6.7 FW+CP 60.6±2.5 8.91±0.04 523±14 0.035±0.003 57±15 322±34.1
Results and Discussion
Anaerobic Digestion of Food Waste Alone and Codigestion with Tea Leaves or Compostable Plates
During Phase 1 a comparison was made of AD with food waste alone and with codigestion of food waste with either tea leaves or compostable plates at a 1:1 mixing ratio over a 92-day period (Figure 2 and Table 2). Digesters with food waste alone achieved a 40 percent VS reduction, but a very low methane yield (35 mL CH4/g VS), which was lower than inoculum-only controls (73 mL CH4/g VS). The low final pH and VFA:Alk (Table 2) indicate that the rate of fermentation exceeded the rate of methanogenesis, resulting in almost complete inhibition of methanogenic activity.
In contrast with food waste alone, significantly higher methane yields were achieved for food waste and tea leaves (246 mL CH4/gVS) and food waste and compostable plates (322 mL CH4/g VS). The food waste and tea leaves had a slightly higher, but not significantly different, methane quality than food waste and compostable plates (Table 2). The large standard deviations in methane quality can be attributed to the slow growth rate of the methanogens at the beginning of digestion (2017).
Both Phase 1 codigestion sets achieved similar VS reduction (Table 1). The tea leave or compostable plate addition brought the pH, VFA:Alk, and ammonia concentrations to the healthy range for methanogens (2017). Note that long lag periods were observed prior to the onset of rapid biogas production for both food waste and tea leaves (21 days) and food waste and compostable plates (30 days), indicating that substrate pretreatment or inoculum acclimation has the potential to accelerate the onset of biogas production (2019). Continued on page 10
Continued from page 8 In addition, biogas production for food waste and compostable plates did not stabilize over the 92day digestion period, indicating that more biogas production was possible.
The results indicate that codigestion of food waste with high C/N substrates, tea leaves, or compostable plates can increase biomethane production. Similar results were reported in other studies of food-waste codigestion with yard waste or sewage sludge (2017). Goel et al (2001) were only able to achieve high methane yields from tea leaves when nutrients were added, indicating that food-waste addition provided nutrients for tealeave digestion.
Effect of Mixing Ratio on Codigestion of Food Waste, Tea Leaves, and Compostable Plates
Phase 2 BMPs were carried out for 88 days with food waste:tea leaves:compostable plates at mixing ratios of 1:1:1 and 2:1:1 (Figure 2 and Table 3). The cumulative methane yield for food waste:tea leaves:compostable plates 1:1:1 (264 ml CH4/g VS) was significantly higher than for food waste:tea leaves:compostable plates 2:1:1 (45 ml CH4/g VS). Although both digestion sets achieved similar VS reduction, the lower food-waste content digestion set had a higher pH and a VFA:Alk ratio in the healthy range for methanogenesis (Table 3).
In contrast to Phase 1, ammonia concentrations were similar in all digestion sets, most likely due to the varying composition of the food waste (2020). Methane quality for food waste:tea leaves:compostable plates 1:1:1 was between 60 and 70 percent, indicating good methanogenic activity. Although 25 percent of the inoculum used in Phase 2 was digestate produced in Phase 1 codigestion sets, a 20-day lag period was still observed prior to rapid onset of methane production (Figure 2), which was similar to food waste:tea leaves in Phase 1 (Figure 1). Further long-term continuous AD studies are needed to understand the effect of microbial acclimation on methane production with tea leaves and compostable plates.
Conclusion
Anaerobic codigestion of food waste with either compostable plates or tea leaves increased methane yields compared with AD of food waste on its own. Codigestion of high C/N substrate with food waste prevented inhibition by VFA and ammonia accumulation. Codigestion of food waste with both tea leaves and compostable plates resulted in high biomethane production when the ratio of food waste:tea leaves:compostable plates was maintained in the correct range.
The results indicate that food waste, tea leaves, and SCB-based compostable tableware can be collected from restaurants and cafeterias as a single-waste stream, avoiding the need to separate these materials prior to AD. The project also demonstrates a successful collaboration between a university and nearby industry to divert organic waste from landfills and incineration and improve bioenergy production.
Table 3. Final Chemical Analysis Results for Phase 2 Biochemical Methane Potential Assays
Digestion VS Final pH Ammonia VFA:Alk Methane Methane Set Reduction (mg/L) Ratio Quality Yield (%) (%) (ml CH4/g VS)
Inoculum BD 8.06±0.02 32.46±9.72 0.0185±0.001 34±12 65.0±0.9 FW:TL:CP 63.7±1.7 7.86±0.02 39.95±0.17 0.0786±0.0004 36±2 279±1 1:1:1 FW:TL:CP 66.1±8.9 4.84±0.01 46.21±1.60 4.57±0.008 46±9 59.5±4.1 2:1:1
Acknowledgments
Research reported in this article was supported by grant P200A180047 from the U.S. Department of Education Graduate Assistance in Areas of National Need (GAANN) program and the University of South Florida Student Green Energy Fund (SGEF). The authors would also like to thank the staff at the TBD Café, USF Dining Services, USF Facilities, and USF Athletics.
Data Availability
Datasets related to this article can be found at https://scholarcommons.usf.edu/etd/8274/.
References
• APHA, 2018. Standard Methods for the
Examination of Water and Wastewater. Water Res. 16, 1495–1496. https://doi.org/10.1016/00431354(82)90249-4. • Baere, L. De, Mattheeuws, B., 2015. Anaerobic
Digestion of the Organic Fraction of Municipal
Solid Waste in Europe. Status, Exp. Prospect. – 517–526. • Baucum, L.E., Rice, R.W., 2009. An Overview of
Florida Sugarcane. North 1–8. • Dixon, P.J., Ergas, S.J., Mihelcic, J.R., Hobbs,
S.R., 2019. Effect of Substrate to Inoculum Ratio
Biogas Volumes
0 10 20 30 40 50 60 70 80 90 100 Days
FW:TL:CP 2:1:1 FW:TL:CP 1:1:1 IN Methane Yield
Methane Yield (ml methane/ g VS added) 300
250
200
150
100
50
0
0 10 20 30 40 50 60 70 80 90 100 Days
FW:TL:CP 2:1:1 FW:TL:CP 1:1:1 IN


