35 minute read
Monochloramine Disinfection for Alternative Water Supplies—Sean P. Menard and Thomas W
FWRJ Monochloramine Disinfection for Alternative Water Supplies
Sean P. Menard and Thomas W. Friedrich
Advertisement
Aquifer recharge, including aquifer storage and recovery (ASR), aquifer recharge (AR), and managed aquifer recharge (MAR), has become an important component of alternative water supply projects. The water sources available as options for AR projects include potable water, reclaimed water, stormwater, and raw surface water. The level of pretreatment (prescreening, physical/ chemical, biological treatment, filtration) and final disinfection is determined by the aquifer type (greater than 10,000 total dissolved solids [TDS] or less than 10,000 TDS), the end use, and the Florida Department of Environmental Protection (FDEP) regulatory requirements.
Monochloramine is a combined chlorine disinfectant that is being increasingly used in the municipal wastewater industry; it’s also being evaluated to treat stormwater and/or surface water before discharge to AR wells or aquifer storage and recovery wells. Wastewater facilities that have final effluent and/or reclaimed water quality requirements limiting the level of total trihalomethanes (TTHMs) and haloacetic acids (HAA5) are evaluating the feasibility of converting to the monochloramine process as a stable total chlorine disinfectant to mitigate the formation of disinfection byproducts (DBPs), while still meeting disinfection requirements for total and fecal coliforms. An added benefit is a reduction in free chlorine demand and a corresponding decrease in the total chemical use and cost for disinfection.
Jones Edmunds has had the opportunity over the past several years to work with multiple Florida-based clients to evaluated adding a monochloramine disinfection system to a facility to begin disinfecting raw water or to replace and optimize an existing disinfection system for more-efficient wastewater treatment.
In recent years, clients have requested that monochloramine disinfection be implemented in a facility before the effluent enters recharge wells as an optimized method of disinfection that will reduce DBPs and fecal or total coliforms, and will be stable to preserve the water in the aquifer without harm to a future water resource.
The key purposes of implementing these monochloramine projects have been to address the following challenges before sending water to the AR wells or sending excess reclaimed water to a surface water outfall: S Reducing TTHMs, HAA5, dibromochloromethanes (DBCMs), and dichlorobromomethanes (DCBMs). S Meeting the required reduction of fecal coliforms and total coliforms. S Reducing chlorine demand and subsequent sodium hypochlorite chemical use and reducing overall operational costs due to reduced dosing requirements and morestable total chlorine residual.
This article highlights the consulting firm’s approaches (completed and pending) to address a client’s individual challenges on a project and corresponding coordination used to implement the monochloramine into new and existing disinfection systems, including: S Monochloramine Formation Approaches S Key Components of Retrofitting a
Monochloramine Design to an Existing
System S Client Coordination and Communication S Specific Equipment Analysis S Discussion of Chemical Maintenance
Requirements S Findings, Results, Conclusions, and
Recommendations of Improvements
Regulations—current and pending—will also be discussed, and program costs (capital and operation and maintenance [O&M]) that are related to these projects are summarized.
Client Backgrounds
City of St. Cloud
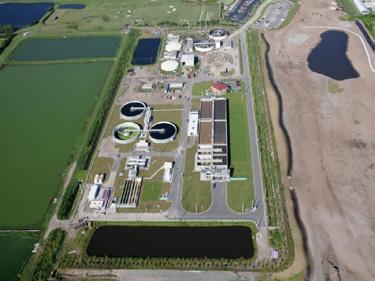
The City of St. Cloud owns and operates the Southside Water Reclamation Facility (WRF), which is a Modified Ludzack-Ettinger (MLE) process with effluent disk filtration and high-level disinfection that currently treats approximately 3.75 mil gal per day (mgd) average annual daily flow (AADF) of wastewater from the city, which has a population of approximately 50,000. The WRF is permitted for a design AADF of 7.6 mgd. The WRF is designed to produce water for 100 percent unrestricted public access reuse, with no alternative disposal methods. A 95-milgal (MG) reclaimed storage pond and 29-MG reject storage ponds, along with a 20-mgd high-service pump station, are located at the wastewater treatment facility (WWTF).
Sean P. Menard, P.E., CDT, ENV SP, is an engineer and department manager, and Tom Friedrich, P.E., BCEE, is a vice president with Jones Edmunds & Associates Inc. in Tampa.
City of St. Cloud Southside Water Reclamation Facility
A Class V, Group 3 injection well, and associated monitoring wells, were permitted and constructed onsite from 2014 through 2017. The goal of the Southside injection well—through the injection of excess reclaimed water—is to offset wet season storage volume concerns (overflow of storage ponds), protect the impacted aquifer, and eliminate unpermitted discharges of reclaimed water from the ponds. The injection well permit requires that only reclaimed water be injected into the well. Water not meeting Chapter 62610, Florida Administrative Code (FAC), Part III, unrestricted public access reuse water standards cannot be injected.
The city’s injection well was permitted for construction and testing and placed into operation July 2017. The injection well is constructed into the lower portion of the Avon Park Formation within the Lower Floridan aquifer (LFA) with a 14 in. steel casing set to approximately 300 ft below land surface (bls). The well transitions to a 12-in.-diameter steel casing set to approximately 1,652 ft bls,
an open-hole interval of a nominal 15-in.diameter from 1,652 ft bls to 2,000 ft bls, and a nominal 11-in.-diameter hole from 2,000 ft bls to 3,060 ft bls, as shown in Figure 1.
The Class V, Group 3 injection well has a permitted capacity of 2 mgd AADF and is permitted to achieve up to a maximum instantaneous injection rate of 4.87 mgd, which is based on a velocity of 10 ft per second in the final casing, with an inside diameter of 11.75 in. The background TDS concentration of the top of the injection zone was over 3,000 mg/L. The injection well is completed in the LFA, a zone that has a concentration greater than 3,000 mg/L, and the lower portion of the injection zone contains groundwater that is similar to seawater in TDS concentrations.
The injection well operation permit application was submitted in May 2020 and is currently under review for approval before this injection well system will be considered fully operational.
During the testing period and data submittal, the TTHMs and HAA5 were found to be at low concentrations in the injection well system’s monitoring well data, but above the primary drinking water maximum contaminant level (MCL) for TTHMs at 80 micrograms per liter (µg/L) and HAA5 at 60µg/L in the reclaimed water before injection into the wellhead. To mitigate these DBPs before they are routed to the injection well, the city evaluated the feasibility of converting the facility’s primary disinfectant from free chlorine (sodium hypochlorite) disinfection to monochloramine (combined chlorine) disinfection. This project included benchscale testing and extended pilot testing of a full-scale monochloramine system. The city is currently implementing a full-scale, automated monochloramine system, which will be discussed later.
City of Bradenton
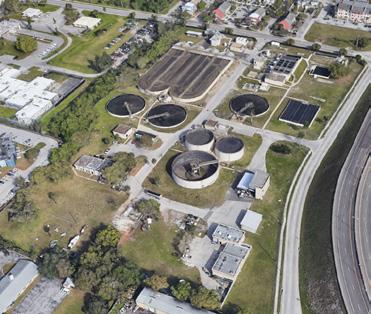
City of Bradenton Advanced Wastewater Treatment Facility
The City of Bradenton owns and operates an advanced WWTF that uses Carrousel oxidation ditches with deep bed denitrification filters with high-level disinfection to produce Part III reclaimed water for customers. It discharges excess dechlorinated reclaimed water into the lower Manatee River and lower Tampa Bay through the WWTF outfall. The facility currently treats approximately 6.5 mgd of wastewater from the city, with a population of approximately 66,000.
The WWTF is currently permitted for the construction of a Class V, Group 3 recharge well to be installed onsite. The goal of the WWTF recharge well, through the injection of the treated reclaimed water, is to provide an environmental benefit of reduced nutrient loading to the lower Tampa Bay Estuary to reduce total nitrogen and to help restore aquifer levels in the most impacted area (MIA) within the Southern Water Use Caution Area (SWUCA), while benefiting citizens by processing variable wastewater flows and treating these flows to a quality that will protect the aquifer for future alternative water supplies.
The city undertook its recharge well project primarily to provide an achievable, measurable benefit for recharge to the MIA through the rise in elevation of the potentiometric groundwater surface of the Upper Floridan aquifer (UFA) to help restore aquifer levels, while also supplementing the storage capacity of the treated effluent during the seasonal wet periods.
The city’s recharge well has been permitted for construction and testing as of April 2019, Continued on page 26
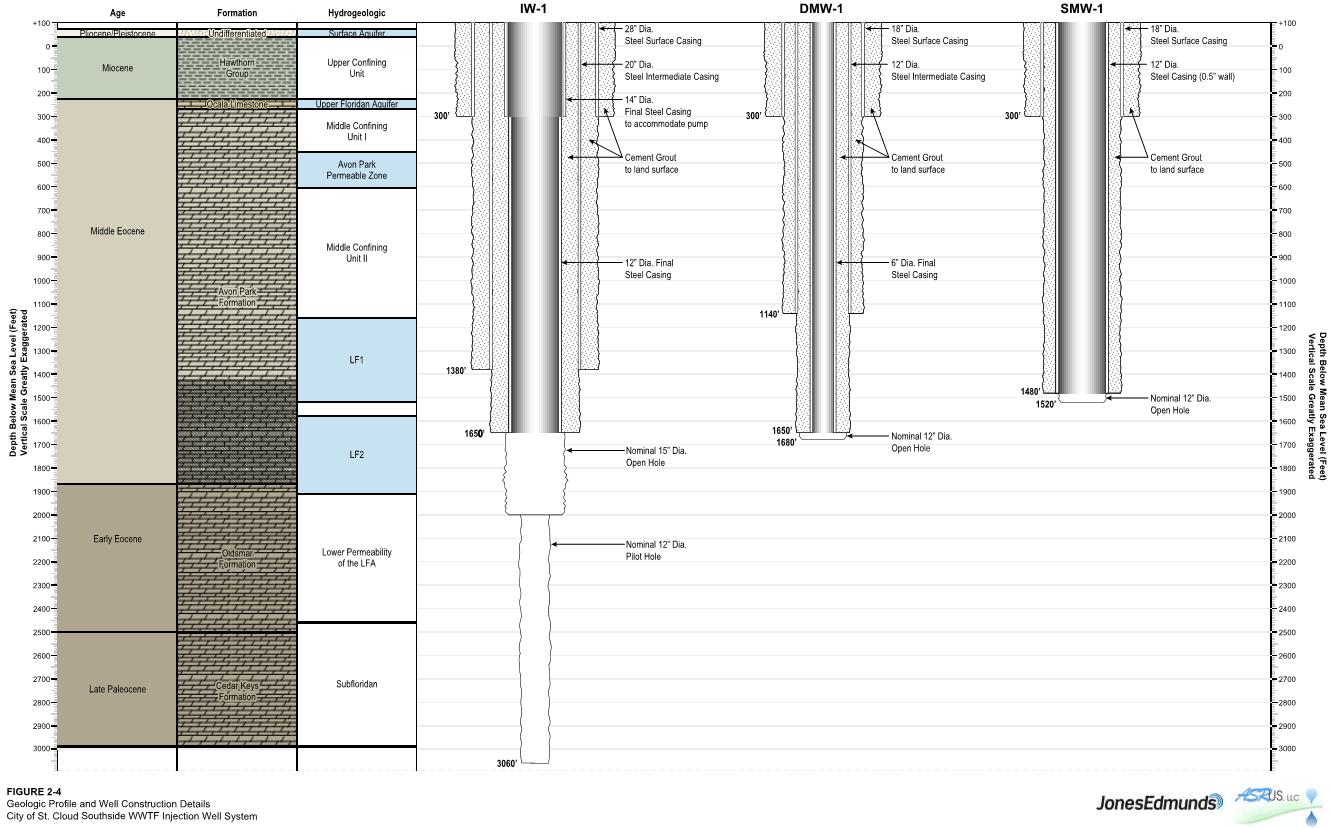
Figure 1. St. Cloud Injection Well (IW-1) Construction Diagram
Continued from page 25 but is still awaiting Water Management District cooperative funding and has not been constructed. The injection well is proposed to be constructed into the Avon Park Formation within the UFA, and the recharge well is expected to be 24 in. in diameter and cased to approximately 900 ft bls with an open-hole interval from 900 ft bls to 1,500 ft bls, as shown in Figure 2.
The Class V, Group 3 recharge well is designed to receive an average of 10 mgd of reclaimed water flow and will be capable of receiving instantaneous flows of 18.6 mgd. The design intent is to locate the well in a zone that has a TDS concentration greater than 3,000 mg/L. This is targeted as a suitable zone based on regulatory standards (principal treatment versus full-treatment requirements) for discharge of reclaimed water to groundwater, as outlined in Chapter 62-610, FAC.
The city’s outfall discharge to the Manatee River, a Class III marine water, has discharge limit requirements for two of the trihalomethane (THM) DBPs: DBCM and DCBM. Before the oxidation ditch mechanical aerators were upgraded with variable frequency drives (VFDs), dissolved oxygen (DO), and an ammonia-based control system, the WWTF historically had low-level ammonia bleed that, when blended with a free chlorine residual, promoted the formation of chloramines.
The city observed that the DBCM and DCBM were always in compliance with the stringent discharge effluent discharge limits; however, following the 2018 oxidation ditch improvements, the WWTF, now completely nitrified with effluent ammonia levels at or below 0.1 mg/L and without the low-level ammonia present, had free chlorine disinfection that produced DBCM and DCBM levels above the surface water discharge limits.
To meet the surface water discharge standards for DCBM and DBCM, the Revised Code of Washington (RCW) annual testing for primary and secondary drinking water standards for TTHMs and HAA5 is used to uphold the drinking water standards when operating an AR well under the Underground Injection Control (UIC) permit. The city is converting its facility’s public access reuse water from a free chlorine (sodium hypochlorite) disinfection system to a full-scale, automated monochloramine (combined chlorine) disinfection system. This project included a temporary monochloramine system already in place being converted to a full-scale, automated system, which will be discussed later.
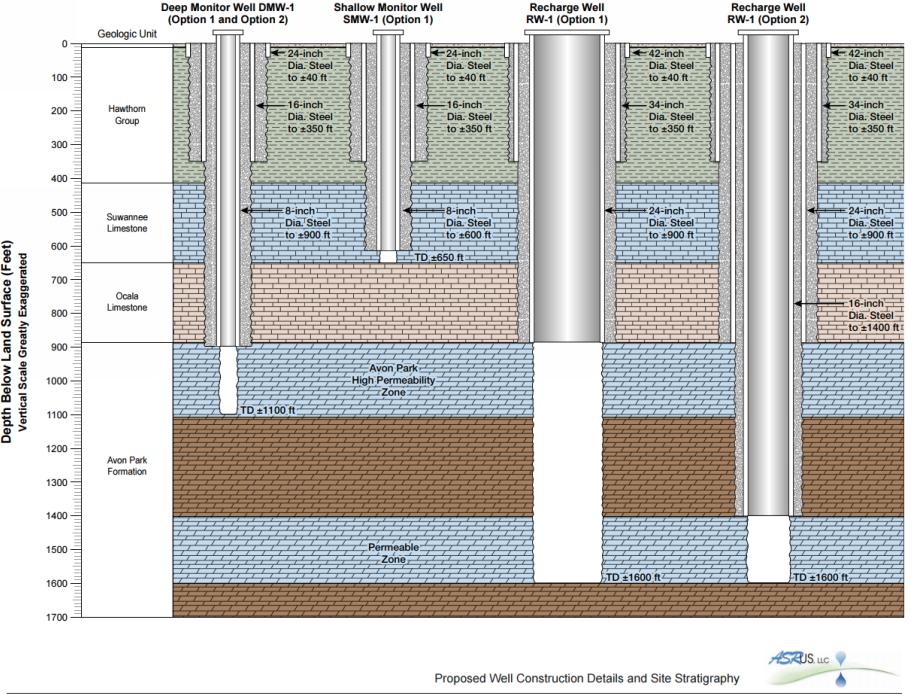
Figure 2. Bradenton Recharge Well (RW-1 Option 1) Construction Diagram
Southwest Florida Water Management District
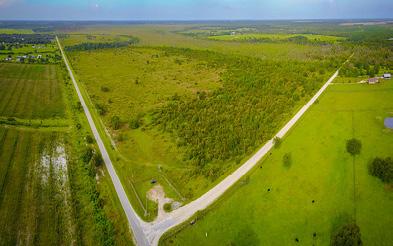
Aerial of Flatford Swamp Used for Aquifer Recharge Project Continued on page 28
Continued from page 26
The Southwest Florida Water Management District is constructing an AR well that is designed to convey between 0.5 and 2 mgd of surface water from the Myakka River and recharge it into a Class V Group 2 AR well. The goal of the recharge well program— through the injection of the recharge water— is to offset dry season reservoir withdrawals, protect the primary source water (the Myakka River), prevent or slow saltwater intrusion, and improve natural water systems in the area through the managed AR well.
The district undertook the AR well program primarily due to environmental damage, such as tree mortality in the 4.5-sqmi wetland area of Flatford Swamp, which the district owns within the Upper Myakka River Watershed, approximately 3 mi east of the MIA of the SWUCA.
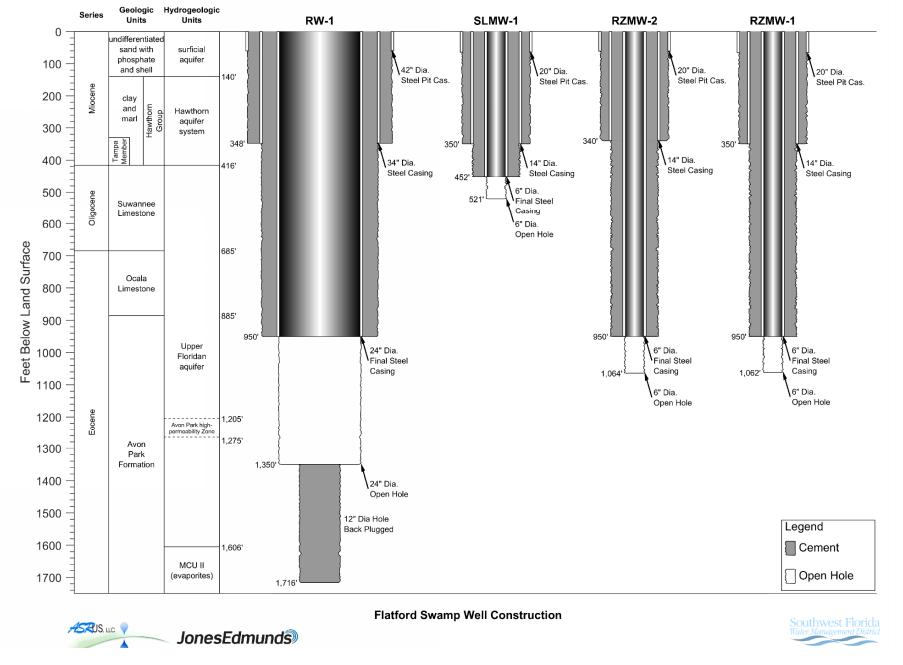
The district’s recharge well was permitted for construction and testing as of February 2017 and constructed in March 2019. The surface facilities of the well are currently being completed and were placed into operation for testing at the end of 2021. The recharge well is constructed into the Avon Park Formation within the UFA with a 24 in. steel casing set to approximately 950 ft bls, and an open-hole interval of a nominal 24-in. in diameter from 950 ft bls to 1,350 ft bls, as shown in Figure 3.
The Class V, Group 2 injection well is designed for a daily recharge capacity of between 0.5 and 2 mgd AADF. The background TDS concentration of the recharge zone is 1,520 mg/L; however, almost no primary drinking water standards were above their respective MCLs in the background water quality of this zone.
The district originally had a permit from FDEP’s UIC group that allowed the use of a zone of discharge (ZOD) for meeting primary and secondary drinking water standards. Since the construction of the well, FDEP has communicated that a ZOD for primary drinking water standards may no longer be a regulatory option for this recharge well system and disinfection must now be applied before going down the well. The district is coordinating the construction of the additional disinfection system to the already constructed well system since FDEP has changed its position. The district is constructing a monochloramine disinfectant system for the surface water from the Myakka River to prevent creation of DBPs, while still reducing fecal coliforms and total coliforms below the limits before injection into the wellhead.
Monochloramine Formation Background
As chlorine is mixed in water, the various bacteria, viruses, and other compounds that can be oxidized by free chlorine create a chlorine demand and will actively reduce portions of the free chlorine that have not already bonded with the ammonia source. This process results in a zero chlorine residual until the demand has been satisfied. Initial testing is recommended to determine this demand as part of implementing the full-scale design of any monochloramine application, since the demand encountered will be specific to each facility and will impact the dosing rates. After the initial free chlorine demand is met, the additional remaining chlorine that was added will combine with the ammonia to form monochloramine. This formation will continue as long as free ammonia is present in the water.
To properly form monochloramine, the chlorine and ammonia must be dosed at the correct quantities to ensure that excessive free ammonia is not present, as this could result in exceeding effluent nitrogen limits, and to ensure that excessive free chlorine is not present, as this could begin impairing the chloramine formation. The proper chemical dosing rates for chloramine formation are commonly referenced regarding the ratio of chlorine to ammonia being dosed. A ratio of 4.5 to 5 parts of chlorine for every part of ammonia has historically been shown to most commonly form proper monochloramine. The molecular weight of ammonia is 17 compared to the molecular weight of nitrogen, which is 14; therefore, the ratio is used interchangeably as Cl:NH3 or as Cl:N. Monochloramine formation is also pH-dependent, with optimum formation at pH 8.5. A pH range of 7 to 9 is recommended for proper monochloramine formation.
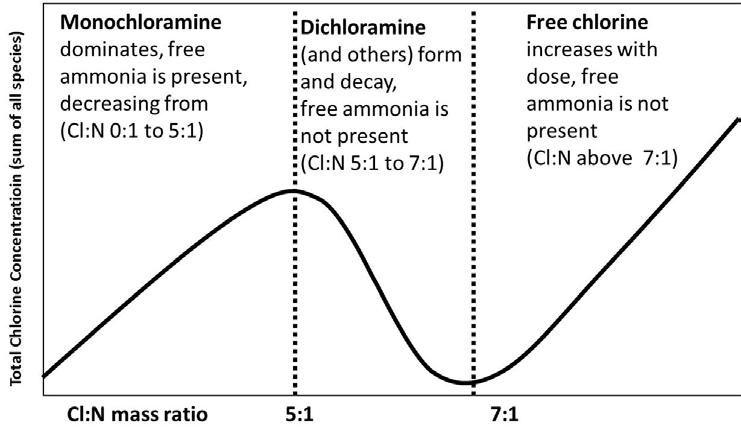
Figure 4 shows the breakpoint curve. This phenomenon shows the chloramine formation as it changes regarding the addition of a chlorine source, thereby increasing the chlorine-to-ammonia ratio. The peak and initial drop shows that, after a certain dosing ratio, the addition of more chlorine will begin to “burn off” the combined chlorine residual by converting the monochloramine formed to dichloramine. Although not necessarily harmful, dichloramine is most recognized by its foul taste and odors and does not provide appropriate disinfection.
The valley and initial rise in Figure 4 show that, as more chlorine continues to be added, increasing the chlorine-to-ammonia ratio further, the chlorine residual continues to lower until the breakpoint is reached. After this point, when all of the monochloramine has been burned off by converting to dichloramine and finally trichloramine, which dissipates quickly from water, the addition of chlorine will start to increase the chlorine residual at the standard rate expected of a hypochlorite-disinfection system.
As a result, the desired chemical dosing ratio is to stay close to the range of 4.5:1 to 5:1 to optimally form monochloramine without beginning the burn-off process. This dose is most optimally noted during sampling by the presence of no free chlorine residual, while containing a small free ammonia residual. This residual is ideally in the range of 0.1 mg/L or less, showing that not all of the free ammonia in the water reacted with the dosed free chlorine (causing a zero free ammonia reading) and that no excess of free ammonia existed, causing high nitrogen readings in the effluent.
The chemical reactions of sodium hypochlorite and ammonium sulfate
mixtures forming monochloramine allow the theoretical doses needed for the formation to be determined. Each project for each client requires careful evaluation and calculation of the appropriate doses of each of the chemicals to form monochloramine at differing flow rates (the diurnal pattern) observed at many municipal WWTFs.
Part of this evaluation typically includes the expected dosing rates for the WWTF’s minimum average daily flow (MinADF), current AADF, maximum average daily flow (MADF), design AADF, and peak daily flow (PDF), respectively. The MinADF is often estimated as 0.3 times the current AADF, the rated AADF is based on the latest permit value, the PDF is estimated as the peaking factor (often three) times the current AADF, and the other rates are based on historical flow data. All values are often rounded up to the nearest 0.25 mgd for preliminary evaluation.
Although the chemical dosing rates are theoretically accurate, unknown demands in the wastewater and other variables are related to dosing location separation, pump stroke lengths, and similar items that require proper preliminary testing to refine the dosing rates before implementing a full-scale design.
The primary benefits of using monochloramine disinfection over hypochlorite disinfection are: S Monochloramine is a more-stable disinfectant than free chlorine. S As a stable disinfectant, less demand impact occurs between the dosing point and the residual reading, often resulting in much lower chlorine use and reduced chemical costs. S Monochloramine is a combined chlorine and is measured as a total chlorine residual, which has been shown to reduce common
DBPs, such as TTHMs, HAA5, DBCMs, and DCBMs, by reducing the amount of excess chlorine introduced into the system.
Although chemical stability and reduced operating costs are ideal, the reduction of the DBPs is very important for the application of municipal WWTFs producing reclaimed water using any form of discharge well and/or surfacewater discharge. The TTHMs are produced by the reaction of chlorine and organic materials in the wastewater effluent and can be controlled several different ways, with varying process, capital, and operational cost considerations. Based on experience with similar WWTFs, the most cost-effective method of TTHM control at a facility that uses sodium hypochlorite for disinfection is to use sequential chlorination with ammonia for chloramination to mitigate DBP formation. This process produces a combined chlorine residual that inhibits TTHM formation.
The chloramination process involves applying chlorine and ammonia to water to produce a combined available chlorine residual (chloramine) that inhibits TTHM formation. This reduction is directly related to meeting the RCW annual testing for primary and secondary drinking water standards (Rule 62-550.310, FAC, and Rule 62-550.320, FAC) of ≤80 µg/L for TTHMs and ≤60 µg/L for HAA5. Most municipalities with wells are also responsible for upholding the drinking water standards when operating a well under a UIC operating permit; therefore, mitigating the formation of DBPs is essential for operating any of these systems.

Figure 5. St. Cloud Injection Well and Monitoring Wells
Monochloramine Designs of Each Facility
The key components of evaluating each facility for retrofitting or constructing a new monochloramine system primarily include the following: S Monochloramine Formation Approaches S Coordination of the Existing System to
Determine any Retrofitting Approaches S Client Coordination and Communication S Specific Equipment Analysis S Discussion of Chemical Maintenance
Requirements S Findings, Results, Conclusions, and
Recommendations of Improvements
Regulations, current and pending, will also be discussed, and program costs (capital and O&M) related to these projects are summarized.
Monochloramine Formation Approaches
The formation of monochloramine may not be ideal in many situations, and the water quality of the liquid intended to be dosed should be carefully evaluated before monochloramine disinfection is considered. Low pH environments are not conducive to stable chloramine formation. Expected flow ranges should be evaluated to verify that the equipment can handle the full range of expected flows. Background chlorine demand will likely prioritize chlorine reaction before the ammonia source and should be evaluated to determine the required base chlorine levels to be dosed before the Cl:N dosing ratio. Background ammonia available in the source water may be usable in the chloramine formation and should be evaluated to determine the required base ammonia levels, which may already exist before additional dosing to meet the Cl:N dosing ratio.
As discussed earlier, each of the example project facilities had to assess whether retrofitting a monochloramine design was possible or if a new monochloramine design had to be created in its entirety. The St. Cloud and Bradenton facilities had existing chlorine disinfection onsite in the form of 12.5 percent liquid sodium hypochlorite, which promoted Continued on page 30
Continued from page 29 the use of that equipment as the chlorine source in the monochloramine formation. The Flatford facility had no source disinfection and required pH adjustment of the source water (raw water in the range of 6.5 pH, where greater than 8 is conducive to chloramine formation), as well as the chlorine and ammonia source chemical.
St. Cloud Pilot Study
Jones Edmunds coordinated with FDEP for the approval of a two-month pilot test between Feb. 13 and April 13, 2020, to demonstrate the effectiveness of monochloramine as an alternative disinfection method and to maintain reduced TTHM and HAA5 levels in the St. Cloud Southside effluent as part of demonstrating the constructability and testing of the installed wells. Figure 5 shows the final well construction diagram for the injection well and associated monitoring wells.
The city has an analyzer building where continuous samples of its permitted effluent, before disinfection (EFB,) its flash mixer (where chemical dosing occurs), and its permitted effluent after disinfection (EFA), are hydraulically fed. All samples and measurements were obtained from this source. The existing hypochlorite tanks and pump skids were used for the chlorine source, and the city had a 300-gal ammonium sulfate tote and a spare peristaltic pump for the ammonia source.
As part of the FDEP-approved pilot study, the WWTF connected the ammonium sulfate tote and spare in-house peristaltic pump to the disinfection system. Piping was already installed to convey ammonium sulfate to a dosing location adjacent to the hypochlorite dosing point and immediately upstream of the flash mixer to allow almost instantaneous mixing of chlorine and ammonia sources after dosing. The flash mixer promotes uniform mixing of the chemicals for the formation of monochloramine. When the pilot was initiated, the pump was set at the same flow-paced signal as the hypochlorite feed pumps and at a lower dosing ration, but did not have an automatic residual trim.
Monochloramine, free ammonia, and total chlorine measurements were recorded from the sample lines, and sodium hypochlorite and/ or ammonium sulfate doses were adjusted to achieve desired monochloramine levels.
The existing hypochlorite and ammonia pumps were manually set to pump at chemical feed rates generally in accordance with the dosing rates required at the variable flow rates of the diurnal pattern of the facility, but were adjusted based on the different live flow rates at the time of testing. The dosing rates were calculated using the chemical equations and molar ratios of the process.
The total volume of the one chlorine contact tank online during the pilot was calculated to be approximately 190,300 gal using the dimensions of the tank (106 ft x 8 ft x approximately 10 ft) with three trains. The contact time was calculated based on the live flow rate at the time when the initial dose was set. Another sample was taken from the EFA location at that time to determine the effective residual.
One sample of EFB and one sample of EFA were taken after the chemical doses were set. The jars were appropriately labeled, and the following details were noted: S The time the sample was taken. S The current plant flow (mgd). S The estimated residual time (calculated after the dose start based on the flow meter reading). S The time range between residuals as dosing pumps change. S The ratio of chlorine to ammonia (e.g., 4.5:1, 5:1, etc.).
After the samples were collected, they were tested for monochloramine and free ammonia using the city’s Hach DR 850 analyzer and for total chlorine using the supervisory control and data acquisition (SCADA) total chlorine analyzer. Modifications were made to the analyzer so that it could be used to perform the monochloramine and free ammonia tests. The city used a CLX analyzer for the flash mixer and a CL17 analyzer for the residual.
The ammonium sulfate and sodium hypochlorite doses were adjusted based on the test results according to these guidelines: S If monochloramine was low and free ammonia was 0 mg/L NH3 – N, this implied that all of the ammonia was being used to form monochloramine and the
CL:N ratio was greater than 5; therefore, an increase in ammonium sulfate was needed. S If monochloramine was low and free ammonia was greater than 0.1 mg/L NH3 – N, this implied that all of the chlorine was being used to form monochloramine and the
CL:N ration was less than 5; therefore, an increase in sodium hypochlorite was needed. S If monochloramine was low and free ammonia was between 0 mg/L NH3 – N and 0.1 mg/L NH3 – N, this implied that the CL:N was in the appropriate range, but at too low a dose; therefore, an increase in sodium hypochlorite and ammonium sulfate was needed at the same ratio.
An additional sample of EFB and EFA was taken after the estimated contact time was achieved to record the residual. The process of testing the samples and adjusting chemical dosing rates was to be repeated until the desired ammonium sulfate dosing ratio and monochloramine levels were achieved.
Based on the pilot study, approximately 1,200 gal of ammonium sulfate were used across the two-month period. The ammonium
sulfate pump used for the pilot had to be turned down to the minimum ranges.
Free ammonia and monochloramine monitoring has continued to be performed with manual Hach test kits through the pilot since it started in spring 2020. As a result, the ratio of ammonia to chlorine cannot be continuously controlled or adjusted to reduce excess free ammonia at all points throughout the day, resulting in underdosing or overdosing ammonia since the flow varies diurnally over a typical 24-hour period. In addition, the ability to remotely monitor or control this system is not available through SCADA. Facility staff takes manual monochloramine and free ammonia samples one to two times daily.
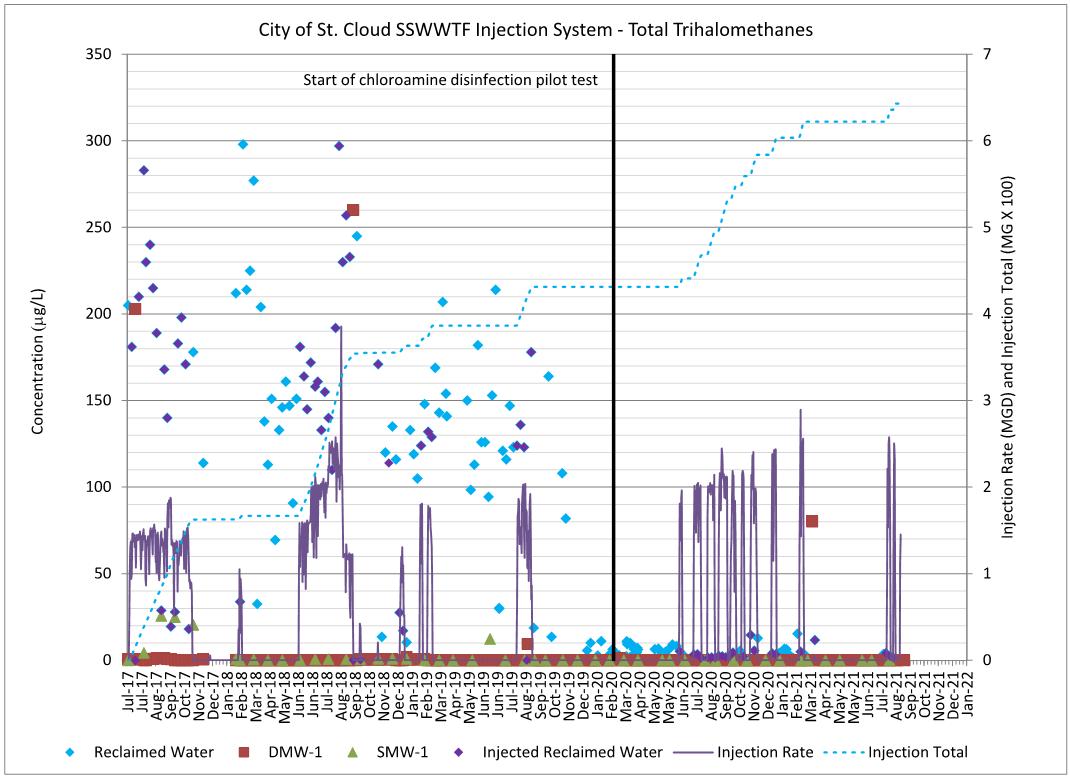
Extra samples were taken of the DBPs during pilot testing. The samples taken have shown consistent, reduced levels of TTHMs and HAA5, while meeting fecal and total coliform requirements. The highest TTHM value observed from these samples was 10.9 µg/L and the highest HAA5 was 31.5 µg/L, well below the respective 80 µg/L and 60 µg/L limits. Total coliforms remained below four colony-forming units (CFU)/100 mL and all fecal coliform samples yielded nondetect values. In addition, the total chlorine residual has shown an increased stability, resulting in minimized disinfection rejection events since the monochloramine disinfection began. The graph in Figure 6 shows historical water quality.
Figure 6 also displays the TTHMs of the reclaimed and injected water into the St. Cloud injection well. This also contains information on the monitoring wells and the total stored volume of water recharged into the injection well. Background samples were collected for nearly three years, since the well was first put into operation after construction and before the monochloramine pilot was put into place, providing baseline conditions for the system. The water in the facility had a maximum TTHM of almost 300 µg/L before the operation of the monochloramine system. The figure shows that the TTHM values began declining generally, but the monochloramine pilot has not reached any value of 20 µg/L or greater (less than a quarter of the limit) in almost a year and a half of its operation.
Figure 7 displays the HAA5 of the reclaimed and injected water into the St. Cloud injection well; this also contains information on the monitoring wells and the total stored volume of water recharged into the injection well. Background samples were collected for approximately nine months before the monochloramine pilot was put into place, providing baseline conditions for the system. The water in the facility had a maximum HAA5 of almost 300 µg/L before the operation of the monochloramine system. The figure shows that the HAA5 values since the monochloramine pilot have not reached 60 µg/L or greater (remaining under the limit), except for one occasion in the almost year and a half of its operation.
Figure 8 displays the fecal coliforms of the reclaimed and injected water into the St. Cloud injection well. This also contains information on the monitoring wells and the total stored volume of water recharged into the injection well. Background samples were collected for nearly three years since the well was first put
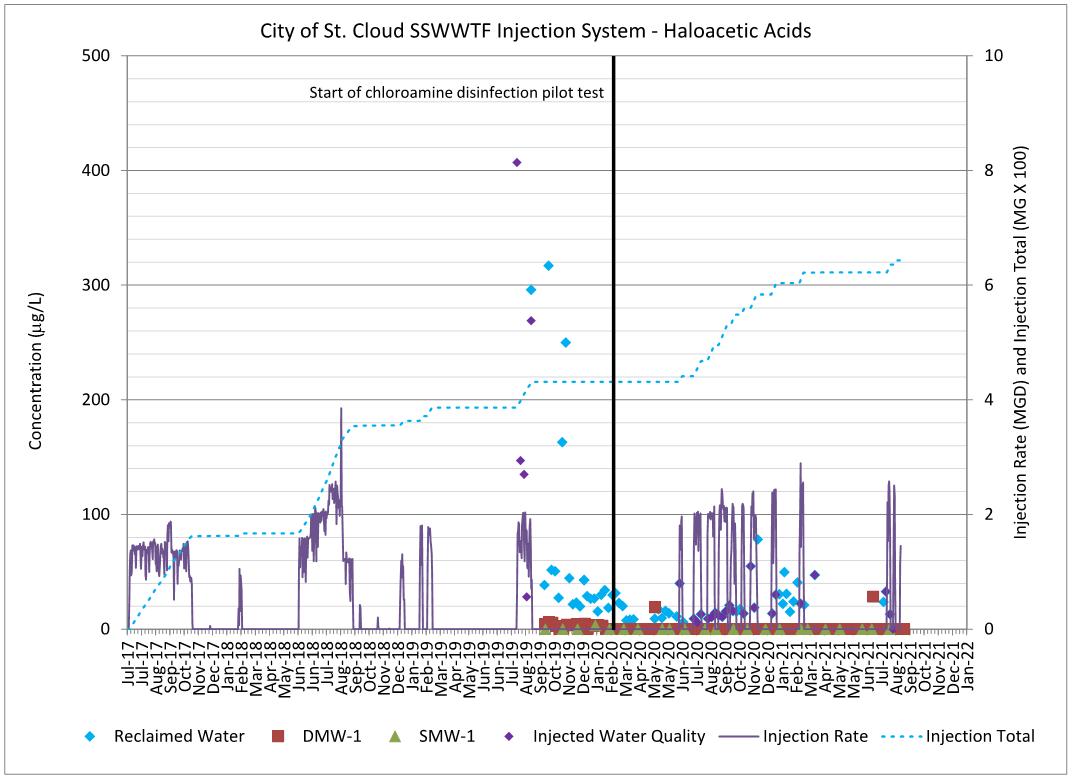
Figure 7. St. Cloud Injection Well Water Quality Haloacetic Acids Trends
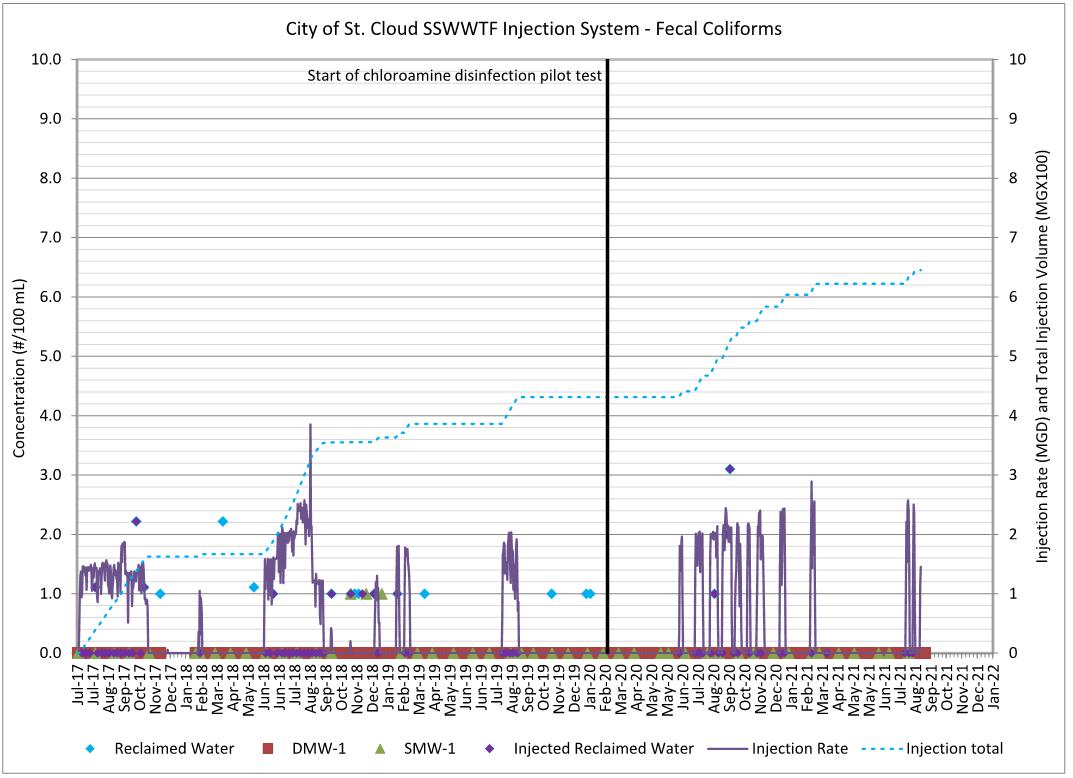
Figure 8. St. Cloud Injection Well Water Quality Fecal Coliform Trends
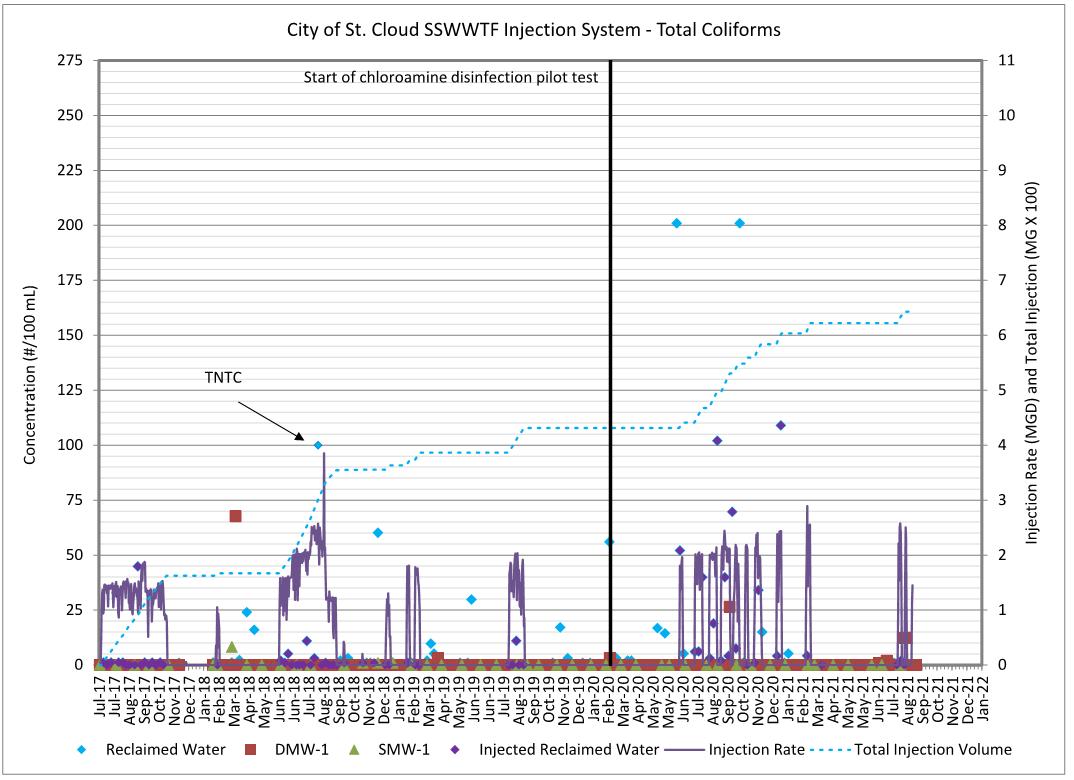
Figure 9. St. Cloud Injection Well Water Quality Total Coliform Trends
Table 1. Injection Well Operation Data Overall (July 3, 2017, through Aug. 16, 2021)
Parameter Units Median Value Minimum Value Maximum Value
Data Count
TTHM µg/L 33.90 <5 298 168 HAA5 µg/L 21.60 4.78 317 70 Fecal Coliform #/100 mL 1.00 1.00 U* 3.10 166 Total Coliform #/100 mL 2.11 1.00 U* 201 155
* 1.00 U – represents nondetectable value
Table 2. Injection Well Operation Data Before Monochloramine System Installation (July 3, 2017, through Feb. 12, 2020)
Parameter Units Median Value Minimum Value Maximum Value
Data Count
TTHM µg/L 136 <5 298 109 HAA5 µg/L 32.05 15.4 317 22 Fecal Coliform #/100 mL 1.00 1.00 U* 2.22 122 Total Coliform #/100 mL 1.11 1.00 U* 201 122
* 1.00 U – represents nondetectable value
Table 3. Injection Well Operation Data After Monochloramine System Installation (Feb, 31, 2020, through Aug. 16, 2021)
Parameter Units Median Value Minimum Value Maximum Value
Data Count
TTHM µg/L 4.20 <5 15.40 59 HAA5 µg/L 15.90 4.78 78.30 48 Fecal Coliform #/100 mL <1.00 1.00 U* 3.1 44 Total Coliform #/100 mL 2.55 1.00 U* 201 33 Continued from page 31 into operation after construction and before the monochloramine pilot was put into place, providing baseline conditions for the system. The water in the facility had a maximum fecal coliform of almost over 2, with a multitude of quantifiable values before the operation of the monochloramine system. The figure shows that the fecal coliform values since the monochloramine pilot have not reached any detectable values, except for two occasions in the almost year and a half of its operation.
Figure 9 displays the total coliforms of the reclaimed and injected water into the St. Cloud injection well. This also contains information on the monitoring wells and the total stored volume of water recharged into the injection well. Background samples were collected for nearly three years since the well was first put into operation after construction and before the monochloramine pilot was put into place, providing baseline conditions for the system. The water in the facility had a maximum total coliform of too numerous to count (TNTC), with a multitude of quantifiable values before the operation of the monochloramine system. The figure shows that the total coliform values following the start of the monochloramine pilot were nondetectable, but multiple quantifiable values began after the first few months of operation.
After research into this issue, nitrifying bacteria were found to be forming along the walls of the chlorine contact tanks after monochloramine dosing. This was due to two primary reasons: 1. The pilot system overdosing ammonia as a result of not having a fully automated,
SCADA-monitored, compound loopcontrolled ammonium sulfate chemical feed system and simply flow-pacing the ammonium sulfate feed pumps off the hypochlorite feed pumps. 2. Naturally occurring bacteria due to continued use of monochloramine disinfection in the warm, humid Florida environment, with direct sunlight exposure for extended periods.
A chlorine burn was found to be required as part of facility maintenance approximately every nine to 12 months to disinfect any nitrifying bacteria forming a coating on the interior tank walls. Since this maintenance began, no detectable values have been reached in the almost nine months of the monochloramine system’s operation.
Table 1 shows the overall operation data for the injection well during the monochloramine pilot period, Table 2 shows the operation data before the monochloramine system was

installed, and Table 3 shows the operation data after the monochloramine system was installed.
As of the end of August 2021, the city has injected almost 150 MG of reclaimed water. The city issued a purchase order for the fullscale monochloramine project at the end of August 2021. The fully automated, SCADAmonitored, compound loop-controlled system was constructed and online by January 2022.
Bradenton Pre-Existing Monochloramine System
The Bradenton WWTF chlorine contact tanks currently use free chlorine in the form of 12.5 percent liquid sodium hypochlorite, which is dosed at the clear well of the tertiary effluent filters. The clear well contains a standpipe with a vortex breaker, which conveys flow to the chlorine contact basin. The total chlorine residual is monitored at the dosing location and at the chlorine contact’s effluent weir.
The tertiary filter’s dosing point also includes a 300-gal ammonium sulfate storage tote with a chemical feed pump that can be operated manually without flow control or residual trim. When used, the pump is set at a constant feed rate and turned on to begin forming monochloramines by the addition of ammonia, but the chemical feed pumps are not flow-paced, and no ammonia or monochloramine monitoring analyzer is provided; therefore, the ratio of ammonia to chlorine cannot be properly controlled. This results in underdosing or overdosing ammonia, since the flow varies diurnally over a typical 24hour period. In addition, the ability to remotely monitor or control this system is not available through SCADA; therefore, the system is currently not used due to these issues.
The city issued a purchase order for the full-scale monochloramine project in September 2021. The fully automated, SCADAmonitored, compound loop-controlled system was constructed and online by February 2022.
This monochloramine system differs from the St. Cloud system due to the surface water discharge previously discussed. With the total nitrogen limit of 3 mg/L being required, the tight control of the automated system is critical to prevent excess ammonia from being dosed.
Equipment was selected for this application according to the constraints described in the equipment analysis that follows, with the ammonia being dosed upstream of the existing hypochlorite dose and the standpipe with vortex breaker being allowed to act as a static mixer, providing almost instantaneous mixing. The city also requested a fiberglass reinforced plastic (FRP) enclosure for all equipment except the chemical tanks.
Figure 10 shows the proposed well construction diagram for the recharge well and associated monitoring wells.
Specific Equipment Analysis
To implement a fully automated, SCADAmonitored, compound loop-controlled ammonium sulfate chemical feed system, specifically designed chemical feed equipment and analyzers should be created. The primary components consist of chemical storage tanks (for ammonium sulfate, sodium hypochlorite,
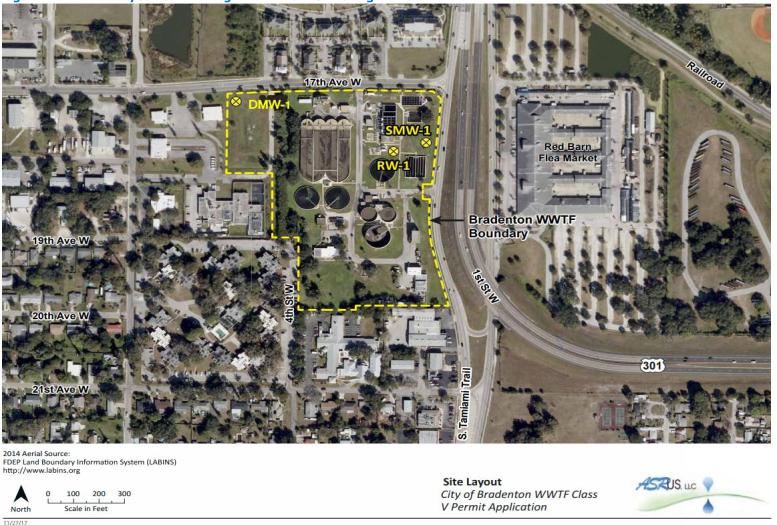
Figure 10. Bradenton Proposed Recharge Well and Monitoring Wells
and possibly sodium hydroxide if pH control is needed), chemical feed pumps (to convey all stored materials in the specific order required for appropriate formation), and an analyzer (reading monochloramine, free ammonia, pH, and preferably also free chlorine for the reasons described in the St. Cloud pilot earlier).
The monochloramine equipment for each of the three designs was sized for the full range of flows (from MinADF to PDF). Continued on page 34
Florida-Based Multidisciplinary Services Firm Providing Environmental & Infrastructure Solutions Since 1974

Thomas Friedrich, PE, BCEE Sean Menard, PE, CDT, ENV SP, Assoc. DBIA
Asset Management | Civil/Environmental | Solid Waste | Water Resources | Utilities Infrastructure
Continued from page 33 Systems can be easily sized for larger, less common peaks through additional quantities of similarly sized equipment; sizing can also accommodate future flows that may be expected for the wells.
An analyzer building may also be considered to contain the water quality monitoring instruments that measure the water at and after dosing. Sample pumps may also be required to convey flow from the dosing location to the analyzer or from the analyzer back to a drain. Table 4 lists the major equipment required for the proposed monochloramine systems, together with their general design guidelines.
Cost Analysis
For the St. Cloud and Bradenton facilities, the operational cost savings in hypochlorite dosing reduction offset the operational cost savings in monochloramine dosing so significantly that both projects are projected to reach the payback period for implementation of their monochloramine chemical feed system retrofits in approximately five years. City of St. Cloud
Based on 2019 data, the city used 12.5 percent sodium hypochlorite for high-level disinfection and the monthly and average annual use was estimated and rounded as 23,000 gal per month and 272,685 gal per year. The contract price in 2019 was $0.495/gal of sodium hypochlorite.
When a combined chlorine residual is used during the monochloramine pilot, the amount of free chlorine was shown to be significantly reduced since combined chlorine does not react with other oxidizable compounds in the effluent; therefore, minimal free chlorine demand exists. The estimated free chlorine usage that the city experienced, while using a monochloramine residual for the first twomonth period from Feb. 13 to April 13, 2020, was estimated and rounded to 26,895 gal, which equates to 13,450 gal per month and 161,400 gal per year. This resulted in an estimated 12.5 percent saving of sodium hypochlorite use (i.e., 111,310 gal per year) and an annual chemical cost savings of $55,000/year.
The ammonium sulfate dose will need to be coordinated in the field through preliminary testing, once the compound loop is incorporated, and will likely decrease further from the results of the pilot. The city has been using a monochloramine dose of approximately 3 mg/L. During the initial two months of the pilot, an estimated four totes (approximately 1,200 gal) were used, projecting an estimated 7,200 gal per year. The projected dosage of ammonium sulfate at the current facility flow is approximately 1,000 gal per month or 12,000 gal per year. The added cost for the addition of ammonium sulfate per year at the current estimated $1.80/gal contract price is approximately $12,500 to $21,500 per year.
The net savings in disinfectant chemical costs (between $55,000 and $12,500 and $55,000 and $21,500) is approximately $42,500 to $33,500 per year (savings = sodium hypochlorite reduced cost/year minus ammonium sulfate/year).
City of Bradenton
Based on 2020 data, when the city used free chlorine for high-level disinfection, the monthly and average annual use could be as high as 18,000 gal month and 219,000 gal per year. When a combined chlorine residual is used, the amount of free chlorine use is significantly reduced since combined chlorine does not react with other oxidizable compounds in the effluent; therefore, minimal free chlorine demand exists. The estimated free chlorine usage for using a monochloramine residual is 5,840 gal per month and 71,040 gal per year, resulting in an estimated savings in free chlorine usage of $72,215 per year.
The ammonium sulfate dose will need to be coordinated in the field through preliminary testing; amonochloramine dose of 3 mg/L was assumed for cost estimating. The added cost for the addition of 22,600 gal of ammonium sulfate per year is $40,681.
The net savings in disinfectant chemical is approximately $31,534 per year (savings = free chlorine reduced cost/year minus ammonium sulfate/year)
Table 4. Key Components of the Monochloramine Systems
System Key Components
Chemical Storage Tanks
Chemical Feed Pumps • Typically sized to allow 30-day deliveries assuming 24-hour operation • Minimum volume to accommodate chemical delivery truck • Vertical, double-wall tanks to allow dual containment and prevent chemical spills to the ground (instead of a single wall, requiring a separate concrete containment structure) and even pressure distribution (instead of horizontal) • Two equally sized tanks, if possible, to allow redundancy and reduce the overall footprint • Typically sized to meet peak hourly flows while allowing turndown to MinADFs • Multiple pumps for redundancy and if the range of flows is too broad (most pumps have a maximum turndown of 10 percent of the designed rate) • Pump skid and enclosure should be considered for outdoor applications • Matching other onsite equipment allows for standardization that can be beneficial regarding spare parts and redundancy in maintenance and coordination with manufacturers
Chemical Analyzers • Select type of analyzer based on water quality (i.e., water with a historically high color should not consider an analyzer that uses ultraviolet [UV] 254 to take sample readings due to the negative impact on the transmissivity of the unit’s ability to read parameters) • Reliability including consistent customer service • Evaluate proprietary reagents compared to reagents that can be made in-house with a recipe
Summary and Recommendations
The City of St. Cloud, City of Bradenton, and Southwest Florida Water Management District have each prepared to implement a monochloramine disinfection system to disinfect treated wastewater or raw, screened surface water at one of their AR well sites to better manage the seasonal limitations of their storage, benefit the MIA within the SWUCA, provide an environmental benefit of reduced nutrient loading to surface waters, and/or mitigate saltwater intrusion and improve natural water systems.
Each of these has an impact on future alternative water supplies through aquifers or


