FY24 Key Performance Measures


Gaithersburg reflects the best of America – a city for today and tomorrow. It is a welcoming and vibrant place, supported by responsive, compassionate, and responsible leadership that brings people together, encouraging our community to flourish.
The City of Gaithersburg, through its valued employees, provides exceptional services to cultivate an inclusive, sustainable, and thriving community for all.
Accountability
Caring
Excellence
Integrity
Teamwork
Gaithersburg is comprised of a variety of distinct, inclusive communities, where people feel safe, welcomed, and are engaged in activities that promote economic, social, and environmental well-being.
Gaithersburg values and promotes the arts and humanities, preserves its heritage, and enriches its diverse community by providing opportunities to come together to enjoy outstanding shared cultural and recreational experiences.
Gaithersburg facilitates development and redevelopment opportunities that support and enhance the stability of the local economic base and provide residents with a wide array of employment and housing options.
Gaithersburg’s proactive approach to sustainability and environmental stewardship includes climate change mitigation and adaptation, increasing energy efficiency, reducing energy consumption from non-renewable energy sources, promoting healthy watersheds, and enhancing our urban forest.
Gaithersburg identifies barriers and provides support and resources to advance equitable outcomes for people in our community, particularly for those who have been historically underserved.
Gaithersburg creates neighborhood cohesion through bicycle and pedestrian connectivity and advocates for transportation and public transit options that increase efficient and convenient access.
Gaithersburg advances responsible financial planning and stewardship, while aligning resources with community needs to provide for quality services, now and in the future.
Gaithersburg fosters an environment that inspires the passions of City employees and allows them to use their talents and to grow professionally. Employees are equipped with the tools and resources to perform their duties with excellence and are recognized for their contributions.
Gaithersburg provides excellent and accessible City services, parks, and facilities for all. The City advances innovative technology, data-driven service delivery, and collaborative approaches to provide positive outcomes for the community.
1. Effectively use data and leverage community outreach to enhance public safety.
2. Enhance trust in police services.
3. Engage and empower diverse groups to enhance participation in City government, programming, and opportunities that enhance quality of life.
4. Provide equitable access to and build awareness of social and financial programs and services.
5. Establish Gaithersburg as a regional tourism destination.
6. Develop activities that involve and reflect the City’s diverse people, communities, cultures, and traditions.
7. Provide recreational opportunities to enhance physical, mental, and social well-being for people of all ages and abilities.
8. Improve access and integration among employment nodes, residential areas, and amenities.
9. Develop Gaithersburg as a regional employment center that attracts and supports an array of entrepreneurial and established businesses from a variety of industries.
10. Implement strategies that encourage reinvestment in aging commercial and multi-family properties.
11. Pursue strategies to provide a mix of housing options for a variety of income levels.
12. Pursue the highest level of Sustainable Maryland Certification.
13. Implement and continually refine strategies associated with the City’s Racial Equity Awareness and Action Plan.
14. Improve connectivity of people to services, activities, employment, and points of interest.
15. Develop and implement data-driven strategies that keep our community safely in motion.
16. Pursue fiscally sustainable strategies to meet operational and community needs.
17. Provide accessible and transparent financial information.
18. Create a comprehensive strategy to attract and retain a diverse and talented workforce.
19. Provide a competitive and equitable total rewards package including compensation, benefits, wellness, recognition programs, and professional development opportunities.
20. Improve service delivery through streamlined processes, data-driven decision making, and strategic partnerships.
21. Responsibly maintain and invest in technology, facilities, and infrastructure to meet organizational and community needs.
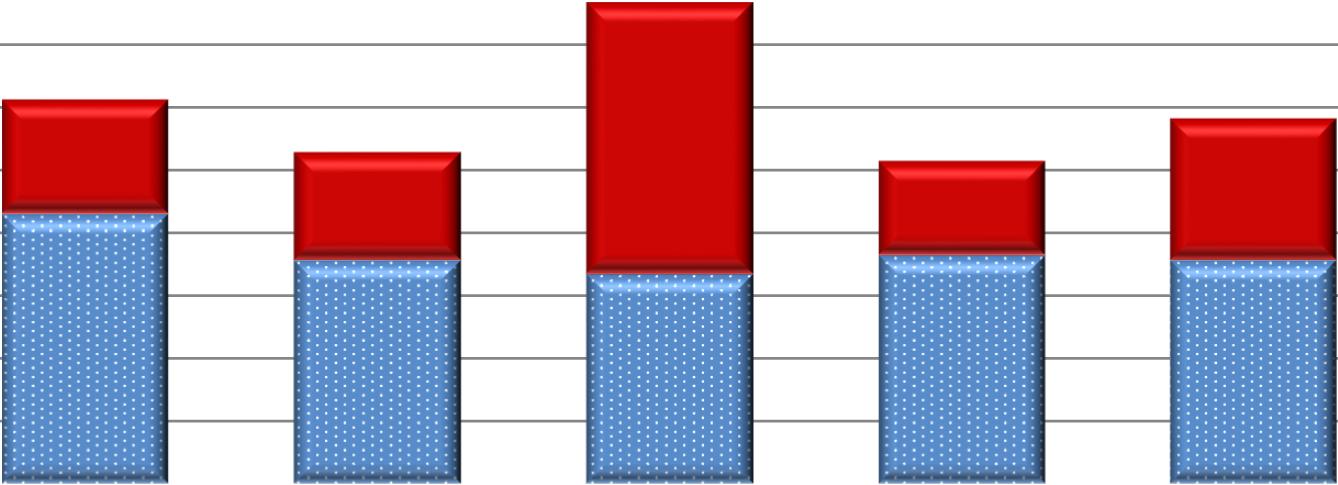
The chart above compares the City’s actual unassigned fund balance to the current fund balance policy target of 25% on a three-year expenditure average. When actual results are compared to this target, it appears that the unassigned fund balance is higher than the target. The City’s current policy target is similar to that used by many other jurisdictions. However, most other government entities issue debt for large capital projects.
The City’s current policy does not take into account the use of unassigned fund balance in place of debt issuance. This means that in years when the City has large capital project expenditures, the unassigned fund balance would be utilized to cover these outlays. Conversely, in other years it would be expected that additional funds would be added to the unassigned fund balance as the City saves for future year projects. The FY24-FY29 projection shows an expected use of fund balance of $44.9 million over the six years, which would maintain the City’s fund balance above the target threshold of 25%. The 5-year plan and estimated unassigned fund balance is reviewed annually to ensure long-term sustainability of the City’s budget and operations. Over the past five years, the unassigned fund balance decreased between FY18-FY19 and increased with contributions in FY20FY23, with the overall balance increasing as a percentage of the three-year expenditure average by 11% per year.
Variance Revenue Variance
The City desires to budget accurately so as to maximize use of City resources and has established a target of budgeting within 10% of actual results. This was achieved in fiscal years 2014-2021 for revenues and in 2016-2020 and again in 2022 and 2023 for expenditures. The chart above shows the absolute variance between budgeted and actual revenues and expenses.
During the COVID-19 pandemic, estimations of revenues and expenditures were particularly volatile given the changes in public health restrictions, economic conditions, and influx of certain governmental revenues. Gaithersburg continued the trend of estimating revenues within 10% of what was budgeted in FY21. However, with the cancelation of festivals, facility closures, and other expense impacts, the expense variance was slightly greater than 10% in FY21. In FY22, the expenditure budget was again within the 10% threshold, while revenues were considerably higher than anticipated due mostly to one-time permitting revenues exceeding expectations in 2022 and the favorable interest rates in 2023.
$200,000
FY19FY20FY21FY22FY23
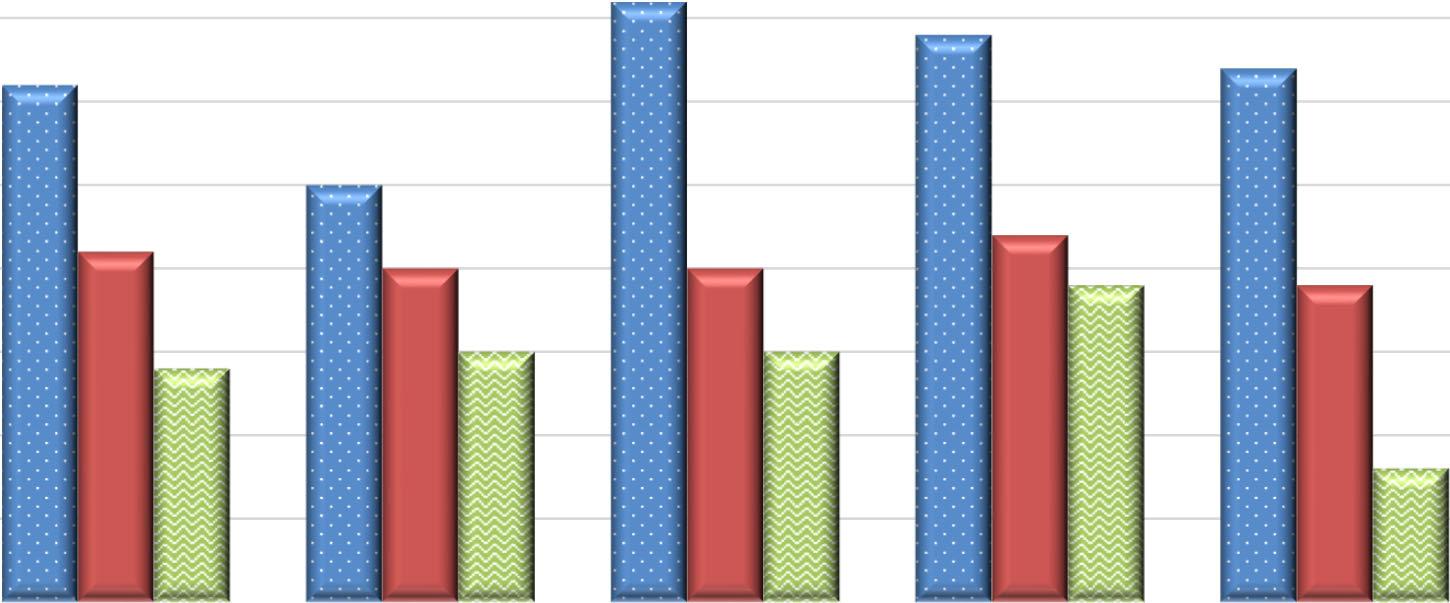
This comparative analysis focuses on conference and in-service training expenditures relative to full-time salaries. In FY 2019, costs rose due to intensified in-house training efforts. However, expenditures dipped below previous levels in FY 2020 and FY 2021 owing to the COVID-19 pandemic and ensuing travel constraints for conferences.
In FY 2022, with the resumption of in-person training, expenses increased once more. Throughout FY 2023, both in-person and virtual training options expanded, approaching the training levels seen in FY 2019. Given the prevalence of hybrid work schedules among staff, we plan to sustain offerings of both in-person and remote training sessions. Additionally, virtual sessions are recorded and shared on the Intranet to accommodate those unable to attend as we continue to enrich our internal training resources.
Total Website Page Views as of January 1


This chart shows total page views for the main City website for January 1, 2020 to January 1, 2024. Please note: Google Analytics transitioned from Universal Analytics (UA) to Google Analytics 4 (GA4) in July 2024. With the new GA4 interface, some data is skewed and the data for 2024 might be inflated because of this. In addition, there was a short timeframe where we experienced a heightened level of spam traffic.
As in past years, December was the month with the most traffic, attributable to the Winter Lights Festival. Our highest traffic on a single day was for the SummerFest event.
74% of website users were viewing on desktop. (This might be an anomaly due to the spike in spam traffic as traditionally we’ve seen most users accessing our site through mobile.)
Top 10 pages: Winter Lights, Water Park, Summerfest, Oktoberfest, Summer Camps, Procurement, Job Opportunities, Sports, Miniature Golf, and Arts Barn.


In the fall of 2021, Facebook implemented what it calls the “New Page Experience,” which included changes to how Facebook tracks and delivers its analytics. Several of our measurements have been affected by these changes and will be noted on the appropriate charts. In September 2021, Facebook switched from tracking the number of “likes” on a page to only tracking the number of “followers.” Data for “likes’ in the above chart is no longer available. Beginning in 2022, we tracked the number of followers for Facebook accounts. This data is more representational of the number of people who would be getting our posts delivered to their newsfeed (previously you could like, but not follow a page).


Data for “likes” in the above chart is no longer available. Beginning with 2022, we began tracking the number of followers for Facebook accounts.
The City Government Facebook Page has 9,397 followers as of January 1, 2024.
Gaithersburg Police Department Facebook Page
Facebook Likes (2018 –2021) and Followers (2022‐2023)


Beginning with 2022, we began tracking the number of followers for the City of Gaithersburg Government and Gaithersburg Police Department as part of possible measurements under the Strategic Outcome Area -Safe & Welcoming Communities.


These charts show X (formerly Twitter) growth by measuring the number of followers. Overall, we have a total of 15,491 follows on seven accounts (see remaining charts on page 25). We saw a 23.9% increase (2,989 new followers) from the beginning of 2023 to the beginning of 2024. Please note –Bank on Gaithersburg was archived in 2023 .
On the City Government Twitter account, we increased our number of followers by 21.3% from the beginning of 2023 to the beginning of 2024, with 1,309 new followers.


The Sports and Aquatics X accounts are primarily used to post cancellations that are integrated onto the City website so participants can get real-time updates during weekends and off-hours.
For future measurements, we suggest measuring the number of X followers for the City of Gaithersburg Government and Gaithersburg Police Department as part of the measurements under the Strategic Outcome Area -Safe & Welcoming Communities.

The data for the chart on the previous page is no longer available due to changes from Twitter to X. Due to Facebook’s New Page Experience, engagement data is no longer easily available for engagement and engagement rates for Facebook.
Across All City Accounts as of May 6


This chart shows the number of unique subscribers for all City newsletters and Constant Contact emails. Note that subscribers may sign up for more than one newsletter, but are only represented once on this chart. Several newsletter subscriptions are dependent upon the number of program participants that request to receive City emails.
As of May 2024, we saw a 52.19% increase in total number of unique subscribers (15,487 new contacts).
The City’s weekly newsletter (3,400 subscribers as of May 6, 2024), saw a 3% (97 new subscribers) increase in subscribers.
FY22
FY23 Final
FY24 Proposed
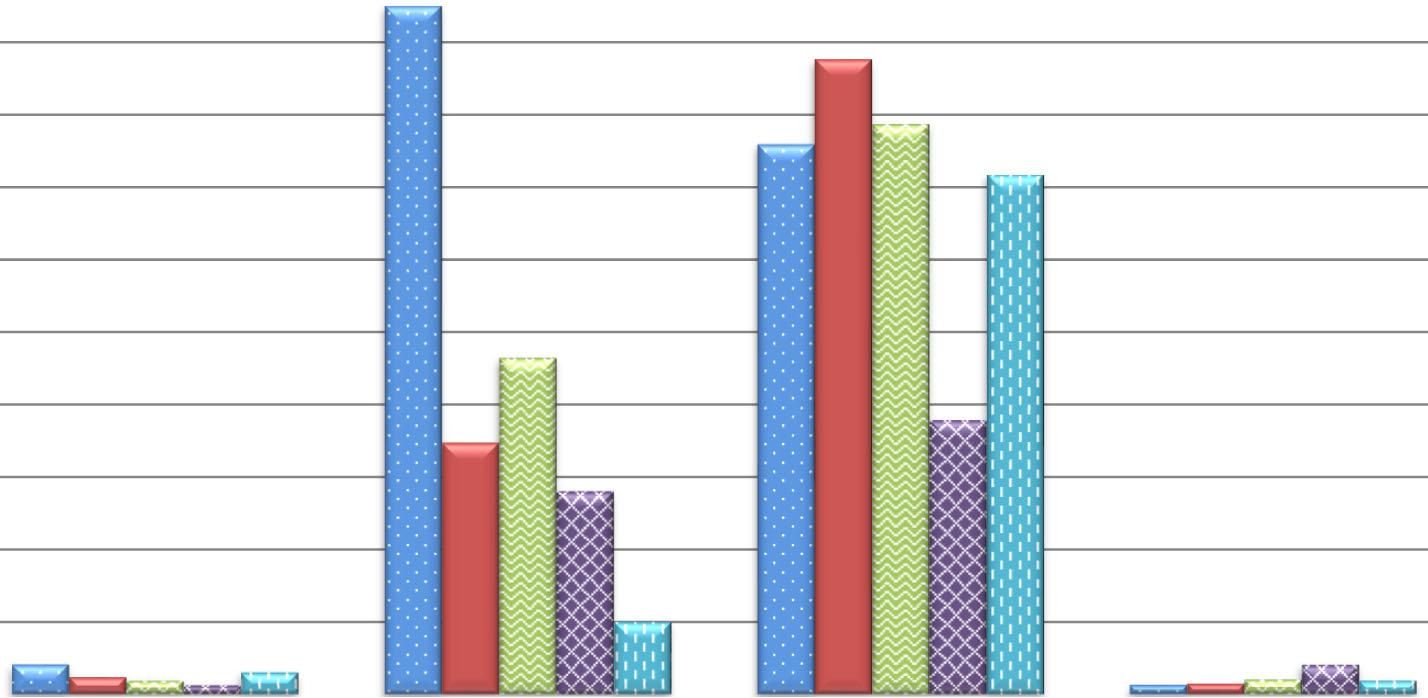
Financial Wellness–Ongoing integration efforts via grants and Citywide programming have increased in the first part of FY23 and FY24. The Financial Empowerment Center (FEC) celebrated its one year anniversary in April of 2023 and celebrated over 400 served by the end of calendar year 2023.
Homeless Programs/Outreach–Homeless Services, Community Services, Housing & Community Development, and Neighborhood Services coordinate on housing assistance cases, hoarding cases, and housing and service outreach. Calls for services continue to increase especially in the areas of rental assistance needs and landlord tenant challenges. Increased outreach between all divisions is assisting residents in learning about both the Financial Empowerment Center the City’s housing opportunities.
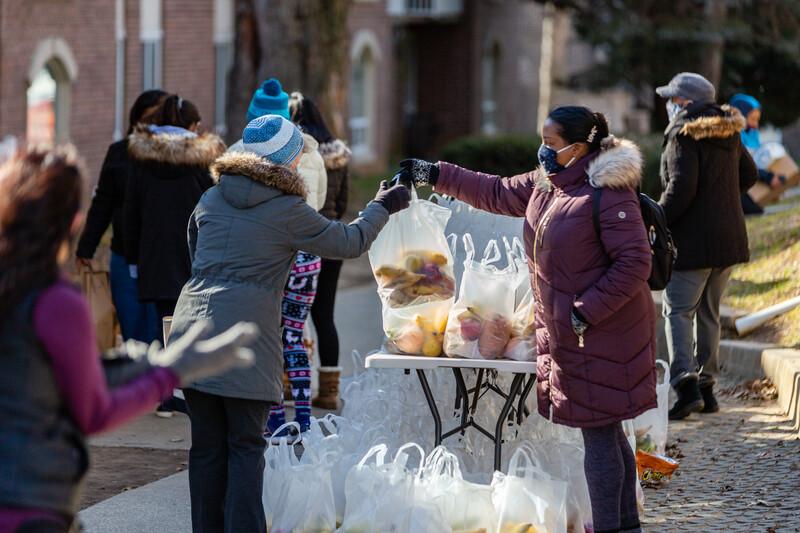
Safety Net Services–Challenges with affordable and subsidized rent options for the working poor, seniors and the disabled continue. Increased delivery of safety net services, evident at the mid-point of FY24, reflects the continued needs. Numbers of households receiving food assistance are greatly exceeding proposed expectations.
Youth Enrichment–School grants were suspended in FY21 but were modified and brought back for FY23 and FY24. Services provided through these grants are robust and fully coordinated with City Community Services and Youth and Sports Divisions, which has resulted in large scale youth empowerment events, direct service, youth
and
collaborative programs. FY24 Youth Prosperity grantees are on target to serve over 600 City youth via grant programming and collaborative events.
Female Householder, no Spouse, w/children <18, Poverty
Female Householder family, no spouse
Poverty (families)
Poverty (all persons)
Poverty 65+ (all persons) HHs w/SNAP Program Benefits
No Health Insurance

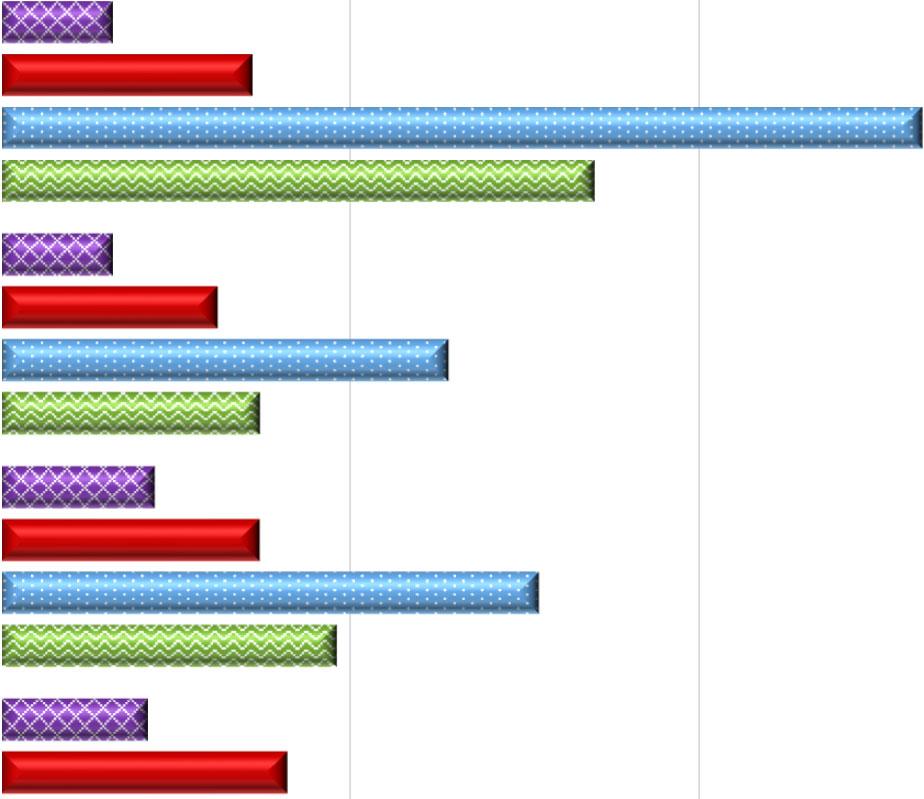
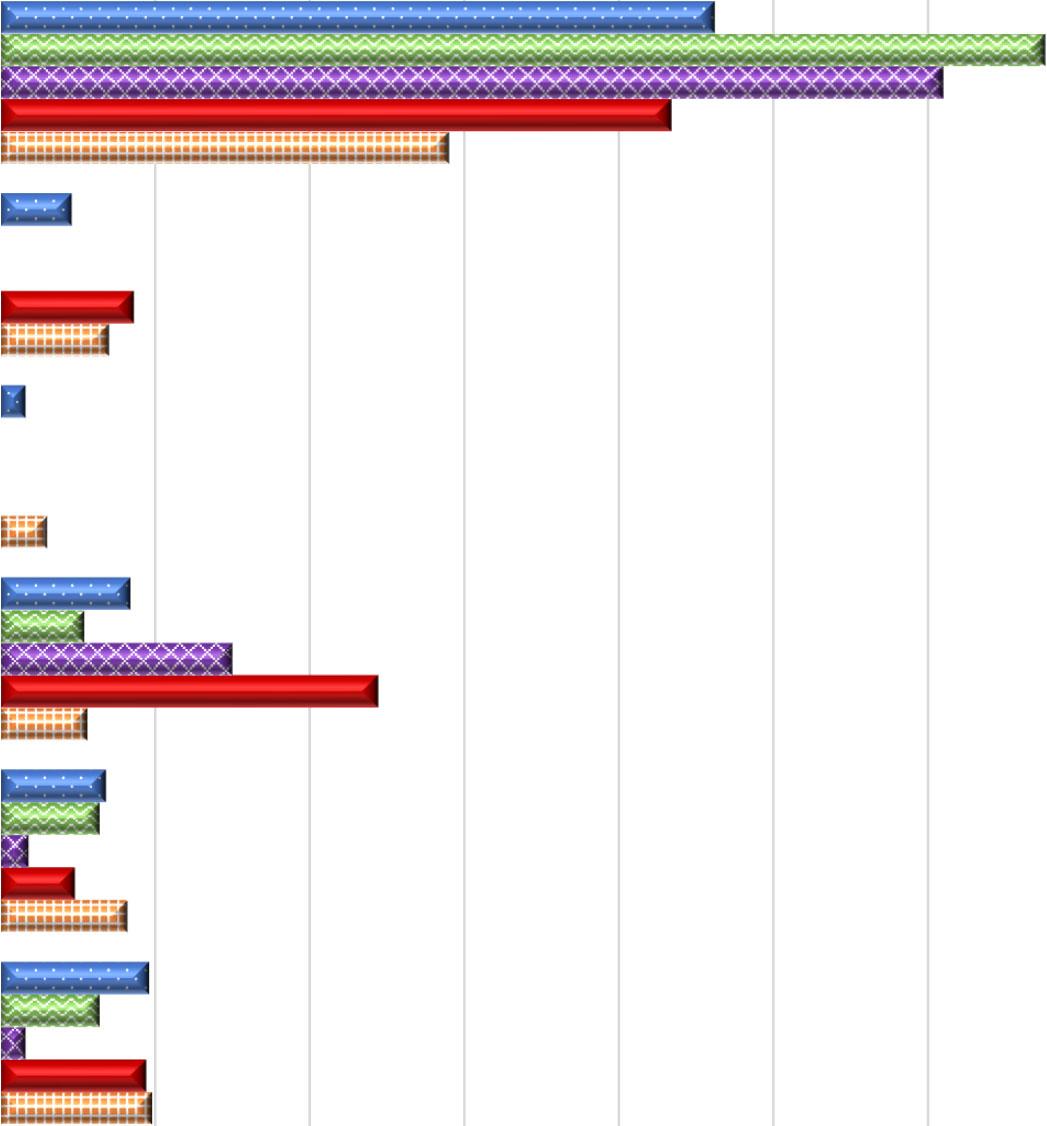
Gaithersburg continues to have higher rates of poverty than Rockville and the County in most areas. Among female headed households with children,14.9% live at or below the federal poverty level, down from 19% reported in the 2021 ACS. Overall, poverty in the City went down from 10.9% in 2021 to 9.7% in 2022. City residents without health insurance increased to 10.7% from 9.9%.
Free and Reduced Meals (FARMS) rates in Montgomery County Public Schools is another indicator of poverty. To qualify for FARMS, the annual income for a family of four must not exceed $55,500. MCPS “Schools at a Glance 2023-2024” reports that five of the 13 elementary schools with 10% or more City residents have FARMS rates between 66% and 85% (Washington Grove, Brown Station, Watkins Mill Elementary, Summit Hall and Gaithersburg Elementary Schools). As a comparison, the FARMS rate at Diamond Elementary School (on the west side of the City) dropped from 7.3% to 6.5% from 2020 to 2021 but rose to 9.7% per the 2022-2023 report. Harriett Tubman, the new 10% City elementary school, is reporting a FARMS rate of 80%, with 352 of their 440 families having incomes less than $55,500 a year.
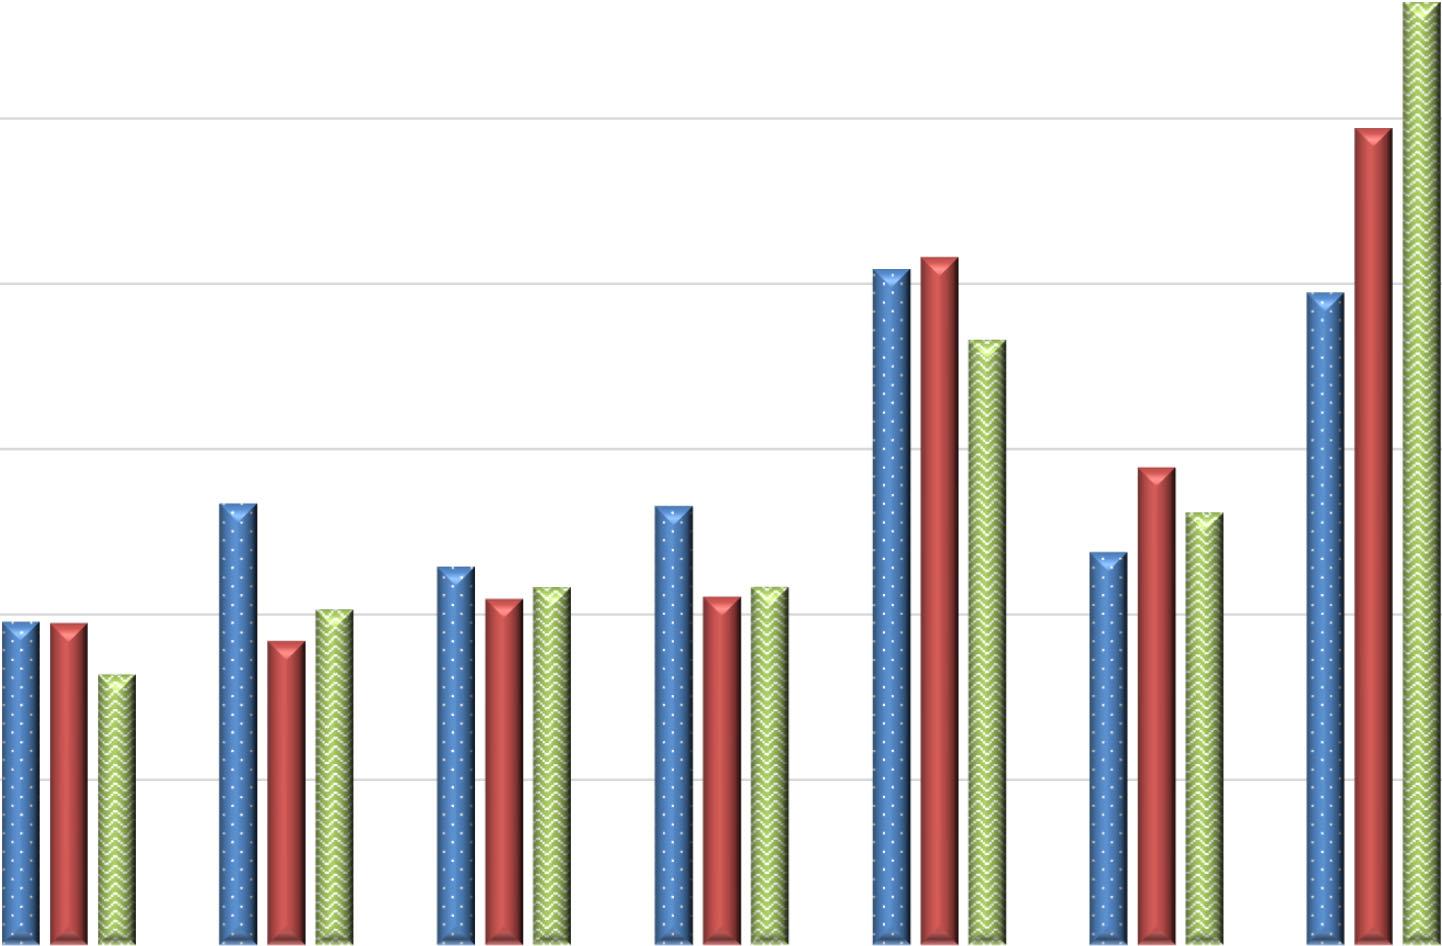
According to the 2022 ACS, Gaithersburg’s median household income remains about 16% below Rockville and Montgomery County. Gaithersburg households that have incomes below $50,000 is at 23% (down from 26% in 2021). Households with incomes greater than $200,000/year increased from 17.2% to 19.7% from 2021 to 2022.By comparison, 24,7% and 28.5% of Rockville and County residents, respectively, have incomes above $200,000, which increased proportionally.
Median income for all households increased from $98,089 to $104,544 in 2022. Median rent increased by 36%, from $1,328 in 2009 to $1,811 in 2021, underscoring the increasing cost burden on low income households.
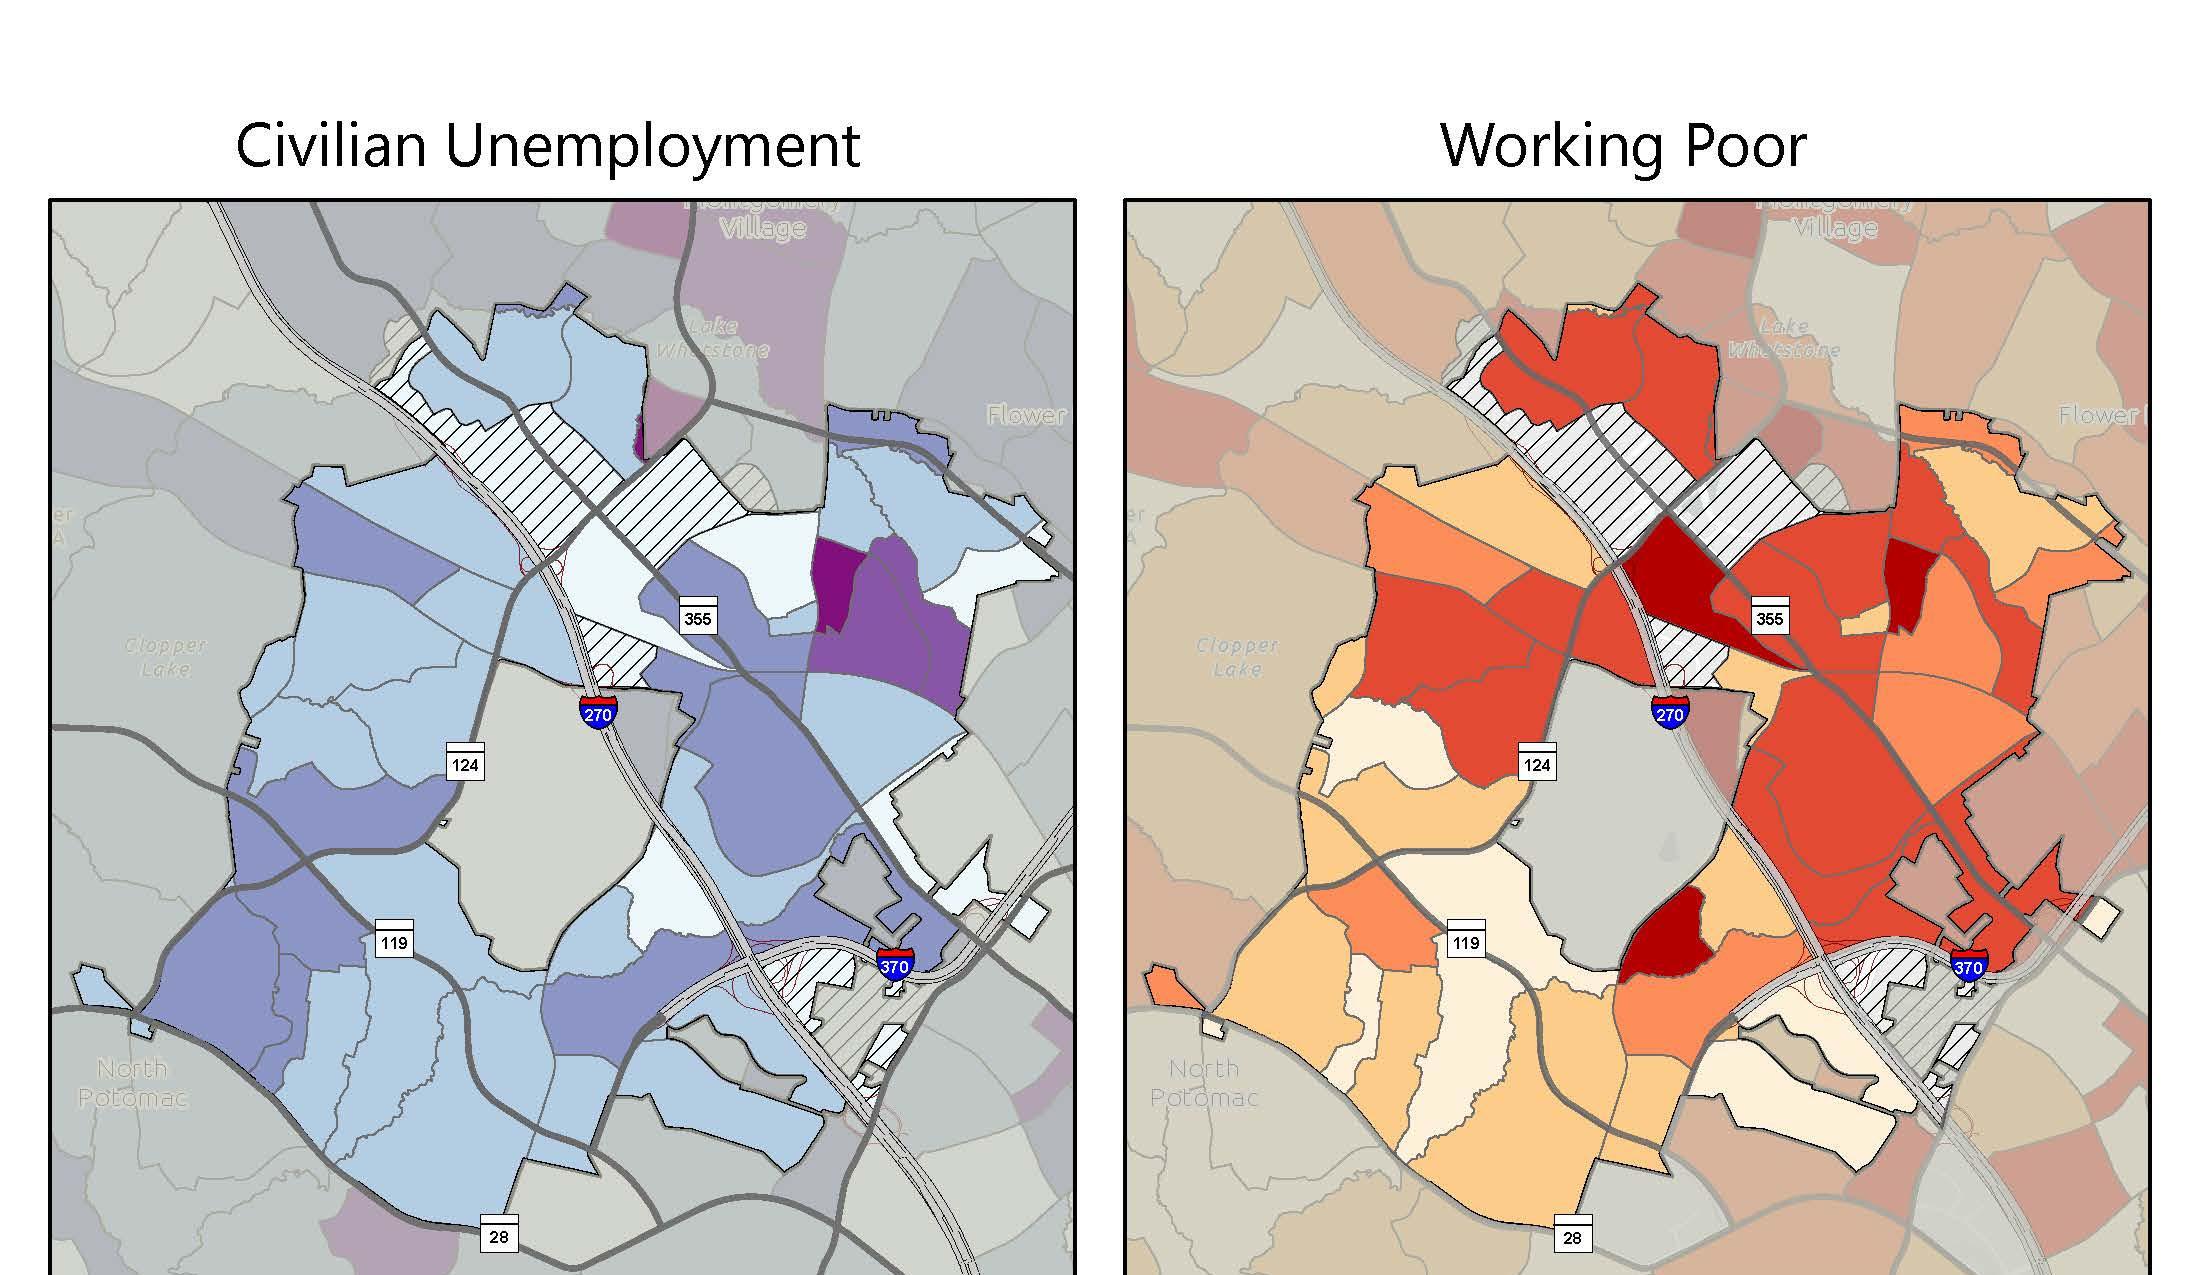

The unemployment map is based on the civilian labor force (consistent with Department of Labor and media reporting). The two block groups showing the highest rate of unemploymentare located in the northeastern portion of Olde Towne, north of Diamond Avenue and east of Summit Avenue. The map of working poor is based on household incomes at or below 150% of the poverty threshold for a four-person household.Since the Census doesn’t officially define working poor, City staff in the Long Range Planning and Housing and Community Development divisions determined the best approach for this analysis is to use 150% of the poverty threshold, which translates to a maximum income of $41,625 for a family of four in 2022. These maps are based on the US Census Bureau 2022 American Community Survey household income data and the 2022 poverty threshold.
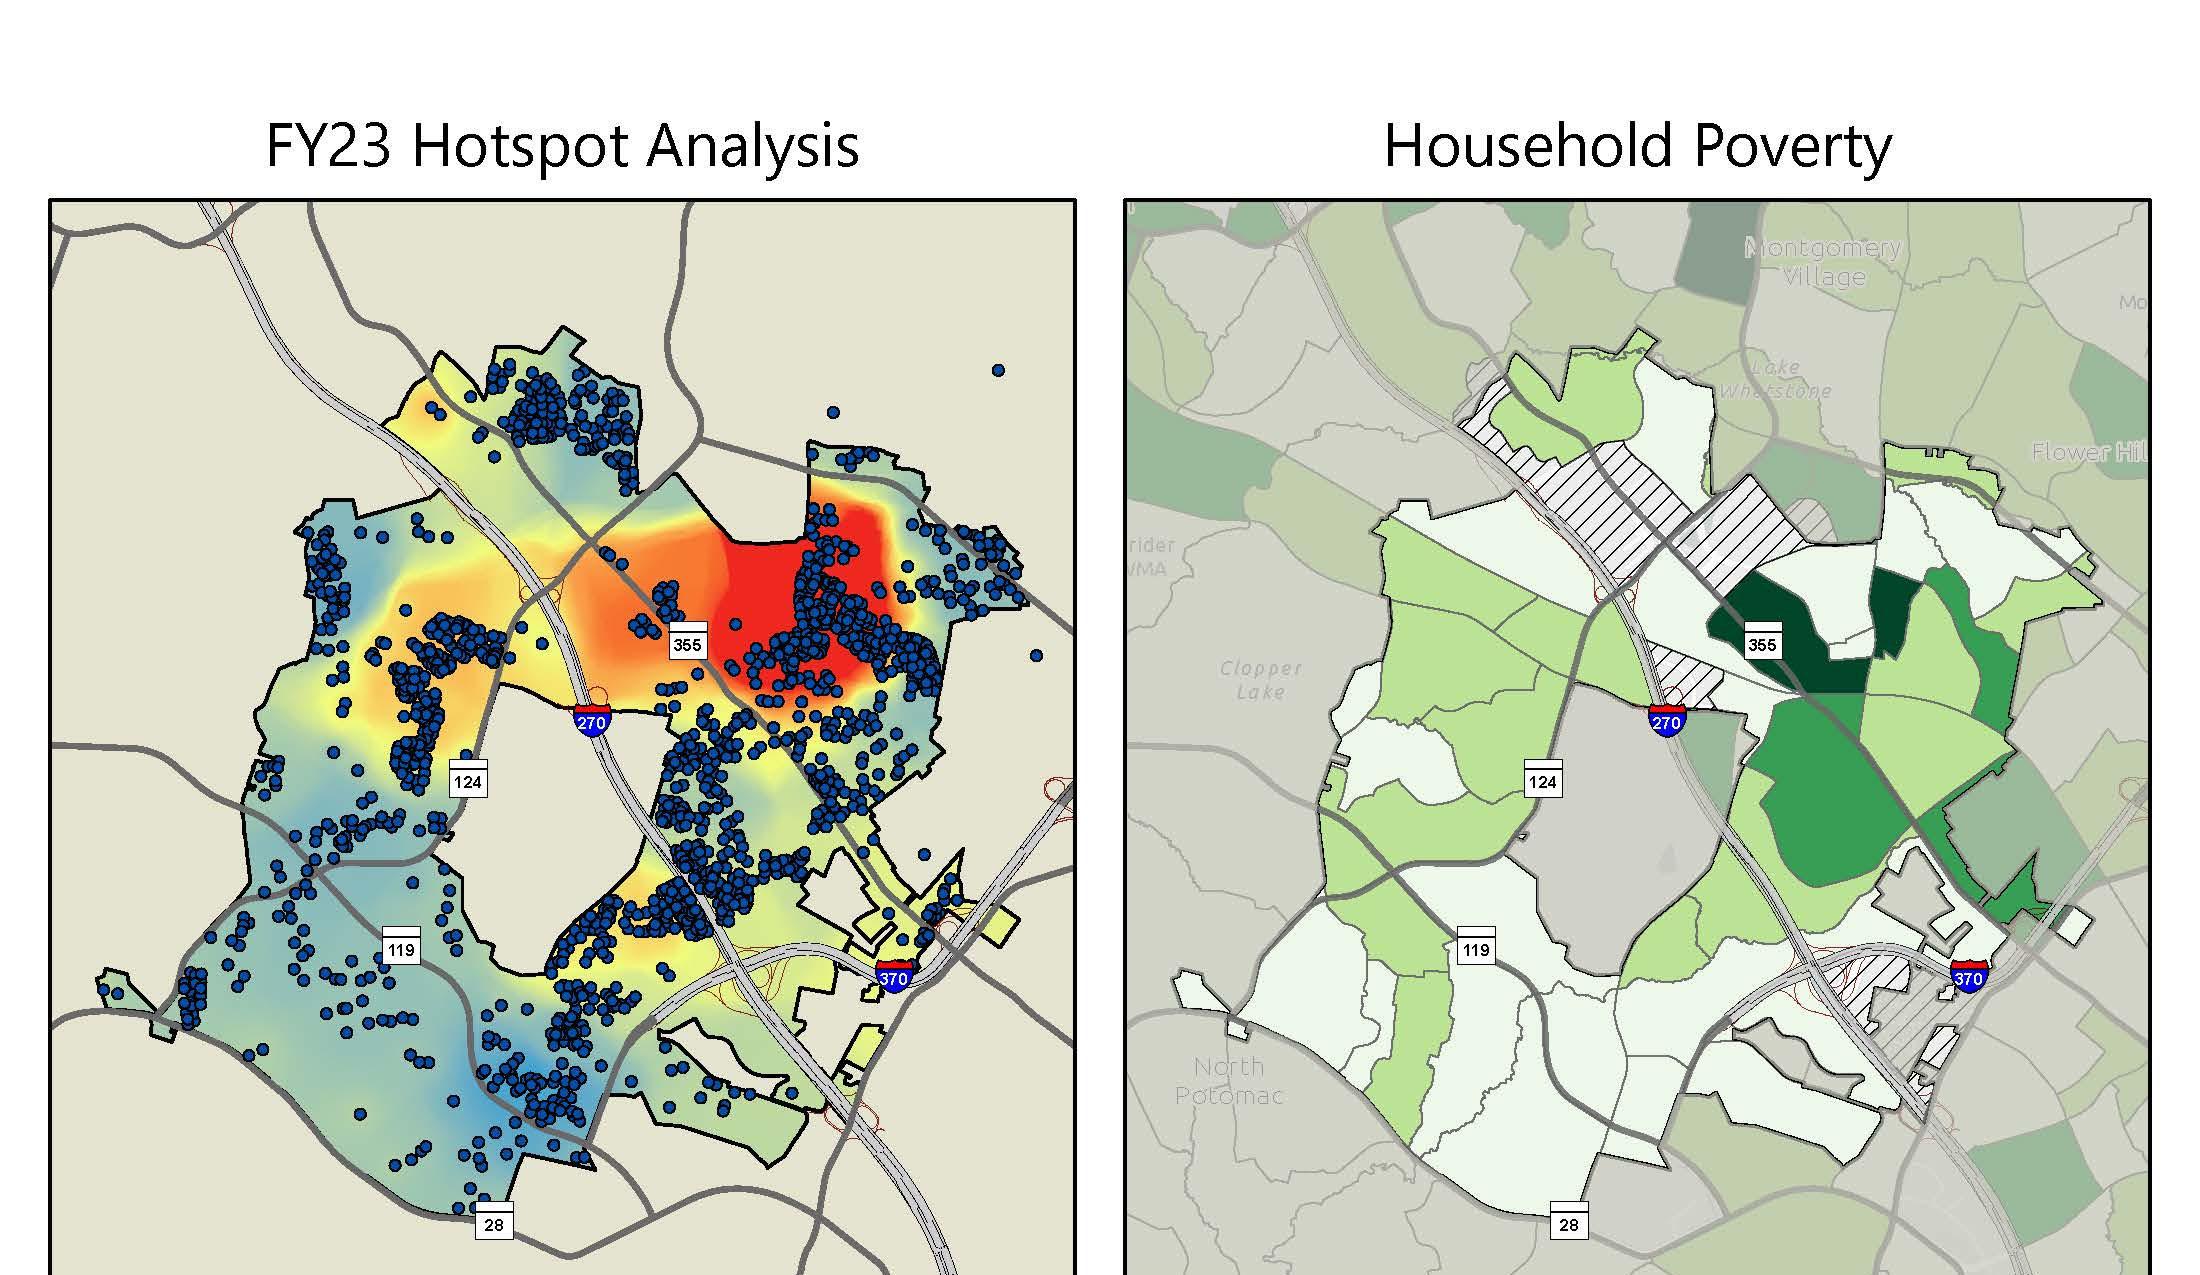

These maps compare pockets of poverty to client access of contracted services supported by City funding for emergency assistance, financial empowerment, housing stabilization, food and nutrition, health and mental health, youth enrichment, and vocational coaching in FY23. The hotspot analysis is based on data from July 2022 through June 2023. Services appear to be reaching high poverty areas and beyond. Both hotspots and calls for services, rental assistance and Hoarding Task Force information continue to be high in the northwestern part of the City with continual requests for information. Service navigation is needed and provided to residents in all parts of the City.
This graph indicates client achievement in income and permanent housing. The goal of transitional housing is to move individuals to permanent housing with enhanced skills and support systems. Although Wells/Robertson House (WRH) allows residents to stay up to two years, our collaborative engagement in the Housing First model has resulted in more residents taking advantage of permanent supportive housing opportunities, resulting in an average stay at Wells of four to six months. The number served was also impacted by relapses associated with the opioid epidemic.
Six residents have moved into permanent and permanent supportive housing so far in FY23. Some residents come into the program with Social Security and Social Security Disability income and do not increase their income during their stay. They generally score high on the vulnerability index, but are still eligible for permanent supportive housing.
FY24 proposed outcome measures for our Montgomery County grant include 70% of residents maintaining or increasing their monthly income and 85% remaining in the program for at least six months and exiting to permanent housing.
We were not able to make comparisons to other like programs as we did in previous years because they no longer exist.
$6,000,000,000
$5,000,000,000
$4,000,000,000
$3,000,000,000
$2,000,000,000
$1,000,000,000
$0
$4,575,175,900
$3,995,629,800

$5,186,575,500
$4,287,095,300 $4,205,929,200
Levy Year
Property types included in the total for the “Commercial Real Property Base” are Commercial, Commercial Condo, and Industrial classifications. The total for these categoriesin Levy Year 2024 increased 23.32% from the previous year.
Historically, the first year of the triennial assessment cycle sees real property values for commercial accounts increase by 20% or more, and Levy Year 2024 follows that pattern. Commercial property owners are diligent in pursuing appeals and years two and three of the triennial cycle typically dip slightly. Over time, the commercial real property total assessable value trends upward.

SOURCE:
When compared with adjacent submarkets at the close of 2023, the City’s Office and Flex categories once again outperformed Silver Spring, Rockville and Germantown, although all locations experienced an increase in vacancy driven by a nationwide post-pandemic decline in office demand.
Within the City, REIT-owned shopping centers captured replacement tenants when vacancies occurred, causing no change in the vacancy rate for retail properties. Flex vacancy declined slightly.
$100,000
The Economic Development Opportunities Fund and the Economic Development Toolbox provide direct assistance to companies investing in upgrades to real property. Expenditures from these funds depend upon whether financial incentives are necessary to attract and retain employers. No transactions from the Opportunities Fund were completed in FY23. Small business relocations and expansions continued to drive demand for the Toolbox program. Recipients included a small biotechnology company, retailers and personal services businesses. Funds primarily supported reinvestment in aging retail buildings with an added focus on façade improvements in Olde Towne. In one case, funds were awarded for conversion of a vacant office property to life sciences space.
In FY23, the City changed the process in which Toolbox funds are encumbered. Although disbursements dropped, grant awards totaled $174,907.
Median Household Income
Source: Esri Business Analyst
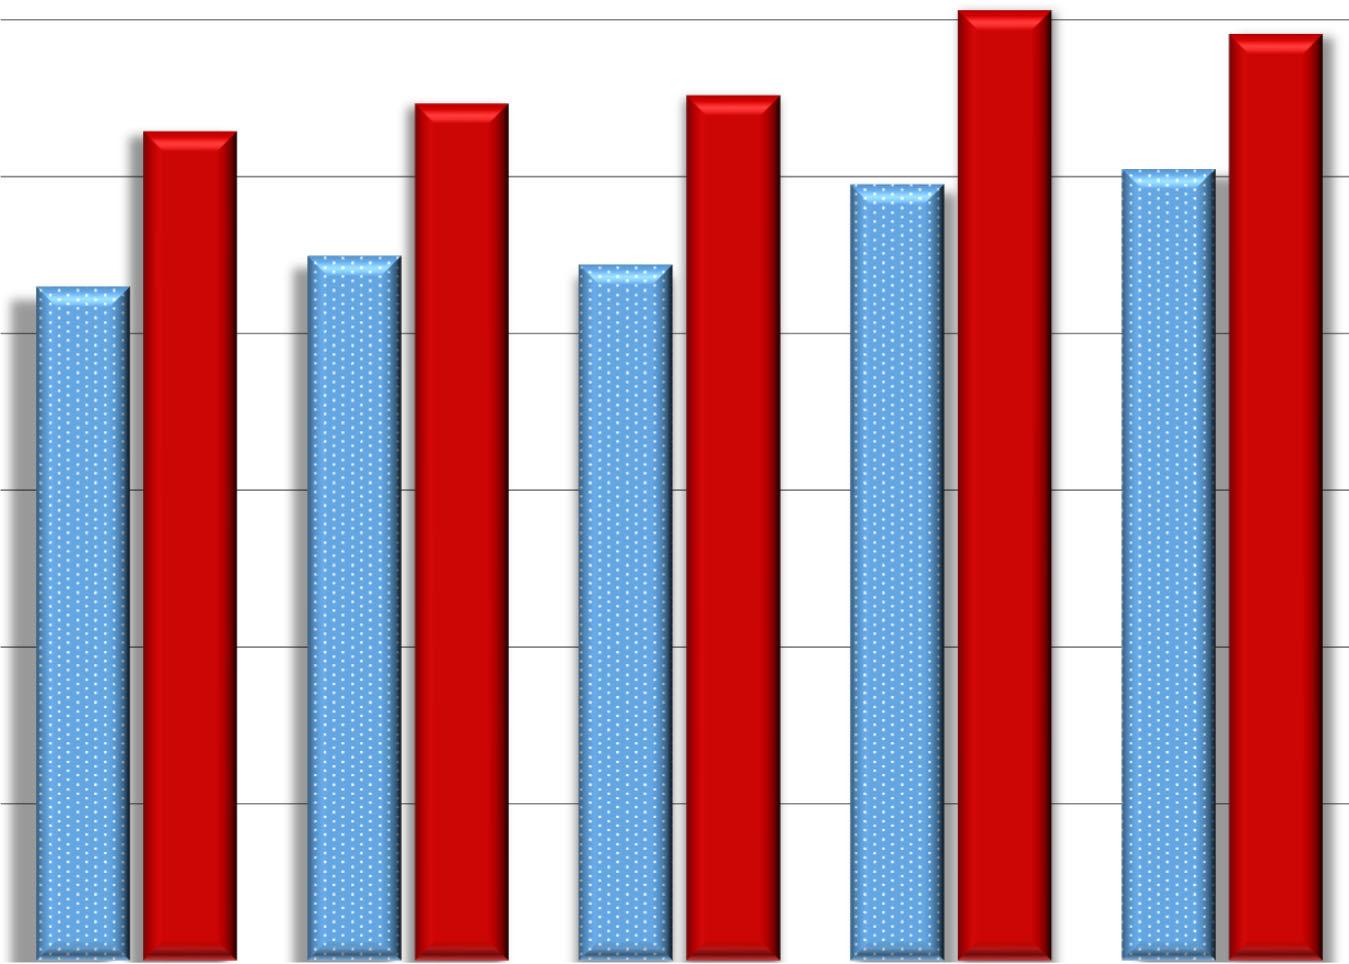
Gaithersburg Median Household Incomes increased between 2022 and 2023, a change attributed to the continued recovery from the pandemic, a tight workforce and inflation. The City’s monthly unemployment rate opened 2023 at 2.6% and peaked the next month at 2.8%. By June, the rate had fallen to1.5% and stayedunder 2% for the remainder of the year. $85,988
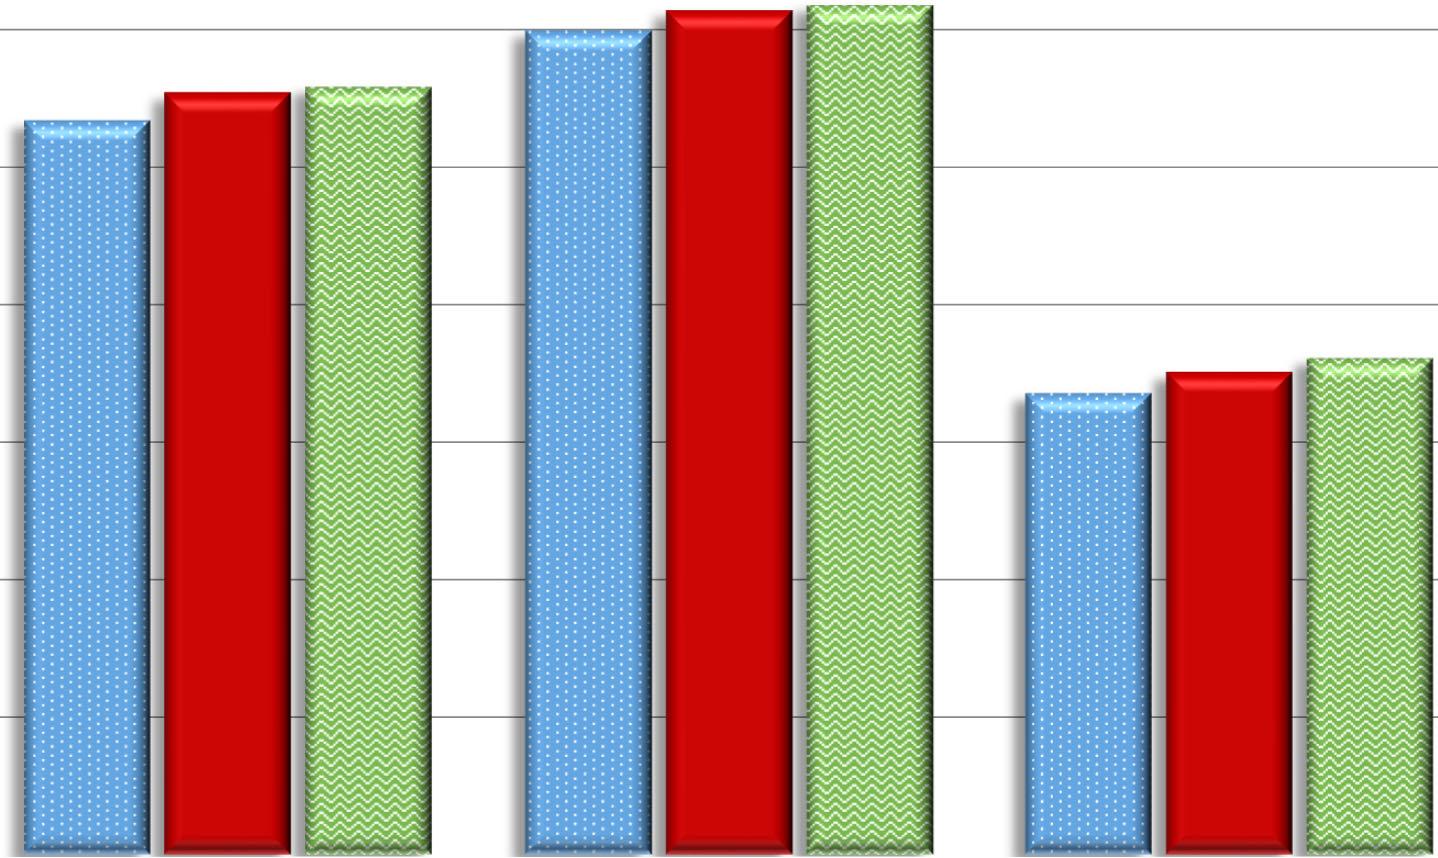
The percentage of residents with Bachelor’s Degrees or higher increased slightly in the City, paralleling the same trend as that of Montgomery County and the nation as a whole. As in the past, local rates of educational attainment far exceeded the U.S. rate.
2,000.00 3,000.00 4,000.00 5,000.00 6,000.00 7,000.00 8,000.00
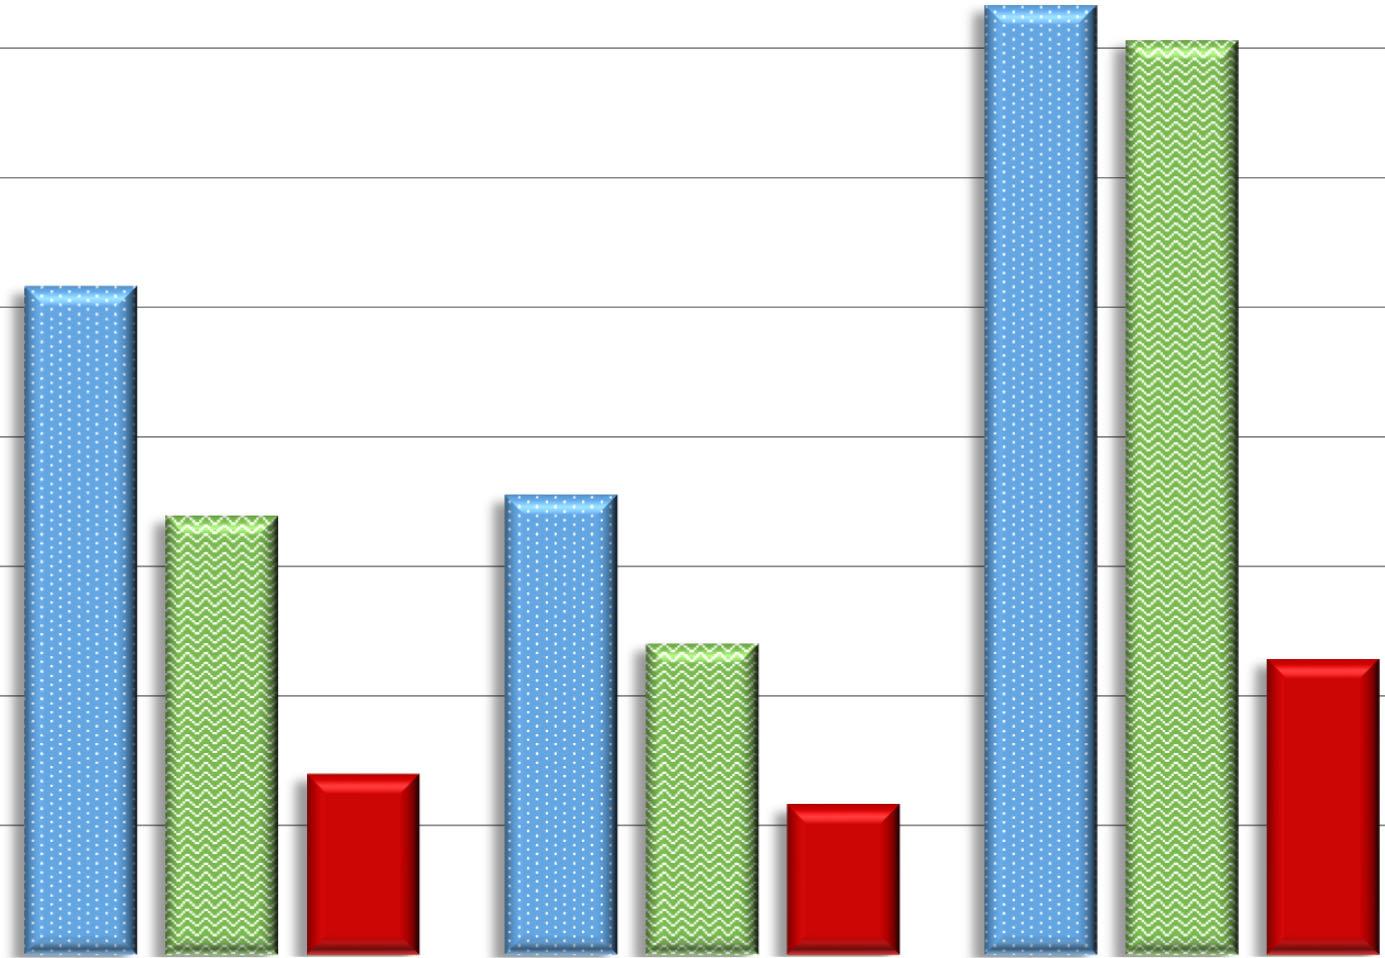

Visitors to the City’s Economic Development website, www.growgaithersburg.com, decreased when compared with the previous fiscal year. External factors influencing the decline included changes to X, formerly known as Twitter (previously a source of traffic), and the availability of relevant community data on other widely known websites.
The website continues to provide unique information related to business attraction and expansion. Although the audience is smaller, the users tend to be more committed to locations within Gaithersburg.

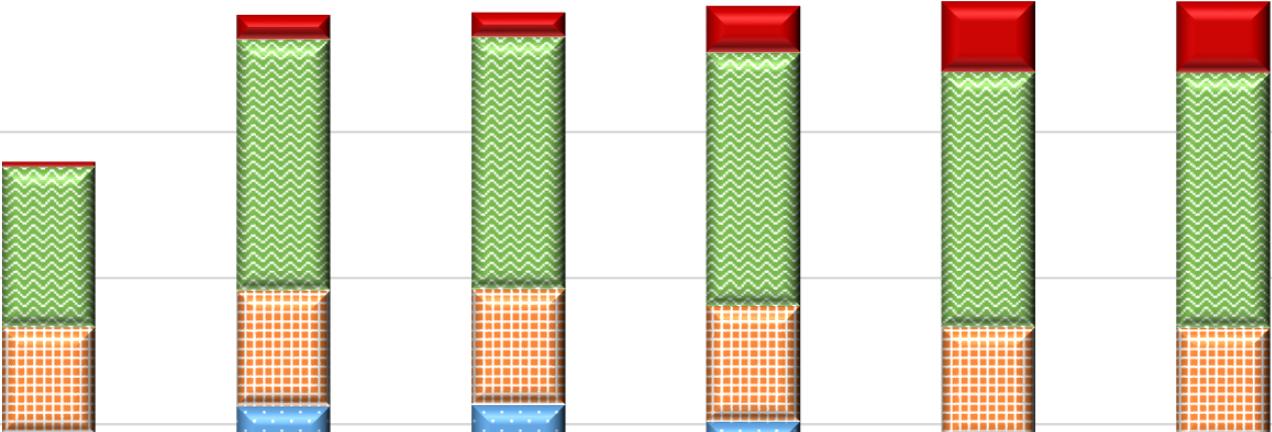
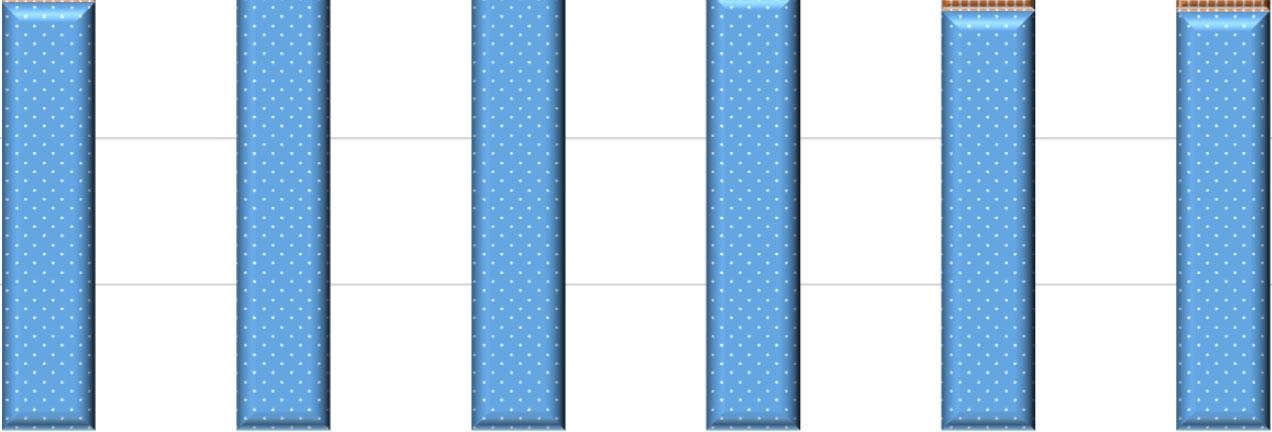
This chart illustrates the City’s progress towards its water quality goals set by the Maryland Department of the Environment. The City chose 2006 as its baseline year. Some of the projects are funded through the Stormwater Capital Improvement Plan. Other projects occur as redevelopment is required to meet modern water quality regulations. Alternative water quality control practices, such as street sweeping and stream restoration projects, earn equivalent-acreage credits towards the goal. The City fully met the permitting requirements by the end of the permit term –October 31, 2023.
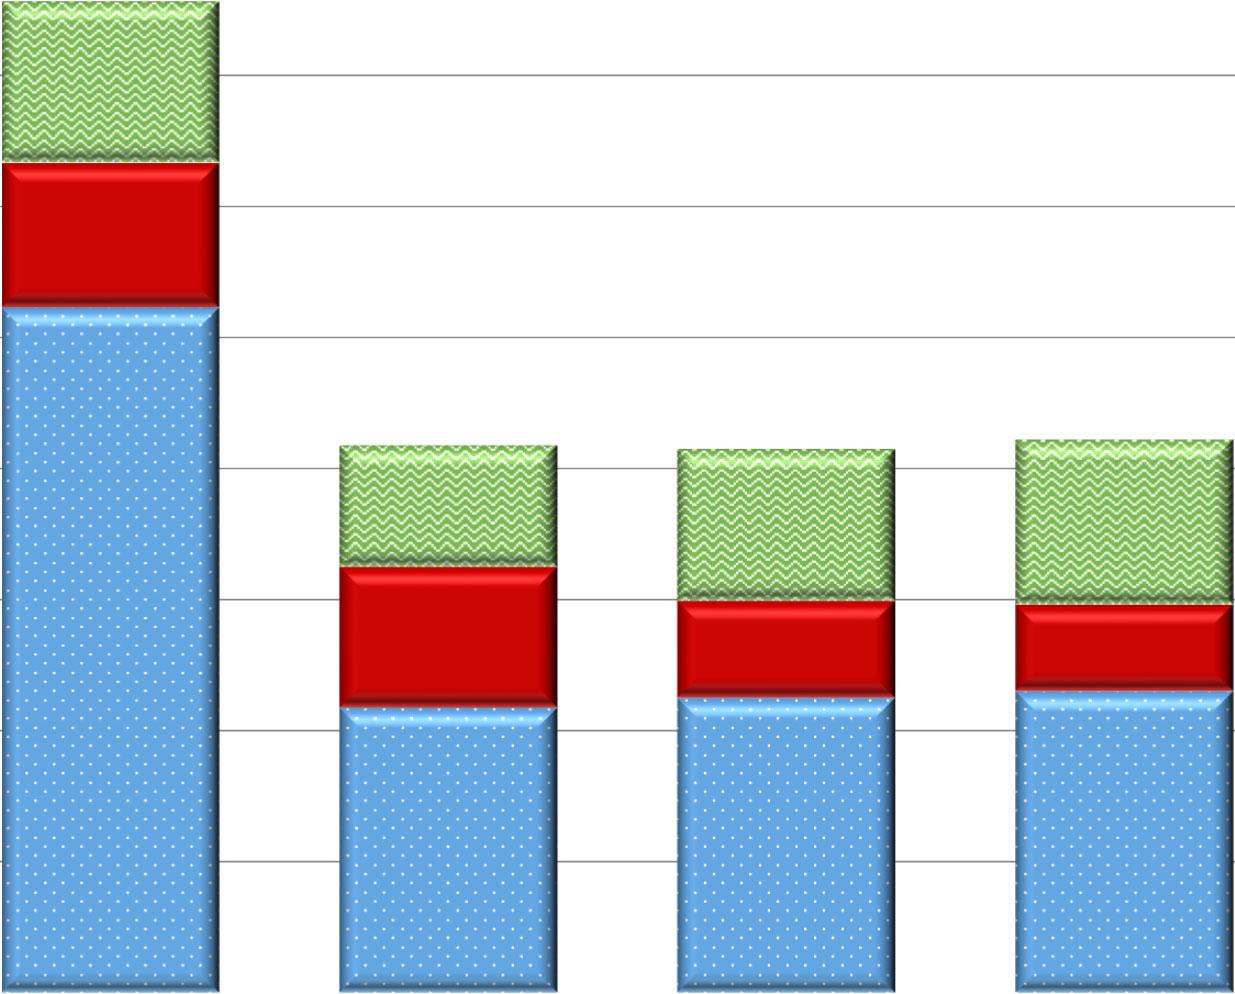
Buildings and Facilities Streetlights Vehicle Fleet
Municipal emissions are shown in three major City emitting sectors: Buildings and Facilities, Vehicle Fleet and Streetlights. Calendar year 2022 shows overall emission levels staying relatively stable. Emissions from streetlights continue to drop as the City works through it’s fiveyear LED streetlight conversion program. Emissions for buildings, facilities and fleet show slight increases over 2021 levels.
*Data for this chart is provided on a calendar year basis. As such, 2023 data and analysis will not be available until June 2024.
*2023 data as of June 30, 2023.
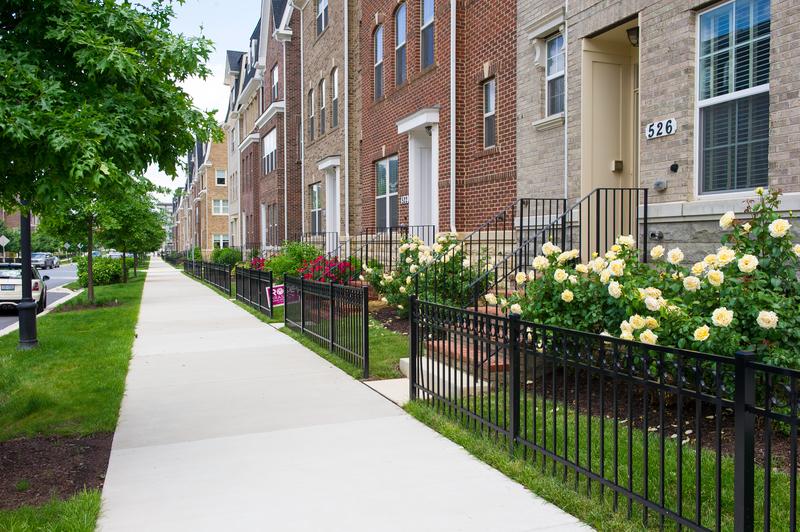
For more than a decade, the City has provided zero-percent deferred loans to assist low-and moderate-income families purchase residential properties in Gaithersburg. With so few MPDU and WFHUs available, this program enables eligible buyers with little savings to purchase their first home. Of 347 loans issued since 2009, the City has received approximately $617,000 in repayments with just one foreclosure and one short sale during that period.
Compared to the median home value of $595,000 (SDAT 2023), the median purchase price for all GHALP buyers in FY24 was $361,731. Financial incentives to encourage purchases in high opportunity areas of the City appear to help as most buyers, 77% (10 of 13), purchased their homes in the opportunity designated areas during fiscal year 2023, leaving 23% (3 of 13) who purchased their homes in the standard designated areas.
Recent changes to GHALP included increasing maximum incomes from 100 to 120% of AMI for priority employment categories (City employees, first responders,
and K-12
*Average per year (2014‐2017)
**June –November 2019
According to 6-month data provided by the Sheriff’s Department, just 99 evictions were filed in Fiscal Year 2023 and the last six months of Fiscal Year 2022. Staff were unable to obtain eviction data from the Montgomery County Sheriff. Although staff received a list of evictions, it is unclear how many actual evictions went through the entire legal proceedings.
The City provided emergency rental assistance for 77 households during FY 2023.
Federal grants to the State, County and City have done much to relieve the financial burden on our renter households. Nearly all of the tenants receiving CDBG funds this year meet the federal definition of extremely low-income.
An analysis of advertised market rents (CoStar) continues to reflect the disparity in costs based on geography and age of construction. Two-bedroom units west of I-270 consistently have higher rents than those on the east side of the City. In new properties, rents are significantly higher than the median two-bedroom rent of $2,212. The chart shows average rents from eight sample apartment complexes. Rents in the four complexes west of I-270 averaged approximately $2,724/month while rents in the three complexes east of I-270 averaged approximately $1,933/month.
The 199-unit Crossings in Olde Towne, serves households up to 60% of AMI through the federal Low-Income Housing Tax Credit (LIHTC) program. Rents for two-bedroom apartments under the City’s MPDU program were $1,616 in 2023.
A recent examination of City multi-rental properties revealed that about 14% of the total number of units are affordable under some regulatory requirements, including MPDUs and WFHUs. However, notable is that so few are affordable to households at the lowest income bands who are most vulnerable to eviction and homelessness (especially those below 30% of the Area Median Income). Those households need ongoing deep subsidies, such as through HOC or other public housing agencies. Unless the federal government, Department of Housing and Urban Development, funds more Housing Choice Vouchers (HCV), few if any additional households will receive assistance needed to pay even “affordable” rents. Consequences include paying an even higher proportion of income on rent and foregoing other expenses; doubling or tripling up in a single unit; or moving to a less expensive apartment elsewhere.


* Unable to get information from Sheriff’s Office to update this slide.


Quick and focused action on the part of governments prevented most evictions and residential mortgage foreclosures. Since the immediate crisis has now ended, the challenge for the City and its residents with low and/or fixed incomes is getting the assistance they need to remain in their homes as rents are now rising in a post-COVID19 housing market. Staff anticipated that income and rent-restricted properties would have lower rent increases and market-rate properties would have higher increases. (See the rent increases for the five apartment communities west of I-270 shown previously.) Montgomery County is no longer assisting with COVID related rental assistance.
In Gaithersburg, housing affordability has long been a challenge for large segments of our population. Based on the ACS data (2022), cost-burdened households (i.e., paying more than 30% of income on housing expenses) make up almost half of all the City’s tenants. Black and Hispanic tenants are the most rent-burdened. One in five Black tenant households spend more than 50% of their income on housing expenses and one in four Hispanic tenant households spend more than 50% of their income on housing expenses. This problem will likely become more acute as the median rent for a twobedroom apartment is $2,212/month. Moreover, Gaithersburg’s large percentage of minority households have suffered employment losses exceeding White and Asian residents.
Over the past several years, our greatest housing concerns were two-fold: insufficient funds to assist every eligible resident and disproportionate numbers of City residents receiving writs of restitution (eviction notices). The CARES Act lifted the statutory cap on financial assistance and courts were not processing evictions related to COVID-19 (as noted above, the eviction moratorium has ended).
The lower-than-peak number of GHALP loans issued in FY22-23 may be a result of COVID-19 and an almost doubling of mortgage rates. Whereas prior years saw up to 60 loans in a 12-month period, the City made GHALP loans to only 13 households over the past year, with two loans going to households with incomes above the HUD maximums. Should interest rates drop, there could be greater demand for the City’s GHALP loans.
The increase in high-income households continues to rise in the City. This increase can largely be attributed to new residential growth at Crown and Parklands, as well as increasing numbers of higher-income households in Lakelands and Parklands. Finally, there are several market-rate residential properties under construction. One of these has opened in this spring (2024), and one is scheduled to come on-line in summer 2024. Additional properties are in the pipeline and projected to be completed in 2025-2026. These will likely add more moderate-and high-earning households to the City’s population.
(Budget)
(Actual)
*CorrectionstoallthedatawasmadeforFY22.Forexample,thenewUtilitySoftwarewasabletodissectthedatatoallowfor reportingintherightreportingperiods,anddiscrepancieswerefoundwhereaccountsintheoldsoftwareweremiscalculatingboth supply&demandintototalelectricalusage.Othererrorswerefoundinwaterusageaswell.
**TheFY21squarefootagedecreasedto518,835duetothedemolitionoftheCPSCwarehouseand307&305SouthFrederickAve.
Current City of Gaithersburg (Actual) ($/GSF) City of Gaithersburg (Budget) ($/GSF) International Facilities Management Association Baseline*
*TheInternationalFacilitiesManagementAssociationBaselinewasupdatedin2017&2022.Theirpreviouslypublishedbaseline wasfrom2013.TheFacilityOperatingBaselineCostincreasedfrom$6.54to$7.49to$7.96pergrosssquarefoot.

Due to a maintenance strategy that focuses more on preventative maintenance rather than reactive maintenance, we saw a drop in the number of work orders performed in FY 2023. With this focus on preventative maintenance and the replacement of equipment that is either near or past its service life, the operating cost per square foot has increased by over $1.55 per square foot post-COVID-19 in FY 2023 compared with that of FY 2019. This seems counterintuitive as it would seem that the costs to operate should go down. However, the initial investment in the new equipment and the current market conditions have caused costs to rise. However, over time as more and more of the equipment is replaced and the City’s equipment baseline is reestablished, the costs will come down.
A high level of water usage is evident within the City already for FY24. This is due to two extremely large estimated bills that were billed to the City by WSSC.
The construction of 16 South Summit Avenue and the recent two colder winters are the resulting factors in the rising usage numbers in both electricity and natural gas.


AmusementVendors
012291,090171,148
Neighborhood Services Activity Total Number Property Maintenance Inspections Notices of Violation Municipal Infraction Citations

Proactive and reactive inspections resulted in 41% of the properties being cited. There was a 99% compliance rate on Notices of Violations issued.


FY 23 FY 22 FY21 FY 20 FY 19
The Water Park revenue offset was impacted due to the minimum wage increase as well as weather conditions. Staff continued to focus on serving the Gaithersburg City residents and aquatic members, while limiting residents of Montgomery County to weekday attendance only. The Water Park will welcome Montgomery County residents on weekends for Summer 2024.
Revenue offset for Recreation Classes increased due to the expanded variety of class offerings and increased number of participants per class. Recreation Classes continue to grow each season with classes being held in facilities throughout the City.
The Benjamin Gaither Center (Senior programs) revenue offset has steadily increased since the Center reopened to members in June 2021.
Summer Camps revenue offset had a slight increase from the previous year but overall remained consistent with the yearly average. Fees are assessed annually to account for increased expenses and minimum wage.
$35,551/$105,397
No Festival (FY22‐ 2022)
No Festival (FY21‐ 2021)
$43,680/$102,425
$33,810/$97,353
$11,695/$147,330 (FY23–2022)
Canceled day of event (FY22–2022)
No Festival (FY21 ‐2021)
No Festival (FY20 ‐2020)
$19,630/$134,707 (FY19 ‐2019)
$152,610/$448,298
$128,160/$396,360
$21,870/$255,840
$88,304/$368,612
$280,801/$583,960
$164,969/$519,247
$21,230/$263,290
$178,627/$382,991
$274,128/$555,978
$54,445/$129,320
$41,038/$153,461
$19,735/$26,316
$16,020/$13,105
$37,220/$134,204
$552,579/$239,484
$695,827/$205,663
$598,210/$196,140
$422,937/$194,695
$353,964/$243,925
$144,782/$350,169 Associated Revenue/Expense
FY23 FY22 FY 21
In-person programming resumed fully in FY23 with the first SummerFest since FY19. Event revenue from vendors and sponsors was modest for SummerFest as businesses were still reopening. By Oktoberfest, event revenue was almost back to pre-pandemic levels as was attendance. Winter Lights continued to reap strong earned income and sponsorships, although not quite at FY21 and FY22 levels.
The Kentlands Mansion experienced a surge in social rentals that resulted in revenue that in some months matched or exceeded pre-pandemic levels. Overall, the Mansion saw much greater attendance for rentals and programs than in the past two years. The Arts Barn brought earned income up to FY19 and FY20 levels with attendance only 6% less than FY19.
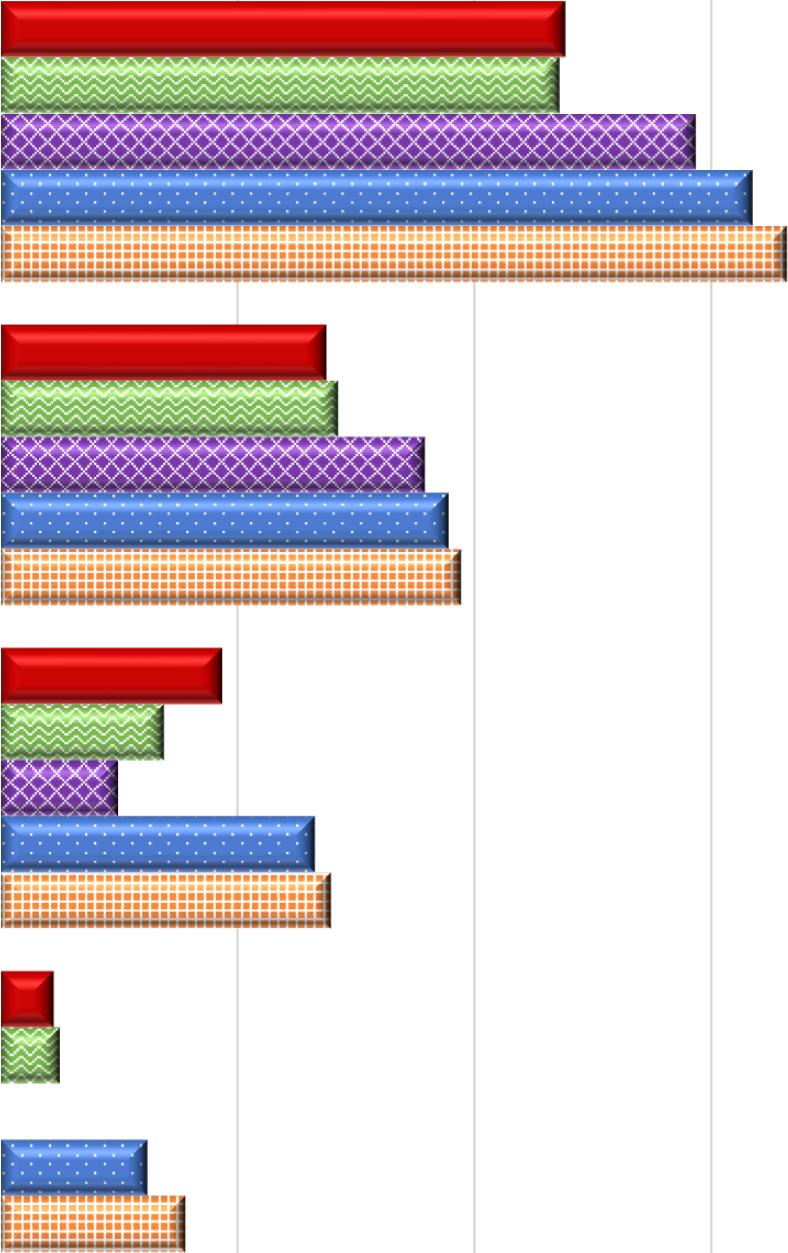
This chart represents the average number of weekly meals served at the Center through the federally supported nutrition program. The Senior Nutrition program returned in 2021 for several months and then ended due to low participation. The Senior Nutrition program returned again in February 2023, but as a three-day-per-week program.
The monthly average of memberships chart does not show the rolling expiration of membership extensions given during the pandemic. As these extensions expired, membership dropped to a low of 408 in June 2022. After that, memberships steadily increased throughout FY23 to 516 in June 2023.

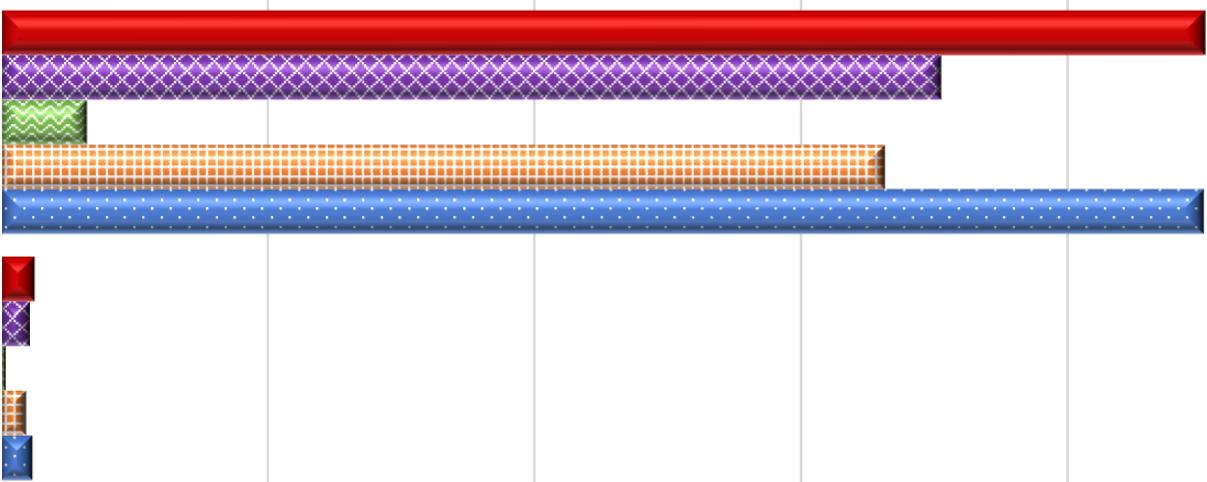
Summer Camp registration totals as well as Youth Center membership and attendance set new records in FY23. Note that camp enrollment numbers in FY23 continued to increase due to expanded age requirements at additional sites, allowing younger campers to enroll. Three camp programs returned to Title 1 elementary schools where Extended Learning Opportunities (ELO) is offered. For the 2023 summer season, traditional camps operated in City facilities as well as MCPS school buildings. Both Youth Centers and the Activity Center were utilized to the fullest extent for camps and other out-of-school-time programming.
GYC membership totals surpassed historic totals in FY23 as the team dedicated themselves to outreach at schools, neighborhoods and community events. Drop-in attendance after school at both Robertson Park and Olde Towne Youth Centers also increased significantly and Olde Towne Youth Center set a new record for visits with an average of 100 students attending on school days.
ThetotalnumberofapplicationsinFY23decreasedagaincomparedtoFY21andFY22. WhilethetotalapplicationsinFY23werelowercomparedtotheprevioustwofiscalyears, thetotalamountofapplicationsprocessedwerestillconsistentwithhistoricalaverages. ExpectationsfordevelopmentinFY24areprojectedtobeconsistentwiththehistorical averageofpreviousyears.
FY FYFYFY23 Permits and Licenses

**Fire Protection System Operation Permits
New Commercial Buildings
Interior Fit‐ups
New Commercial Occupancy Permits
Residential Improvement Permits
New Residential Permits
Site Development
Sign
Fire Services
FPSOP** Licensed
Electrical Licenses

Notably, the existing building Fire Systems Licenses continued to increase in FY23 as expected. FY24 should see a slight increase in FPSOP licenses and then level off in FY25. Commercial permits remained consistent in FY23. However, new residential permits saw a sharp decline with the completion of Crown Farm. With the expected development in FY24, new residential permits should begin to increase again in late FY24 or early FY25.

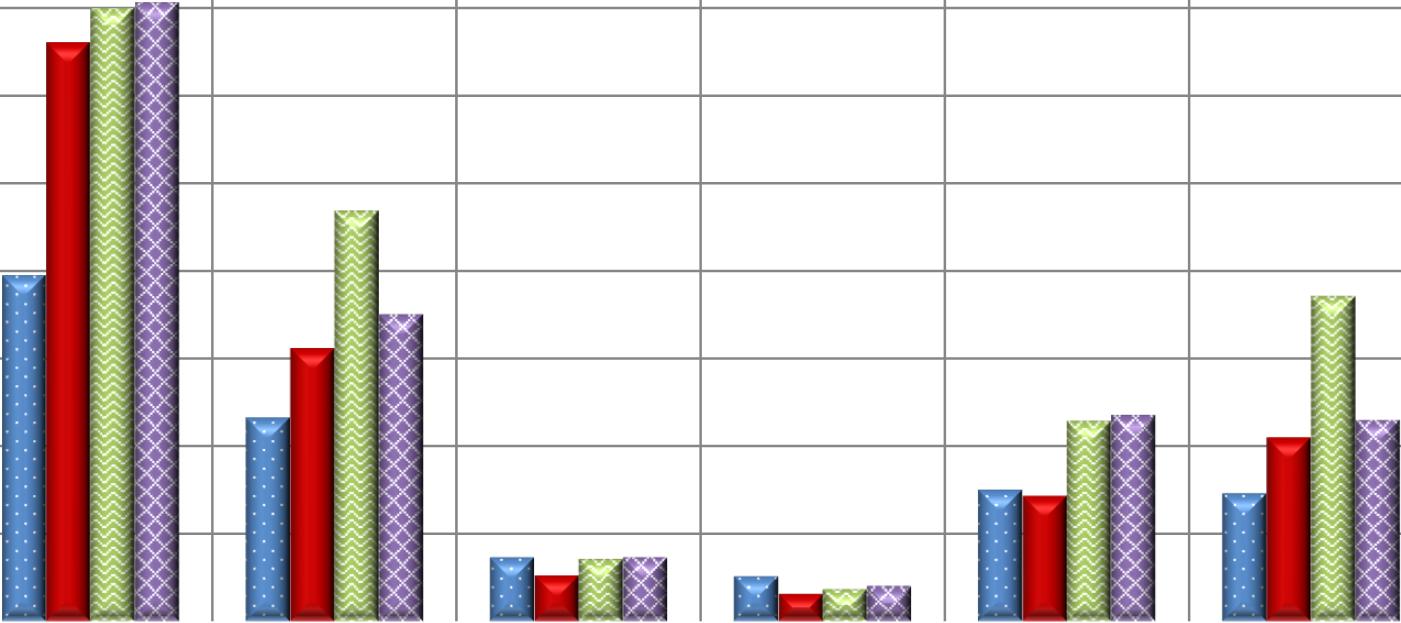
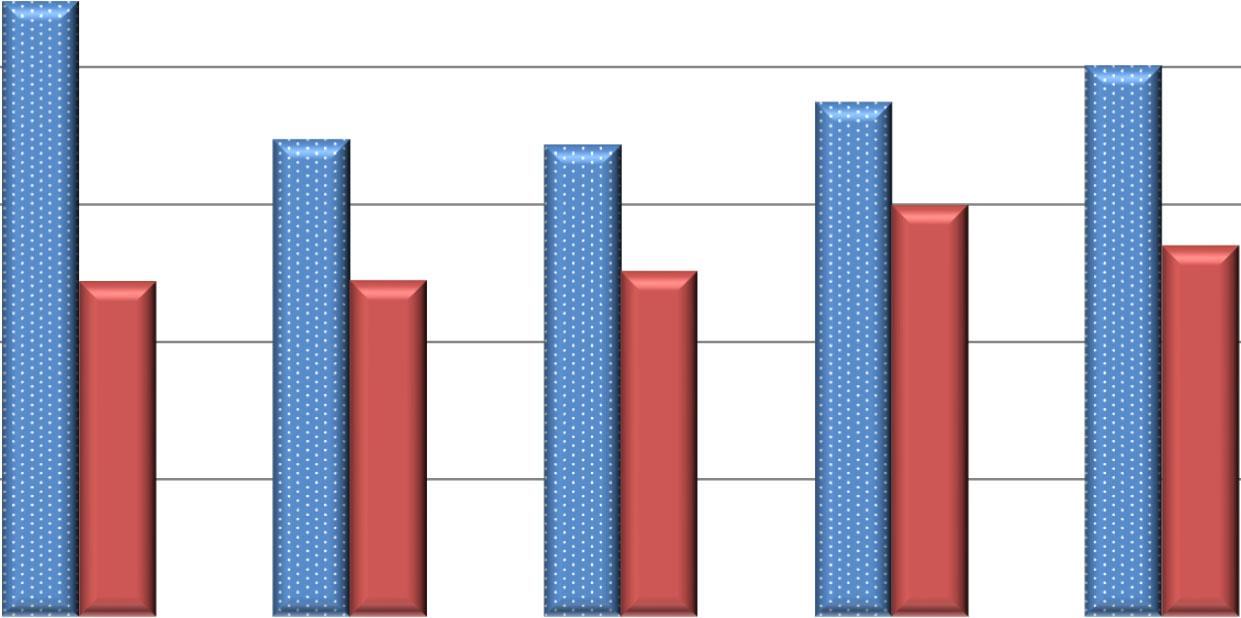
Inspection totals for FY23 were consistent for the most part with FY22 with some declines in electrical and fire inspections. FY24 totals are anticipated to remain equal to or slightly decrease from FY23 due to the development at Crown Farm being completed.

Percentage
Calls in the City* Calls Handled by GPD Percentage Handled
*Total calls include dispatched calls plus self‐initiated calls
Dispatched Calls in 6D and Dispatched Calls in the City
DISPATCHED CALLS IN THE CITY
DISPATCHED CALLS IN MONTGOMERY CO. 6TH DISTRICT (including City) POPULATION (City estimates, US Cenus estimates not available for 2018) * Data provided by Montgomery Co. Emergency Communications Center

• Note: GPD and MCP have different reporting definitions for a “closed case” • GPD
(2
Data reported as of 02/05/2024 from the MCPD PowerBI Database..
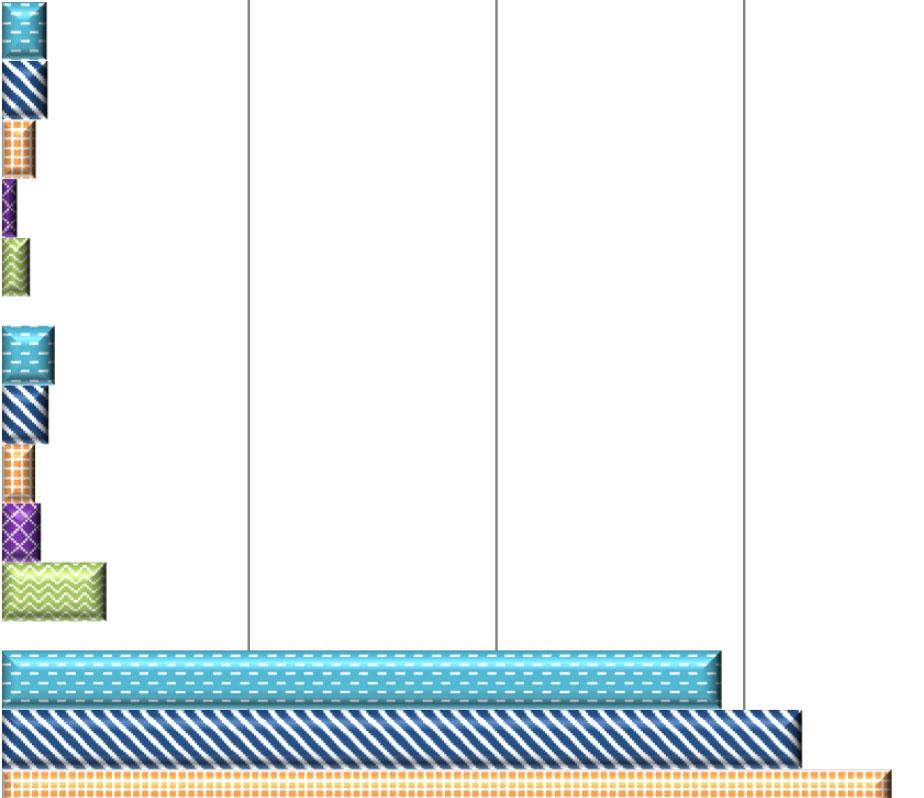
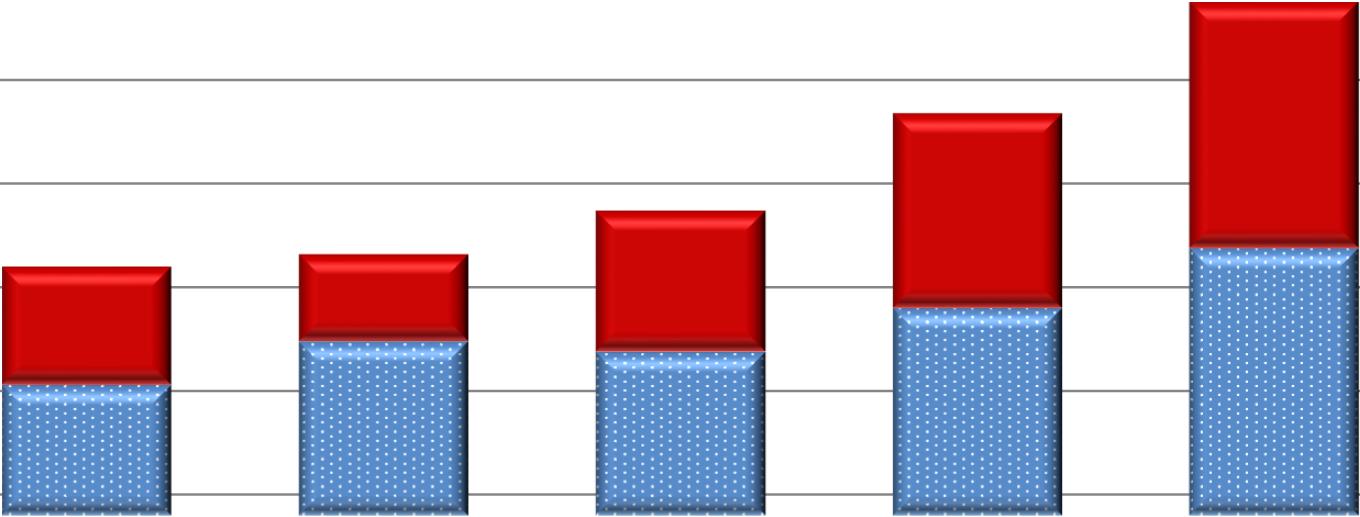
The crime data for this report was pulled on February 5, 2024 from the Montgomery County Police Department’s Power BI Dashboard, which is reporting using the National IncidentBased Reporting System (NIBRS). Under NIBRS, MCPD records all offenses associated with an incident, rather than only the most severe offense, which provides greater specificity in reporting (greater capability to break data into more categories). Under NIBRS, there are 52 Group A offenses that are further categorized as crimes against persons, crimes against property and crimes against society.
Crimes Against Persons, which includes offenses such as homicide, assaults and sex offenses, increased 12.2% from 658 offenses in 2022 to 738 offenses in 2023.
Crimes Against Property, which includes offenses such as burglary, robbery, theft, and vandalism, increased 21.7% from 2,080 offenses in 2022 to 2,532 offenses in 2023.
Crimes Against Society, which includes offenses such as drugs and weapons, decreased 29.3% from 443 offenses in 2022 to 313 offenses in 2023.
Overall, there was a 12.6% increase in Group A offenses from 3,181 offenses in 2022 to 3,583 offenses in 2023.
The Department does a daily analysis of where and when crimes are occurring and targets the areas having the highest incidents and/or patterns with additional resources. We will continue to utilize proactive crime suppression initiatives and creative use of specialized resources to address crime within the City.


These metrics track annual animal licenses, nonresident dog park memberships sold, and requests for
FY19FY20FY21FY22FY23FY24 First Six Months
Contractor within 1 week
Pepco within 15 days
Contractor within 2 weeks
Pepco within 30 days
The turnaround time goal for the City’s contractor is to have a minimum of 90% of repair requests for City-maintained lights completed within one week. FY23 met the goal at 90%, and for the first six months of FY24 the one week repair rate was 95%. Overall, there were 645 contracted repairs completed in FY23.
Pepco struggled to keep up with the demand for streetlight repairs in FY21 and FY22. However, Pepco has made significant improvements in FY23 and over the first six months of 2024. Pepco completed a total of 446 repairs in the City in FY23
SeasonSnowfall
2020-202118.3” (Above Average)
2021-20220.5” (Below Average) 2022-202315.5” (Average)
Note: Snow lane miles differ from City inventory miles because the City performs snow removal on a few County-owned roads under an agreement.
Gaithersburg Citywide Centerline Mile Breakdown by Pavement Condition Index (PCI) Scale


Citywide CenterlineMiles Evaluated in 2021 =119 CM
A Citywide Pavement Condition Survey was performed in 2021, and it was determined that the overall PCI of City’s streets was 76.7, which is in the “satisfactory” range. Surface improvements completed in 2022 consisted of 3.9 centerline miles of microsurfacing and 0.7 centerline miles of resurfacing. The next PCI condition evaluation will take place in 2024.

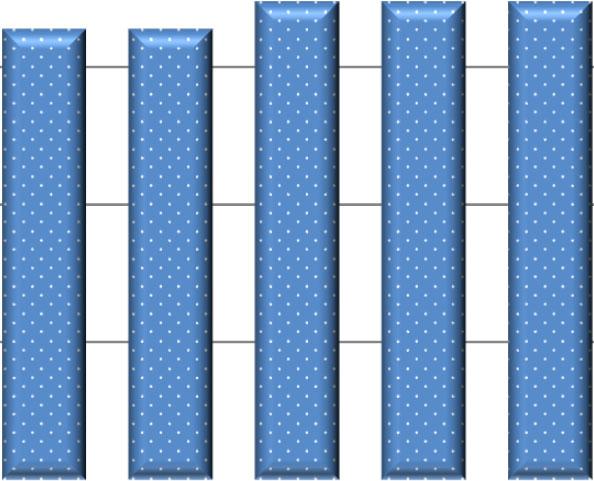
Sidewalks include true sidewalks and multiuse paths adjacent to City roads. This number will likely increase in 2024 as new streets are turned over to the City from developers.
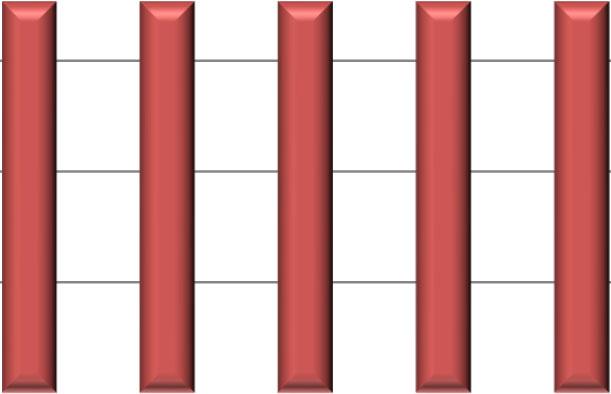
Off Road Bicycle Facilities include multiuse paths and greenways not adjacent to roads. This number will likely increase over the next several years after completion of a number of projects currently in the planning and design phases.
On Road Bicycle Facilities indicate City streets with sharrows. Analysis
The one year American Community Survey (ACS) data for 2022 reflects the first full year post-COVID pandemic. This is evident in the 2022 data, which reflects increased work commute times as people returned to the office and work from home (sequestration and remote work) dropped almost 8% from 2021. Most other modes, aside from carpooling (a possible holdover of social distancing) increased as to be expected. No trends can be fully analyzed based upon previous years, but the numbers signal a return slowly to "normal" modes or working.