Public Space & Public Life


Vancouverites — like people around the world — value inviting, interesting and creative public spaces. We recognize that a high quality public realm benefits our health, generates economic activity, fosters social connections and makes our city more exciting and inspiring.
Downtown is the heart of the city, and features much of what attracts people to our growing West Coast metropolis – vibrant and multi-cultural neighbourhoods, active and engaged communities, deep social and environmental values, and a growing and dynamic economy – all set against a stunning natural backdrop. Downtown is also home to some of the most popular public spaces in Vancouver, including Robson Square, Granville Street, the Seawall and Stanley Park, which draw hundreds of thousands of people on a daily basis.
As Downtown continues to grow with more residents, businesses and visitors each year, we are presented with opportunities, as well as challenges. This means increased demand on the existing public space network in the future. Since space and opportunities are limited, we need to be creative and strategic in how public space is delivered and managed.
We also need to consider the challenges of climate change and sea level rise, changing demographics, new technologies, social isolation, homelessness, as well as accommodating a population that is living in more compact spaces, where public space is the collective backyard and living room of many residents.

Places for People Downtown provides a unique opportunity to reflect on our past work, and the new challenges of our time, to put forward a new approach to public space planning with a focus on public life and people-centred design that starts with an understanding and appreciation of the people who use public space on a daily basis.
To help us develop this new approach, the City of Vancouver partnered with Gehl to conduct the largest and most comprehensive Public Space and Public Life Study in the Americas.
This report contains a summary of the study and its findings. Using ‘people data’, it considers how people use our Downtown public spaces and streets, and provides an assessment of how people get around the Downtown Peninsula and how our public spaces could better promote public life. The report also provides us with a useful benchmark to assess our city against other cities that have been studied by Gehl, including New York City, San Francisco, Seattle, Copenhagen and Melbourne.
I am pleased to present the summary of this work, which will help us make informed decisions in the development of a Downtown Public Space and Public Life Strategy in order to transform and elevate our Downtown into a welcoming, accessible, connected, attractive, distinct and people-centred heart of the city.
This study could not have been completed without the tremendous effort of the dedicated volunteers who contributed their time and passion to this effort. We would like to extend a huge thank you to everyone who participated in this study and we are excited to continue to build relationships with community partners and directly involve the public in this and future endeavors.
We are at a moment in Vancouver’s history where we are experiencing immense change, and it is imperative that we are intentional about the future of our city – how we live in, work in and enjoy Vancouver. As we develop a shared vision for our future, we can ensure that Vancouver continues to evolve as a great city for people.
Gil Kelley, General Manager, Planning, Urban Design & Sustainability City of Vancouver
Through this study we found that Downtown Vancouver is: Executive summary
→ a vibrant series of neighbourhoods, where people live, work and recreate → providing a high quality public realm, that serves both locals and visitors
→ home to a community with a strong culture of participation → an outstanding walking city that invites people out walking all year
People love Downtown, but they want more!
However...
Vancouver is growing, and it's growing fast. It is more important now than ever that the city continue to foster Public Life with:
→ Invitations to spend time in the public realm all year-round, for all Vancouverites.
→ Opportunities to connect and socialize with each other.
→ A public realm that supports everyday life experiences, not just events.
→ Opportunities for Vancouverites to shape their public realm and actively participate.
The high quality of life that we enjoy is very much interconnected with public space and public life; successful public spaces and public life promotes civic agency, fosters health and sustainability, supports local business, builds social capital, and connects people to their local communities.
Public Life is the shared experience of the city created by people when they live their lives outside of their homes, workplaces and cars. It is the everyday life that unfolds in streets, plazas, parks, and spaces between buildings.
Public Spaces are all places publicly owned or of public use, accessible and enjoyable by all for free and without a profit motive.
Taking Downtown to the next level requires creativity and a collaborative discussions as we navigate challenges and opportunities related to the public realm. Through Places for People: Downtown, the City has an opportunity to further invest in public spaces and public life.
This report is part of a larger scope of work under the 'Places for People Downtown initiative'. The following pages describe the initiative and intent of the project as well as the project approach.
A 'Data Appendix' that outlines all the collected observational Public Life data and a report outlining a series of 'Emerging Strategic Directions' will follow this report.
Note: In this document, 'Downtown' refers to the Peninsula and includes the West End.
This chapter introduces the context of the Public Space Public Life (PSPL) Downtown Vancouver project and the people involved. It highlights the reasons for doing this work now and provides background on the Public Space Public Life methodology developed by Gehl.
The methods used for collecting Public Life data are introduced along with the approach to survey site selection and development of intercept survey questions. PSPL is short for: Public SpacePublic Life.
Each of the eight stories in this chapter highlight key findings from the intercept survey responses.
This chapter's focus is on the Public Life trends across all surveyed sites, Summer and Winter combined. An overview summarizes eight stories and highlights key findings about Public Life in Downtown. The following pages dive deeper into each of the stories.
This chapter provides an introduction to the Public Spaces of Downtown by typology. Spatial qualities and challenges are highlighted by Public Life data, which visualizes how each of the spaces are used and experienced today.
Places for People Downtown is a City-led initiative that will provide a framework to shape the public space network in Downtown Vancouver over the next 30 years.
The strategy will explore opportunities for public space and public realm improvements in the street right-of-way (including wider sidewalks, street-to-plaza conversions and laneway improvements), public spaces on City-owned or other public land (including plazas and open spaces), and privately-owned public spaces (POPS) such as office plazas.
The findings outlined in this document will inform a vision for Downtown Vancouver that enhances public space and public life, and will help shape the development of the Downtown Public Space and Public Life Strategy.
For more information see: vancouver.ca/placesforpeople
PSPL - Public Space, Public Life
The purpose of this PSPL is to put people at the forefront of urban design and decision-making in Vancouver, rated as one of the most livable cities in the world, starting with the Downtown Peninsula.
The PSPL is a way to study how Public Life unfolds in the city today and to understand what some of the needs and demands are for future Public Space development. It is a way to benchmark Public Life and provide strategic recommendations for future Public Space development to inform the Places for People Downtown strategy and vision.
With this PSPL, Downtown Vancouver joins a network of world-class cities that are choosing to put Public Life first.
Among them are the cities of Copenhagen, San Francisco, Melbourne, Moscow and New York City.

Gehl practice has conducted Public Spaces Public Life studies in cities around the world. A PSPL provides empirical evidence and arguments for improving public space. Once we understand the life of a place, we start looking at what changes are needed in the physical environment to create a more sustainable and livable city for all.
Gehl's work is based on the research conducted by professor Jan Gehl. By considering the human dimension as a starting point for design, he has worked to improve cities for over 50 years.
The City of Vancouver is proud to work with Gehl Studio on Places for People Downtown. Gehl will support this work through the coordination of this Public Space and Public Life study in Downtown Vancouver.
Gehl will deliver a number of strategic recommendations based on their analysis of the date collected during these studies, and will work with the Places for People team to build capacity for future studies in Vancouver.
About GehlThe PSPL was kicked off with the help of the city's greatest asset: Vancouverites!
Catherine Neill
Belen Welch
Tess Munro
Adam Finlayson
Jared Dalziel
Kristen Elkow
Hale Jones-Cox
Alena Straka
Brittany Morris
Kaicea Pitts
Thomas Wade
Jimin Park
Stephanie Johnson
Karen Dar Woon
Aaron Lao
Helen Popple
Leslie Shieh
Haley Roeser
Devon Harlos
Raissah Kouame
Frances Maddin
Sailen Black
Dorsai Sharif
Laurel Eyton
Katie Stewart
Tristan Brimble
Crystal Wickey
Harprit Chamba
Amanda Mitchell
Sandy Hollenberg
Art Cooke
Rachna Ahuja
Shali Fadainia
Brittany Olson
NadiaAl-Wahaibi
Fausto Inomata
Eleonore Leclerc
Cody Gerow
Kristen Falconer
Ann McLean
Frankie Mao
Miguel Castillo
Grace AlindoganAgapito
Ray Tomalty
Linda Gillan
Brendan Bailey
Michelle Pollard
Ian Mac Phee
Lesley Fordham
Brady Faught
Jerry Wolfe
Jacqueline Ting
Lecia Desjarlais
Peggy Geary
Doug Stever-Akesson
Jennifer Page
Harcharan (Ron)Datta
Tina Chen
Patricia Fraser
Ann Goodell
Iva Jankovic
Imelda Nurwisah
Alix Krahn
Gordon Fraser
Emily Morales
Sasha Mc Arthur
Daniel Gibson
Guercy Thimoleon
John Cooper
Heather Rumble
Riley McLeod
Alana Marin Bourne
James Oborne
Kaicea Pitts
Jennifer Catarino
Michael Tyne
Megan Herod
Nancy Zegarchuk
Katherine Gerry
Sara Jellicoe
Lihwen Hsu
Nicholas Gallant
Natasha O’Byrne
Nancy Derpak
Jim Balakshin
Fern Walker
Tayebeh Fahimivala
Alyssa Ready
Riley Iwamoto
Arielle Dalley
Darcel Moro
Lex Dominiak
Patricia Gooch
Naina Varshney
Vicki Scully
Kasper Richter
Colette Parsons
Graham Cunningham
Danielle Neer
Leonardo Coelho
Jordi Honey-Roses
Allison Biggs
Brenda Longland
Cory Dobson
Cheryn Wong
Sahisna Chitrakar
Evan Hammer
Scott Erdman
John Chapman
Robert White
Sam Fu
Andrea Tam
Wayne Yee
Charlotte Zesati
Meg Kwasnicki
Ingrid Hwang Hwang
Alexandra Turnbull
Silvia Cordivani
Amanda Blicharski
Nicole Hillis
Sylvia Coleman
Nancy Hoang
Amelia Huang
Celina Vosilla
Hema Ramnani
Sebastian Mather
Renee Miles
Batuhan Yesilbursa
Peter Brouwer
Mitra Mansour
Melanie Trottier
Halina Rachelson
Katrina May
Miriam Wilson
Helen Ma
Scott Bell
Kirsten Robinson
Anna Zhuo
Travis Warren
Manali Yadav
Serena Yang
Katie Kulpas
Erin Bullen
Fernanda Canziani
Michelle Thai
Hilary Romans
Cliodhna Bourke
Sarah Chen
Grace Jiang
Landon Hawryluk
Peter Richard
Kevin Shackles
Peter Steel
David Paterson
Erik Perrier
Mary Kristine San Jose
Andrew Nakazawa
Farzaneh Naraghi
Lipika Singh
Stuart Hamre
Leigh Stickle
Robert Catherall
Adele Therias
Mandeep Sidhu
Angele Clarke
Monika Blat
Mojdeh Kamali
Lilly Wilson
Peter Mc Gregor
Beau Tanner
Michael Mc Burnie
Elona Saro
Maryam Ghaffari
Dolama
Lea Chambers
Filippos Gkekas
Kacey Ng
Kitty Wong
David Mahjour
Emily Rennalls
Julia Morlacci
Helene Miles
Olivia Hart
Sander Mozo
Joe Hyett
Chris Mah
Saki Aono
Jodi Shragge
Mandy Yu
Sarah Desaulniers
Yael Stav
Hector Abarca
Fiona Jones
Kayla Woodruff
Wayne OBrien
Vivienne Megas
Felipe Lima
Michael Wang
Bo Guan
Guerric Haché
Danielle Vallee
Yihan Ma
Kathy Dunster
Jeremy McElroy
Mary Ellen Pearce
Eva Murray
Daniel Hurt
Peter Kostka
Andrea Spakowski
Lily Raphael
Elizabeth Godley
Shirley Shen
Ian Mac Carthy
Ellen Molloy
Craig Busch
Jada Stevens
Matthew Friesen
Inge Neumeyer
Nickolas Collinet
Maria Lobit
Diana Chan
Yasmin Banitaba
Jordan Konyk
Paul Hayes
Valerie Bruce
Paul Cheng
Nicholas Gallant
Simon Liem
Emerson Mangilit
Anna Chow
Elayne He
Lisa Odland
Rachel Wong
Korine Deol
Dan Ward
Andrew Pask
Lipika Singh
Juliette Dubois
Cat Wong
Mojdeh Kamali
AnaNic Lochlainn
Peter Steel
Charn Gill
Lance PatrickSy
Jacqueline Lam
Qianqiao Zhu
Anke Hurt
Zane HIll
Veronika Metchie
Samuel Baron
Yingting Xie
Rob Gleeson
Diana Liao
Lindsay Neufeld
Lizzie Morris
Qian(Lexi) Feng
Claire Duxbury
Kelvin Lit
Edrick Dudang
Zak Bennett
Stella Zhou
Ignatius But Mauson Akhtar
Angelique Crowther
Nereida De la Mata
Eoin O’Connor
Sashavan Stavel
Emily Macrae
Amrutha S
Aaron Lao
Alfonso Hernandez
Andrew Al-Assadi
Fariche Alleyne
Iva Jankovic
Justinne Ramirez
Nell Gasiewicz
Sarah Labahn
Celine Hong
David Dunz
Fiona E. Walsh
Lincoln Saugstad
Linda Gillan
Matthew Callow
Angele Clarke
Angelique Crowther
Ben Daly
Brenda Clark
Cody Gerow
Elayne He
Eric Wang
Erik Mustonen
Esther Yuen
Graeme Muir
Jada Stevens
Joyce Liao
Juliette Dubois
Kacey Ng
Kaitlin Wiebe
Karen Campbell
Kelvin H. Castillo
Rocha
Kristen Falconer
Lea Chambers
Lora Terzieva
Michelle Ocfemia
Mozhdeh Eftekhari
Patrick Enright
Paul Hayes
Rebecca Paton
Rhi Kirkland
Riley Iwamoto
Ryan Dinh
Sander Mozo
Tanja Oswald
Tjasa Demsar
Yue Qiu
Adrian Myszka
Bonnie Ma
Cindy Nachareun
Fernanda Oliveira
Golmehr Kazari
Ieva Cornford
Janelle Zhao
Tina Barisky
Wesley Joe
Abdo RefaeI
Amrutha Sundarajan
Brittany Olson
Edwin Yee
Jane Bateman
Jessie Singer
Kristen Elkow
Sasha van Stavel
Shareen Chin
Zachary Bennett
Adam Finlayson
Aria Raufi
Danny Ross
Kamelia Ansari
Lesley Fordham
Liyang Wan
Luc Bagneres
Michael Nagel
Michelle Hoar
Qianqiao Zhu
Antonietta Gesualdi
Elayne He
Lilly Wilson
Sam Bai
Shawn Deng
Amanda Morgan
Christine Pilgrim
Craig Busch
John Chapman
Leif Thorseth
Michelle Cuomo
Natasha O'Byrne
Riley McLeod
Serena Yang
Thor Boe

Urantsetseg
Munkhbayar
Frankie Mao
Gramt Diamond
Jiwon Song
Kaicea Pitts
Maryam Ahmadi
Oloonabadi
Mélanie Trottier
Michael McBurnie
Renita Kralik
Scott Erdman
Tammy M
Anna Chow
Benas Lukas
Christine Popovich
Cristian Chavez
Darcy Keester
Emily Johnson
Hector Abarca
Judy Hussein
Julia Morlacci
Laurence Renard
Lisa Lai
Maria Lobit
Nicole Foth
Shazeen Tejani
Terri Doi
Theo Finseth
Willie Ng
Amelia Huang
Ehtesham Azad
Jenny Lee
Maxime Forges
Richa Chuttani
Sarah Kristi Lone
Dan Ward
Huihui Shen
Kimberly Ng
Mary Kristine San Jose
Sarah Chen
Shali Fadainia
Tania Oliveira
Todd Hunter
Alan Chen
Alexandra Lea
Ali Arzouni
Alycia Doering
Amandeep Kalsi
Amy Bolt
Ana Ni
Andrea Telfer
Andrea Spakowski
Andrew Nakazawa
Annelise van der Veen
Art Cooke
Ayishah Chui
Beau Tanner
Beverley White
Bruce Pagnucco
Bruna Ribeiro
Camilo Gil Cabral Filho
Cara Fisher
Charling Li

Claire Duxbury
Colleen Miller
Cristina Horta
David Paterson
Derek Robinson
Emily Paterson
Eric Douglas
Erik Perrier
Erin LaRocque
Eryn Kim
Graham Cunningham
Gwendal Castellan
Gwendolyn Tian
Heather Fletcher
Hema Ramnani
Hilary Onno
Ian Lam
Jasmine Pena
Jen Harvey
Jeremy McElroy
Joey Cheung
John Paul De Sousa
Juby Samuel
Judy Jiang
Julie Wong
Juliette Link
Kai Okazaki
Kate MacArthur
Kathleen Heggie
Khristine Carino
Kim Barnsley
Krystal Renschler
Lanei Lee
Leah Karlberg
Lecia Desjarlais
Leigh Stickle
Lex Dominiak
Linda Do
Lisa Slakov
Marco Sotres
Maria J. Verdugo Mota
Mary Yu
Maureen Solmundson
Melissa (Lauren)
Wright
Michael Tyne
Minyoung Hwang
Nati Herron
Nicole Markwick
Patti Walshe
Peter Stair
Rebecca Anderson
Sandy Hollenberg
Sarah Ellis
Scarlett Miao
Shannon Lambie
Taylor Keene
Ted Uhrich
Uytae Lee
Van Lee
Zane Hill

is Public Life and why does it matter?
Public Life is the shared experience of the city created by people when they live their lives outside of their homes, workplaces and cars. It is the everyday life that unfolds in streets, plazas, parks, and spaces between buildings.
Public Life is measurable, and cities that do so can help develop a high quality of public life through changes in the public realm over time. Public Life thrives when all people can enjoy being in public together, and is encouraged by quality Public Space that fosters social interaction. Vibrant Public Life promotes civic agency, supports health and sustainability, builds social capital, and connects people to their local communities.
Public Spaces are all places publicly owned or of public use, accessible and enjoyable by all for free and without a profit motive.
Public spaces are a key element of individual and social well-being, the places of a community’s collective life, expressions of the diversity of their common, natural and cultural richness and a foundation of their identity.1 The community recognizes itself in its public spaces and pursues the improvement of their spatial quality.
The public realm includes all elements that shape our public experience of the city, including public spaces, privately-owned spaces that are of public use, and the buildings that frame this environment. It is recognized that the public realm at its best expresses a collective vision which is greater than the sum of its parts, and it is important to consider how the many elements are arranged and designed to reflect the city’s character and aspirations. Pairing peoples' needs, values and principles with the creation of beautiful, usable, intelligent spaces that adapt to how people use them, helps people engage in the types of life they want to see flourish in our city.
1 Source: The Charter of Public SpaceBiennial of Public Space and adopted by the United Nations Program on Human Settlements (UN-Habitat)

Vancouver has done really well in creating an active Downtown. It is growing fast, and the public realm will need to work harder to accommodate more people in the future. Now is the time to make sure that there is a shared strategic vision targeting efforts moving forward.


Source: 2016 Census
Downtown Vancouver has a strong urban design culture with many initiatives working for a better Vancouver for all. A lot has been done already to create an active and thriving public realm and more initiatives are underway.
City Documents & Initiatives Informing 'Downtown Places for People' Strategy: Healthy City Strategy Action Plan (2015), Mayor’s Engaged City Task Force (2014),

The West End Community Plan provides a framework for this growing neighbourhood that focuses on neighbourhood character, housing, local business, heritage, transportation, and enhancing the public realm through projects that include the creation of Jim Deva Plaza and the Robson-Bute Plaza.
Note: Text above are all excerpts from the initiatives' websites.
West End Plan (2013), Transportation 2040 (2012), Vancouver Economic Action Strategy (2011), Greenest City Action Plan (2011), Complete Streets Policy Framework (2017), Downtown South Guidelines (Excluding Granville Street) (1991/2004), DD (Except Downtown South) C-5, C-6, HA-1 & HA-2 Character Area Descriptions (1975/2003), Downtown (Except Downtown South) Design Guidelines (1975/1993), Plaza Design Guidelines (1992), Central Area Plan (1991)
Source: http://council.vancouver.ca/20170329/documents/pspc2.pdf
Transportation 2040 is a long-term strategic vision for the city that will help guide transportation and land use decisions, and public investments for the years ahead. This vision is a part of our larger strategy to ensure an inclusive, healthy, prosperous, and liveable future for Vancouver that puts pedestrians first and promotes other active transportation options. It includes specific directions to enable and encourage creative uses of the street, and to create more public plazas and gathering spaces.
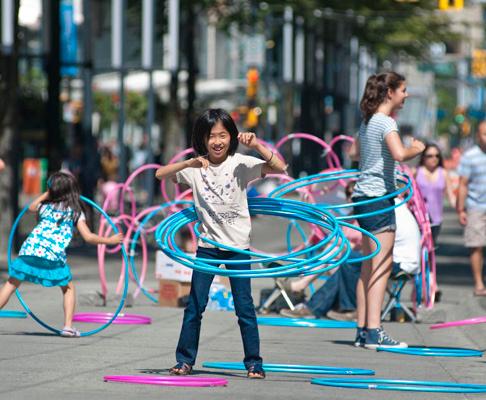
VIVA Vancouver is the City's tactical urbanism and public space innovation program. Working with community partners, VIVA facilitates the transformation of road spaces into people places, builds community capacity, and tests new locations, ideas, and ways of doing things to foster more and better public life.
(Source: City of Vancouver)
Vancouver is characterized by a dense Downtown surrounded by a sprawling metropolitan population, many of whom commute daily into Downtown. Active transportation is first choice for many people in Vancouver and when looking at the overall breakdown it's clear that Vancouver is a city of walking, setting precedent for the future of mobility in cities in North America and around the globe.
Why is active mobility important?
Streets that prioritize walking, biking and transit are good for people, communities, the environment, and business. Active mobility options have clear quality of life benefits for the cities that promote them. High prevalence of people walking, biking and taking transit is good for the public health and economic resilience of cities and for street safety. Active mobility also tends to spur positive social interaction more than other modes of transportation.
The following comparison cities were chosen for their likeness in geographical and population characteristics, including a shared proximity to water and a cultural ambition for resilience and active mobility.
Average Age: Median household income:
With the projected population increase by 2041, Vancouver Downtown density will increase to 24,088 people/km2. This is close to the current density of Manhattan, NYC (27,825 people/km2)
BC, Canada 41 yrs
$68,000
(41% Metro Vancouver)
public transit (26% Metro Vancouver)
Downtown residents commute data (all trips)
Source: City of Vancouver - 2016 Transportation Panel Survey (23% Metro Vancouver)
(10% Metro Vancouver)
Area: Population: Density:
Age Demographics:
5.78 km2
109,230 people 18,898 people/km2
(0-4) 3% (5-14) 3% (15-24) 8% (25-64) 74% (65+) 13%
Gender Demographics:
female
114.97 km2
631,486 people 5,493 people/km2
(0-4) 4% (5-14) 7% (15-24) 11% (25-64) 62% (65+) 15% 49% male 51% female
*Vancouver Downtown: CBD, West End, Coal Harbour, N.Yaletown, S.Yaletown
2,820 km2
2.4 million people 850 people/km2
(0-4) 5% (5-14) 10% (15-24) 13% (25-64) 57% (65+) 16%
49% male 51% female
Denmark
35 yrs
$92,000
Commute data City of Copenhagen
Source: City of Copenhagen
City Center*
28.55 km2
283,225 people
9,920 people/km2
(0-4) 6%
(5-14) 8%
(15-24) 14.5%
(25-64) 61% (65+) 10.5%
49% male 51% female
City*
89 km2
606,000 people
6,800 people/km2
(0-4) 6.5%
(5-14) 9%
(15-24) 14.5%
(25-64) 59.5% (65+) 10.5%
* The inner city borroughs: Indre By, Vesterbro, Nørrebro, Østerbro, not including Frederiksberg
** Municipality of Copenhagen, not including Frederiksberg
Washington, USA
35 yrs
$91,000
Downtown commute data
Source: commuteseattle.com
Downtown commute data
Source: MelbourneGeografia.com.au
Downtown*
11 km2
95,698 people 8700 people/km2
(0-4) 2%
(5-14) 3%
(15-24) 14%
(25-64) 70% (65+) 11%
Male: 56%
Female: 44%
Metro
15,000 km2
3.8 million people 250 people/km2)
(0-4) 6%
(5-14) 12%
(15-24) 12%
(25-64) 57% (65+) 13%
Male: 50%
Female: 50%
*Census Tracks used for Seattle Downtown: 71, 72, 73, 74.01, 74.02, 75, 76, 79, 80.01, 80.02, 81, 82, 83, 84, 85, 86, 87, 90, 91, 92
Downtown*
8.2 km2
72,510 people 8,842 people/km2
(0-4) 3%
(5-14) 2%
(15-24) 31%
(25-64) 61% (65+) 4%
Male: 50%
Female: 50%
Metro
10,000 km2
4.5 million people 450 people/km2
(0-4) 6%
(5-14) 12%
(15-24) 13%
(25-64) 54% (65+) 14%
Male: 49%
Female: 51%
*Melbourne Downtown:CBD, Docklands, Southbank, W.Melbourne


Each data set tells stories about people and places in the city. When overlaid more granular stories emerge, such as understanding of how many people 'stop and stay' or 'stickiness' of a place. It also highlights areas of opportunity for more Public Life to unfold and an understanding of desires for the future of Public Space and Public Life in Downtown, directly expressed by the citizens.
How can Downtown Vancouver better support vibrant and dynamic Public Life with everyday experiences, events and activities that serve all people?
What is the character and quality of Public Space in Downtown today? How can we expand the Public Space network and make better use of existing spaces?
The locations reflect different Public Space typologies across the Downtown Peninsula and were chosen in order to understand how Public Life unfolds in different conditions and neighbourhoods.
4
Method 1: Intercept Surveys Method 2: Observing People
1.500+
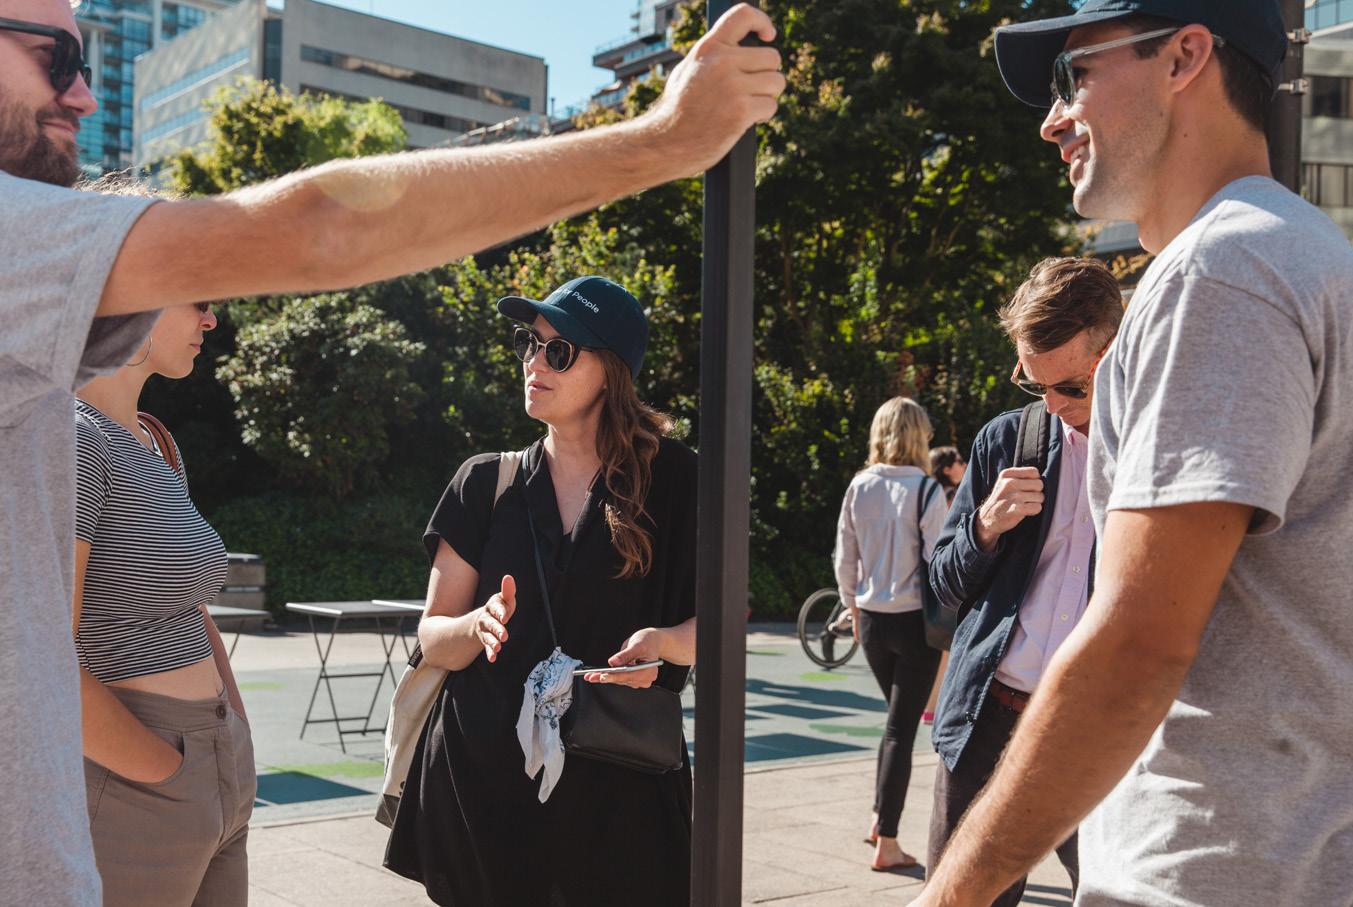
We talked to people to get an understanding of public space and public life beyond what can be counted and observed.
To get an understanding of Public Life in the city, with a focus on the everyday experience, surveys were conducted on a weekday and a weekend, outside of days with major public events in the city. For this survey a Winter study was also conducted, in order to study Public Life across seasons and to address aspects around seasonal use of the Public Spaces in Downtown.
We counted people moving through the city by different modes. We also mapped and counted people stopping and staying, noting the different activities they engaged in.
How can Downtown Vancouver better support vibrant and dynamic Public Life with everyday experiences, events and activities that serve all people?
What is the character and quality of Public Space in Downtown today? How can we expand the Public Space network and make better use of existing spaces?
Questions from 'Places for People Downtown' to inform PSPL Guiding Questions:
How can the existing Downtown public space network work harder to meet demands of a growing population?
The majority of Downtown residents have low and modest incomes. How do we ensure that our public spaces are welcoming to all?
How do we deliver new spaces with a limited land supply?
How do we consider a more mobile population who want unique and active urban experiences when planning and designing our public spaces?
How do we promote stronger community ties and social connection through the design, programing and use of our public spaces?
How do we ensure public spaces are accessible and attractive to Vancouverites of all ages and abilities?
How do we continue to build upon community partnerships and empower the public to get involved in the creation, stewardship and activation of our public spaces?
How do we ensure safe and fun spaces for kids of all ages?
How do we meet the various needs of residents living in smaller homes to ensure they have the places and spaces they require to relax and enjoy the city?
How can we ensure public and semi-public spaces truly feel public?
How can we design spaces that balance mobility and access with great place-making?
How do we determine whether corporate-sponsored activities might be appropriate, while balancing the need for community-based events and spontaneous activities?
Surveys were conducted on a weekday and a weekend day in both summer and winter.
Surveys were collected from 8:00am to 8:00pm on each day, although a select few locations were surveyed from 8:00pm to 10:00pm to capture some late night activity.
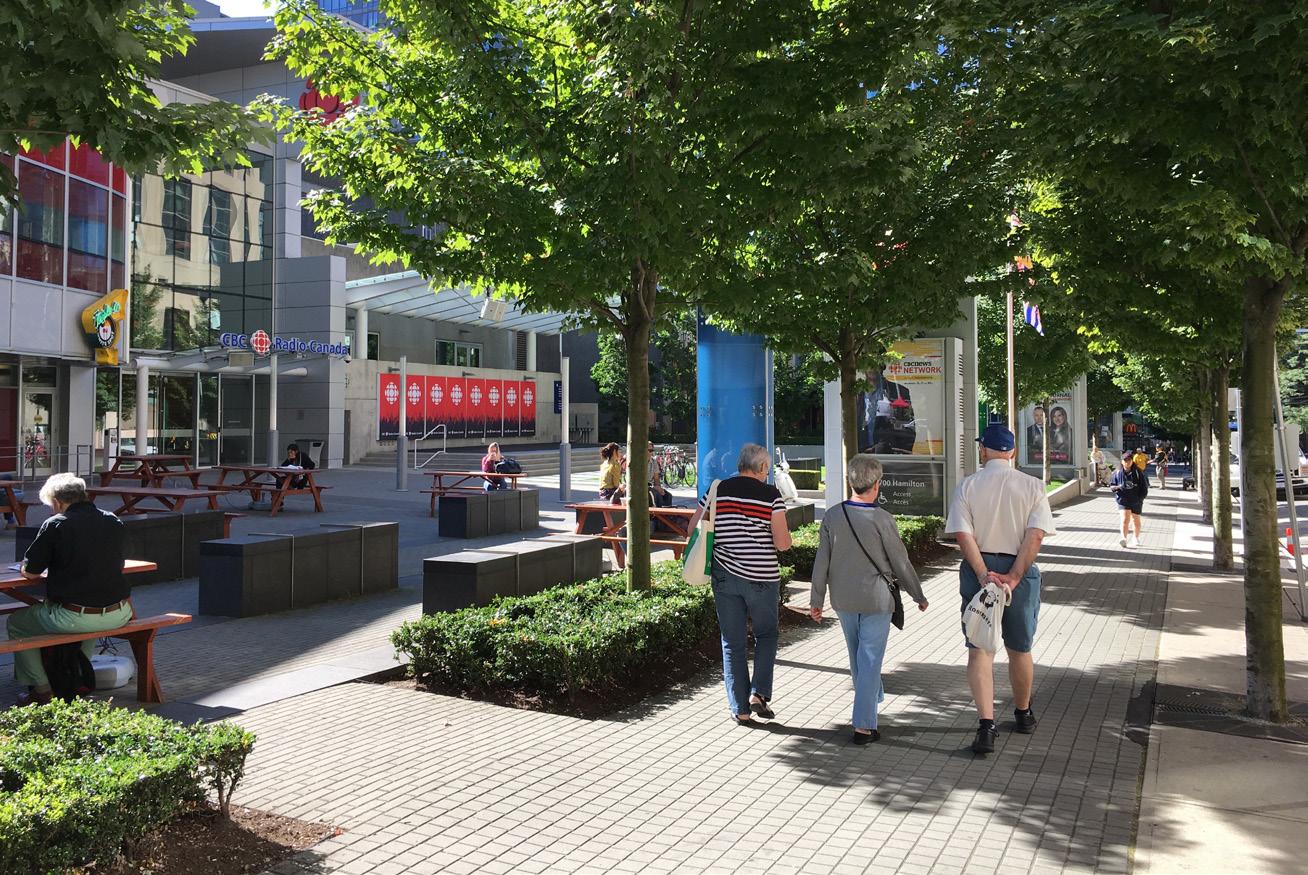

Thursday September 14, 2017
Sunny all day
Saturday September 16, 2017
Thursday February 1, 2018
Saturday February 3, 2018 Rainy

Observational Surveys and Intercept Surveys were carried out at the same time, both weekday and weekend as well as summer and winter, but by different volunteers.
The focus of this PSPL was the sidewalks, laneways, neighbourhood parks and plazas in the Downtown Peninsula. Large open spaces such as Stanley Park were not included in the survey, although they are a major component of the Downtown area open space network.
Chinatown and Gastown were also not included, because they will be the focus of a future targeted survey.
Survey locations were selected by the Places for People Downtown project team in collaboration with Gehl during a two day PSPL Kick-Off workshop that included site walks and meetings with City staff across departments.
The locations reflect different Public Space typologies across the Downtown Peninsula and were chosen in order to understand how Public Life unfolds in different conditions and neighbourhoods.

Neighbourhood Parks
The number of locations surveyed in the winter was less than in the summer, based on understanding from summer survey, taking out locations with limited activity in the summer.
Intercept surveys were distributed across the Downtown Peninsula, focused around the observational study areas.
1A-English Bay Beach Path (SEAWALL)
1B-English Bay Beach
2A-Cardero St & Harwood St
2B-Davie St & Denman St
2C-Morton Park
3A-Comox St & Denman St
3B-Denman St & Comox St
3C-Denman St (SOUTH)
4A-West End Community Centre Mews
4B-Denman St & Barclay St
4C-Denman St (NORTH)
5A-Denman St & Georgia St
5BC-Georgia St & Cardero St
5D-Cardero St & Bayshore Dr
6A-Comox St & Nicola St
6B-Cardero St & Comox St
6C-Cardero St
7C-Barclay Heritage Square
8AB-Robson St & Cardero St
8C-Robson St (WEST)
9B-Coal Harbour Quay
10A-Bute St & Beach Ave
10B-Sunset Beach Path (SEAWALL)
10CD-Burrard Bridge
11A-Bute St & Davie St
11B-Davie St & Bute St
11C-Davie St (WEST)
11D-Jim Deva Plaza
12A-Mole Hill (LANEWAY)
12B-Comox St & Bute St
12C-Nelson Park
13A-Robson St & Jervis St
13B-Bute St & Haro St
13C-Bute St Mini-Park
13D-Bute St Trial Plaza
13EF-Georgia St & Howe St
14AB-Robson St & Bute St
14C-Robson St (CENTRAL)
15AB-Georgia St & Burrard St
15C-Alberni St & Bute St
15D-Alberni St (WEST)
16A-Bute St & Hastings St
16B-Harbour Green Park Path (SEAWALL)
16C-Harbour Green Park
17AB-Burrard St & Drake St
17C-Davie St & Burrard St
17D-Davie St (EAST)
18C-Wall Centre
19AB-Robson St & Burrard St
19C-Robson St (EAST)
20AB-Burrard St & Alberni St
20C-Alberni St & Burrard St
20D-Alberni St (EAST)
21AB-Burrard St & Melville St
21C-Park Place Plaza (Burrard)
21D-Discovery Square / Art Phillips Park
22A-Thurlow St & Hastings St
22B-Jack Poole Plaza
23D-Oceanic Towers Plaza
24A-Robson St & Hornby St
24B-Robson 800 Block (SOUTH)
25AB-Hornby St & Robson St
25C-Art Gallery Plaza
26AB-Granville St & Helmcken St
26C-Helmcken St & Granville St
26D-Granville St (SOUTH)
27AB-Granville St & Robson St
27C-Granville St (CENTRAL)
28AB-Granville St & Georgia St
28C-Granville St (NORTH)
29A-Alley Oop (LANEWAY)
29B-Granville St & Pender St
29C-Seymour St & Dunsmuir St
29D-Dunsmuir St & Richards St
30A-Waterfront Station (ENTRY)
30B-Waterfront Station
30C-Granville 200
32A-Richards St & Drake St
32B-Davie St & Richards St
32C-Emery Barnes Park
33A-Richards St & Smithe St
33B-Smithe St & Richards St
33C-Nelson St & Homer St
33D-Yaletown Park
34A-Robson St & Homer St
34B-Library Plaza (including interior lobby)
35D-BMO Plaza
36A-Richards St & Dunsmuir St
36B-Dunsmuir St & Homer St
36C-BC Hydro Plaza
36D-Cathedral Square
37A-Hamilton St & Helmcken St
37B-Mainland St & Helmcken St
37C-Helmcken St & Mainland St
37D-Mainland St
38A-Cambie St & Georgia St
38B-Hamilton St & Robson St
38C-CBC Plaza
38D-Terry Fox Plaza
39A-David Lam Park Path (SEAWALL)
39B-Roundhouse Community Centre Mews
39C-Davie St & Marinaside Crescent
39D-Roundhouse Plaza
40A-Marinaside Crescent Path (SEAWALL)
40B-Aquarius Mews
40C-Marinaside Crescent Waterfront
41A-Abbott St & Keefer Pl
41B-Chinatown Station Mews
41C-Beatty St & Dunsmuir St
41D-Stadium-Chinatown Station
42A-Cooper's Park Path (SEAWALL)
42B-Cambie Bridge
42C-Cooper's Park (underneath Cambie Bridge)
43C-Andy Livingstone Park
See Data Appendix for all collected observational data
We talked to people to get an understanding of Public Space and Public Life beyond what can be counted and observed.
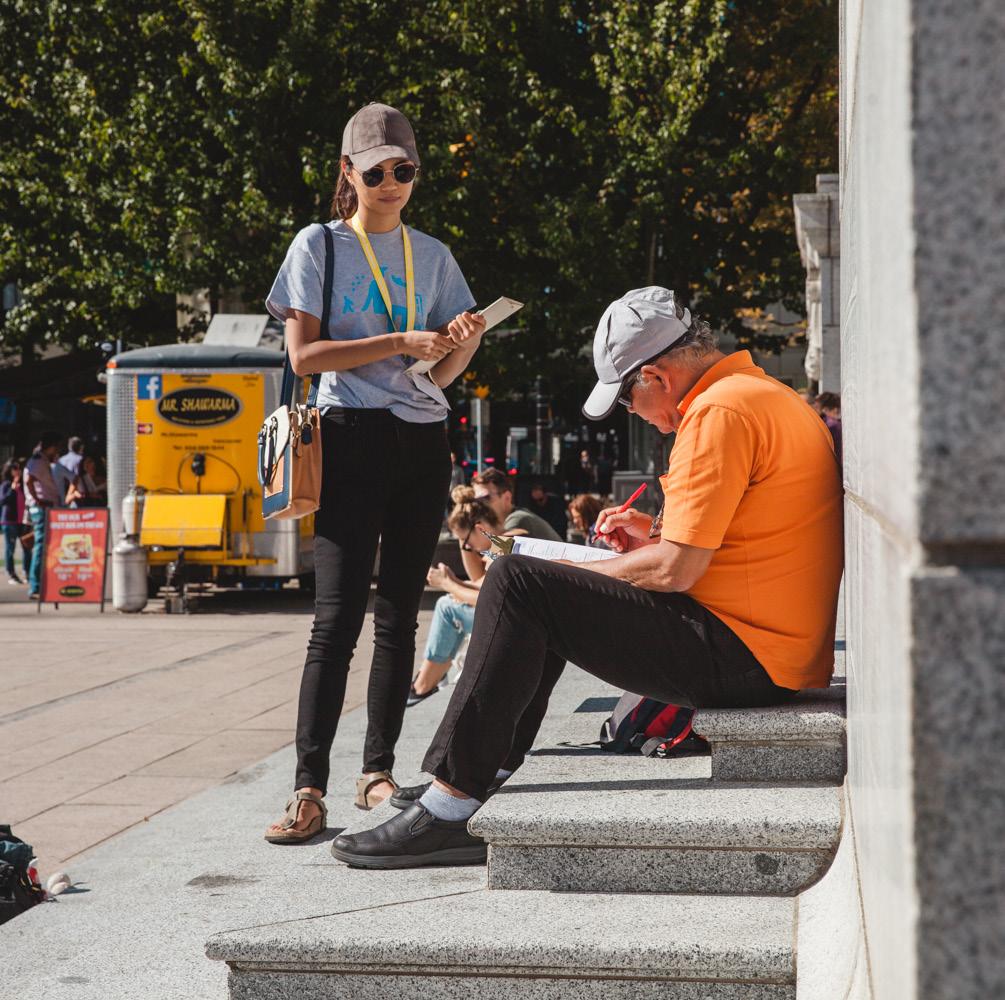
We asked people questions related to the purpose of their trips and the duration of visits.
We asked questions about sentiment, sense of safety, feelings about Downtown, and what might be missing from Downtown.
We asked questions focused on social interaction as well as on basic demographics including age, gender identification, and income.
We also asked winter specific questions related to time outdoors and invitations to spend more time Downtown in the winter
How did you get here, for how long do you intend to stay and what’s the purpose of your visit?
How do you feel about the Downtown?
Did you interact with someone here today? What brought about the interaction?

How would you rate your feeling of personal safety?
Do you spend time outdoors in the winter?
people took the survey in the summer!
people took the survey in the winter!
About 42 volunteers (Summer) and 36 (Winter) took on the task of talking to people in the streets and public spaces of the Downtown Peninsula, and asking them to fill out a survey.
Note: Responses reflect the locations that were surveyed and the people who accepted the survey. 1175 people declined the survey in the Summer, insufficient data on declined surveys in the winter.
We counted PEOPLE MOVING through the city by different modes


People walking or running. This Includes children being carried or in a stroller and people moving in wheelchair.
A person riding a bike or on skateboard, roller blades, scooter, or other wheeled device. Note that people in wheelchairs are considered pedestrians.
This count represents the perceived age and gender of people moving. We observed who was there to learn how the public realm invites different user groups out walking and moving around, as well as to understand who was not represented.
People walking (or in wheelchair or stroller)We mapped and counted PEOPLE STAYING and the activities they engaged in
See following pages for detailed descriptions

Age & Gender of people staying
We observed who was there to learn how the public realm invites different user groups out staying and spending time, as well as to understand who was not there.
The relationship between PEOPLE MOVING and PEOPLE STAYING reveals stories about 'capacity'* and 'stickiness'** PEOPLE MOVING indicates the success of ensuring a safe and well connected public realm, whereas PEOPLE STAYING indicates that the Public Space offers invitations to spend time, comfort and enjoyment.
*Ability to sustain pedestrian volumes
**Ratio of people moving to staying


We observed how the public realm invites different body postures.
We observed people spending time in the city, measuring how the public realm invites for different activities.
We observed how the public realm invites different group sizes.
(method 2, further detailed description)
Age and gender representation is a crucial part of understanding who is using a particular space. Ideally, the age and gender breakdown of people using the space should coincide with the census data of that part of the city in general and consider periods for flux throughout the day and day of the week. For example, weekday workforce. Often it is much more important to ask, 'Who is not there?' than who is there. For example, the presence of women and children speak to the feeling
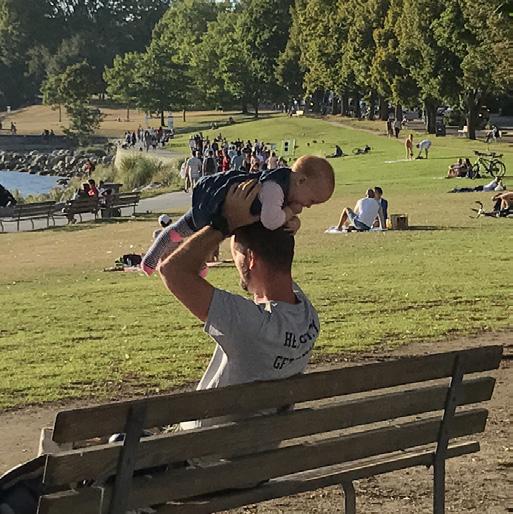
Ages 0 - 4
Infants and toddlers
Always accompanied by guardians and often carried or in strollers when moving.

Ages 5 - 14
Children
Mostly accompanied by guardians, but where the older start to move and stop and stay by themselves.
of safety in a space, which in turn speaks to the overall vitality of the space. The presence of a broad range of users speak to the quality of the public space and how well it invites (or doesn't invite) users to occupy a space, although a targeted user group is not necessarily a sign of lack of quality. For example, a playground invites children and parents, while a street lined with shops might invite teens and young adults, this is not only related to quality, but also to preference.
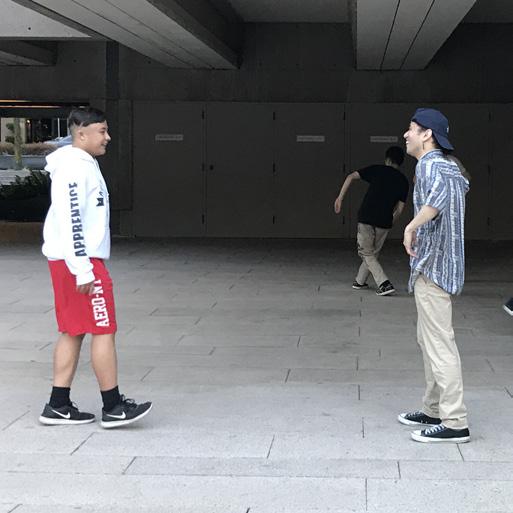
Ages 15 - 24
Teens and young adults
Mostly students or in people their first job out of school, often spending time in public space with others in the same age group.

Ages 25 - 64
Adults
Largely working population, although some may be students or retired (including volunteer, informal, care-giving, part-time etc.)

Ages 65+
Older adults
Largely retired, although many still may be actively engaged in some form of paid or unpaid work (volunteering, care-giving, etc.)
In the Observational Surveys the surveyor counts people based on judgement of a persons' age and gender presentation. In the Intercept Survey respondents were asked to report their age and gender identity.
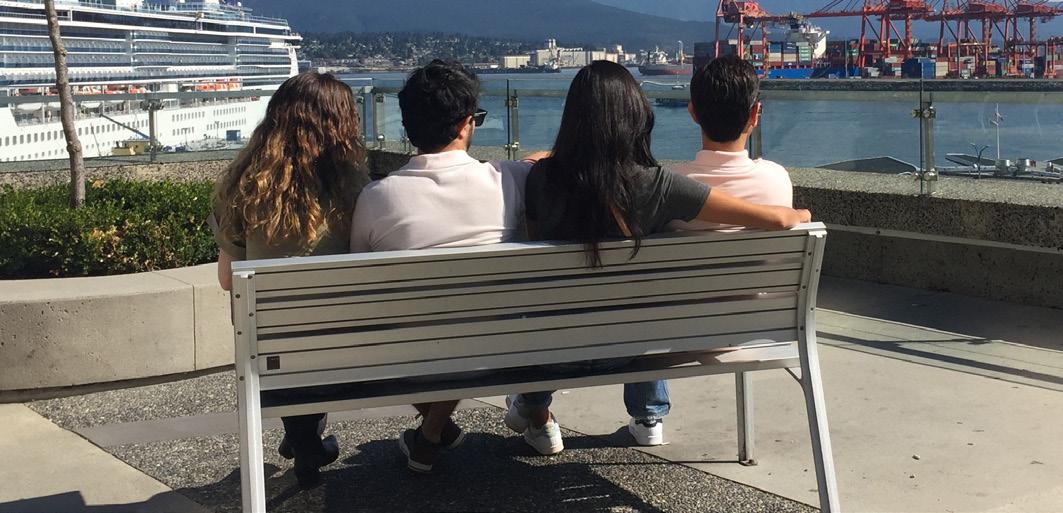
Gender was estimated by the surveyors to the best of their ability. If a person is perceived as non-binary or the surveyor does not feel comfortable assigning gender, that person would fall into the category of 'other'. Infants and toddlers were all recorded as 'other'.

(method 2, further detailed description)
Body posture offers insight into what invitations exist for staying and which might be missing. For example, a space with a high amount of standing and informal sitting might show a latent demand for more public seating. A mix of body postures in a space can also translate into a more vibrant and interesting public realm for people to pass through or be a part of.


Like the rest of these tools, the context in which body posture is measured should be considered when interpreting the data.
*The body posture assignment is used to define the average number of people in a Public Space per hour / day
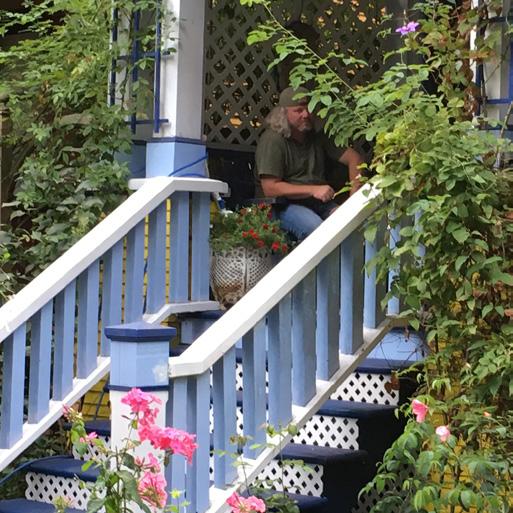
Sitting, Public Sitting, Commercial Sitting, Private
Sitting on an object intended as seating which is usually fixed, and provided for the general public for free. This will typically be a designated bench, but can also be a movable chair.
Sitting on furniture that is owned by a commercial establishment. Sitting is typically accepted in exchange for a purchase of goods or food.


Sitting, Informal
Sitting on furniture that is privately owned by individuals. This can be a chair or a bench in someone’s front garden, or furniture that people have brought for themselves into public space and which they will take with them upon leaving the public space.
Sitting on an object not designed as seating. Could be the ground, steps, or planter edge.
Standing freely in space or while leaning against an object.

Lying down on the ground or on a piece of furniture. Most of the surface of the body in contact with the ground or furniture.

A person can only be assigned one body posture
The Stationary Activity Mapping tool maps what people are doing in a space and where. It helps take a snapshot of all the activities happening in the survey area at a given time. These activities represent the life of the public realm. A healthy mix of activities in a space can also translate into a more vibrant and interesting public realm for people to pass through or be a part of.

Waiting for public transit. Could be the bus, train, or ferry.
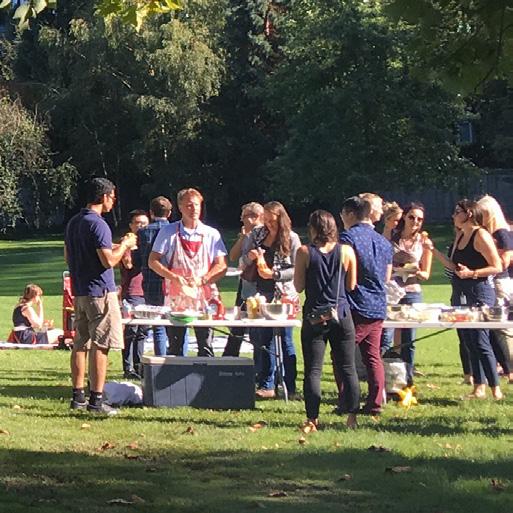
Consuming food or drinks.
Most often, when one activity dominates a space, that space is not offering invitations for a diverse set of users to participate or stop and stay. Activities usually vary greatly over the day and across the city, providing insight into the daily rhythms of public life. The activities include both optional activities, were people are there by choice as well as more necessary activities, such as waiting for transit, civic work and activities related to systemic inequities.

In the process of buying or selling foods and goods. Both the person performing a transaction and the people queuing are counted.

Participating in or observing a cultural activity of either artistic, communal, political, or religious character. This could be listening to a street musician or having one’s portrait painted by an artist in public. A communal activity could be enjoying the screening of an outdoor movie or participating in a street event.
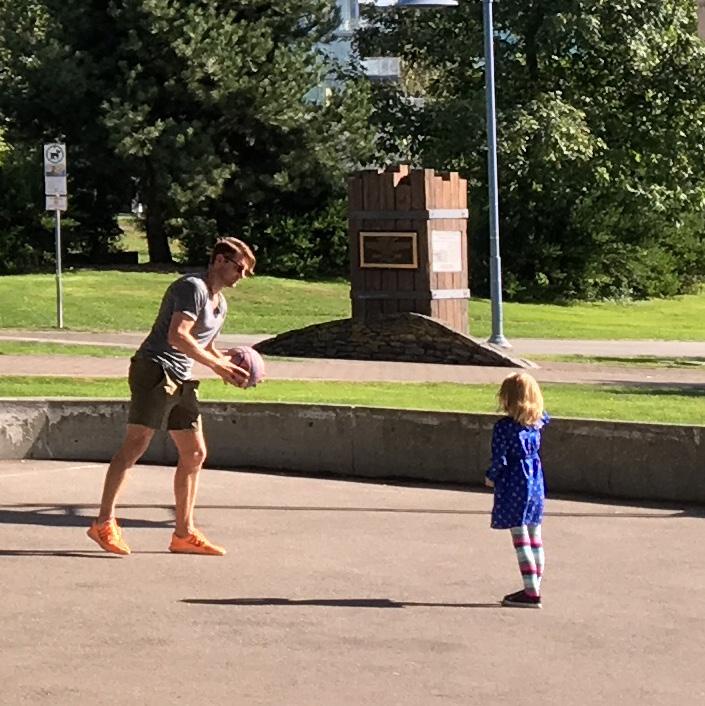
Exercising or playing outside within an area. Could be playing basketball, using a jump rope, or running stairs This includes children at play.
A person can be assigned one or multiple activities

Includes people-watching, sight-seeing, playing stationary games like a board or card game, showing physical affection towards another person, reading or writing, drawing, painting, or playing music for one’s personal enjoyment.
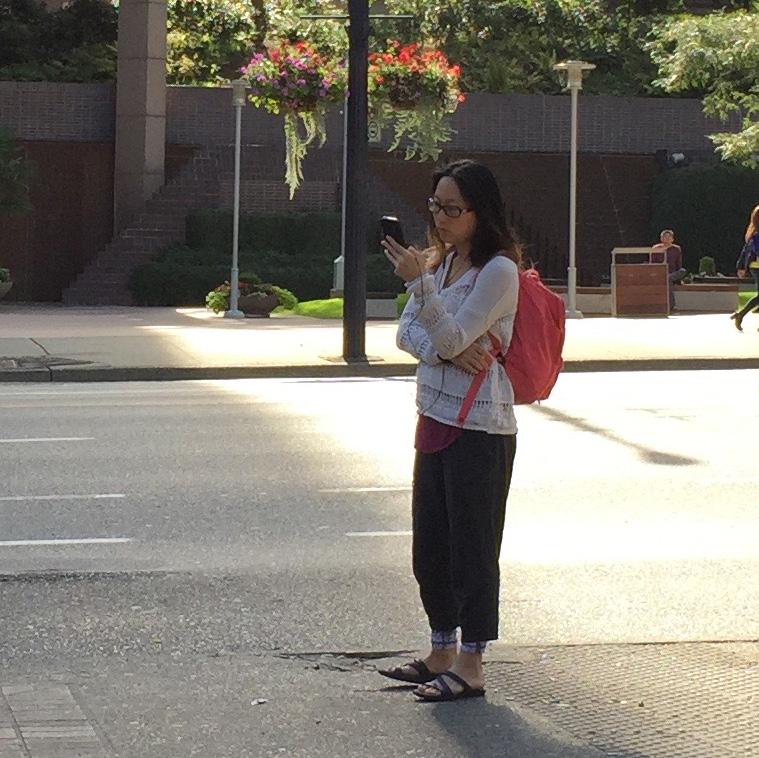
Engaging with technology in some form. Could be listening to audio via headphones, conversing on a phone, reading/ writing/playing/working on a computer, or photographing people or the surroundings.
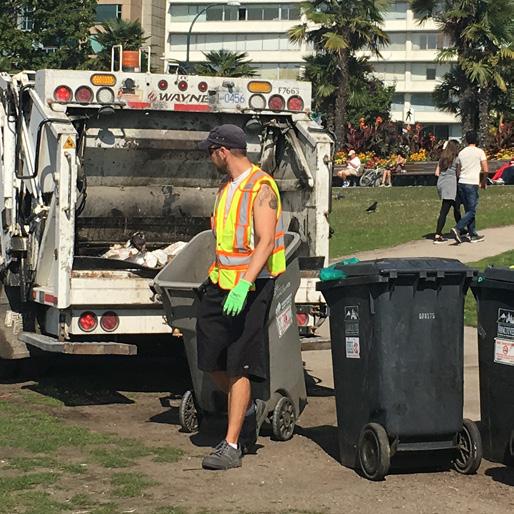
Working to maintain or take care of the public space. Could be fixing potholes, sweeping the street, or providing security.
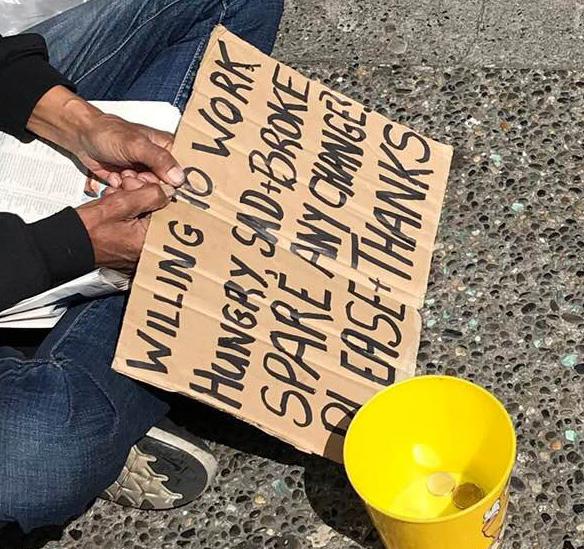

Certain activities and behaviours have stigma associated with them, and arise from systemic inequities. These activities are generally viewed as “challenging” by a large sector of society. Examples include substance use and the behaviour that may arise from it; outdoor sleeping associated with lack of
housing/homelessness, often accompanied by storage of personal belongings; requesting support, usually in the form of money, food, or goods. These behaviours and activities are not always connected or exhibited together. The four listed activities represent different kinds of stigmatized public life behavior.

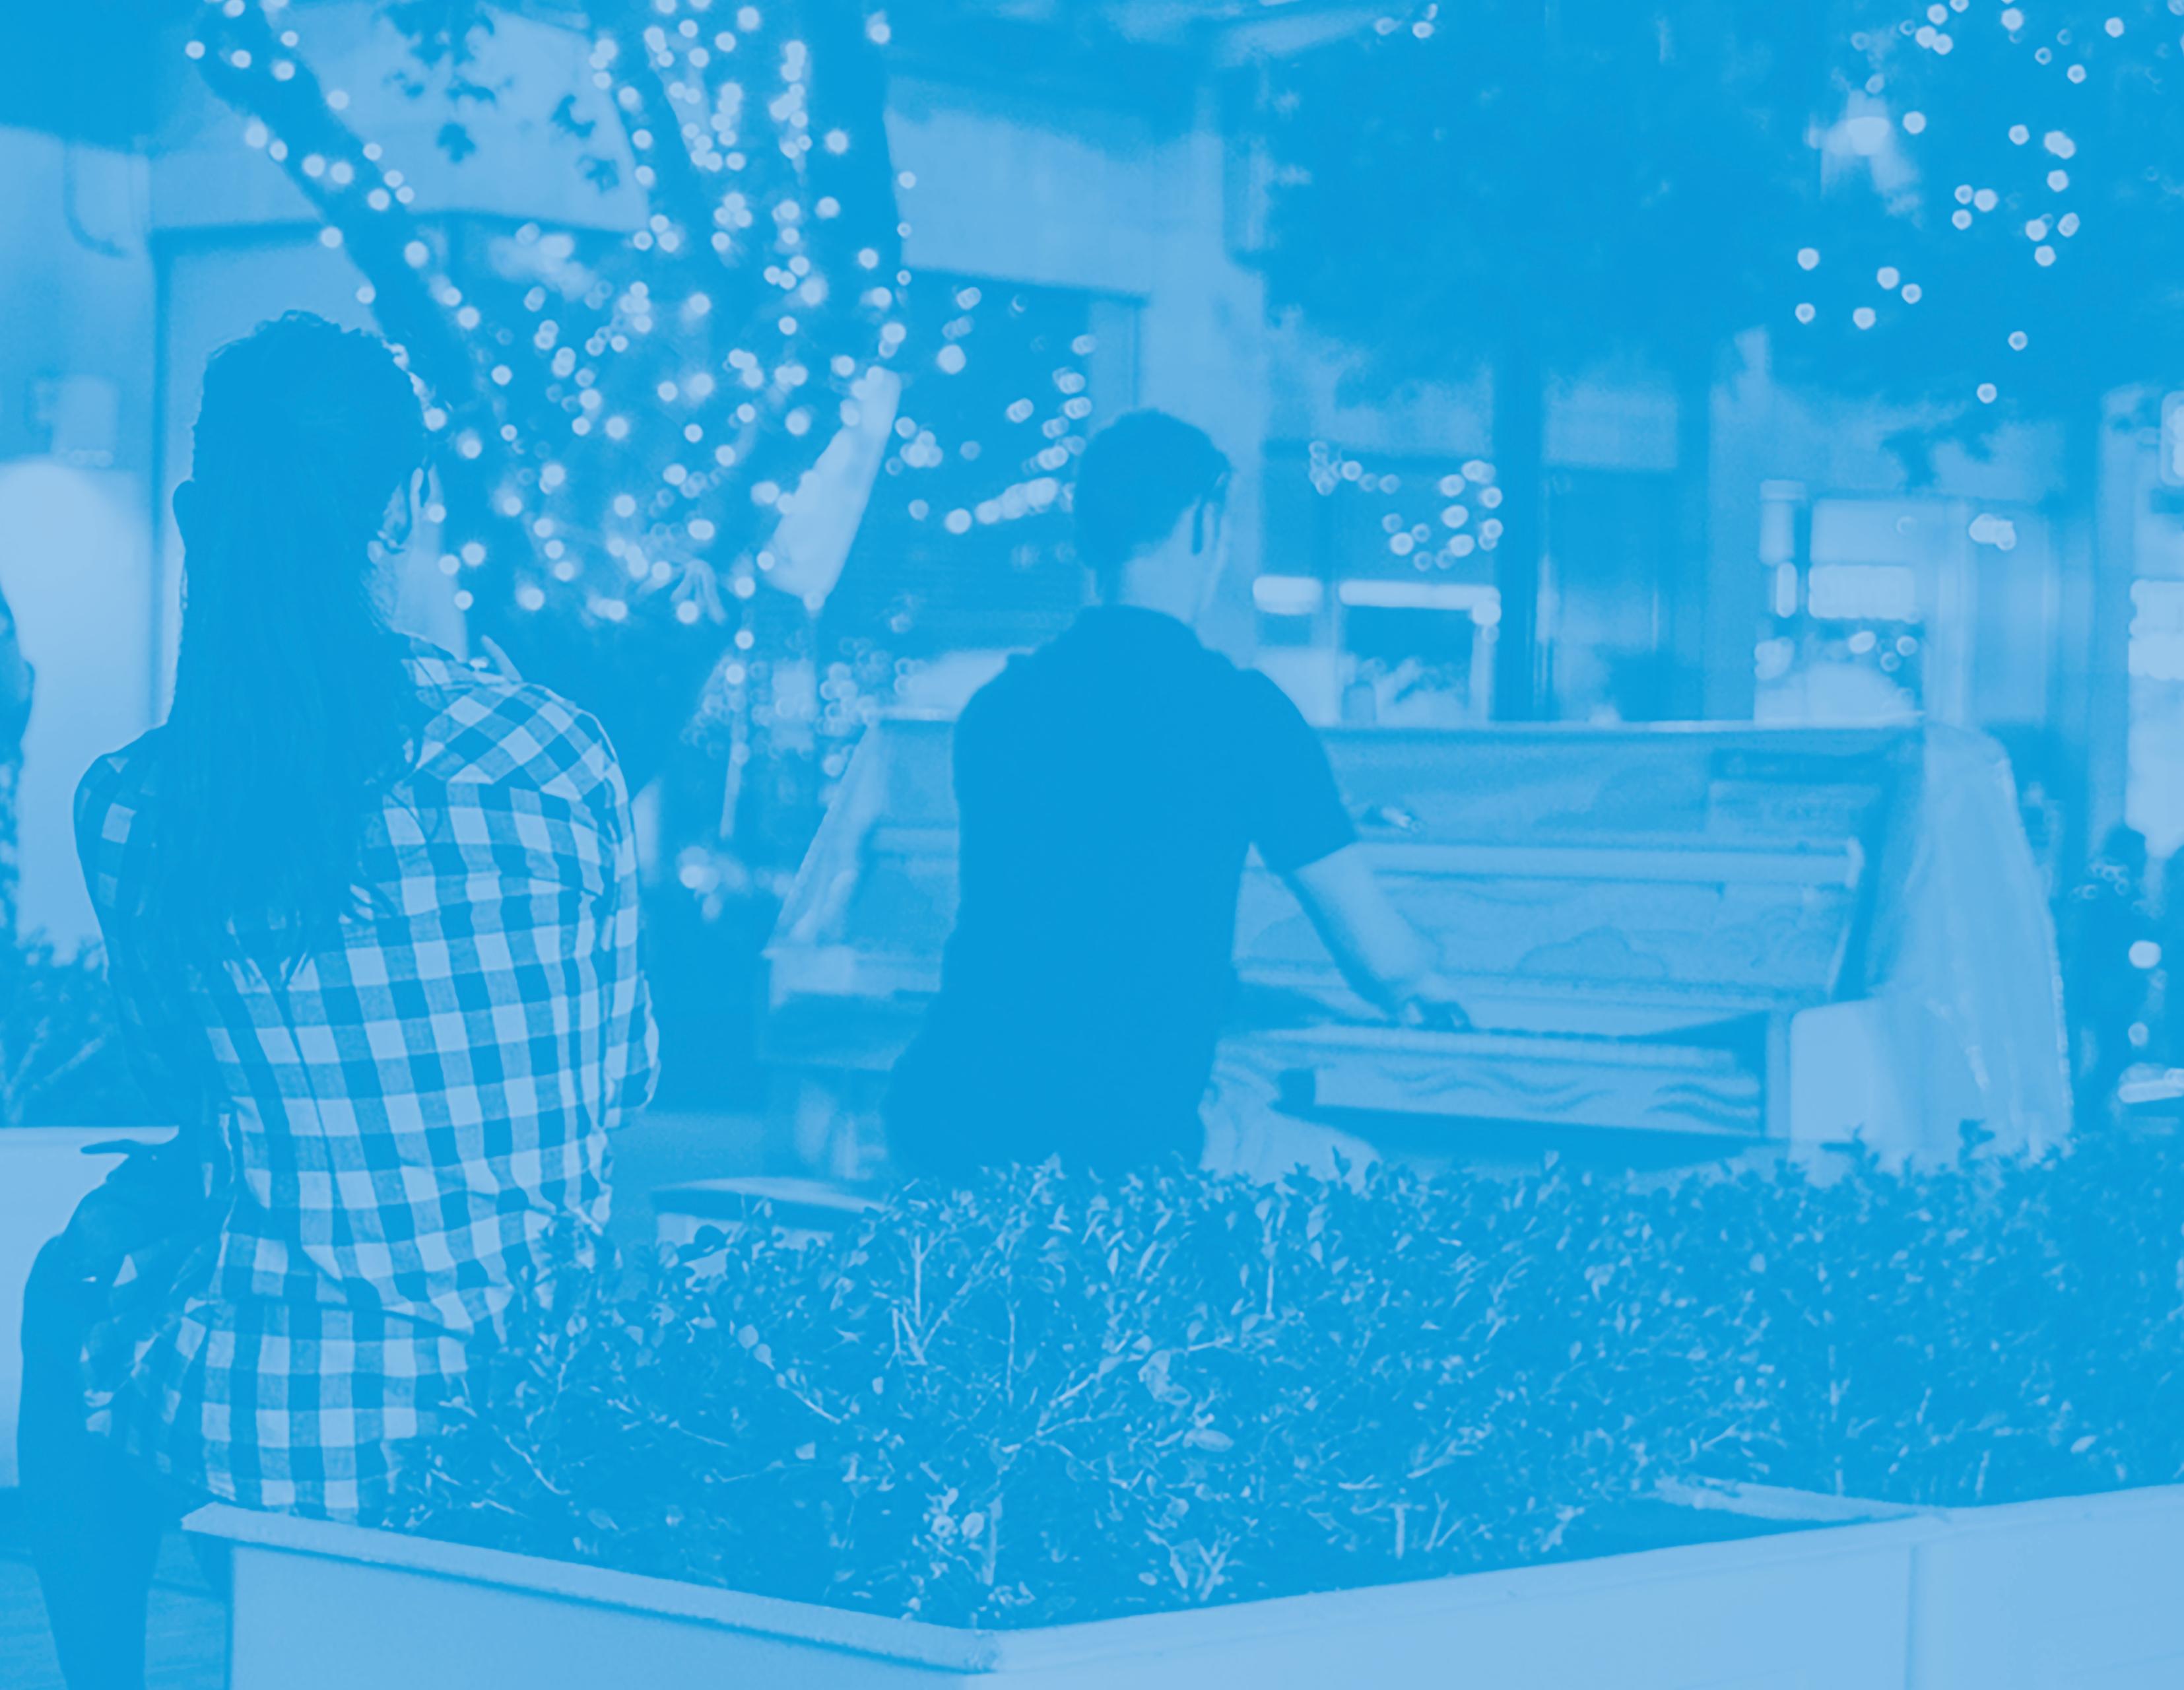
Downtown Vancouver is a vibrant neighborhood that supports both everyday life and events, and people spend time here often. 2 3
People come to Downtown to socialize with friends and family, but socializing in the Downtown public realm is not inviting people of all income levels. 1
There is a strong culture of walking in Downtown Vancouver that is outstanding not only for North American cities but also for cities across the globe.
When asking people Downtown how they get around, 9 out of 10 respondents chose active mobility—walking, biking or taking public transportation. 1 out of 2 respondents chose walking as their primary mode, and the walking culture stays strong in the winter.
The city has been successful in cultivating a city core that serves as a local and a tourist destination, as well as an economic center and a neighborhood.
Downtown Vancouver attracts residents, workers and visitors. This is a key factor in creating a 24/7 city that is active throughout the whole day on both weekdays and weekends. When asking people about their relationship to Downtown, 52% of respondents identified themselves as Downtown neighbours or residents and 19% identified as employees. 1 out of 3 employees (6% of all respondents) also live Downtown.
When asking people how often they visit Downtown, more than 1/3 of survey respondents reported visiting daily and 1/3 visit weekly. Frequent visits indicate that Downtown Vancouver is a vibrant and attractive neighbourhood. Unlike many other Downtown city cores, this is not just a tourist destination or a financial district that only comes alive at certain times of the day, week or year.
1 out of 3 respondents reported spending time with friends and family as the main reason for their visit Downtown. However, when asked the same question, people with lower incomes reported that the reason for their visit was spending time alone. This could indicate that there are less invitations for people of lower income to meet and socialize with their friends and family in Downtown Vancouver.
5 6 7 8
People love Downtown! It is a place that makes people who live, work and visit feel comfortable and welcome.
4 out of 5 respondents reported feeling positive or strongly positive about Downtown. People who reported being both residents and employees Downtown were even more positive, with 9 out of 10 feeling positive or strongly positive about Downtown.
People want more varied programming all year long in Downtown, and they express a desire for affordability and supporting services.
When asked what they would like to do in Downtown that they cannot do today, people reported wanting more variety as well as more of the programming and activities that are already there. People expressed concerns around affordability, accessibility and inclusion. In addition, people recognize a lack of supporting functions and elements such as shelters, seating, and public restrooms, that could broaden use all year long by various user groups.
People generally feel safe Downtown, but location and season affect how safe they feel. Responses showed that more can be done to make people feel safe in the winter.
Overall, respondents reported feeling safe Downtown. But perception of safety is impacted by the respondents' relationship to Downtown as well as to where they spend time. 71% of tourists felt very safe while only 39% of employees feel very safe. The seasons also affected the feeling of safety responded. 60% of respondents felt very safe in the summer while only 47% felt very safe in the winter.
Chance social interactions in the public realm are prompted by design queues and programming. More of these invitations could help cultivate a sense of social connectedness Downtown.
When asked about chance interactions with people in the public realm, 64% of respondents interacted with someone they did not plan to meet. 50% of respondents interacted with someone they had never seen before. These interactions were prompted by sitting next to each other, pets, kids, activities, and other invitations to connect.
Downtown Vancouver has a culture of walking that is quite unique for a North American city. The city deserves a public realm that reflects and encourages this unique culture.
^ Intercept Question: How did you get here today?
(Combined Summer and Winter data)
In the winter cyclists switch to transit and walking
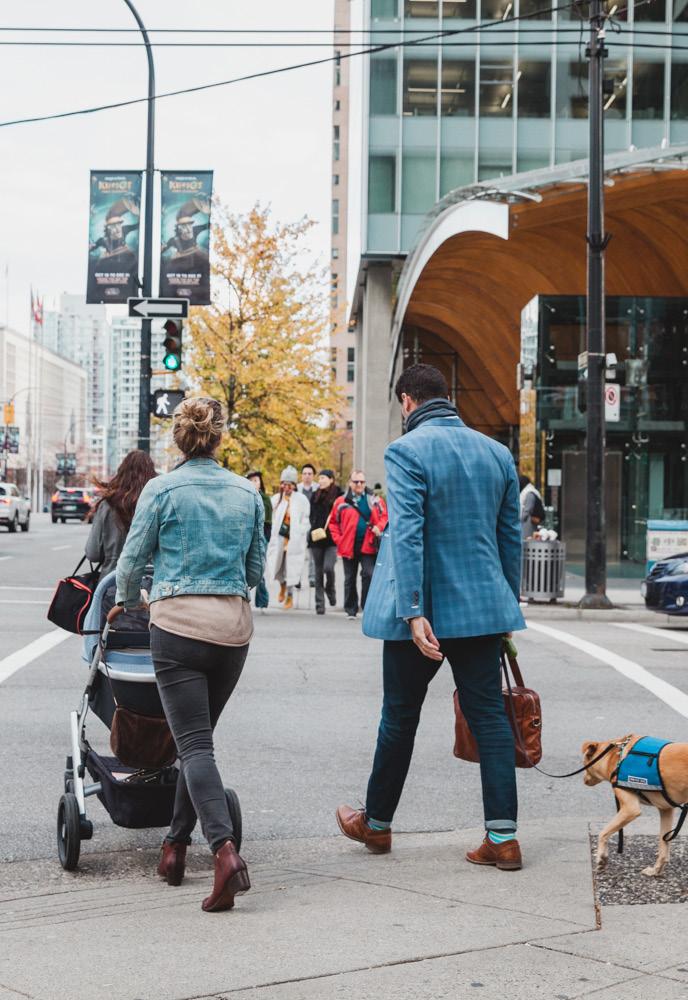
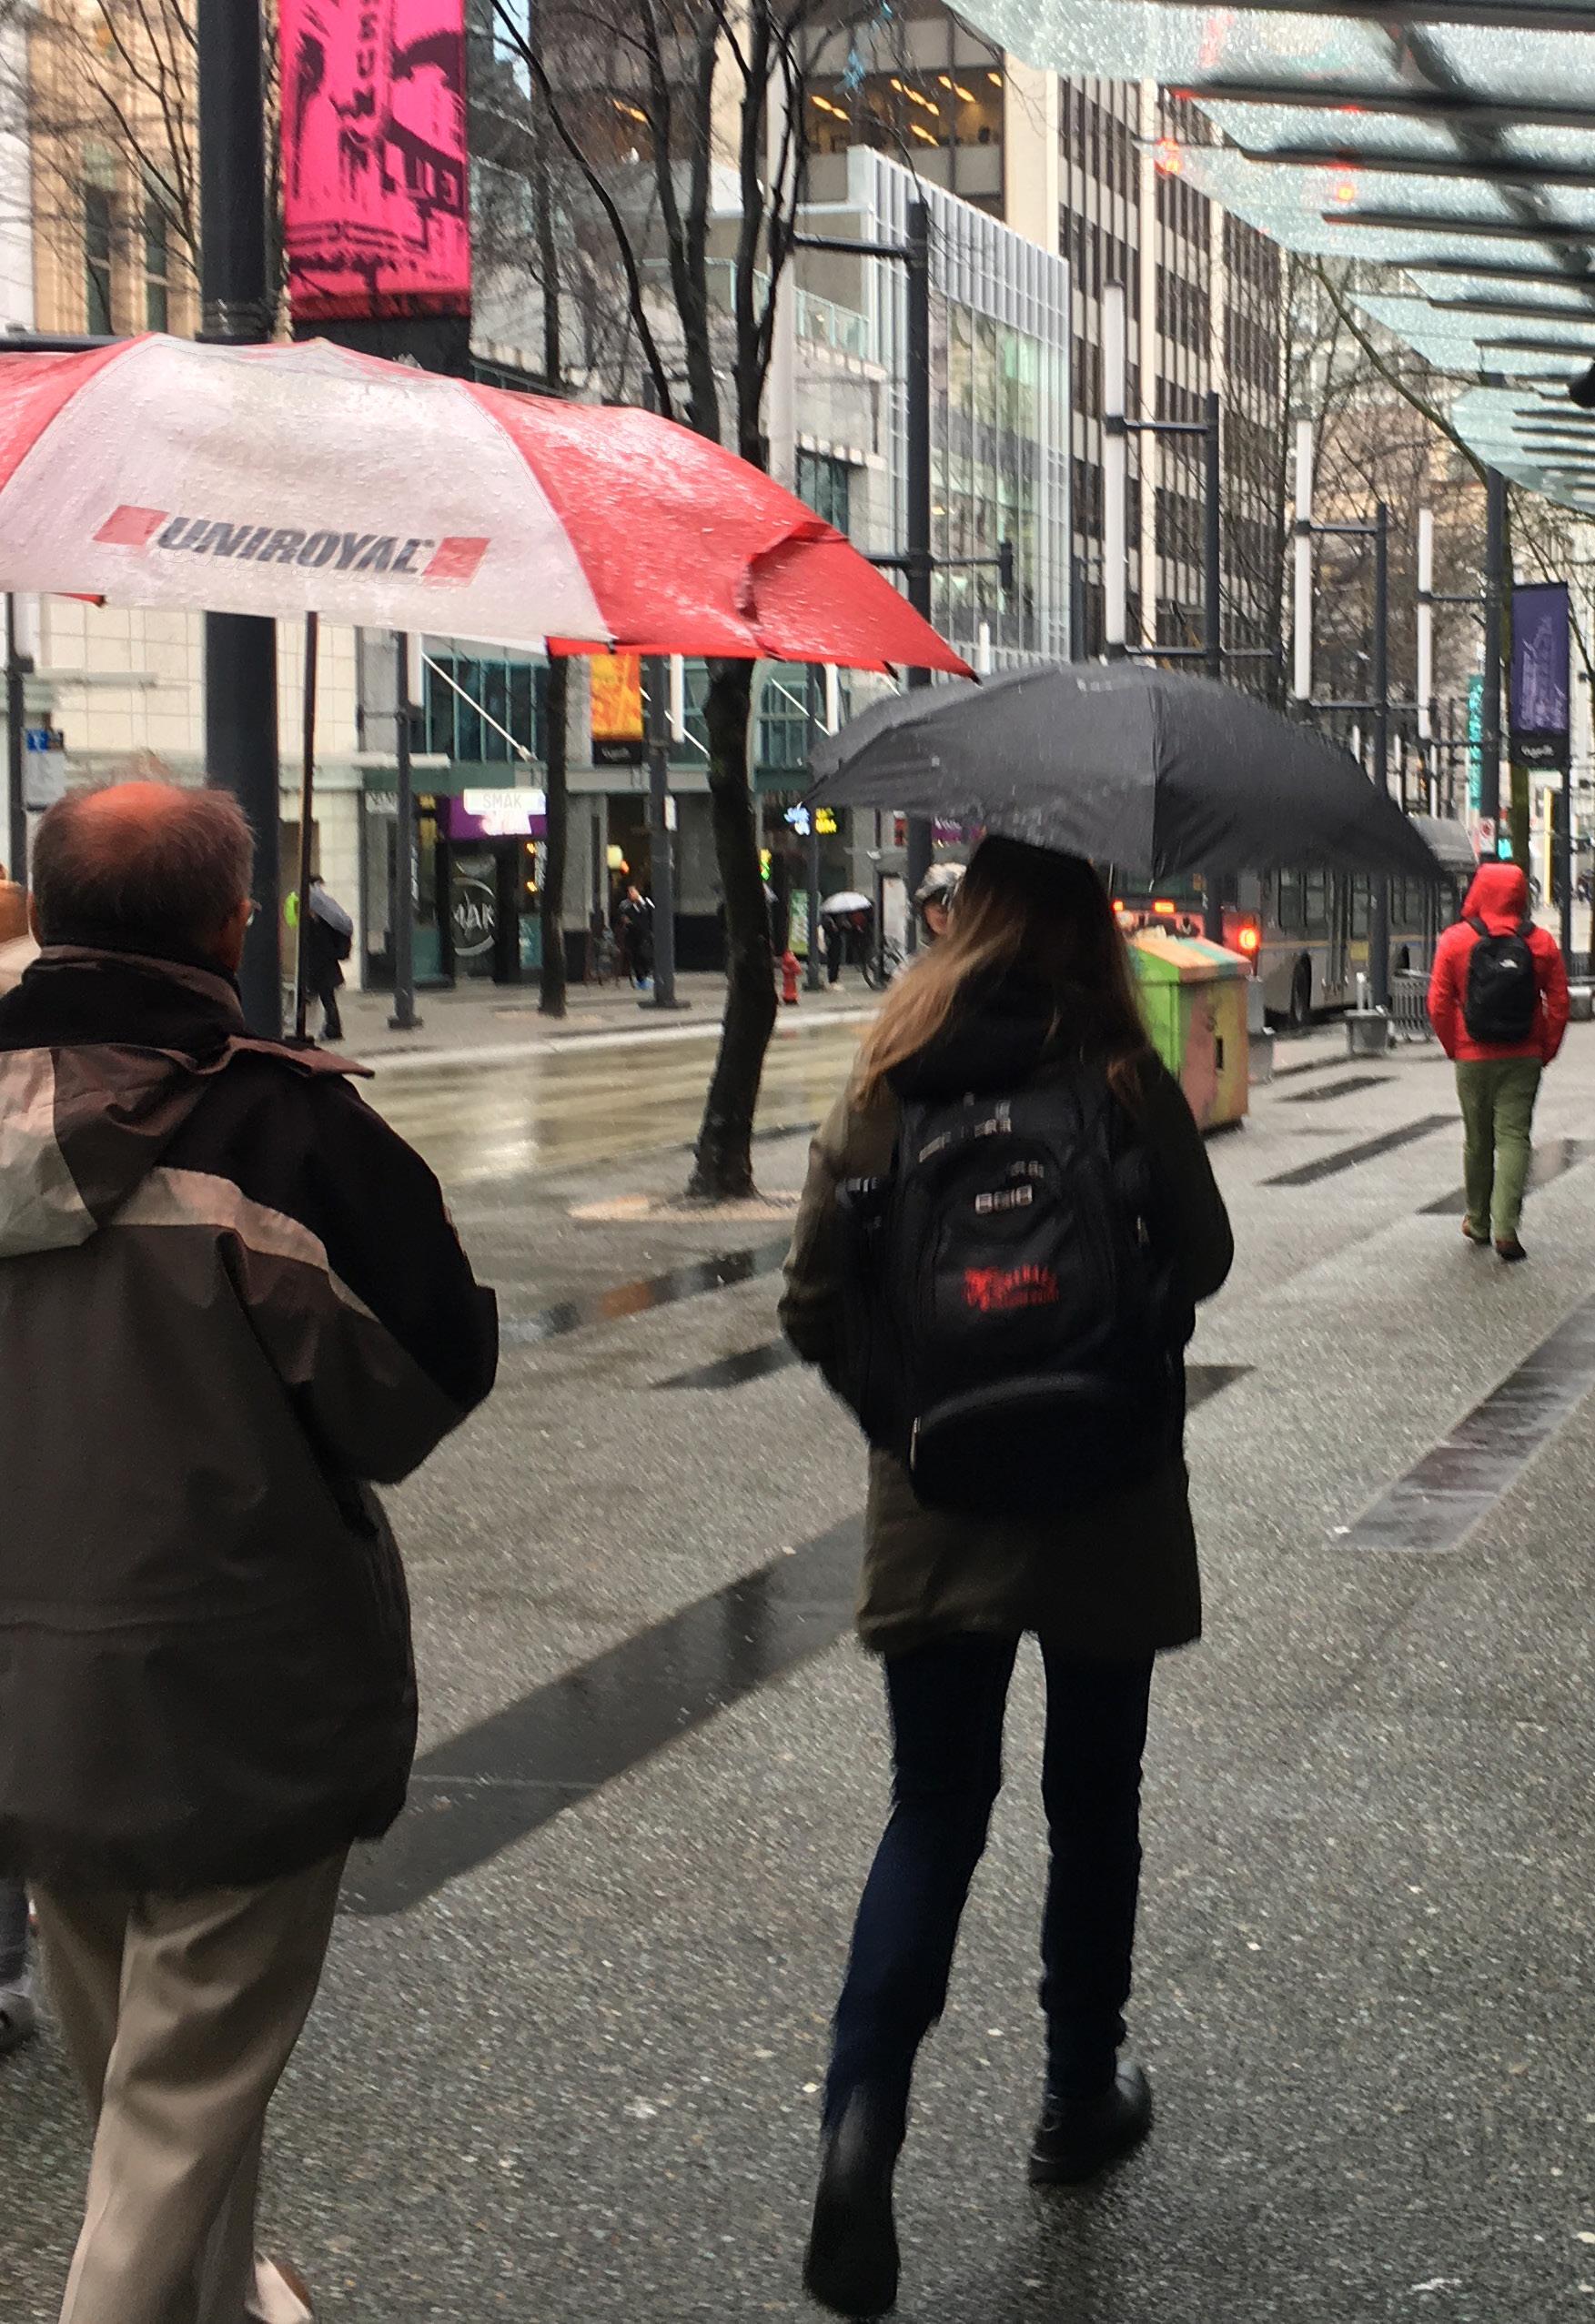
Frequent visits indicate that Downtown Vancouver is a more vibrant neighbourhood than an average city core. It is not just a tourist destination or a financial district that only lives at certain times of the day, week or year, as is the case for many Downtown cores.
36% of respondents visit Downtown daily and an additional 28% visit Downtown weekly
^ Intercept Question: How often do you visit this place? (Combined Summer and Winter data)
Note: There is a higher proportion of first time visitors in the Summer (13%) than the Winter (8%) which corresponds to the higher number of tourists Downtown during the Summer.
Downtown Vancouver attracts residents, workers and visitors. This is a key factor in creating a 24/7 city that is active throughout the whole day on both weekdays and weekends.
52% of respondents identified themselves as Downtown neighbours / residents and 19% identified as employees
^ Intercept Question: What best describes your relationship to Downtown?

(Combined Summer and Winter data, respondents can select multiple answers)
Not surprisingly, there are more tourists in the Summer 1/3 of Employees Downtown also lives Downtown

People are not just coming to Downtown for necessary activities, but choose to spend time and enjoy the city with friends and family.
Intercept Question: What brings you to this space today? (Combined Summer and Winter data)
Reason for Visiting
Not surprisingly, people are socializing outside more in the Summer
Reason for Visiting by income (Combined Summer and Winter data)
^ Intercept Questions: What brings you to this space today? Which of the following categories best describes your total household income before taxes? (Combined Summer and Winter data)
While this could suggest that people of lower income prefer to be in quiet spaces outside, it could also indicate that there are less invitations for them to meet and socialize with their friends and family in Downtown Vancouver, which adds to inequality in the city.
*(% Respondents, combined Summer and Winter data)
In general, Downtown Vancouver is a great place that makes people who live, work and visit feel comfortable and welcome.
79% of respondents feel positive or strongly positive about Downtown
^ Intercept Question: How do you feel about the Downtown? (Combined Summer and Winter data)

Sentiment about Downtown (Combined Summer and Winter data)
Note: There is a higher proportion of people who feel very positively about Downtown in the Summer (39%) than in the Winter (31%) and a higher proportion of people who feel neutral about Downtown in the Winter (16%) than in the Summer (12%).
^ Intercept Questions: How do you feel about the Downtown? What brings you to this space today? (Combined Summer and Winter data)
People want more of what is already there.
However, people express challenges of affordability, accessibility and inclusion. There is a desire for services for those who don't want to 'pay to stay' as well as more programing for all ages and interests.
‘live music’ ‘performances’ ‘festivals’
‘relax’ ‘people-watch’ ‘read’
Passive recreation (55)
Active recreation (70)
^ Intercept Question: What two things would you like to do in the public spaces Downtown that you can't do now? (Summer data)
‘coffee shops’ ‘outdoor patios’ ‘more variety of shops’
‘public restrooms’ ‘garbage cans’ ‘phone charging’
Small scale commerce (31)
‘safer biking’ ‘feel comfortable’ ‘more lights at night’ Improved safety (21)
‘more gathering spots’ ‘meet new people’ ‘play games with others’
‘exercise' ‘swim’ ‘run’
Drinking (51) ‘drink outside’ ‘drinking in public’ ‘alcohol’
‘more walkable’ ‘rapid transit’ ‘less stairs’ Services (36)
Accessibility (32)
More seating (25)
Dog-friendly areas (21)
Greenery (19)
Socializing places (20)
‘spray park’ ‘beaches’ ‘water fountain’
Water (18)
‘afford food' ‘more low-income housing’ ‘bargains’ Affordability (15)
‘cleaner’ ‘less garbage’ ‘dispose of garbage’
Activities or Programming
Services or Protection
Number of respondents who wrote this (X)
Cleanliness (14)
Parking (14)
Eating (16)
‘more green spaces’ ‘garden plots’ ‘plant more trees’
‘have a picnic’ ‘eating spaces’ ‘bbq’
Social equity (14)
‘cheaper parking’ ‘park more easily’ ‘public parking’
‘art installation’ ‘street art’ ‘more public art displays’
Art (13)
Weather protection (13)
Space for kids (10)
‘teen space' 'playgrounds' 'education'
‘more public seating’ ‘better chairs’ ‘places to sit’
‘more off leash areas’ ‘walk dogs’ ‘dog parks’
‘help the homeless’ ‘mental health' ‘marginalized populations supported’
‘rain shelter’ ‘cover for bad weather’ ‘use during poor weather’
‘drink outside’ ‘beer gardens’ ‘outdoor cafés’
People want programming all yearround. With protection from the elements and invitations to spend time Downtown, small interventions could have a big impact on public life.
^
Intercept Question: What two things would you like to do in the public spaces Downtown - in the winterthat you cannot do now? (Winter data)
‘eat under shelter’ ‘heated places to sit’ ‘cover from rain’
‘relax’ ‘people-watch’ ‘read’ Protection from the Elements (35)
recreation (46)
Events & Activities (52) ‘festivals' ‘free classes’ ‘live music’
Active Recreation (43) ‘dance’ ‘play sports’ ‘skateboard’
‘places to sit out of rain’
‘farmers market’ ‘outdoor craft market’ ‘food market’ Markets (14)
‘small dog sections’ ‘big dog sections’ ‘indoor options’
‘meet friends’ 'meet other people' 'date spots'
‘shop' 'outdoor shopping' ‘stores’ Shopping (5)
‘too many needles’ 'fresh air' 'reduce cars' Cleanliness (4)
Pet friendly (7)
places (6)
Accessibility (6) ‘better maps’ ‘more buses’ ‘public washrooms’ Safety (3) ‘unsafe at night’ Space for kids (2) ‘activities for kids’ Affordability (3) ‘cheaper housing’ Seasonal Decorations (2) ‘more Christmas decorations'
Social Equity (2) ‘right to housing' 'support homeless'
Art (5)
‘exhibits’ ‘make art outside’ ‘public art’
‘more lights’ 'light up Davie' 'light up Stanley Park' Lighting (4)
feel less safe during the Winter.
felt very safe in the summer while only 47% felt very safe in the winter
^ Intercept Question: How would you rate your feeling of personal safety in this space right now? (Summer vs. Winter data)
This could indicate that with fewer hours of daylight in the Winter, lighting is even more important! But it could also indicate that people spend time in different public spaces in the city summer vs winter.
> Perception of safety in the Summer
> Perception of safety in the Winter
Overall, none of the reported age groups show a significant challenge with sense of safety, but it is noticeable that 10% of teens reported feeling unsafe. This response may relate to where respondents spend time in the city. There is a consistent increase in the percentage of respondents who report feeling very safe as age increases.
^ Intercept Questions: How would you rate your feeling of personal safety in this space right now?
What is your age?
(Combined Summer and Winter data)

Perception of safety is impacted by the respondents' relationship to Downtown.
While 71% of tourists feel very safe, only 39% of employees do
^ Intercept Questions: How would you rate your feeling of personal safety in this space right now?
What best describes your relationship to Downtown?" (Combined Summer and Winter data)
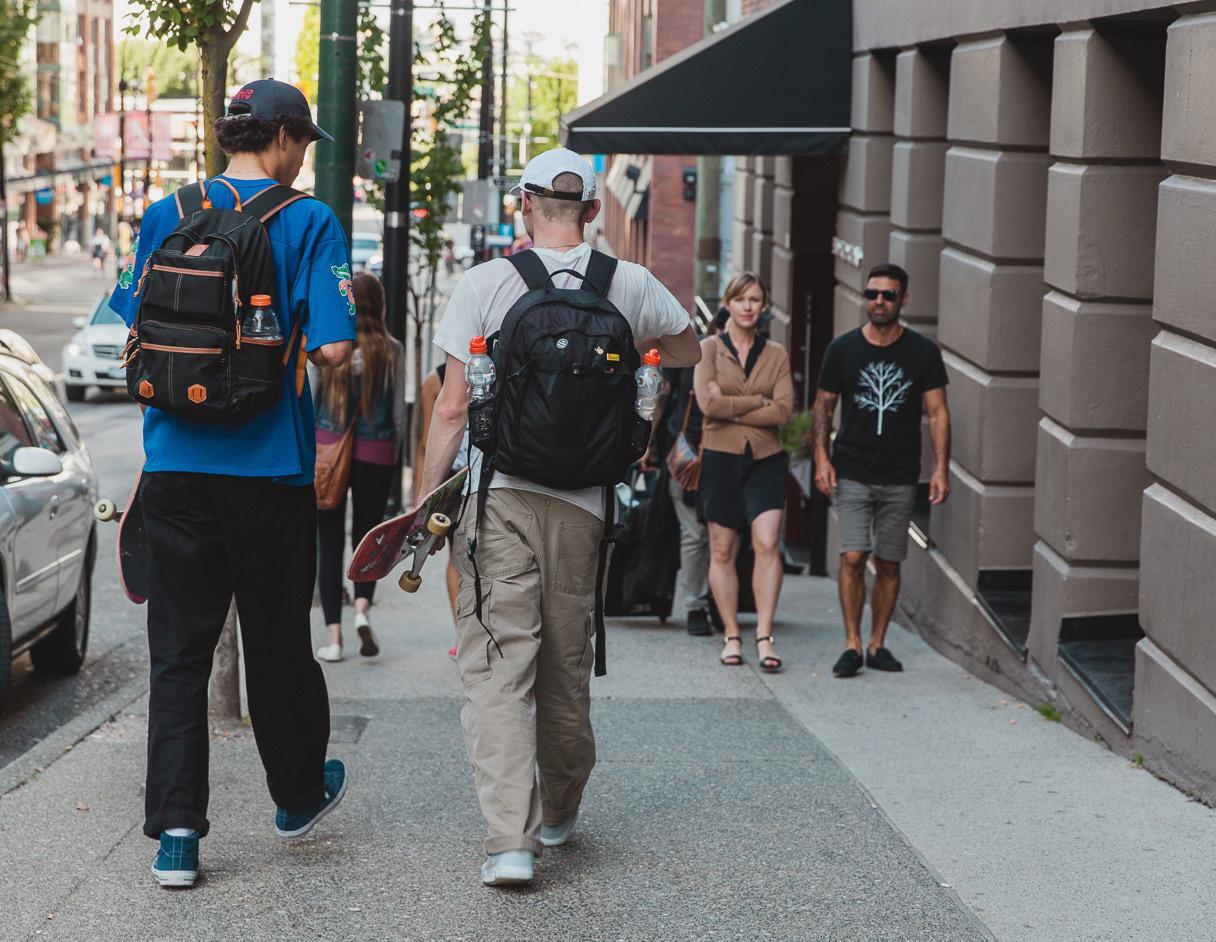
People who are likely to be visiting for the first time, such as tourists, are the most likely to feel very safe. People whose relationship to Downtown brings them there often, such as residents and employees, are more likely to feel unsafe. This may speak to frequency of visits as well as to where people spend time in the city. Residents tend to have a different understanding and knowledge of certain civic challenges such as homelessness and substance use, where visitors may lack the same exposure and therefore perceive the same environment differently.
Changes to the physical environment could impact social connectedness in the city.
64% of respondents interacted with someone they did not plan to meet
^ Intercept Question: Did you interact with someone here today who you did NOT come with?
(Same for both Summer and Winter)
*A recent study conducted by The Vancouver Foundation: Connect & Engage, found that many Vancouverites find it difficult to make friends and often feel lonely. The fact that people interact when out it the public realm indicate that invitations to spend time out in Public Space could have an effect of social connectedness in the city.
https://www.vancouverfoundation.ca/our-work/initiatives/ connections-and-engagement
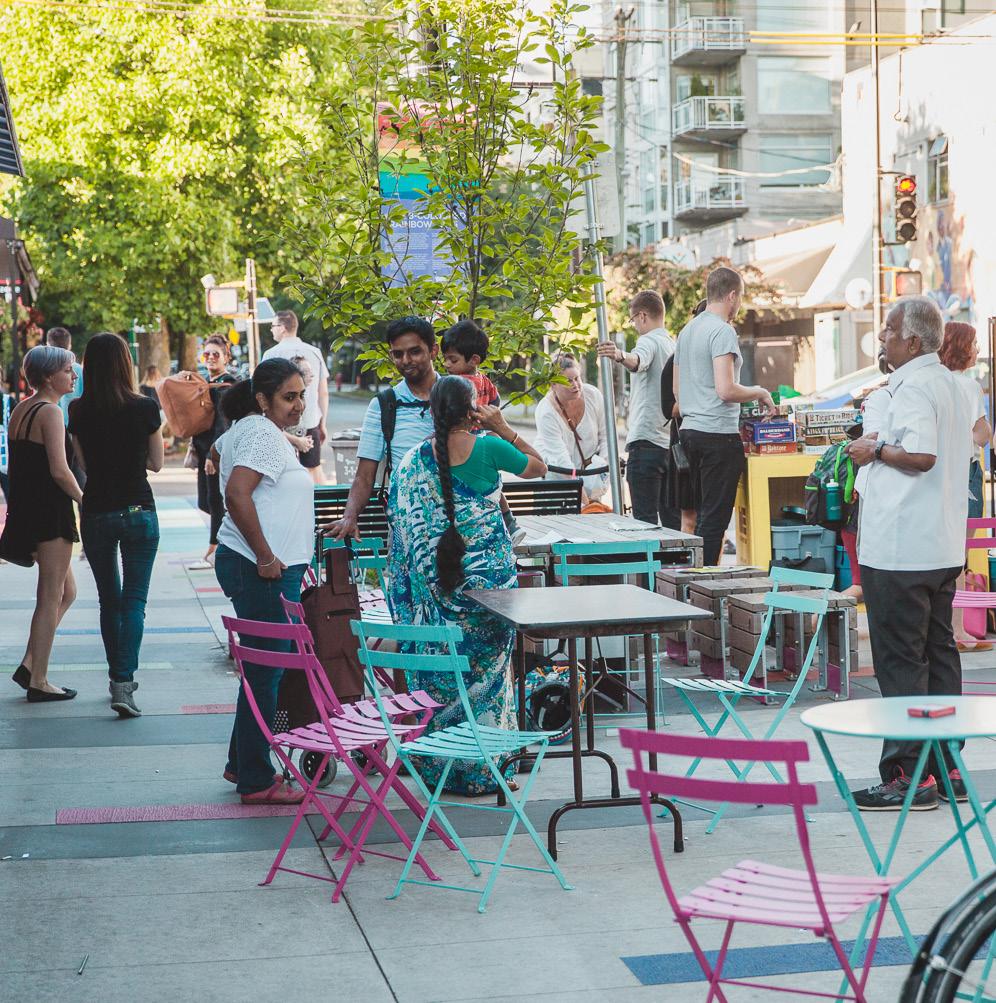
Public Space design and invitations to spend time affect the likelihood of people interacting.
50% of respondents who interacted with someone reported interacting with a person they had never seen before!
^ Intercept Questions: Did you interact with someone here today who you did NOT come with? Did you know them before today? (Combined Summer and Winter)
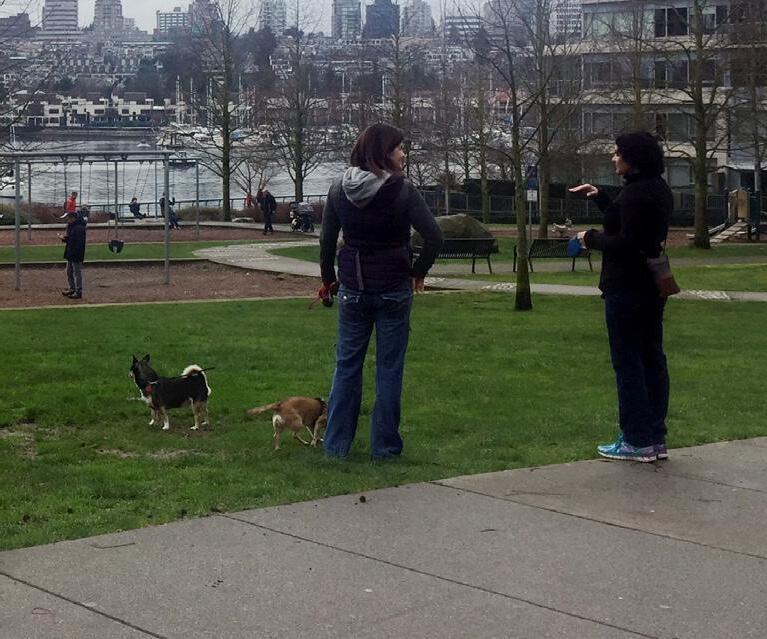
By creating more invitations for play, pets, activities, sitting, and volunteer opportunities in the public realm, people may be more likely to engage is new social interactions.
These are the most popular reported reasons why people interacted with someone they had never met.

^ Reasons for interacting (Combined Summer and Winter Data)
Note: Reasons for interacting are fairly consistent between Summer and Winter, except slightly more people meet because of children in the Summer (6%) than Winter (2%)

(pages 64-71)
1 4
Counts of people walking
Downtown Vancouver invites people to walk all year round, with some parts of Downtown working harder than others to support pedestrians.
The highest pedestrian volumes are seen in areas with retail, transit nodes or key destinations. Retail streets and station areas often exceed capacity, making for uncomfortable walking experiences, while other streets see low pedestrian activity. On average, pedestrian activity dropped by 20% across all sites surveyed in the Winter.
Observed gender-presentation
Observed age-presentation
People of all ages walk in Downtown, but not everywhere and not at all times. Season, time of day and location affect who is out walking. 2 3
Counts of people on bikes
Overall, pedestrians Downtown reflect a fairly even gender-balance. This balance shifts during the winter, and is affected by time of day and location.
The overall gender-balance of pedestrians Downtown is a relatively even split. However, some locations, especially those with lower overall pedestrian counts, fewer active frontages or poor lighting, demonstrate a drop in female-presenting pedestrians in the winter.
When compared to neighbourhood and citywide census data, not all neighbourhoods see balanced age representation in pedestrian counts. In the winter, fewer older adults and children are out walking.
Cycling is becoming increasingly common, in line with infrastructure improvements Downtown. Still, cycling counts are low, especially in the winter.
Not surprisingly, there are more people on bikes in Downtown Vancouver where investment in infrastructure supports safe cycling. People on bikes are part of Public Life. They are out in the Public Space, where eye contact and direct communication are possible and democratic negotiation of the space happens.
(pages 72-83)
Counts of people staying
When it comes to stopping and staying, the youngest and oldest age groups are underrepresented in the public realm. 5 6 7 8
In the summer, Downtown is bustling with city life and a many people choose to stop and stay in the public realm. In the winter, staying activity drops by 70%.
People choose to stop and stay when they feel invited.
Public spaces that invite people to enjoy the positive aspects of climate, provide views to nature and inspire people watching see a lot of activity in the summer. In the winter, activity is confined to areas that offer comfort and protection from the elements.
Mappings of stationary activities
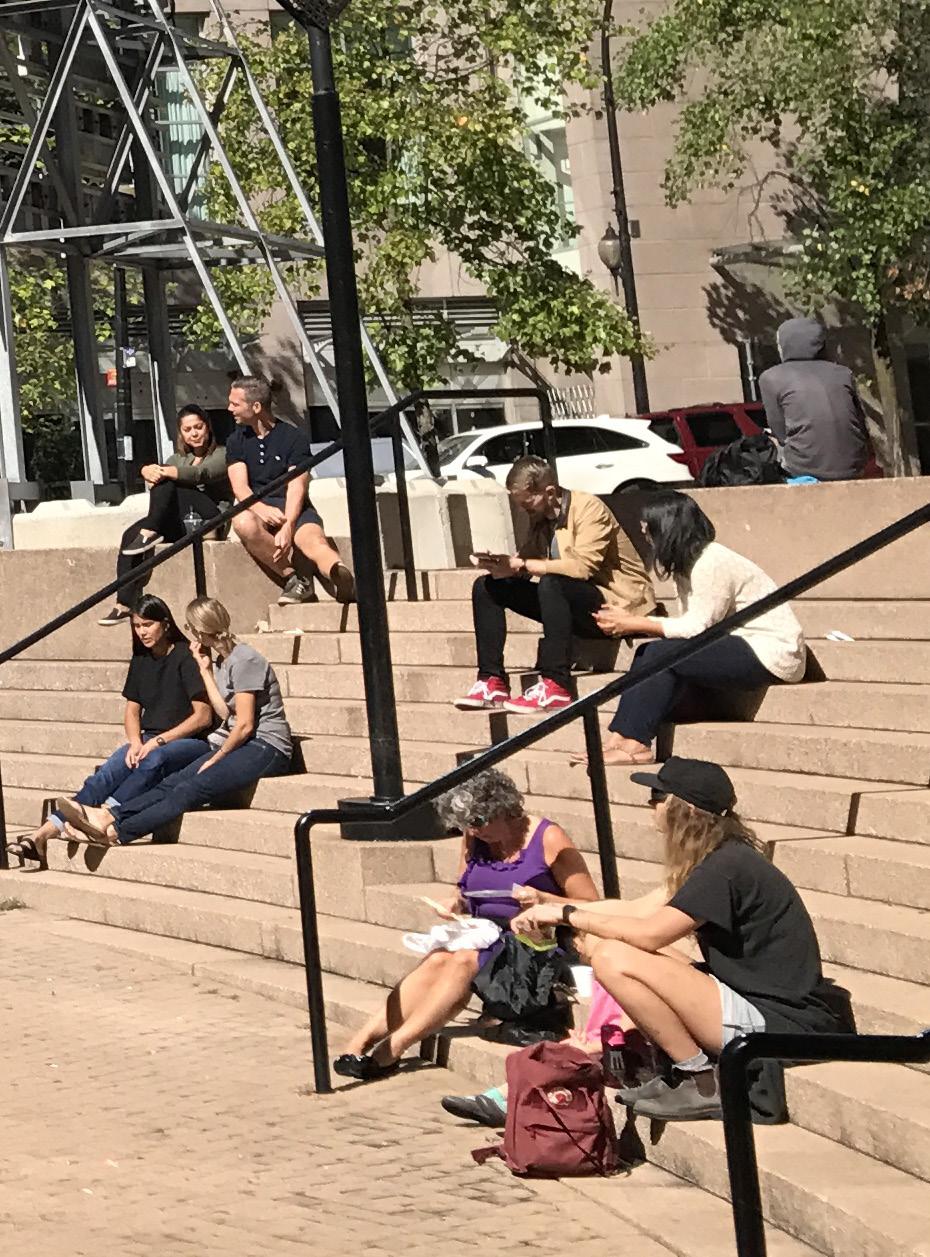
The majority of stationary activities observed are related to outdoor serving and passive recreation, with many people sitting on stairs in the summer. In the winter, most people are standing and engaged in necessary activities.
In the summer, many people choose to sit outside and enjoy food and drinks. In the winter most people are standing, more people are spending time by themselves, and necessary activities dominate public life. Weekends invite for more social activities and more diverse activity profiles.
Observed gender-presentation
The gender balance of people staying closely represents the demographics of Downtown residents. But, when compared to people moving, there is a lower percentage of femalepresenting people choosing to stop and stay.
The gender balance of people spending time in the public realm very closely reflects the gender balance of Downtown residents, which has a lower percentage women than the City of Vancouver. Major destinations with higher overall counts show a more balanced ratio, while smaller public spaces reflect greater gender imbalance.
Observed age-presentation
By comparing stationary counts to the census data, we see that few public spaces are inviting older adults to spend time there. During the winter, when protection from the elements and adequate lighting are most important, this imbalance is greater. Interestingly, most areas have more kids stopping and staying than walking nearby.
The highest pedestrian activity volumes are seen in areas with retail, transit nodes or key destinations.
During summer weekdays, high pedestrian counts were concentrated around retail streets and station areas, while secondary streets saw significantly lower numbers.
On average, Summer weekend pedestrian counts were the highest observed.
During the summer, key destinations outside the retail areas such as English Bay Beach are active on both weekdays and weekends.
Summer Pedestrian Counts*
Note: Some count averages that were not carried out as full day counts are skewed higher, as they do not include lower pedestrian activity in the morning or evening.
*Hourly counts, averaged over the day
See Appendix for a map of count locations and detailed count profiles
On average, pedestrian activity dropped by 20% across all sites surveyed in the Winter
During the winter, pedestrian activity was even more concentrated, with secondary streets seeing significant drops in activity.
Winter weekend counts, especially related to retail areas, are higher than weekday counts, even in the summer.
Key destinations outside the retail areas such as English Bay Beach see a significant drop in activity the winter, due to weather and fewer hours of daylight.
Winter Pedestrian Counts*
Note: Some count averages that were not carried out as full day counts are skewed higher, as they do not include lower pedestrian activity in the morning or evening.
*Hourly counts, averaged over the day
See Appendix for a map of count locations and detailed count profiles
The percentage of female-presenting pedestrians is more similar to the demographics of Metropolitan Vancouver and BC than to Downtown Vancouver. This may be an indicator that Downtown is an attractive destination for people who are out walking.
However, with more male than female residents living Downtown, the ratio of female-presenting pedestrians Downtown is relatively high. of residents Downtown are Female (according to the census) of pedestrians counted are female-presenting
Census demographics for all of Downtown vs gender presentation for pedestrians
See Appendix for a map of count locations and detailed count profiles
*Represented on survey but no 'Other' observed
48.5%
47% (average of all counts)
Census Data Pedestrian Counts
Ratio of female to male residents in Vancouver, according to 2016 census data
Vancouver City of Vancouver British Columbia
Cardero Street (5% drop in the winter)
English Bay Beach (6% drop in the winter)
While the average percentage of femalepresenting pedestrians is relatively consistent (49.2% in the summer and 47.9% in the winter), some locations with lower overall pedestrian counts see a larger drop in the winter.
This indicates that some areas may be perceived less safe in the winter, which can be attributed to public spaces having fewer active frontages, being poorly lit, and having fewer people out in general (including fewer stationary people).
Female-Presenting Pedestrians
Average of Weekends and Weekdays
See Appendix for a map of count locations and detailed count profiles
Harbour Green (8% drop in the winter)
While all age groups are represented out walking, the ratio is affected by the season and the day of the week.
On weekends the percentage of young adults out walking exceeds their census representation. In the winter there is a significant drop in the percentage of older adults out walking.
This indicates that more can be done to make sure that toddlers, kids and older adults are invited to walk all year-round.
Census age demographics for all of Downtown compared to age demographics for people walking
Older Adults (65+)
Adults (25-64)
Young Adults (15-24)
Kids (7-14)
Toddlers (0-6)
Age division for Downtown Vancouver, according to 2016 census data
Though still underrepresented, more older adults are out walking in the summer than in the winter
More young adults and kids are out walking on weekends
Older people out walking are underrepresented
Some Downtown neighbourhoods do better than others toward inviting all age groups to walk.
When comparing the ages of residents in each neighbourhood to pedestrian counts in the same area, some age groups are underrepresented.
This indicates that not all neighbourhoods provide a walking environment that caters to its residents. This can be related to the quality of the walking environment (its safety, comfort and delight) and it can be a representation of the functions and destinations that attract these age groups to the neighbourhood.
Census age demographics compared to age groups of people walking, by neighbourhood Summer and winter counts are averaged, as the seasonal differences were comparable with the Downtown-wide data.
See Appendix for a map of count locations and detailed count profiles
Older Adults (65+)
Adults (25-64)
Young Adults (15-24)
Kids (7-14)
Toddlers (0-6)
Yaletown, and False Creek North see fairly even representation
The CBD and Coal Harbour attract young adults. But where are the kids?
Vancouver has taken crucial steps towards getting more people out biking in the city.
People on bikes are part of Public Life. They are out in the Public Space, where eye contact and direct communication is possible and democratic negotiation of the space happens.
Not surprisingly there are more people on bikes in Downtown Vancouver where investment in infrastructure invites people to bike safely. Still, counts of people biking are fairly low relative to the amount of people overall who choose active mobility (see introduction pages for comparison).
Even on the most active routes, winter cycling counts see a drop.
Summer Cyclist Counts*
*Hourly counts, averaged over the day
See Appendix for a map of count locations and detailed count profiles
Hornby St
Winter weekday average = 44 people cycling
Dunsmuir St
Winter weekday average = 74 people cycling
1/2
10%
For the second year in a row, Vancouver residents made half of their trips by sustainable modes (walking, cycling, and transit). Page 4
5km
For the second year in a row, 10 per cent of Vancouver residents cycled to work and nearly a quarter walked to work. Page 12
Vancouver residents are comfortable cycling moderate distances — the average bike trip distance is over five kilometers and we can support longer trips by expanding our AAA network.
Page 14
Active transportation is good for social connectedness — people who walk and cycle are most likely to have a friendly interaction during their trip. Page 18

A lot is being done to support people biking in Vancouver

< One of the busiest on-street bike lanes Downtown, Hornby Street.
^ The Transportation 2040 plan sets targets for the future, including cycling.
Weather impacts active transportation — 2016 was a wetter year than 2015 and it likely contributed to slightly lower bike volumes recorded at our bike counter locations. Page 29
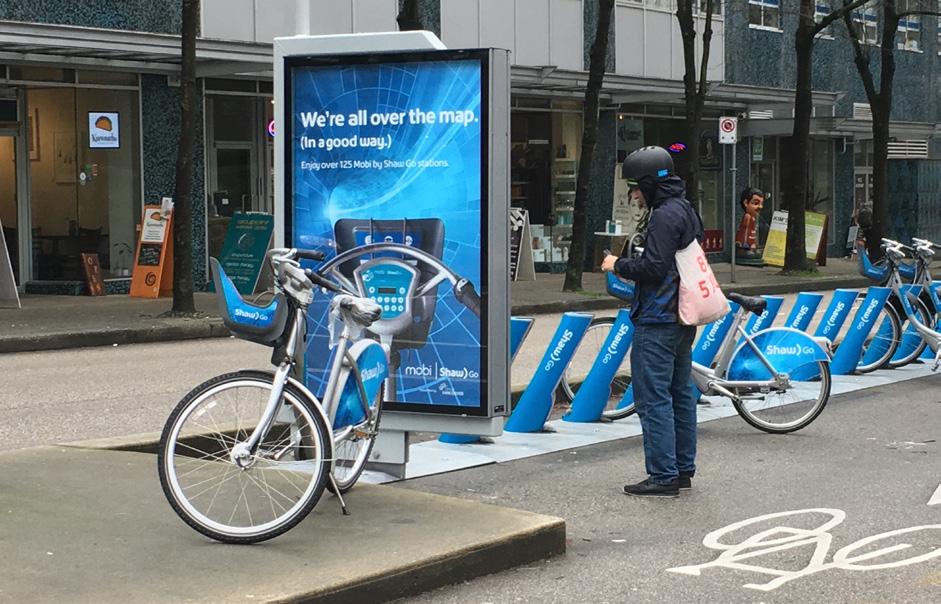
< Mobi bike share provides a popular alternative to private bikes
< Vancouver 2016 Active Transportation Report Card
In the Summer, Downtown is bustling with city life, and a lot of people choose to stop and stay.
People choose to stop and stay when they feel invited, safe and comfortable. Destinations that invite people to enjoy the positive aspects of climate and the beautiful natural setting surrounding Downtown see a lot of activity.
*Hourly counts, averaged over the day
See Appendix for a map of count locations and detailed count profiles
Stairs near public functions attract a lot of people and are great locations for people watching, especially when it's sunny.

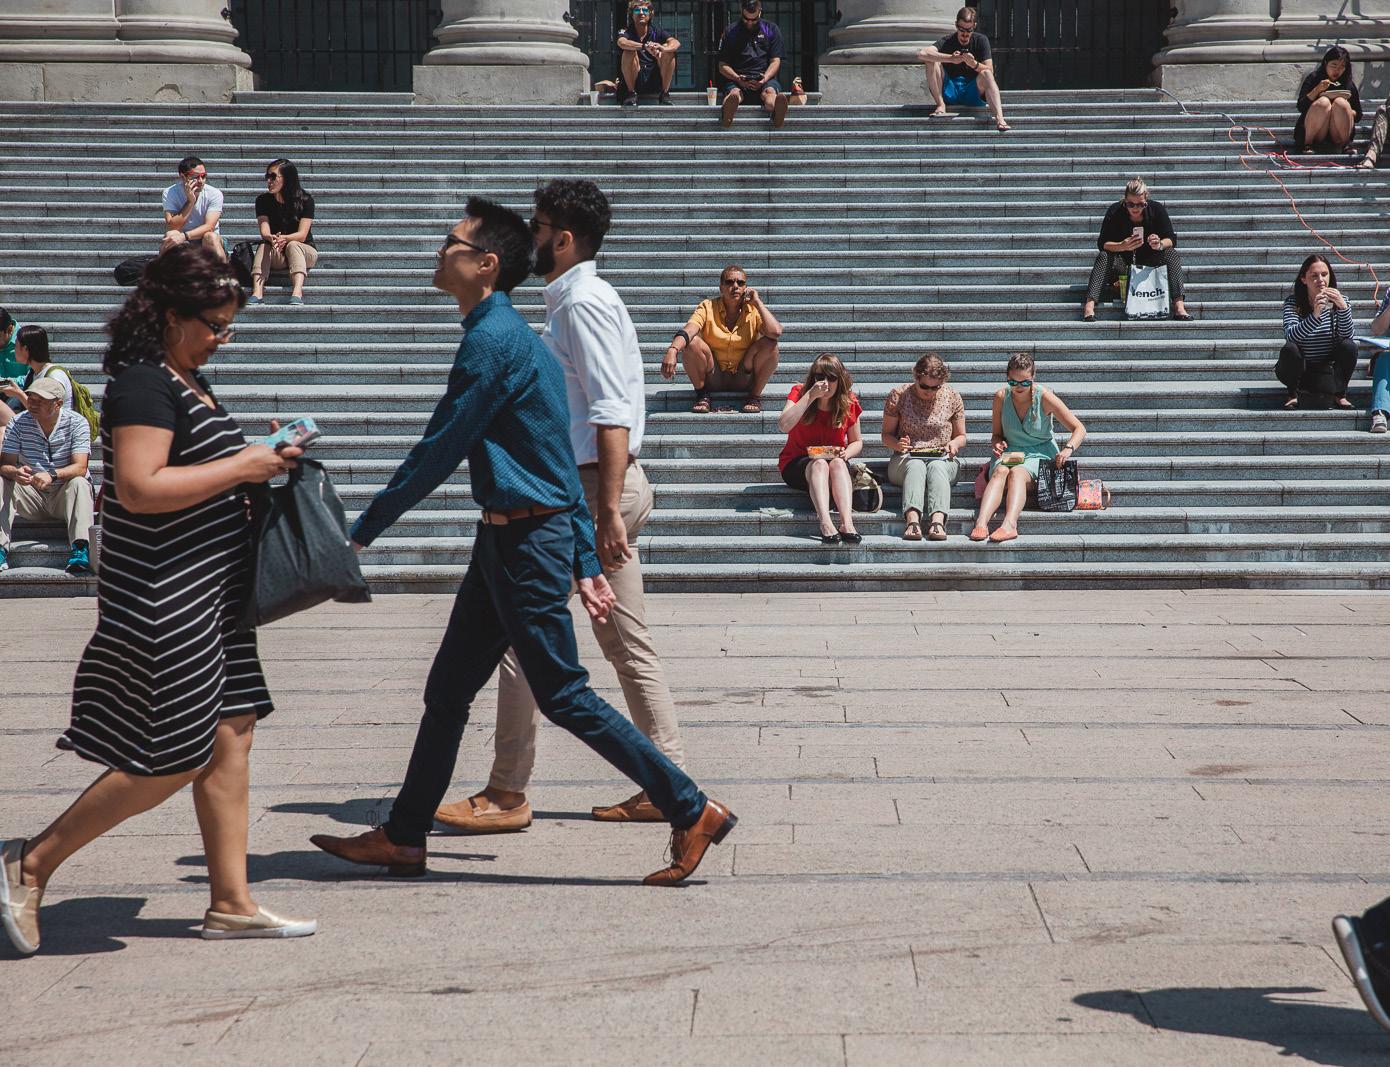


Public spaces adjacent to retail streets see a lot of activity
The Seawall attracts a lot of activity, inviting people to enjoy the beautiful weather, views, and recreation
In the Winter, stationary activity on average drops by
and public spaces that offer shelter from the elements see the majority of the activity that remains. This is not surprising, as Vancouver winters bring a lot of rain. But, because pedestrian counts are still high, this indicates that more can be done to get people to 'stick around longer' in the winter.
Winter Stationary Counts*
*Hourly counts, averaged over the day
See Appendix for a map of count locations and detailed count profiles
Public spaces that offer activities sheltered from the elements see more activity in the winter

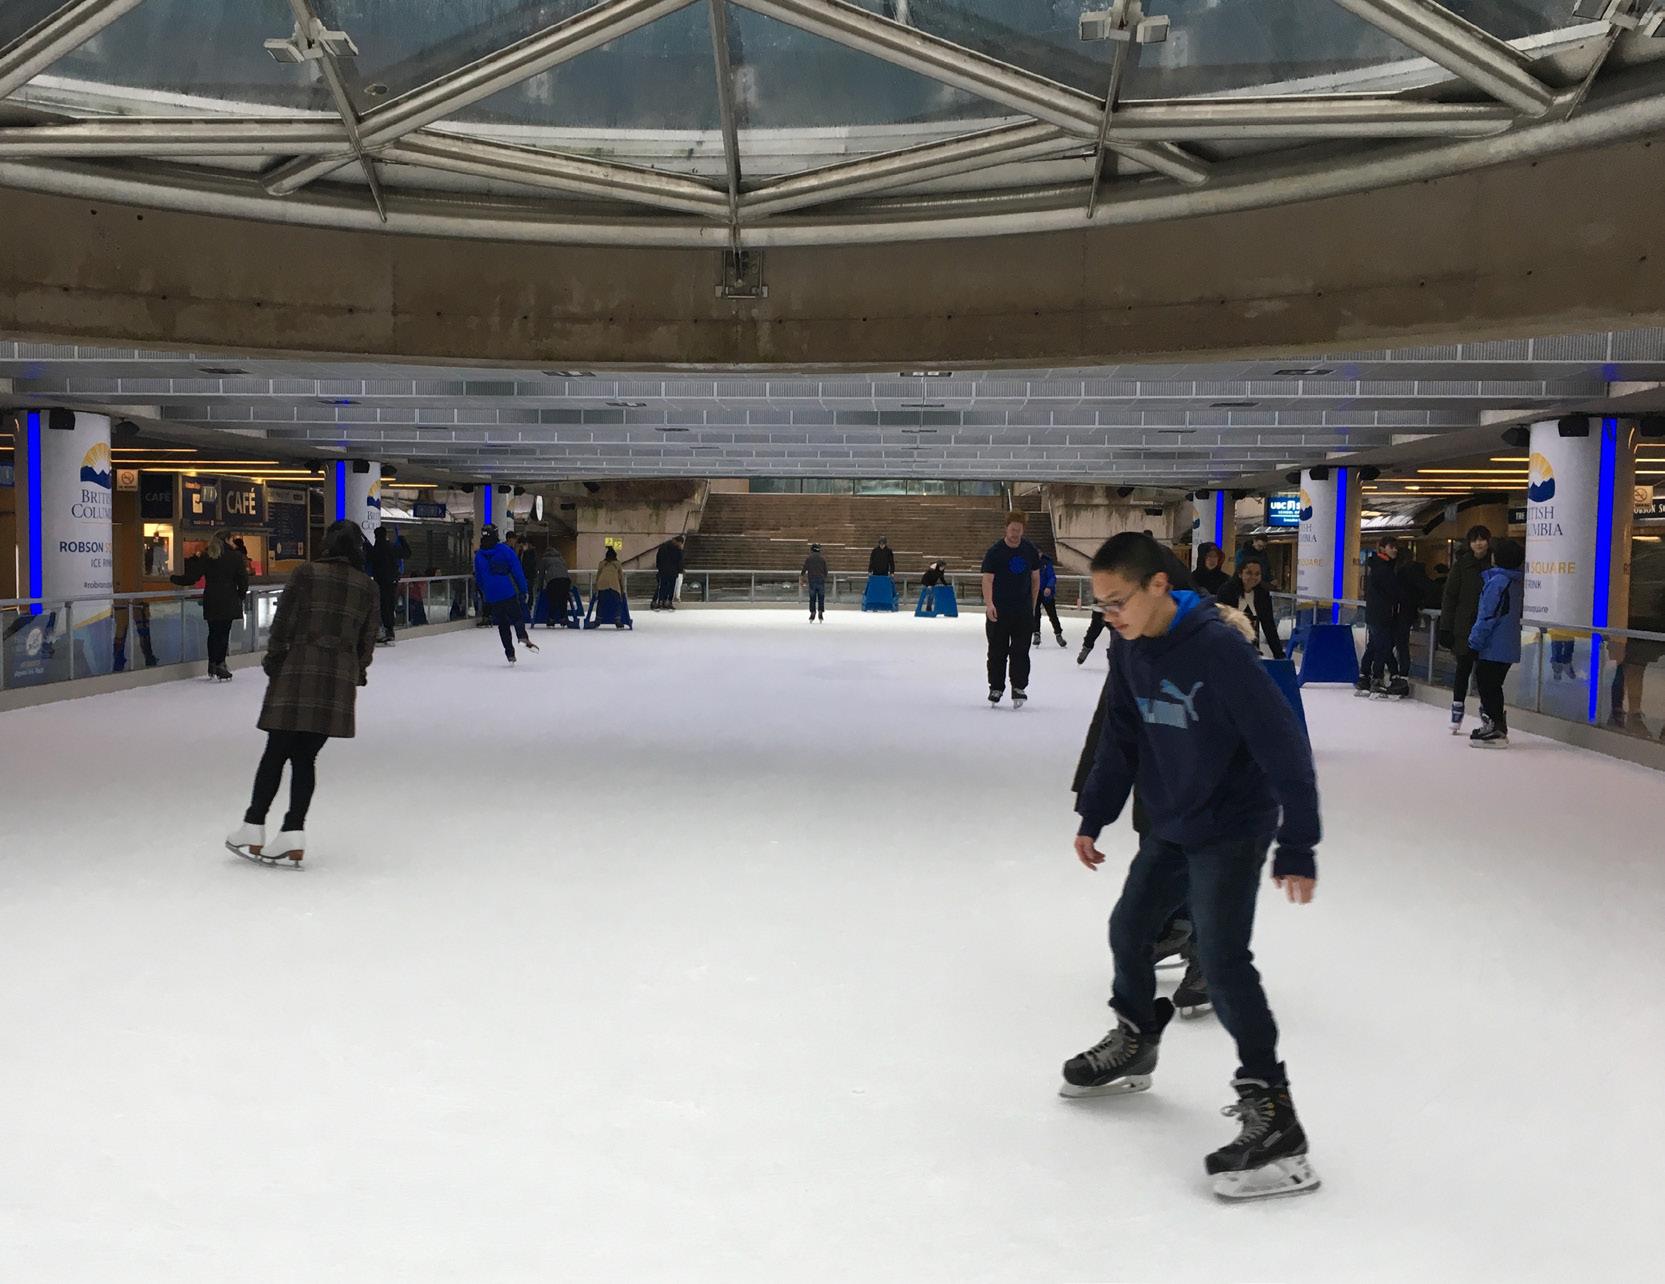


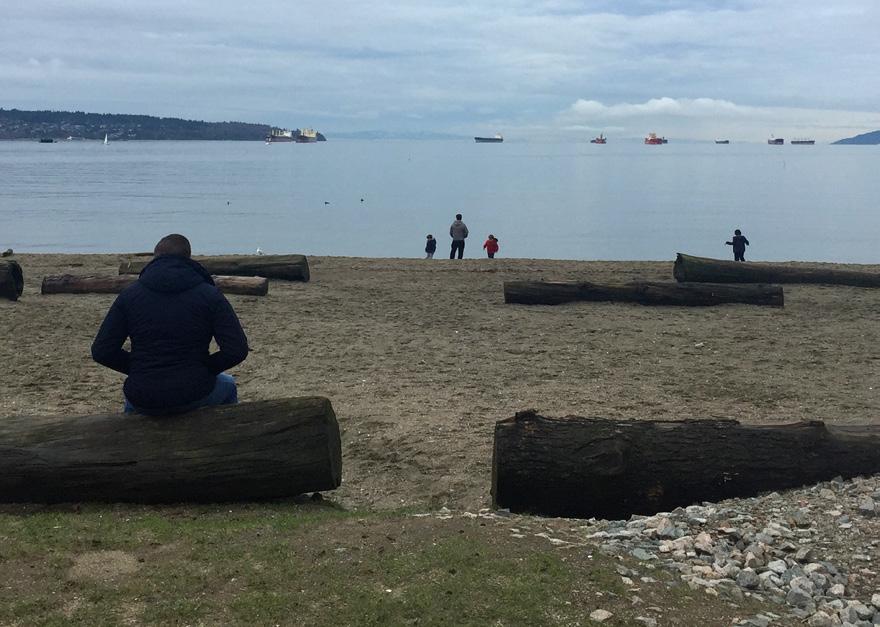
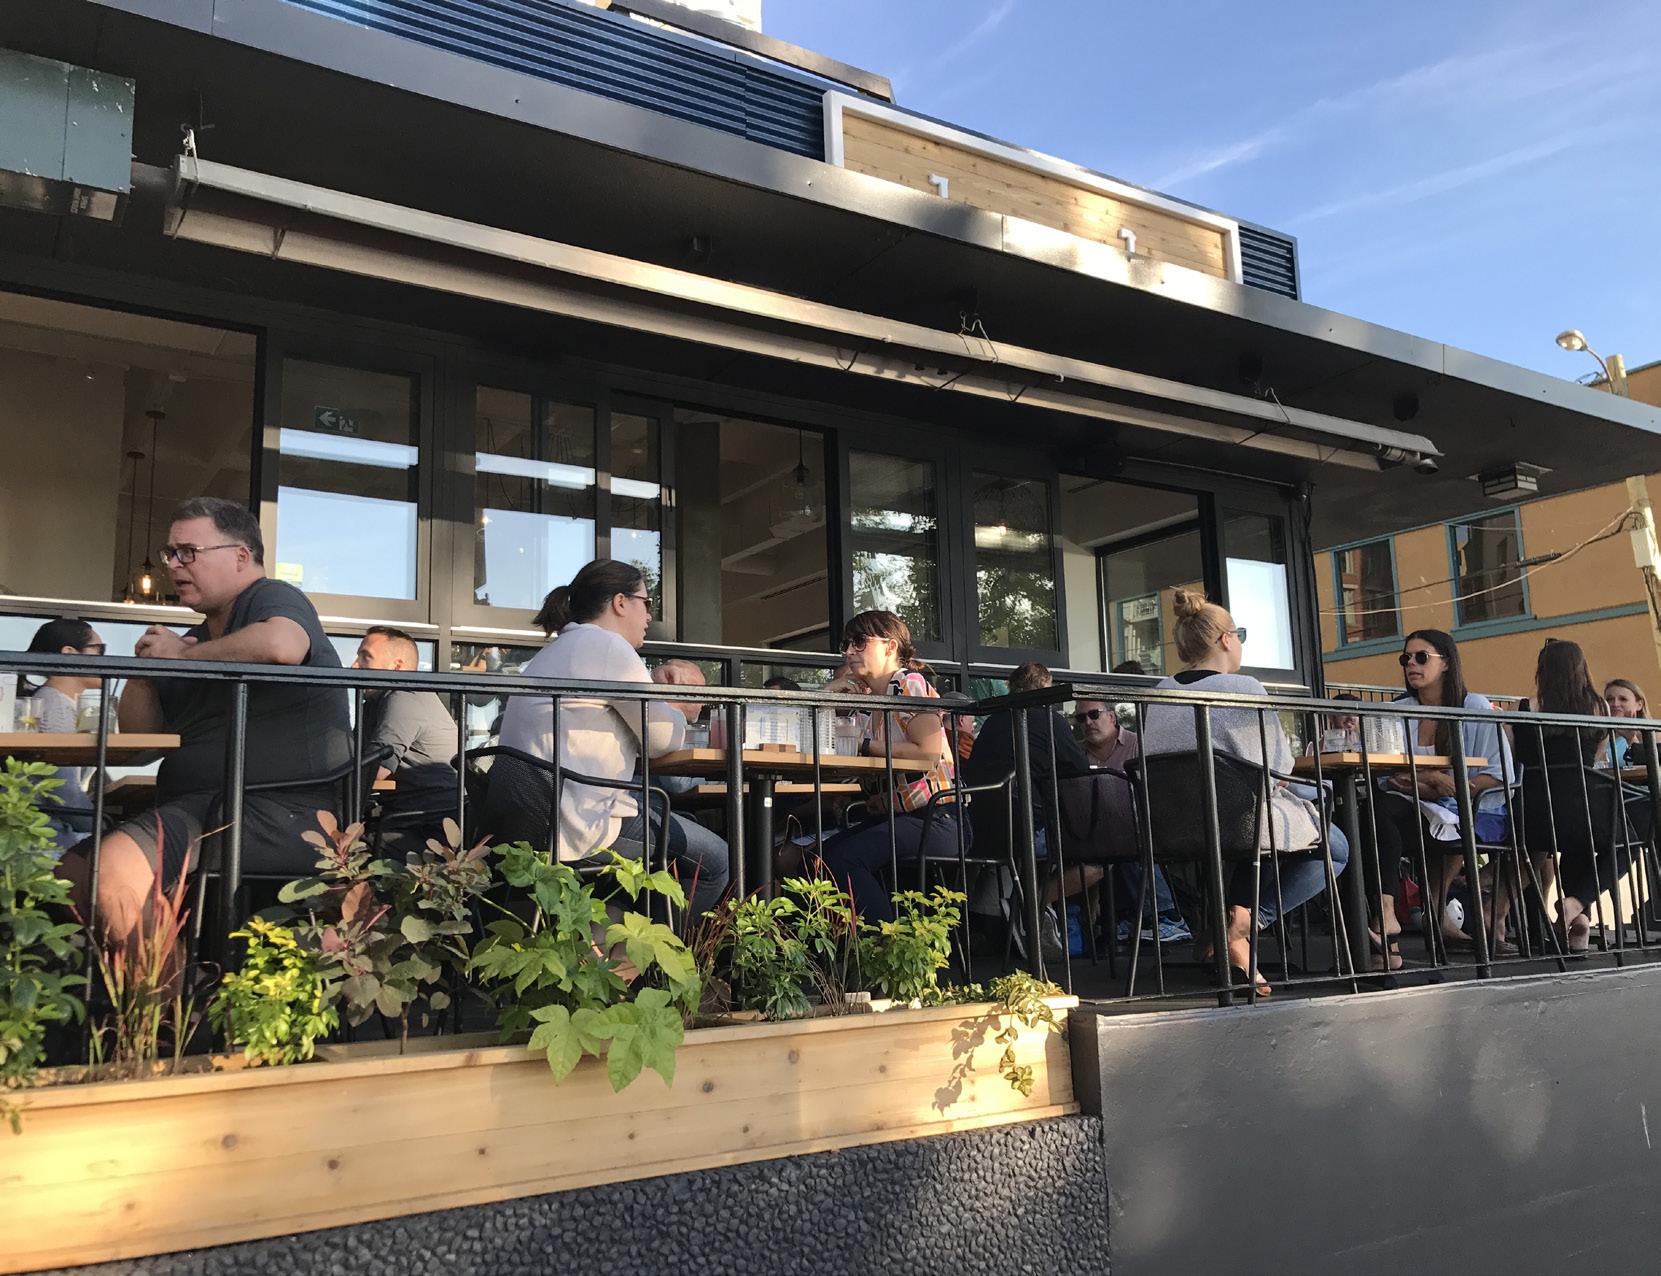
People continue to enjoy food and drinks outside, specially when serving areas offer shelter
The Seawall does not invite a lot of people to stop and stay in the winter, although a lot of people are still moving through
In the Summer, most people spending time in public space are eating and drinking or engaging in passive recreation. Weekends invite more diverse and more social activities.
Weekday activity peaks around lunch and after work. People enjoy food and drinks at outdoor serving areas when the weather is conducive to recreation. While more people are engaged with commerce around lunch and commuter hours, active recreation increases mid-afternoon.
See Appendix for a map of count locations and detailed count profiles
Weekend activities increase steadily throughout the day and include a wider range of stationary activities. These include cultural activities, commerce and active recreation. Weekend activities tend to be more social and less solitary. In addition, they are composed of a greater proportion of optional activities (ie. recreation) to necessary activities (ie. waiting for transit). This means that people are there because they want to be, not because they have to be.
During the week, more people are spending time alone or in pairs. On the weekend, most people are in larger crowds and groups
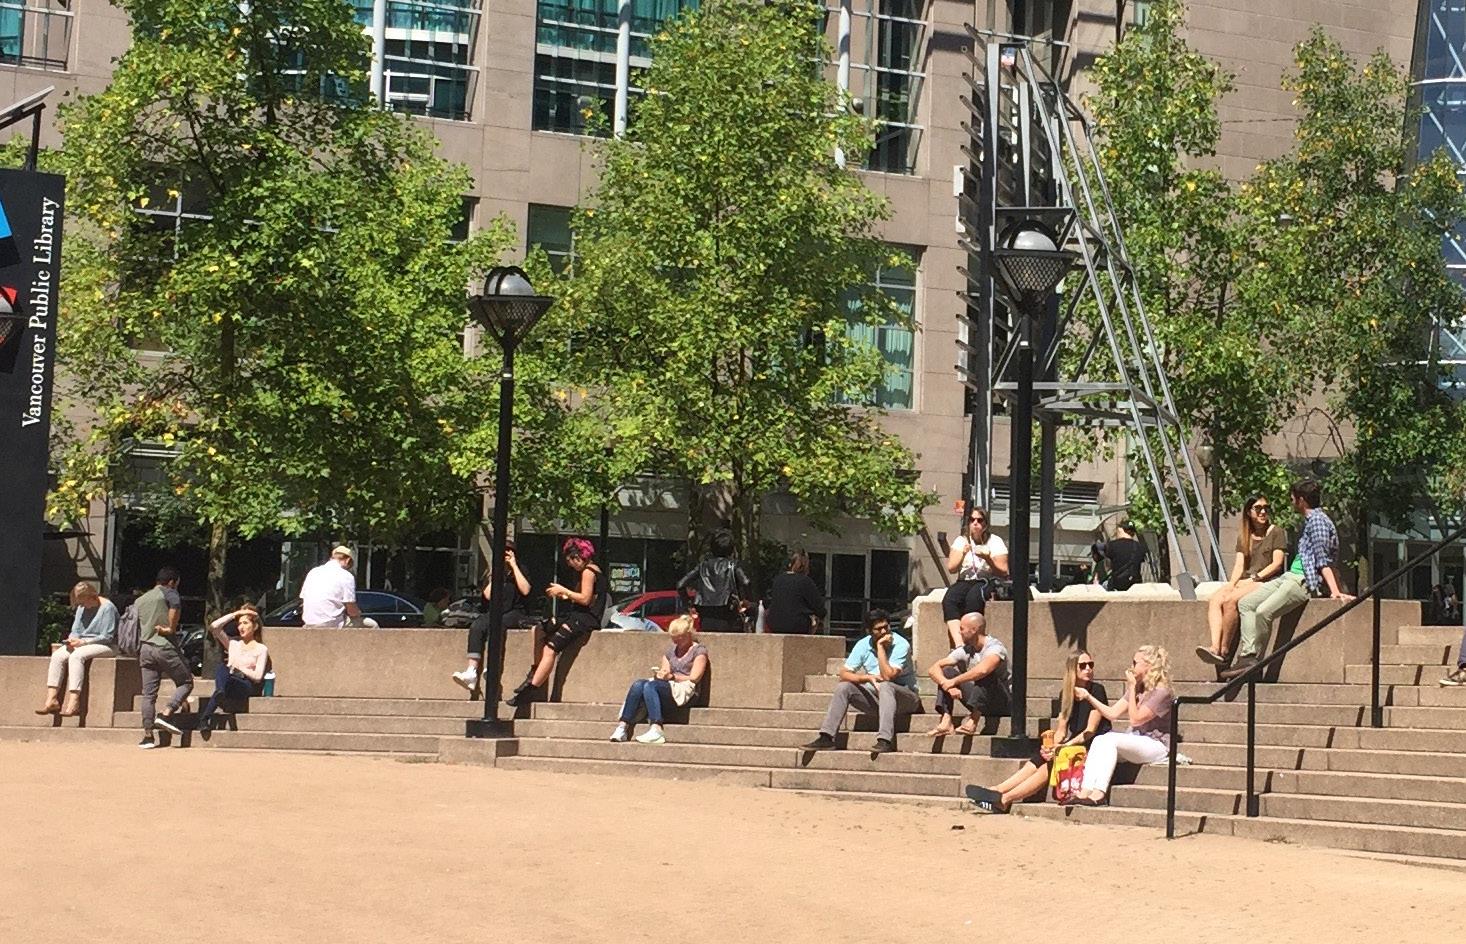


In the Winter, necessary activities dominate. More people are by themselves, and the vast majority of people are standing.
During the winter, fewer people chose to spend time in public space. This means that with fewer optional activities, necessary activities such as waiting for transit are more dominant. Similarly, the percentage of people engaged in less socially acceptable activities such as panhandling, intoxication and substance use is higher (13.5% of all activity over the day across all sites).
On the weekend more people are spending time in public space with a greater diversity of activities. Outdoor serving areas that offer shelter from the elements invite a fair amount of activity and the number of people spending time alone drops, relative to weekday counts. Still, the majority of people that stop and stay are engaged in passive recreation or waiting for transit and many are on their phones.
During the Winter, more people spending time in public space are alone. During the week, this number rises to nearly 2 out of 3 people .


During the winter, the vast majority of people are standing. This is likely because surfaces are wet, and indicates a need for seating that is protected from the elements.
Though gender balance for people staying very closely represents Downtown resident demographics, it is not representative of the metropolitan region.
Unlike the counts for people walking, the ratio of female-presenting people staying is significantly lower than the gender ratio for the City of Vancouver and British Columbia. This difference is exaggerated in the winter when only 40.5% of the people counted staying are femalepresenting compared to 43.2% in the summer. Fewer female-presenting people staying could indicate a lack of invitations for both genders.
Compared to people walking, the gender balance of people staying more closely represents resident demographics Downtown
41.8% of people counted staying are female-presenting (average of all counts)
See Appendix for a map of count locations and detailed count profiles
*Represented on survey but no 'Other' observed
At major destinations, there tends to be a higher percentage of female-presenting people spending time.
Major destinations are also the places that have higher numbers of people staying overall and offer a variety of reasons to stop and stay. In contrast, the majority of streets and smaller scale public spaces in the CBD see more male-presenting people spending time.
This indicates that public spaces that offer a variety of options for stopping and staying are more inclusive, and that perception of safety is higher when more people are staying in the space.
*Average over the day
See Appendix for a map of count locations and detailed count profiles
While young adults are wellrepresented in the public realm, the youngest and oldest
Older adults are especially underrepresented during the winter, and counts of kids spending time in the public realm were especially low on winter weekdays. These lower numbers may be related to a lack of protection from the elements, insufficient lighting to mitigate the lack of daylight, or not enough programming for all age groups throughout the year.
Older adults are under-represented in the public space Downtown in the winter.
Toddlers and kids are represented winter weekend, but weekday few kids spend time in the public spaces Downtown
Census age demographics for all of Downtown compared to age demographics for people staying
Older Adults (65+)
Adults (25-64)
Young Adults (15-24)
Kids (7-14)
Toddlers (0-6)
Age division for Downtown Vancouver, according to 2016 census data,
0-6
7-14
Older adults live in West End and Coal Harbour, but are underrepresented in public space
By comparing counts to the census data, we see that few public spaces invite older adults out. Interestingly, most areas have more kids stopping and staying than walking.
This indicates that not all neighbourhoods have public spaces that cater to their residents, but it is clear that with the right public space program in place all age groups will stop and stay.
Census age demographics compared to age groups of people staying, by neighbourhood Summer and winter counts are averaged, as the seasonal differences were comparable with the Downtown-wide data.
See Appendix for a map of count locations and detailed count profiles
Older Adults (65+)
Adults (25-64)
Young Adults (15-24)
Kids (7-14)
Toddlers (0-6)
Toddlers and kids are well-represented in False Creek North
This is the only neighbourhood in which older adults staying are not underrepresented


2
Access and variety
While it's noteworthy that all Downtown Vancouverites are within walking distance of a public space, not everyone has access to different types of public spaces that provide diverse programming to serve their individual needs.
Identity and character
The public spaces across Downtown are unique, with each place defined by specific contextual, historical, and cultural qualities. These distinct public space identities have the potential to be vcelebrated and leveraged in order to evoke a stronger sense of place and identity.
By understanding and leveraging the diversity of Public Spaces in Downtown, Vancouver may better support diverse Public Life profiles. It is important to note that streets are included in the Public Space network, as they are valuable spaces not only for moving, but also for spending time.
3
1 4
Everyday, event and seasonal use
There are enough residents and visitors in Downtown to activate all of the public spaces Downtown, however, many of these spaces could be doing more to attract people to stay during the day as well as throughout the various seasons.
Perception of public and private spaces
Some public spaces throughout Downtown are experienced being private even when public. There is an opportunity to deploy better design cues to invite more people to stop and stay. These spaces are challenged by jurisdictional boundaries and necessary service uses that limit their full potential.
Streets and Seats 5 6 7 8
Community hearts and meeting places
Civic institutions, such as libraries and community centers, function as neighbourhood meeting places all year around and could greatly benefit from more distinguished public spaces that make this public life visible and invite people to spend time outside.
Places of arrival
Places of arrival, such as station areas and bridge landings, have the potential to be celebrated as great public spaces that provide high quality connections to civic assets and destinations. At the moment, they are not as inviting or comfortable as they could be for people who are passing through, waiting, or spending time there.
Connections to neighbourhoods and amenities
Connections are not always seamless between neighbourhoods, the city core and the Seawall. Wide streets that are hard to cross and lack integrated wayfinding create barriers to these destinations.
Overall, streets are of high quality and support people walking with generous sidewalks, high quality paving and street trees. But, they do not all invite people to stop and stay other than 'pay to stay'. Public benches are few, if any, and the popularity of street plazas along retail streets show an acute need for more public seating.
The Downtown Peninsula is comprised of Public Spaces of varying scales and character. While the overall quality of the public realm is high, there is potential for existing Public Spaces to better support Public Life.
Each Public Space has physical and contextual qualities that make it unique. However, when looking across the Public Spaces surveyed, trends in the Public Life profiles emerge by typology.
The following section is not an exhaustive list of all collected Public Life and Public Space data. Stories have been selected to provide an overall understanding of the current use of Public Spaces Downtown. See Appendix for detailed data profiles for each location.
Plazas are largely related to civic destinations and landmarks. They vary in scale and character and their Public Life profiles show that in general they can do more to promote everyday life.
While some plazas invite for a variety of activities, some see activity only during events.
Plazas adjacent to indoor civic functions, such as libraries and community centers, function as neighbourhood meeting places all year around and have the opportunity to encourage more Public Life to spill outside.
60% commercial sitting
18% commercial sitting
Weekend peak at 2pm

Despite its' adjacency to a community center that serves as a neighbourhood destination, Roundhouse Plaza sees very little activity besides commercial seating. The outdoor seating areas provide the only active ground floor frontages at the plaza. The entrances to the community center are not on the plaza, and the active grocery store across the street is not directly accessible from the plaza. This causes people to cross outside of designated crossing areas in order to go between the two.
There is an untapped potential for inviting more people to enjoy this high quality plaza by improving accessibility, leveraging activity from the community center, and creating more invitations for users of all ages to spend time here.
Weekend peak at 3pm

The Library Plaza is most active around lunch, when people enjoy the afternoon sun, and people-watch from the stairs leading into the library. Because it is located on a busy street, the plaza sees a lot of foot traffic and is a popular spot for markets, panhandling and gatherings.
The atrium leading into the library provides an alternative to the steps, with public benches and ground floor retail venues that offer additional seating. The atrium is also one of the few public spaces that is active in the winter, offering shelter from the elements. Still, overall activity was low, which indicates that more can be done to invite all user groups who visit the library to stop and stay.
The newly redesigned plaza is one of the largest improvements to the pool of Public Spaces Downtown, but has not yet reestablished itself in people’s mental maps of the city
High quality paving and furnishings indicate that significant investment has been made here. However, there is little activity other than people waiting in line to get into the Art Gallery. Being next to Georgia Street is both a challenge and an opportunity. The wide street suffers from high traffic volumes and noise, but the two intersections by the plaza show very high pedestrian volumes. More invitations are needed to invite people to stop and stay everyday.
Activities
66 people staying Summer weekend peak at 10am
110 people staying Winter weekend peak at 8am
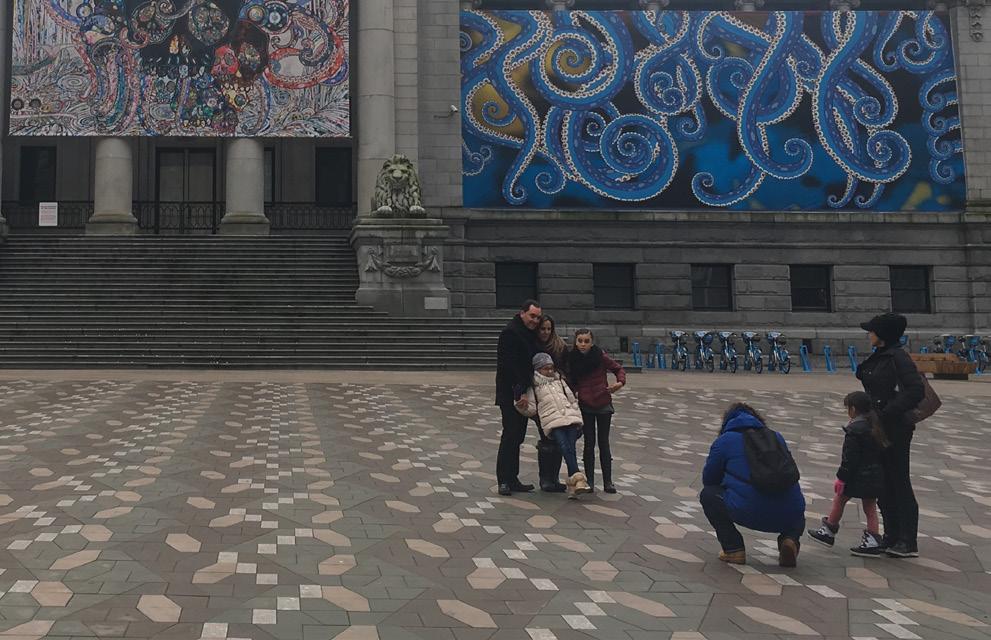


POPS vary in character and accessibility. While some are legible as Public Spaces, many are perceived as private. In general, activity is limited to weekdays during lunch, though a few POPS stand out.
Many POPS are inaccessible because they are detached from the street, either elevated or sunken below grade. More can be done to put the POPS on peoples' mental map and to invite for more Public Life throughout the day.
POPS are the publicly accessible open spaces outside of offices and are typically associated with commercial areas. POPS are sometimes secured through a Community Use agreement, which can allow for arts and cultural events, as well as other activities to be held in these spaces.
POPS are primarily a CBD typology that are not currently represented in the West End
LUNCH SPOT - WEEKEND SPOT!
Weekend peak at 12pm

Located on the waterfront and right by Waterfront Station, Granville 200 functions as a destination, as a space that people move through and as a lunch spot for people that work in the surrounding buildings. People come to enjoy the views over the water, to the natural backdrop of the mountains and the working harbour. The plaza is elevated above street level and 'dead ends', which challenges the perception of safety outside of business hours when there is little activity.
Granville 200 shows high activity at noon but very little activity for the rest of the day, indicating that more can be done to invite people to stop and stay outside of office hours.
Weekend peak at 12pm

Park Place is located along Burrard Street and essentially functions as a generous sidewalk extension. It feels like an inviting public space. It offers a variety of options to sit with public benches situated both near and away from the busy sidewalk. The water feature adds 'white noise' that mitigates traffic noise, and lawns invite people to sit on the grass when weather permits. Located next to a busy bus stop, Park Place contributes to the waiting experience for bus passengers and offers a welcome alternative to the sidewalk bus stop.
Park Place provides strong evidence that under the right conditions, POPS can be just as inviting and accessible as publicly owned and operated spaces.
The Street-Plaza is a newer typology in Downtown Vancouver, similar to MiniParks in scale and layout but characterized by a more playful and urban experience.
Street-Plazas are closed to traffic but allow people walking and cycling through. While some of the Public Space typologies do not cater to everyday life, Street-Plazas show allday activity on both weekdays and weekends. They offer places to stop and stay along the way with public seating that does not require that you 'pay to stay'. These spaces support retail streets that lack public seating, with plenty of places to rest.
Activities
Street-Plazas were initially installed as temporary
Weekend peak at 12pm

Jim Deva Plaza serves both as a meeting place and as an event space. It features events like karaoke nights and reflects the local identity around Davie Village with a whimsical, colourful and playful character. It has active edges including restaurants that offer seating options, next to public seating with both fixed and movable chairs and tables.
This plaza demonstrates that it pays off to include the public in testing ideas before implementation. Furthermore, facilitating community expression in the public realm builds ownership and might invite more people to stop and stay.
Weekend peak at 3pm

The Bute Street Trial Plaza serves as a neighbourhood meeting place and offers a quiet respite off of busy Robson Street. It offers public seating, which is limited on Robson Street. The Trial Plaza pilot project was successful in inviting people to stop and stay, which resulted in strong support for the plaza and Council approving the request to make it permanent.
This pilot demonstrates that there is a demand for Public Spaces near retail streets, offering opportunities for people to stop and stay without having to pay to sit.
Robson 800 Block is bustling with city life. Large numbers of pedestrians flow through the space and many choose to stop and stay.
This street-plaza invites a variety of uses and gets especially crowded on the weekend, when shoppers, people attending public gatherings, and lines of people waiting to get into the Art Gallery coexist in the space.
The space features a variety of seating options including movable tables and chairs as well as attractive steps for people-watching.
Summer weekend peak at 2pm
1,133 ppl staying
Winter weekend peak at 2pm
62 ppl staying


The Downtown station areas serve massive amounts of transit riders daily. However, few passersby choose to stop and stay because there are few invitations to sit, lean, or spend time.
Station areas show a higher percentage of less socially acceptable stationary activities than the other Public Space typologies. This might be related to the programming and layout of the spaces as well as the fact that few people stop and stay. This indicates that station areas are not well-used as public spaces that cater to a broader audience and provide a significant untapped potential.
49% STANDING
Weekday peak at 2pm
55% STANDING
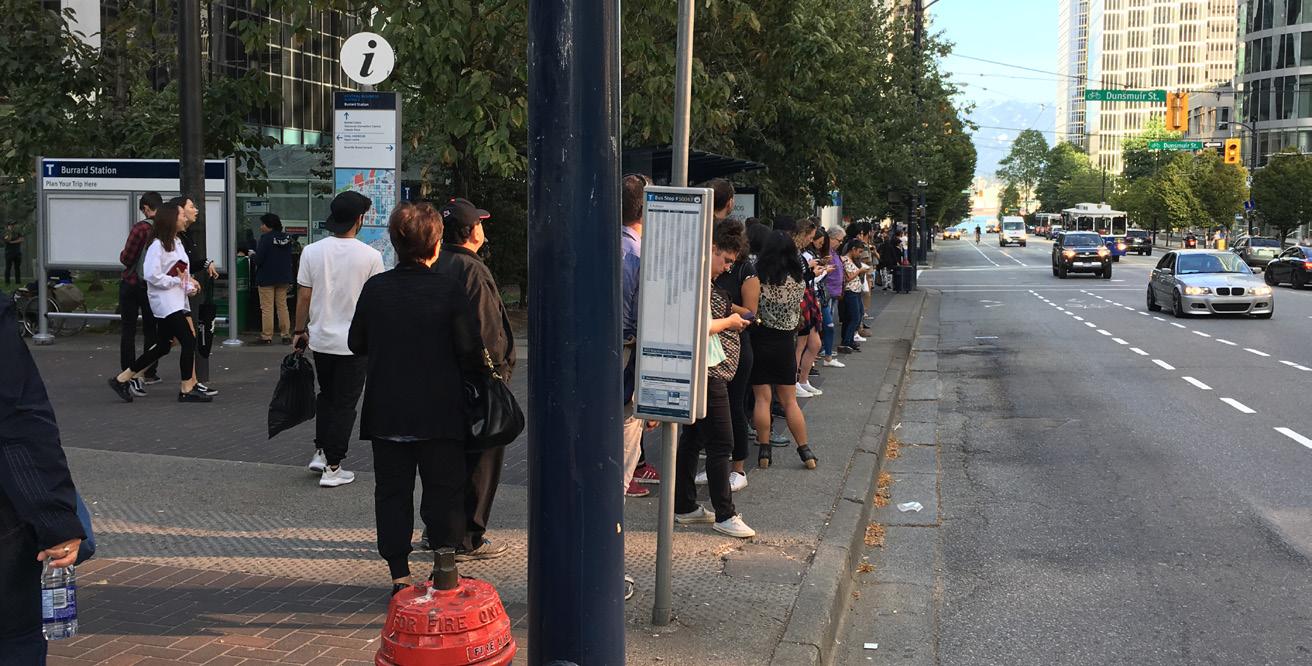
Burrard Station Area, which includes Art Phillips Park, is challenged by its location. It is partially on a traffic island with multiple levels and corners. It is directly connected to the surrounding public spaces and sidewalks only at the main entrance on Burrard Street.
There is limited space by the station entrances. With a lack of seating and no other activities to engage in while waiting between modes, the station area does not offer an inviting experience.
There is an opportunity to do more to enhance the waiting experience for the many transit riders, and to make better use of the space as a potential hub of Public Life.
Weekday peak at 12pm
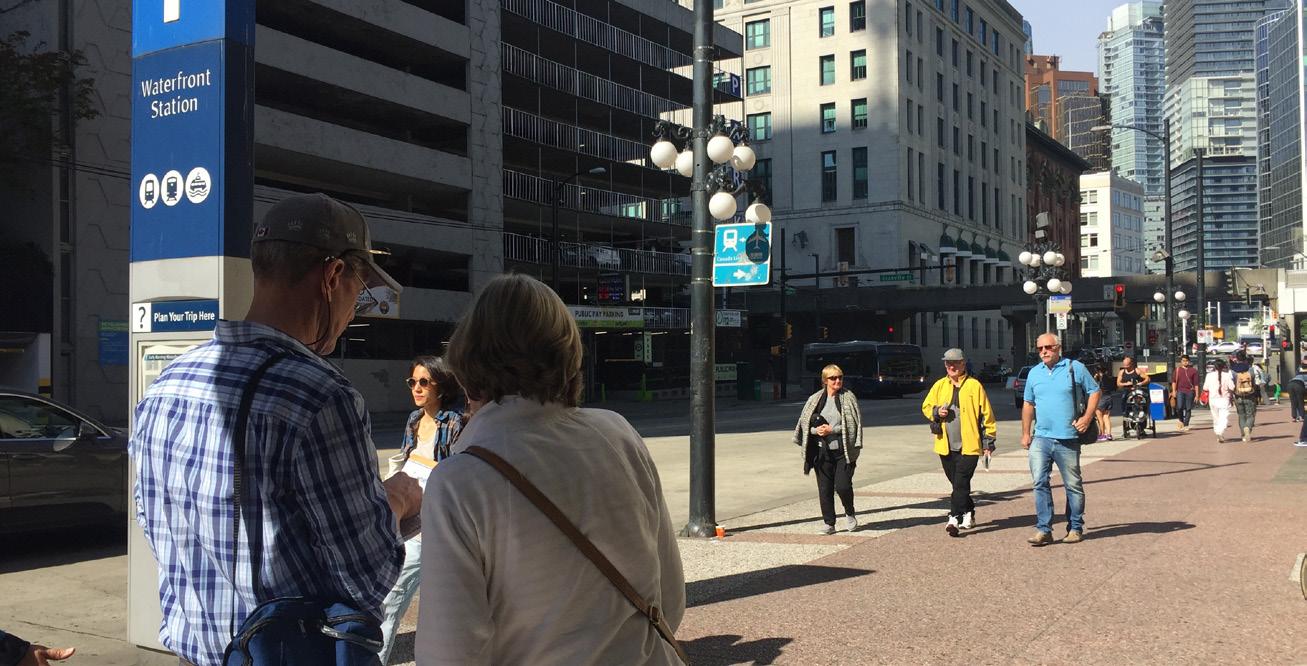
As one of the main gateways to the city, Waterfront Station is a place where many locals and visitors first interface with Downtown. However, it does not uphold its role as a key Public Space. While a lot of people make use of the lunchtime offerings by the station, most people are simply waiting for transit or looking at maps. Lunchtime peaks on weekday stood out with 80% of people staying, using private seating while they ate.
This indicates that the station area does not offer invitations to sit, nor does it offer design cues that indicate the way to the city core, even though Granville Street is right there. The Station area is not perceived as the integral Public Space or the welcome mat to Downtown that it could be.
Mini-parks, a West End typology, serve as local meeting places and convenient neighbourhood short-cuts.
The Mini-Parks were once streets within the public ROW (Right-Of-Way), that are now closed for traffic with cycling allowed, making them a safe space for kids to play. They are predominantly community spaces, and many communities show expressive appriopriation of them by creating interesting environments for people passing through.
Stationary activity is fairly limited, likely because of the location and scale of these spaces and the fact that they mostly serve adjacent residential units.
Weekend peak at 11am

Weekend peak at 2pm

Bute-Street Mini-Park functions as a walkway within the neighbourhood, but few people stop and stay even though it offers public seating and seating edges. Only 1 person for every 42 passing through stop and stay.
This indicates that more can be done to invite adjacent residents and by-passers to stop and stay, but also shows that the mini-parks serve as quality pedestrian short cut in the neighbourhood.
This mini-park has an active retail corner and is in close proximity a schoolyard. There is a variety of seating in sun and shade.
Although more people stop and stay here than in Bute Street MiniPark, higher pedestrian numbers mean that the 'stickiness factor' is limited. Only 1 in 63 stop and stay, though peak hour activity is more higher.
This indicates that active ground floors, with public functions, can invite more people to stop and stay.
Neighbourhood Parks are high quality Public Spaces that invite for a range of uses and users, especially in the summer.
While Neighbourhood parks show a lot of activity in the summer, they show limited activity in the winter, when soft surfaces get wet and there is limited access to covered areas. That said, 'necessary-optional activities' like taking pets to the dog park, occur all yearround.
This indicates that there is a lack of offerings for people to stop and stay in the winter, but there is an opportunity to build on summer success by understanding the needs of users that continue visiting in the winter.
Stationary Activities
Weekend peak at 3pm
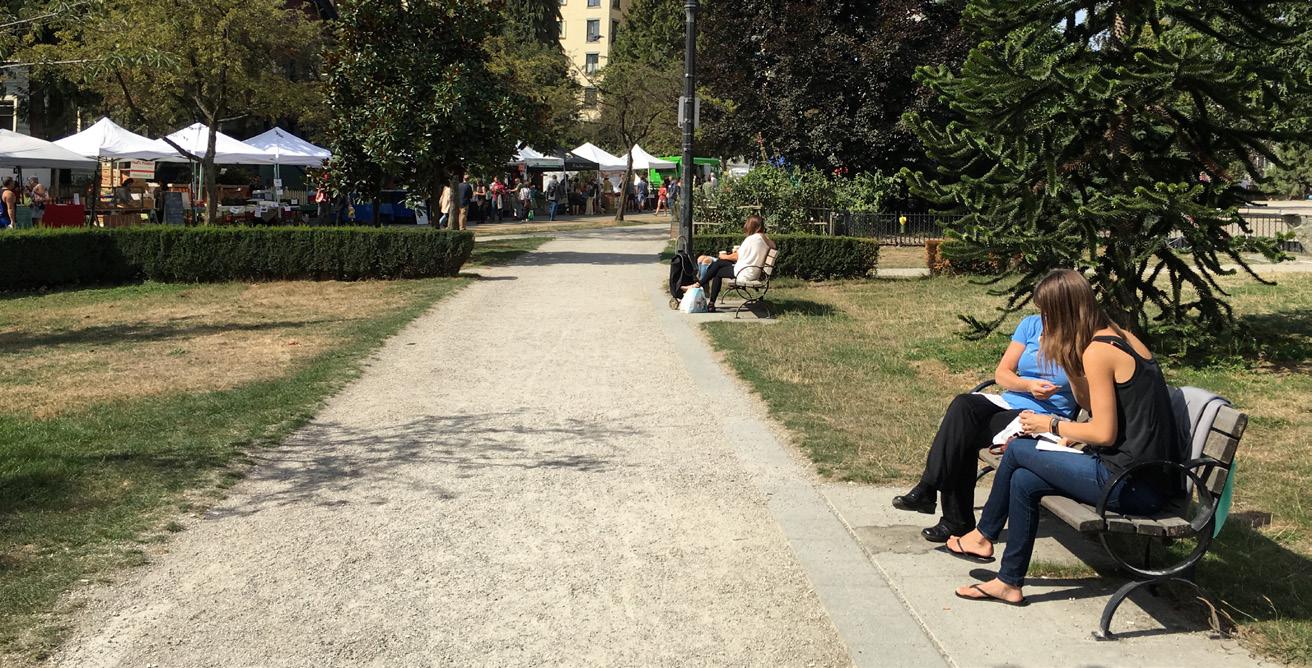
Nelson Park is a community meeting place offering a wide range of things to do in the summer. In the winter, activity is mostly related to the dog park and the play area by the school. A local farmers' market that operates from May to October invites hundreds of people out shopping alongside community gardens, play areas and the dog park. In the summer visitors are invited to lay on the grass or rest on a bench while enjoying their local community.
According to Intercept survey responses, the majority of people visiting Nelson Park come from the surrounding neighbourhood and visit daily or weekly. Income levels represented are either mostly high or lowincome, with little in-between.
Weekend peak at 3pm
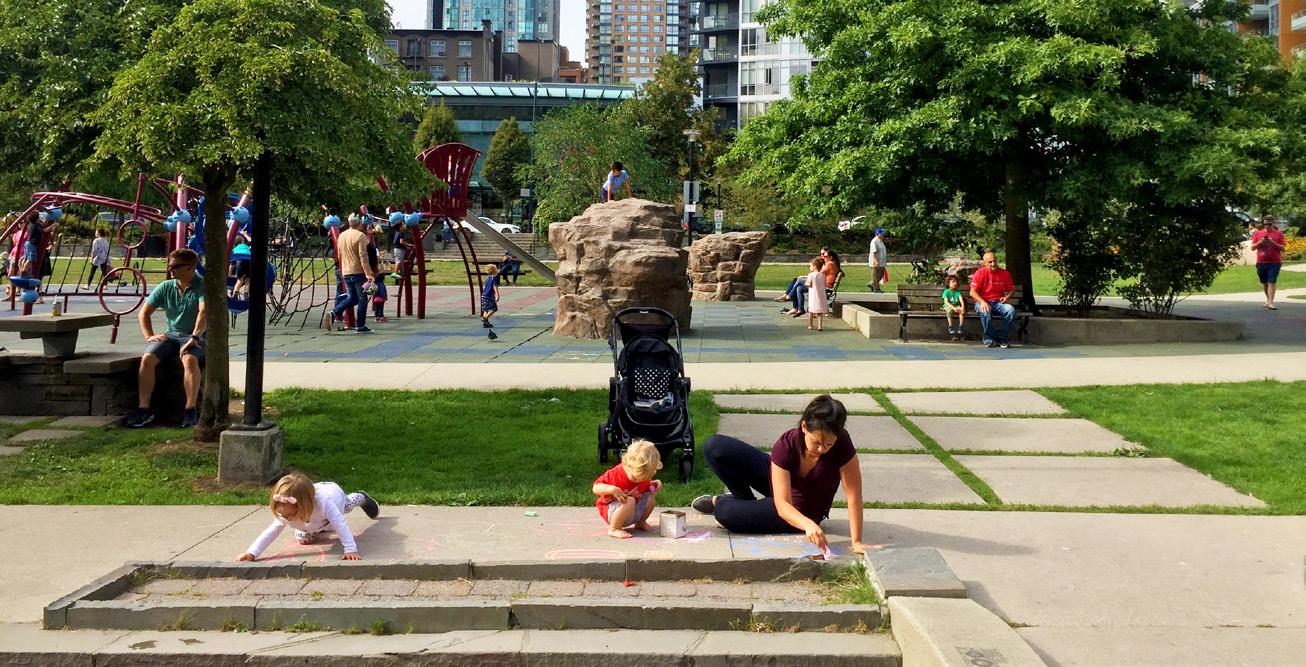
Emery Barnes Park is especially active at the play areas, water fountains, and dog park. Whereas Nelson Park is very much a community meeting place, Emery Barnes Park functions more as a city destination where people come to play and enjoy being outside.
According to Intercept survey responses, the majority of people visiting Emery Barnes Park come from places other than the surrounding neighbourhoods and only visit weekly or monthly. The majority of people visiting reported having a medium-income.
Yaletown Park shows very little activity despite being situated in a densely populated area.
There is little to do in Yaletown Park besides sitting along the edge, which was the main activity observed. People also come to walk their dogs or drink coffee.
The space turns its back to the street, which may challenge peoples' perception of safety in the space. At the same time, it offers a quiet respite from the busy street. Because it is primarily paved, Yaletown Park reads as a plaza more than as a park.
Yaletown Park could serve as a neighbourhood plaza, but it is important to understand what the local community needs.
Stationary Activities
See Appendix for a map of count locations and detailed count profiles.
Summer weekday peak at 4pm
17 people staying
6 people staying Winter weekend peak at 12pm


Cathedral square is one of the smaller public squares in the Downtown, similar in scale to some of the POPS, and has a higher percentage of less socially accepted Public Life.
Today the square has design challenges. It is in deterioating condition and is partially separated from the surrounding urban fabric. There is a significant difference in use between street level and the rest of the square. As one of the few public plazas with a more intimate scale, Cathedral Square has the potential to serve both as a local meeting place for the residents as well as a lunch spot for the many people that work nearby.
Stationary Activities
Summer peak hour is high!!!
60 people staying Summer weekend peak at 12pm
13 people staying Winter weekend peak at 12pm

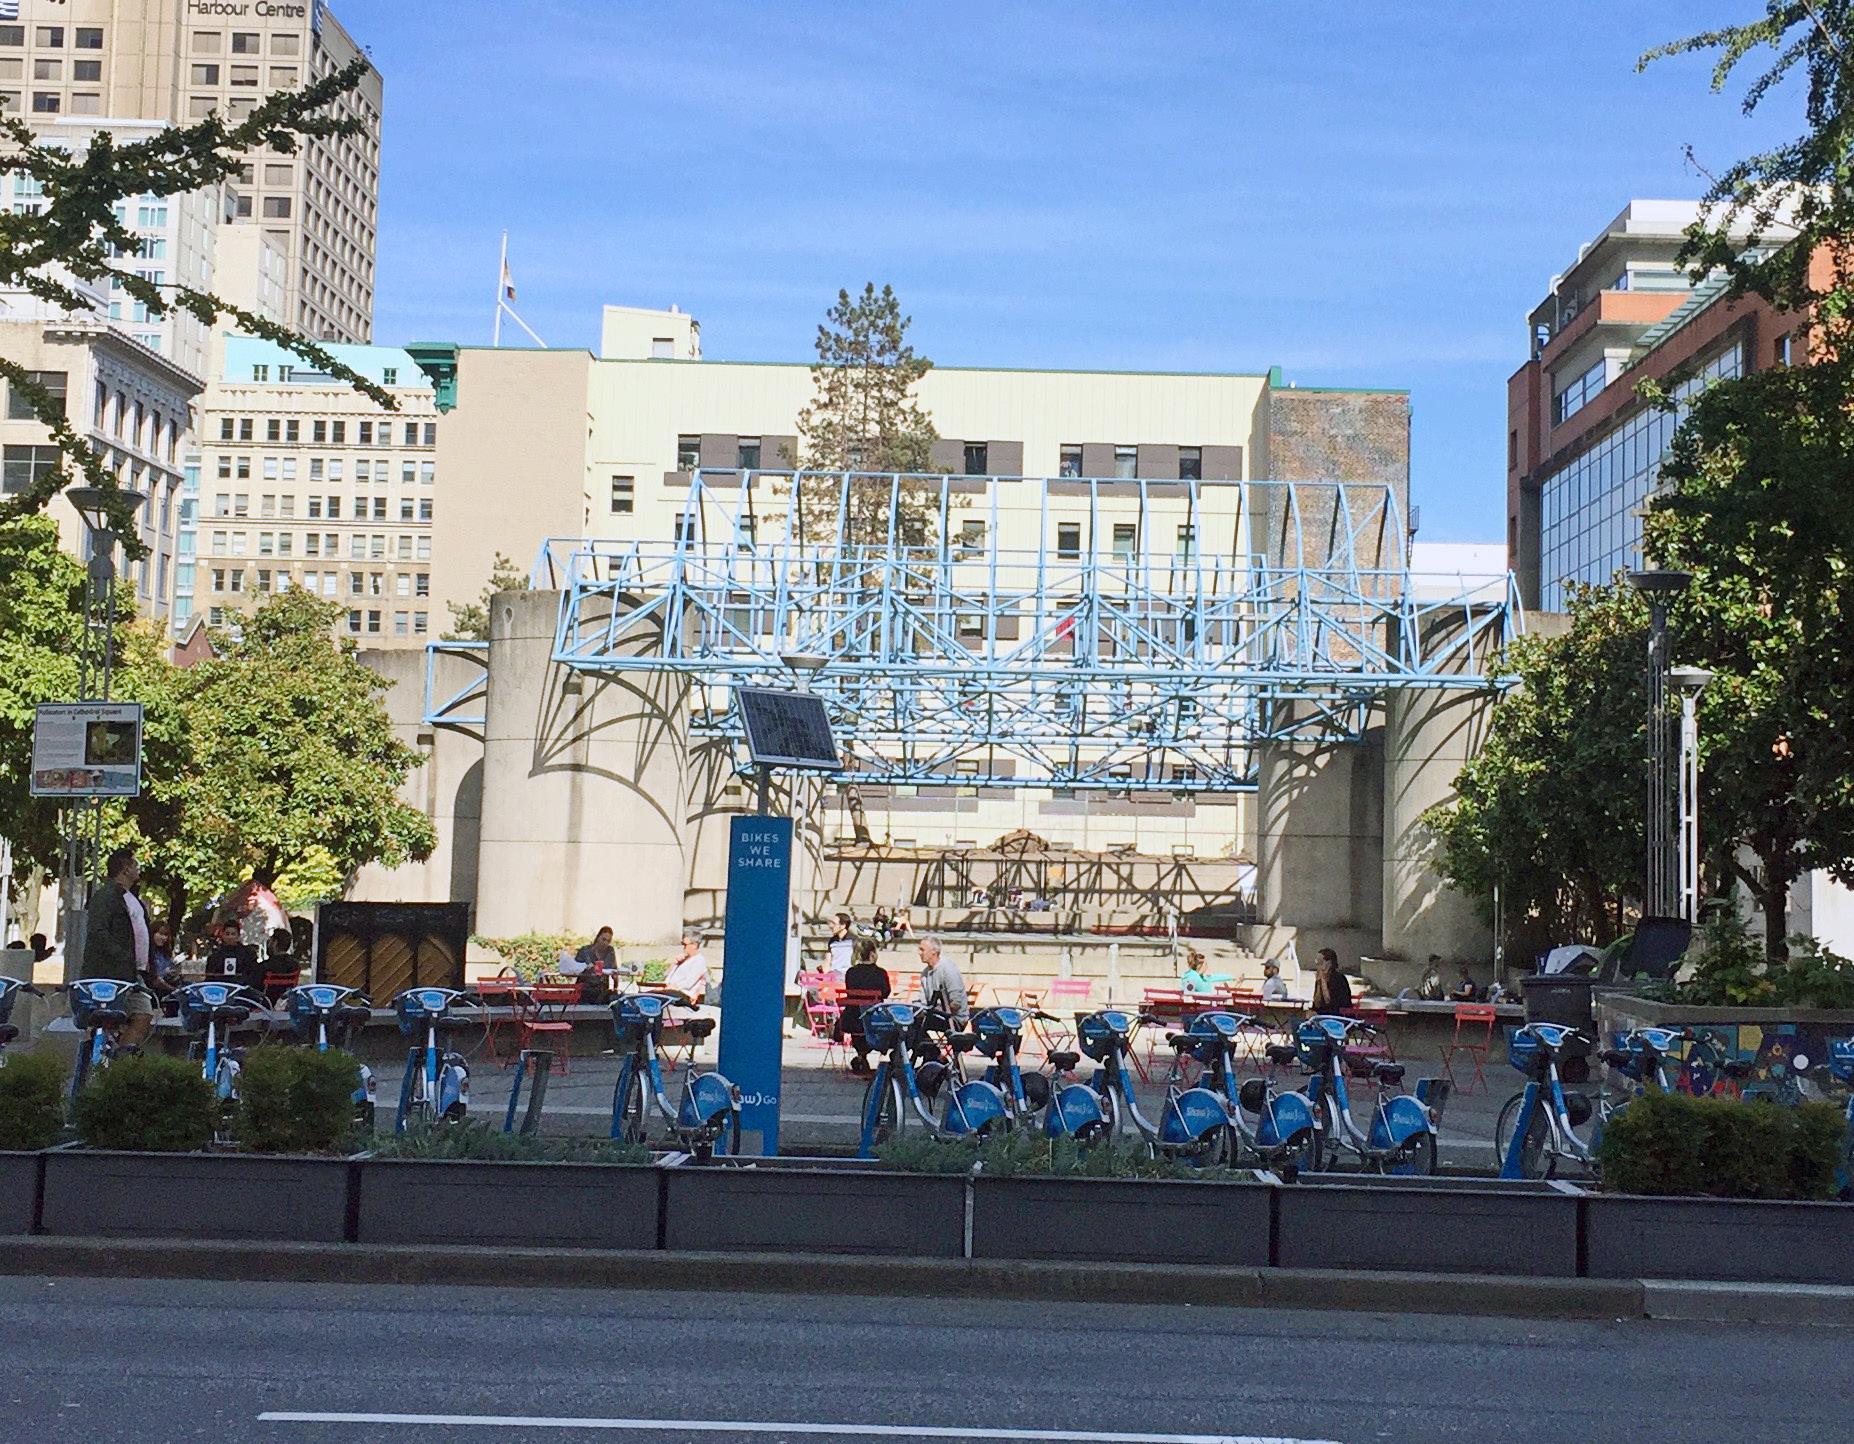


Waterfront parks invite locals and visitors alike to enjoy the beautiful natural setting that surrounds Downtown.
The Seawall, which passes through these parks, is a popular destination for active recreation, with many people out walking, biking and running. It also serves as a popular bike commute route.
In the summer many choose to stop and stay, enjoying the views and making use of the large green spaces for rest, picnics and play. In the winter few people stop and stay, even though the number of people moving through is still high. This indicates that more can be done to invite for winter activities.
Activities
Weekend peak at 3pm
Weekend
at


The majority of the activity in Marinaside Crescent is composed of people sitting at the outdoor cafés. Compared to the size of the space, the stationary peak activity numbers are impressive. 1 in 9 passers-by choose to stop and stay. Marinaside Crescent differs from large parts of The Seawall. It is located by the water, but has an urban setting with active ground floors. The street running through functions more as a shared street, with a safe and comfortable feel.
Harbour Green Park has a fountain for waterplay and varied seating options. Still, the majority of the activity observed is people sitting in commercial seating areas. It is 1/2 as 'sticky' as Marinaside Crescent with 1 in 18 choosing to stop and stay.
English Bay Beach is a local and metropolitan destination. This is one of the busiest public spaces in the summer.
In the summer this location was one of the busiest observed, it was also one of the most 'sticky', with 1 in every 2 people passing by choosing to stop and stay.
In the winter the numbers change dramatically with very few people staying, even though pedestrian numbers only drop by 50%. Only 1 in 14 choose to stop and stay in the winter.
Summer weekday peak at 7pm
688 people staying
Winter weekday peak at 2pm
39 people staying
65% of respondents spend more than an hour (intercept survey)
lawns for picnic in the park


65% of respondents are neighbors while 23% are tourists (intercept survey)
and active recreation
Laneways are important service corridors, but they have a potential to offer more.
There are two types of laneways across the Downtown Peninsula that serve the same program and have a similar feel: the wider West End laneways and the narrower Downtown laneways east of Burrard Street.
Buildings and street fronting functions are served by the laneways. This is where trash is handled, parking is accessed and the majority of deliveries are taken.
Laneways make great neighbourhood shortcuts and have the potential to contribute to the public realm more than they do.
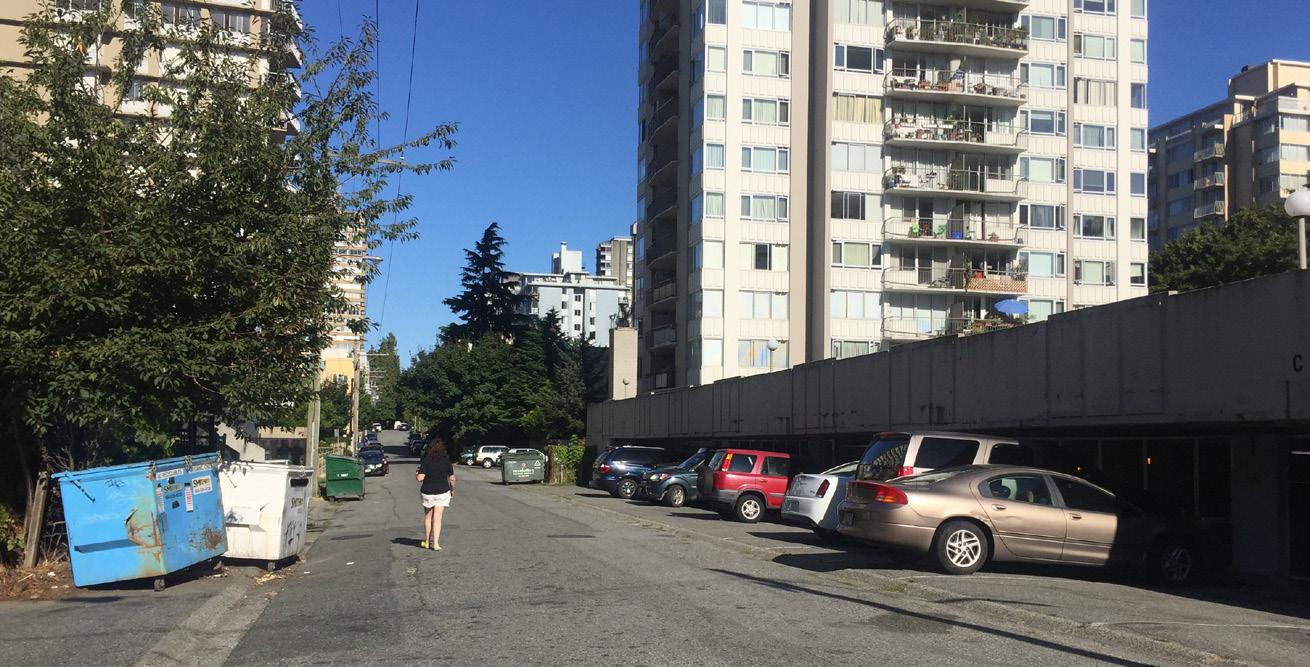

The West End laneways are wide. At first glance they look like streets, which can make it confusing for newcomers to navigate. For residents, they serve as shortcuts and service for the buildings.
In the West End, laneways are orientated east-west and often have setbacks or smaller scale buildings fronting, which allows for more light and sun.
Since 2018 lanes have been named for addressing and fire fighting purposes in response to infill housing on the lanes resulting from the West End Community Plan and Laneways 2.0. Having names also makes them places and this speaks to the lanes being more than just service arteries.
*Distance from property line to property line
The laneways east of Burrard Street are narrow. Because of their width and orientation they are often in shade, which makes them less appealing as places to stop and stay. Still, they serve as important short-cuts in the area.
The laneways in the Downtown are informally named when converted, which adds to their perception as 'non-spaces' even though they can appear to be streets.

Mole Hill laneway (part of recently named Jepson-Young Lane) is both a service corridor and a neighbourhood meeting place. Setbacks have been utilized to support different types of activities, with community gardens, seating, pocket libraries and infill buildings. Traffic calming and street greening contribute to a high quality pedestrian experience.
There are opportunities to make use of underutilized space in the laneways, while still servicing utilities, trash and parking.

This CBD laneway conversion offers a whimsical feature with its playful design. Nevertheless, it is used more as a 'pause on the way' than a place to stop and stay. Seating along the active ground floor invites people into the first part of the laneway, but many are not compelled to explore further. People stop at the corner to take selfies, but few walk its' entire length. Because this laneway still functions as a service corridor and the paint colours are light, the street paint has begun to deteriorate.
There is an appetite for playful features in Downtown, but invitations to walk and opportunities to stop require more than playful paint. Active ground floors and functions that open up to the laneway add to the experience and invite people to spend time in a space.

Alley Oop offers a selfie moment and some colourful fun factor to the CDB, but does not provide active edges or invitations to do more than pause on the way.
Streets serve as the connective tissue of the city and get people from A to B. Streets also account for the majority of the public realm and are a primary scene of public life - there are opportunities for them to do more.
Streets serve different purposes in the city, but the components that create a quality environment for walking, stopping and staying translate across typologies. These public space street typologies capture the perceived character and Public Life role of surveyed streets.
Stationary Activities
See Appendix for a map of count locations and detailed count profiles.
Open space makes up 20-30% of a city, and Streets often account for 80% of that open space (NACTO The Urban Street Design Guide)

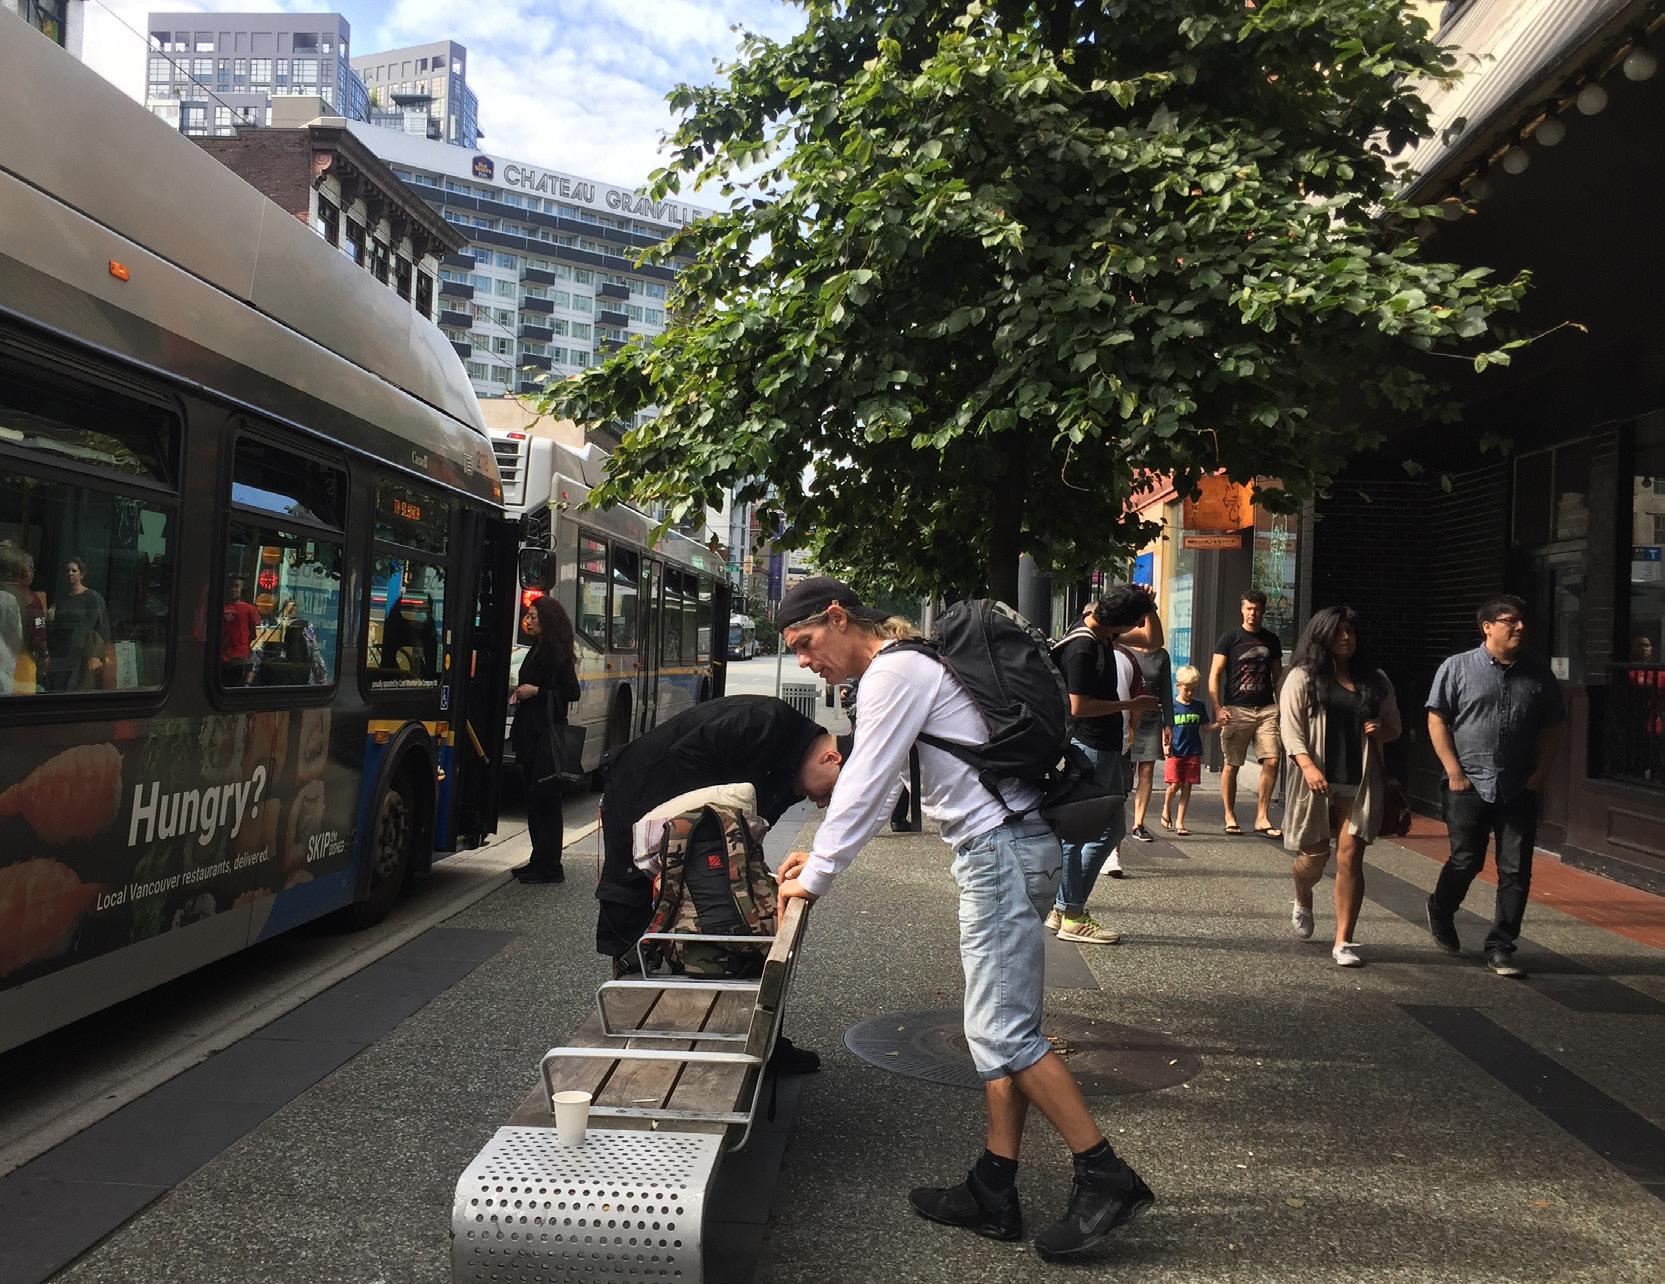


Retail streets are particularly vibrant in Vancouver, especially around the West End villages.
• Small units with many doors
• High transparency
• No vacant or passive units
• Lots of character
• Good articulation, materials and details

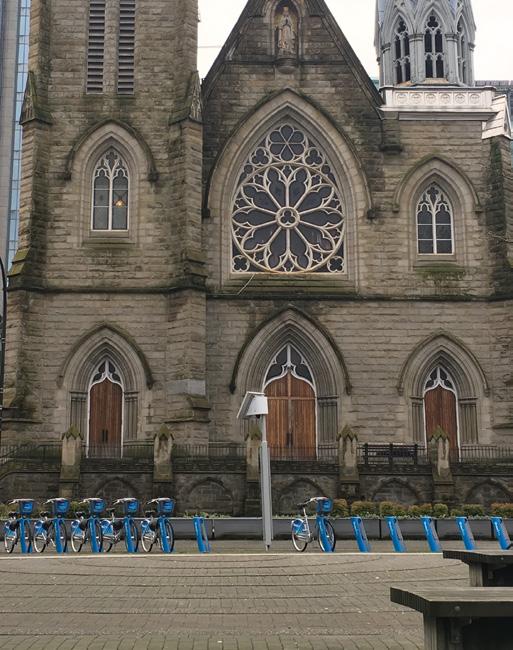
Some retail units are larger, but still open up to the street.
• Relatively small units
• Some transparency
• Few passive units
• Some articulation and detail
Dull facades are usually office buildings, larger residential units and public buildings.
• Large units with few doors
• Low transparency
• Some passive units
• Few or no details
Inactive facades are most often offices and parkades.
Historical buildings stand out from the majority of the buildings built in the last 30 years.
• Parking or vacant lot
• Large units with few doors
• Very little or no transparency
• Many passive units
• Uniform facades with no details or nothing to look at
• A historic or visually interesting facade that may not be very active or transparent, but is visually remarkable
Setbacks come in many types and sizes and are often part of the streetscape. These buffer zones could contribute more to the public realm.
Some serve as stoops and terraces for residents, creating a buffer between public and private realms, while others seem like they are part of the public realm but don't invite use.
Residential setbacks can have ground floors that are both vibrant and active, and add character to the public space. Many entrances, detailing, stoops and planting can add to the street-life experience.
Commercial setbacks are often underutilized, but are experienced as part of the public realm. They often have untapped potential that could be utilized to create more opportunities to stop and stay.
Larger corporate setbacks are mostly uninviting, but could play a role in making sure that there is accessible public space for all.
Residents and building owners treat the semi-private buffer zone in different ways. Some are active toward the street and show signs of life and ownership that add to the walking experience. Others close off towards the street, even if there are stoops, making for a dull experience .

who is this for?

Setbacks are an untapped potential, restricted by ownership, but oftentimes experiences as part of the Public Space part of the public realm


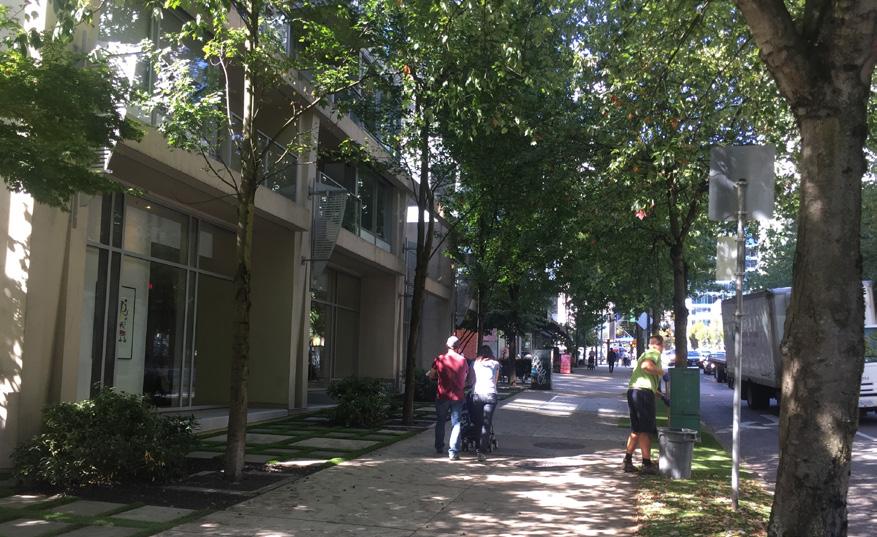

Fully part of the public realm, but governed by building owner, and offer no invitations to stop and stay.
Corporate and residental large setbacks - publicly accessible but with limited use, not inviting residents nor the public to use it = untapped potential!
Streets Downtown today offer few places to rest that are not 'pay to stay', even though they generally have wide sidewalks, high quality paving, and street trees.
Not all people can afford to 'pay to stay', meaning that the public realm does not serve all residents if this is the only option. In order to be equitable, streets need to offer public benches and a range of seating options for everyone.
There are opportunities within the sidewalk space to offer more varied opportunities to stop and stay, by making use of what is already there.
Seating and Street Trees
67% of the seating on the surveyed streets Downtown is cafe seating or 'pay to stay'
1/3 of the seating on the surveyed streets Downtown is public
Informal Seating, such as stairs and movable chairs allowing people to enjoy the positive aspects of climate are popular
*Body position average on a weekday
In the winter, 75% * of people are standing!
Public seating is well used when available


During the winter, the vast majority of people are standing. This is likely because surfaces are wet and indicates a need for seating that is protected from the elements.
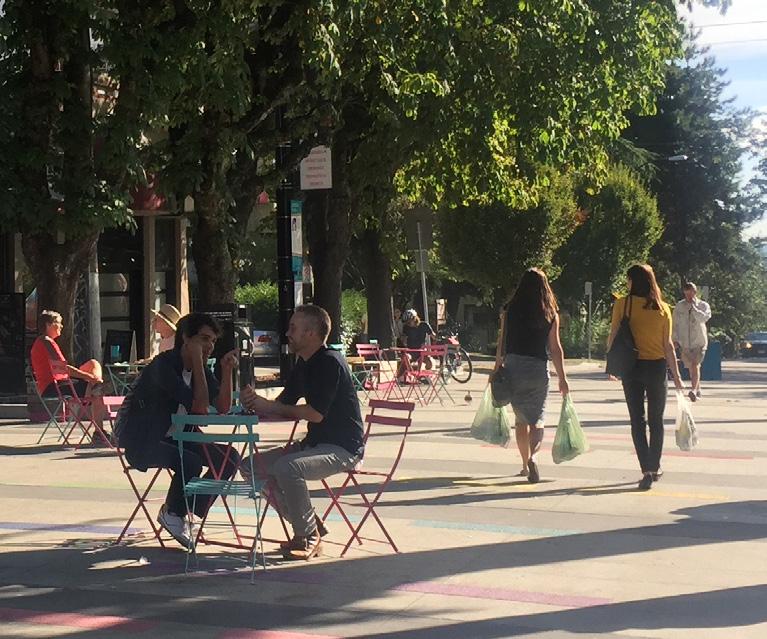


The road space along the curb is used in different ways across Downtown, and is being used for more than just traffic and parked cars.
In some cases, the space is used by bike lanes, people waiting for transit or Parklets that replace parking spots to provide additional seating. Still, these alternative uses have not been applied broadly. There is a need and opportunity for considering the use of this zone in a more varied and flexible way, using high quality design and adaptive use to support biking, transportation, and stationary activities.
See Appendix for a map of count locations and detailed count profiles
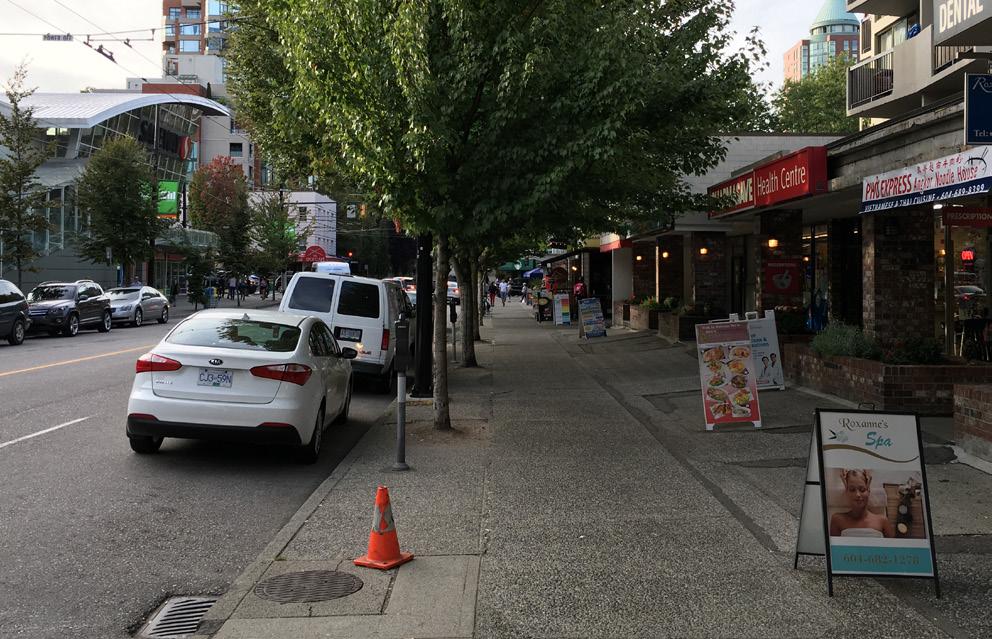


that replace a couple of parking spots, such as this one on
St show that there is a need for public seating on the streets

Many intersections are heavily used. Large amounts of people stack up on the corners and wait to cross the street in a limited amount of space.
In the winter umbrellas add to this challenge as each person then takes up more space.
In general, intersection treatments are very high quality and are focused on pedestrian safety and comfort. Waiting times are short and corner radii have been minimized. But large and growing pedestrian numbers, especially in the CBD and along retail streets, are challenging intersection capacity. In many intersections people waiting to cross take up the whole sidewalk and are forced to stand very close to moving traffic.
There is a need to consider alternative intersection treatments in high pedestrian activity areas.
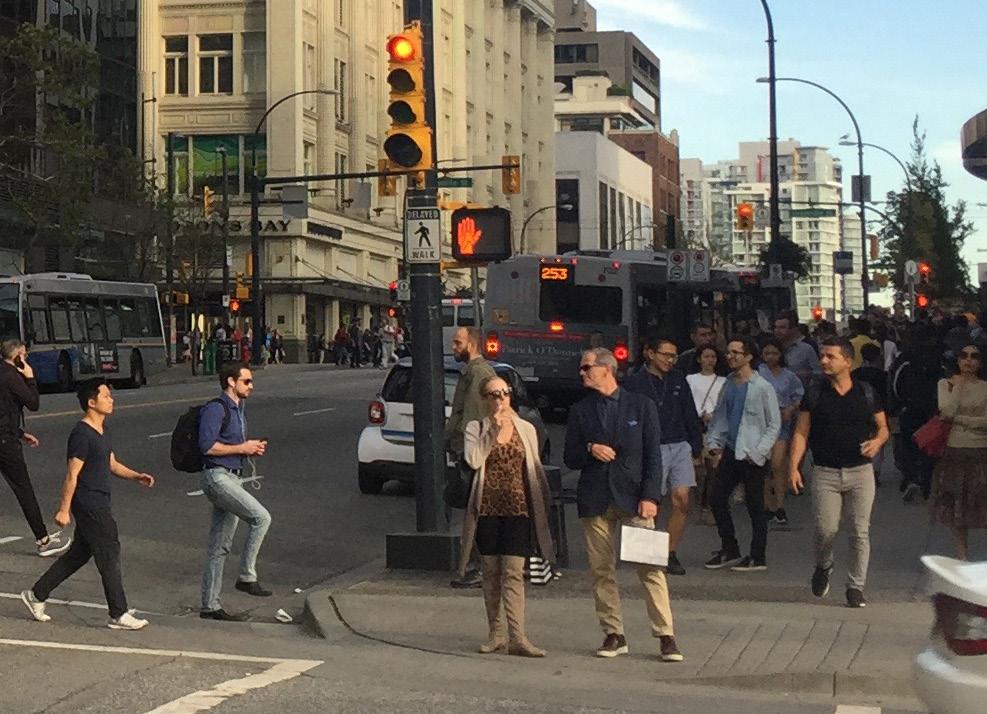

Intersection street corners are challenged by large amounts of pedestrians


Intersection treatment is overall of very high quality, with narrow vehicular turning radii and curb ramps inviting everybody to walk. But when it rains, some corners get standing water which challenges the walking experience.
This part of Robson Street is very active, with high volumes of people walking. Even though sidewalks are generous, there are challenges with the capacity, especially on the weekend. The majority of the retail is mainstream and less specialty stores.
Vancouver Pedestrian Autumn 2017 Weekday 14 September
Robson St & Bute St
1641
On the western part of West End, Robson Street offers shops and eateries that are of a more local character. The sidewalk capacity exceeds comfort all afternoon and evening. Oftentimes, the throughzone is narrow, as the sidewalk also serves as location for display of goods and outdoor serving.
Pedestrian Autumn 2017

A comfortable sidewalk capacity is 13 people per metre of unobstructed sidewalk per minute.*
* Upper limit for an acceptable density in streets and on sidwalks with 2-way pedestrian trafficJan Gehl, Life Between Buildings (2011),134.
All graphs show summer averages. See Appendix count locations and detailed count profiles.
As a transit mall, there are naturally a lot of busses on this corridor. But at the same time, Granville is one of the busiest walking streets in Downtown. Other than transit stops, there are few invitations to stop and stay. In the evening, the sidewalk capacity is further challenged with lines of people waiting to get into venues.
On this part of the street, pedestrian numbers are slightly lower and the sidewalk capacity is challenged on weekend evenings when this is a nightlife destination. The sidewalk is obstructed with a maze of bollards and parked cars. While outdoor serving adds character and life to the street, the lack of space does challenge the walking experience.
Vancouver Pedestrian Autumn 2017 Weekday 14 September
Overall, the through-zone for pedestrians is challenged on this part of Davie Street where many people come to enjoy eateries, venues and shops. The street offers few places to sit and rest, other than bus stops and the outdoor serving areas.
Vancouver Pedestrian Autumn 2017
Weekday 14 September
11B Davie St & Bute St
The sidewalks on Denman offer a comfortable walking experience, with a mostly unobstructed sidewalk where capacity rarely is exceeded although sometimes challenged by fast moving traffic. The street is 'stickier' than most surveyed, but besides bus stops and the outdoor serving areas, the street offers few places to sit and rest.
Vancouver Pedestrian Autumn 2017
Weekday 14
With large setbacks and few active ground floors or buildings that meet the street, this part of Georgia Street sees fewer people out walking. The street is wide and dominated by traffic, which affects the scale and noise quality of the street.
Vancouver Pedestrian Autumn 2017 Weekday 14 September
5BC Georgia St & Cardero St Hourly average: 277
Note: No stationary data for these locations
2,377 Comfortable Capacity
Vancouver Pedestrian Autumn 2017 Weekday 14 September
Georgia St & Burrard St Hourly average: 1347
Outside of events, Georgia divides the city core from the Seawall. The intersections crowd with people walking and waiting to cross. In general, more people walk to get across than to walk along Georgia. The street has a number of transit stops. Unit sizes are mixed, with some active ground floors.
2,853 Comfortable Capacity
This part of Burrard sees a fair amount of people walking, with activity related to shopping, to the Skytrain station and to the many busses that run on the street. The number of people walking oftentimes exceeds the sidewalk capacity. This part of Burrard offers nonprotected cycling infrastructure.
Vancouver Pedestrian Autumn 2017 Weekday 14 September
& Comox St
The southern part of Burrard Street has fewer shops and public functions, and thus sees less pedestrian activity. The newly implemented protected bike lanes leading to Burrard bridge offers a safe ride for people on bikes as well as serves to provide an additional buffer for pedestrians from fast moving vehicular traffic, making for a much more pleasant walking experience.
Richards Street is a beautiful tree-lined neighborhood street off of the bustling retail corridors. It offers a different walking experience and invites a lot of people walking their dogs. With generous sidewalks, sheltered on one side from vehicular traffic by the protected bike lane, Richards has the capacity to invite for more walking and staying.
Note: No stationary data for this location
Alberni has the sidewalk capacity to invite more people walking and staying. It is part high end retail in the CBD and part residential street, as well as the location of some of the less accessible POPS.
Vancouver Pedestrian Autumn 2017
Weekday 14 September
37B Mainland St & Helmcken St
Hourly average: 790
Unlike Alberni Street, Mainland Street is very sticky! On both weekdays and weekends, people flock to this segment of the street to wine and dine. The street has uniquely designed lighting fixtures, adding identity and sense of place. However, parked cars take up a large area of the street, while space for walking is limited and oftentimes exceeds capacity, especially on the incredibly narrow and obstructed east sidewalk.
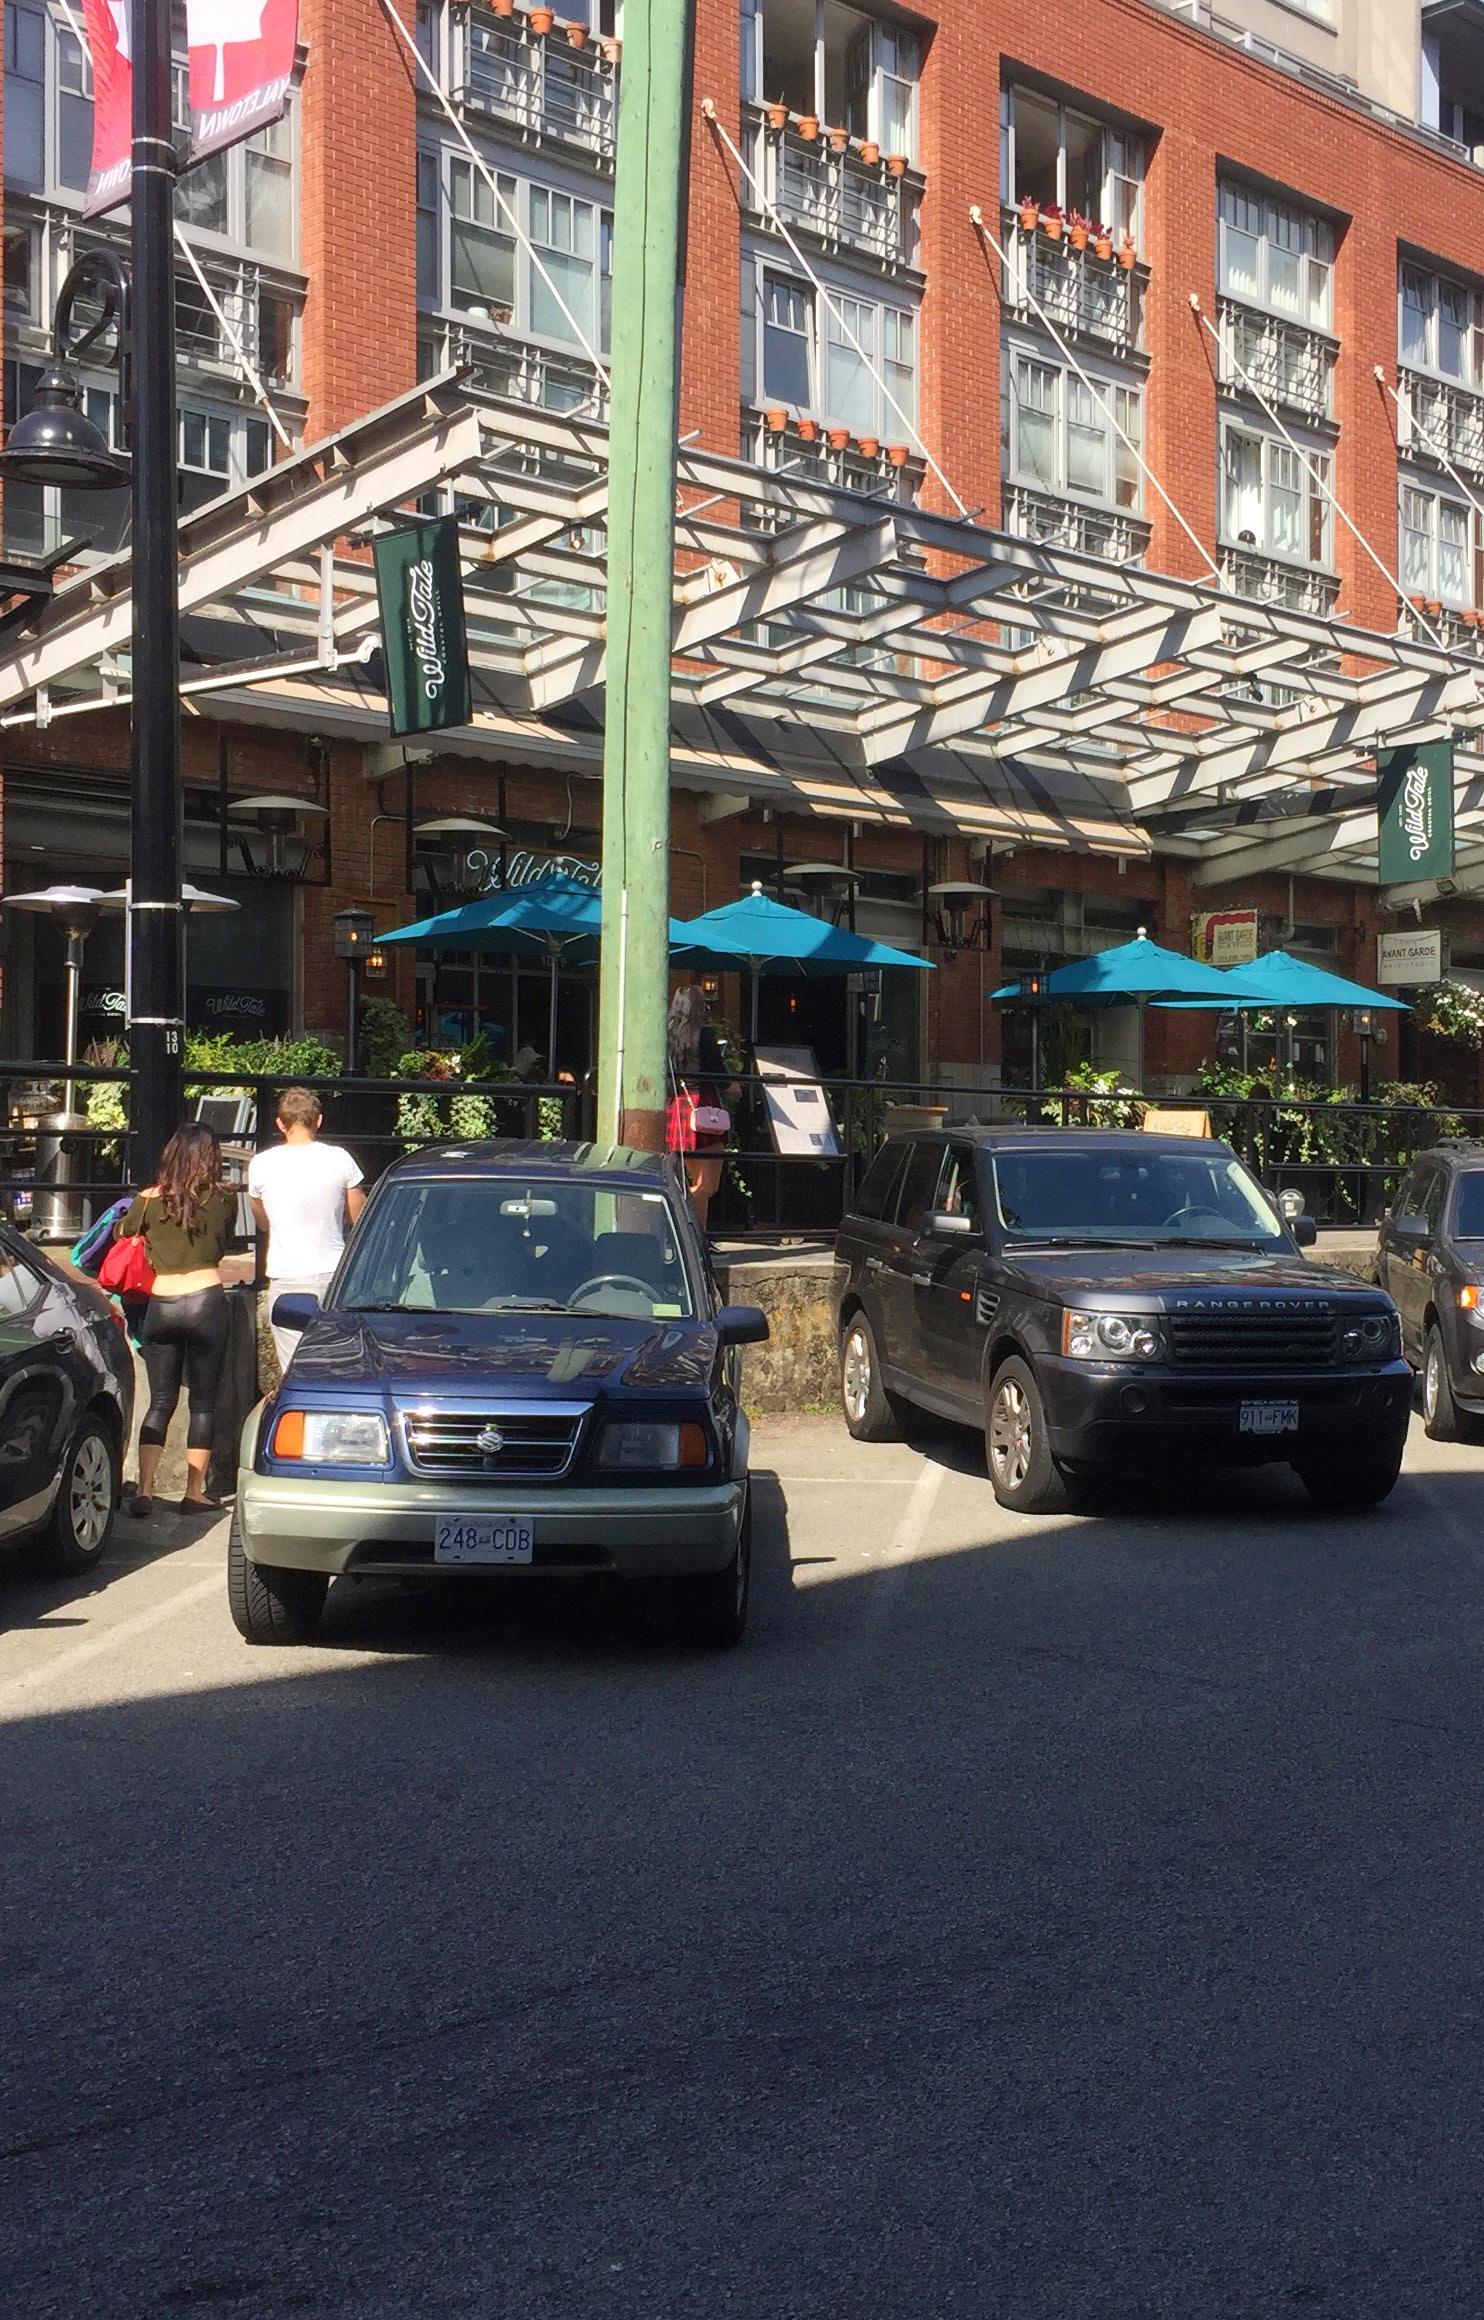
Vancouver Pedestrian Autumn 2017 Weekday 14 September
Bute St & Davie St Hourly average: 423
Bute St is a beautiful green neighborhood connector that is home to both mini-parks and street plazas. Other than at key nodes, it does not stand out from the adjacent neighborhood streets, and is just as dark in the evening.
Note: No stationary data for these locations
Comox is a beautiful green street that is home to mini-parks and serves as a neighborhood connector. The nodes and the marked bike infrastructure distinguish Comox from adjacent neighborhood streets.
